
Abstract
Qualitative comparative analysis (QCA) is a potentially interesting method for spatial planning researchers. Although increasingly used, its application in spatial planning research is lagging behind other disciplines. We conducted a systematic literature review of QCA applications in spatial planning and related disciplines (SPARD), addressing two questions: when, where, and how is QCA used in SPARD and what are the main advantages of QCA for spatial planning research? We found that the main reasons why QCA is used in SPARD are its sensitivity to context, its ability to use small-/medium-n cases, and its attention to causal complexity.
Keywords
Introduction
Qualitative comparative analysis (QCA) is becoming increasingly popular in spatial planning research. However, compared to other disciplines (cf. Rihoux, Rezsöhazy, and Bol 2011; Rihoux et al. 2013; Seny Kan et al. 2016), its use in spatial planning is limited. With this article, we aim to further introduce QCA to the discipline, and by doing that, also support recent calls for more comparative work in planning research (e.g., Markusen and Gadwa 2010). We do this by means of a systematic literature review of QCA applications in spatial planning and related disciplines (SPARD). We consider the discipline of spatial planning broadly, focusing on the subject fields (as delineated in Scopus) of geography, planning, transportation, and urban studies.
QCA is a potentially interesting method for spatial planning researchers because it may be able to rise to a major challenge spatial planning researchers are faced with. A central feature of spatial planning research is the emphasis on the sharing and application of knowledge produced (Silva et al. 2015). Sharing and applying knowledge implies that knowledge is transferred from case to case and from research to practice. In fact, key spatial planning scholars (Alexander 2005, 210; Friedmann 1987) argue that “the translation of ideas into action” and providing input for policy change and institutional–spatial design in order to guide spatial and social developments, is what defines spatial planning (Alexander 2016). In one way or another, this translation and transferal always involves comparison, either between cases or with a framework built on known examples and previously researched cases (Booth 2015). As such, learning from other cases and “the desire to make comparisons have been fundamental to research activity in the field of spatial planning” (Booth 2015, 84).
The transfer of knowledge, however, is challenged by the fact that the issues and topics spatial planning research deals with are strongly embedded in their sociospatial context. As Nadin and Stead (2008) argue, “the planning system is in part an expression of some fundamental values in a society in relation, for example, to the legitimate scope and aspirations of government, the use of land, and the rights of citizens” (pp. 43–44). Spatial planning practices are thus shaped in a specific political–institutional environment and in interaction with specific (local) social and spatial conditions (Silva et al. 2015). Consequently, “the conditions that make a policy or practice work in one place are unlikely to obtain in another” (Booth 2015, 94). This makes it challenging, for example, to draw lessons from one (national) planning system or practice to the other (Janssen-Jansen, Spaans, and Van der Veen 2008). Given this challenge, it is thus imperative for cross-case learning and knowledge transfer that spatial planning research identifies the most important conditions that give rise to an outcome of interest across cases. QCA is a method potentially very suitable for this task (Gerrits and Verweij 2018).
At the same time, QCA is no panacea. It has been critiqued, inter alia, for imposing dichotomization on qualitative data, sensitivity of the case comparison results to single cases, for not being able to trace the mechanisms or processes that truly explain outcomes, and for lacking a temporal dimension as QCA utilizes cross-sectional data and analysis techniques (De Meur, Rihoux, and Yamasaki 2009; Jordan et al. 2011). This can be considered problematic because many spatial planning phenomena are understood to be too complex to dichotomize, too unique to be meaningfully compared, therefore requiring in-depth examination of each individual mechanism and process, and to be subject to uncertainty, change, and dynamics (e.g., De Roo and Silva 2010; Teisman, Van Buuren, and Gerrits 2009). Therefore, although we contend that QCA holds a significant potential for spatial planning researchers regarding cross-case learning and knowledge transfer, researchers wishing to apply the method are advised to be aware that the method is not fit for all purposes and to consult publications discussing the limitations of QCA in more detail. This article focuses on the main properties of the method, highlights the ways it can be used, and examines the main reasons why it is interesting for spatial planning researchers.
In the second section, we introduce the background and main characteristics of QCA in a nutshell. For full-fledged introductions and guidelines, we refer the reader to the QCA literature that has accumulated over the years (see www.compasss.org for an overview) including books about the method (e.g., Gerrits and Verweij 2018; Ragin 2008b, 2000, 1987; Rihoux and Ragin 2009; Schneider and Wagemann 2012). The third section addresses the methodological approach of our systematic literature review. The fourth section addresses the first research question: when, where, and how was QCA used in SPARD? As such, this article introduces and discusses the various ways in which the method is and can be used in spatial planning research. The fifth section addresses the second research question: what are the main advantages of QCA for spatial planning research? As such, it highlights the main reasons why QCA is interesting for spatial planning researchers. Concluding remarks are made in the final section.
Background of QCA
The American sociologist Charles Ragin (1987) introduced QCA some thirty years ago, as a third way in-between case-oriented qualitative research strategies and variable-oriented quantitative research strategies (Rihoux 2013). Ragin (1987) explains that the advantage of case-oriented strategies is that they allow the researcher to highlight “complexity, diversity, and uniqueness” and that they provide “a powerful basis for interpreting cases historically” (p. xiii). Qualitative researchers make causal inferences by investigating mechanisms through process tracing and within-case analysis (Goertz and Mahoney 2010). This normally involves single-n or small-n research, often for very practical reasons of time and resource constraints. Variable-oriented strategies, Ragin (1987) explains, are on the contrary often ideal instruments for “producing broad statements pertaining to relatively large bodies of data encompassing diverse cases” (p. xiii). Quantitative researchers often rely on statistical methods with large-n experimental or observational data to uncover mechanisms and make causal inferences (Goertz and Mahoney 2010). QCA is an approach and a set of techniques (see Rihoux and Lobe 2009), in which features of the case-oriented and variable-oriented strategies are combined.
A first central feature of QCA as an approach is its focus on configurations. QCA can be applied as a mainly case-oriented approach—where the focus is on the confrontation of in-depth contextual case knowledge with the identified cross-case patterns (observed mainly in small-/medium-n applications)—or mainly as a condition-oriented approach—where the focus is on the cross-case patterns in terms of sets of conditions (Thomann and Maggetti 2017). An example of the case-oriented approach can be found in Busscher et al. (2017), who analyzed the Dutch spatial planning program “Room for the River” and identified management patterns across twenty-three water projects, which were interpreted and further explored in specific projects that were represented by the patterns. QCA as a condition-oriented approach is found especially in large-n applications. For instance, An et al. (2017) analyzed 126 urban infrastructure projects in India, focusing on the set-theoretic relations between various capacity factors and cost overrun/underrun. Regardless of the differences in focus (cases or conditions), however, recent discussions have highlighted that QCA applications are always configuration oriented (Blatter and Haverland 2012; Gerrits and Verweij 2018; Rihoux 2013). In QCA, cases are conceived as configurations and the analysis is geared toward finding configurational patterns across cases.
A second central feature of QCA as an approach is its general focus on explanation (cf. Thomann and Maggetti 2017). In contrast to variable-oriented research strategies, which typically focus on identifying the “effects-of-causes” and which rely predominantly on quantitative methods such as regression analysis, QCA instead focuses on identifying the “causes-of-effects” (Goertz and Mahoney 2012; Vis 2012). This focus is typical for qualitative research methods in general (Goertz and Mahoney 2012). With QCA, the researcher often strives to explain how a certain outcome of interest was produced. Commonplace questions include for example: “Is condition X necessary or sufficient for outcome Y,” “Which configurations produce outcome Y,” and “What groups of cases share a given combination of conditions” (Legewie 2013). Basically, a condition is necessary when the occurrence of the outcome cannot be explained without that condition (“whenever we observe the outcome Y, we also observe the condition X”); a condition or configuration is sufficient when it can explain the outcome by itself (“whenever we observe X, we also observe Y”). (See Schneider and Wagemann 2012). These relationships between conditions on the one hand and an outcome on the other hand in terms of necessity and sufficiency are examples of typical set relations (Schneider and Wagemann 2012). QCA’s focus on the causes-of-effects in terms of necessity and sufficiency makes it a relevant method for spatial planning research, where it is imperative for cross-case learning and knowledge transfer to identify the most important (combinations of) conditions that give rise to an outcome of interest.
A third central feature of QCA as an approach is its underlying assumption of complex causality in terms of conjunctural causation, equifinality, and asymmetry (Schneider and Wagemann 2012). A priori, the method assumes that outcomes are produced not by net effects but by conditions that combine together in configurations (i.e., conjunctural causation) and that there are multiple non-exclusive configurations that may produce a similar outcome (i.e., equifinality). For instance, Chatterley, Linden, and Javernick-Will (2013) studied fifteen schools in Belize that each were understood as combinations of six conditions and the analysis found five configurations across the fifteen schools that all explained the well-maintained sanitation infrastructure in the schools. The different configurations “provide[d] alternative solutions depending on local context and program capacities” for policy makers and program managers (Chatterley, Linden, and Javernick-Will 2013, 419). Asymmetry means that when a certain condition or configuration X was found to explain the outcome Y, then the negation of the condition or configuration (i.e., ∼X) cannot be assumed to explain the negation of the outcome (i.e., ∼Y). (i.e., asymmetric causality). The outcomes Y and ∼Y may require different explanations and therefore have to be analyzed separately. An et al. (2017), for instance, conducted separate analyses for cost overrun and cost underrun in infrastructure projects and found different configurations of capacity factors that led to the outcomes.
A fourth feature of QCA as an approach is its systematic and formalized approach to cross-case comparison. Assuming causal complexity a priori, the systematic comparison of cases will identify those conditions or configurations that are necessary and/or sufficient for explaining the outcome of interest. This is where QCA as a set of techniques enters the scene.
The systematic comparison first requires that the case material is calibrated. Calibration involves the quantification of the case material. 1 Three main techniques can be distinguished (Rihoux and Lobe 2009; see Types, Objectives, and Disciplines subsection for some examples). In the original crisp-set version of QCA (Ragin 1987), the conditions and the outcome are operationalized in a binary fashion and the cases receive a score of either {0} or {1} on the conditions and the outcome. In fuzzy-set QCA that was introduced later (Ragin 2000, 2008b), the cases can receive finer-grained scores ranging from 0.0 ≤ x ≤ 1.0. 2 In the technique of multi-value QCA (Cronqvist 2004), cases can receive multinomial values on the conditions, for example, {0}, {1}, {2}, and {3}. The calibration results in a calibrated data matrix, which forms the input for the formal comparison in QCA.
The comparative process in QCA then consists of three main steps (Gerrits and Verweij 2018). In the first step, the calibrated data matrix is transformed into a truth table. In the truth table, the cases are sorted across the logically possible configurations of conditions. The number of logically possible configurations (and therefore the length of the truth table) is determined by 2 k , where k represents the number of conditions (e.g., with three conditions there are 23 = 8 logically possible configurations). 3 Once the truth table is constructed, each case is assigned to the truth table row (i.e., the logically possible configuration) that it represents. Each truth table row is then assigned an outcome score of either {0} or {1}, based on the cases that cover the truth table row. That is, a truth table row basically is a postulated relationship of sufficiency; when the empirical data (i.e., the cases) are fully or largely consistent with the statement that the truth table row is sufficient for the outcome Y, then that row is assigned a positive {1} score (Schneider and Wagemann 2012). A score of {0} expresses that the data are inconsistent with the statement of sufficiency that the truth table row expresses. The second step is the minimization of the truth table. This is done through the pairwise comparison of truth table rows that are considered to agree on the outcome and differ in their score of only one of the conditions (Ragin 1987). The condition in which two configurations differ is “minimized away,” resulting in a simpler expression. For instance, if configurations ∼A * B * C and A * B * C, based on the cases by which they are covered, both produce the outcome Y (which is noted in QCA as the expression: ∼A * B * C + A * B * C → Y), then condition A can be removed from the expression, yielding the simpler expression: B * C → Y. The pairwise comparison is repeated for all configurations agreeing on the outcome and which differ in only one of their conditions, and then again across the reduced configurations until no further minimization is possible. This process of truth table minimization results in the so-called solution formula. Because the truth table rows are postulated relationships of sufficiency, necessity cannot be inferred from the results of the truth table analysis and instead has to be analyzed separately (Schneider and Wagemann 2010). The third step is the interpretation of the solution formula. Depending on the researchers’ take on QCA as an approach (Thomann and Maggetti 2017), the interpretation involves the identification of necessary and/or sufficient conditions or configurations from the solution formula and/or the interpretation of the solution formula by “going back to the cases” (Rihoux and Lobe 2009). 4 The focus on interpretation by revisiting the cases conforms to Ragin’s original take on QCA as a case-oriented approach. Today, it is also recognized that QCA can be usefully applied for causal inference in larger-n data sets (Rihoux 2013). In that situation, interpretation focuses on the set-theoretic relations in the solution formula, often complemented by statistical techniques for assessing the QCA patterns (Thomann and Maggetti 2017).
Alongside the introduction of the new techniques (i.e., fuzzy-set QCA and multi-value QCA), several software packages have been developed to conduct the formal, comparative procedures. These include Tosmana (Cronqvist 2017), fs/QCA (Ragin and Davey 2017), and the QCA package in R (Duşa 2019; see www.compasss.org for a full overview and up-to-date references). Textbooks are now also available, detailing the guidelines and good practices for doing QCA proper (e.g., Gerrits and Verweij 2018; Rihoux and Ragin 2009; Schneider and Wagemann 2012).
Acknowledging the tenets of QCA, several disciplines, most notably political science, public policy, sociology, and management studies, have embraced and benefited from the method (Rihoux et al. 2013; Rihoux, Rezsöhazy, and Bol 2011; Seny Kan et al. 2016). However, during its more than thirty years of existence, the method has not yet been as widely used in SPARD (Cairns, Wistow, and Bambra 2017). In a way, this is surprising because QCA is potentially a very appropriate method for spatial planning researchers, perhaps particularly for its sensitivity to context (Cairns, Wistow, and Bambra 2017). As such, it may enable researchers to consider, inter alia, the dynamics of local places and their interaction with global conditions (Marr 2012), the particularities of different places and environments in relation to human and organizational systems, and to generate insights about the various explanations for outcomes. Given its potential, and to analyze and facilitate the use of QCA in spatial planning research, we carried out a systematic literature review of QCA in spatial planning and its related disciplines.
Research Method
Delimiting the Scope of Investigation
We used Scopus to stepwise delimit the scope of investigation. The delineation was performed between January 11 and January 24, 2018. First, we had to delineate the research discipline. Because spatial planning is broad and interdisciplinary, connected and relevant to other disciplines such as environmental sciences, design and architecture, political sciences, rural studies, and tourism studies, we used the Scopus Journal Metrics function for the delineation (see https://www.scopus.com/sources). We first limited the search to the subject area “social sciences” and to the source type “journals” which yielded a total of 6,950 journal titles (2016 metrics). The search was then further delimited to the subsubject areas “geography, planning and development” (572 journals), “transportation” (79 journals), and “urban studies” (129 journals). Some journal titles were in more than one sub-subject area. Deleting doubles, this yielded a total of 699 journal titles.
Second, we had to identify the population of articles for the review. For this, we used the Scopus Document Search function. The 699 journal titles had published a total of 427,255 documents (ISSN and ESSN publications combined). Because QCA was introduced in 1987, we limited the scope to the publication years 1987–2017. Furthermore, we limited the scope to journal articles written in English. This yielded a total of 282,267 publications.
Third, within the population of publications, we had to identify the QCA-related articles. To obtain the articles, we used the field code TITLE-ABS-KEY and the Logical-OR function. Building on existing QCA literature, we adopted the same key words as in the systematic literature review of QCA research in the discipline of management studies by Seny Kan et al. (2016)—that is, “Qualitative Comparative Analysis,” “QCA,” “Fuzzy-set,” “fsQCA,” “mvQCA,” “Crisp-set,” and “csQCA”—and supplemented this with the keywords “*QCA,” “Ragin,” and “Truth Table” that were used in systematic searches performed elsewhere, so as to ensure inclusiveness. This yielded a total of 349 journal articles.
Fourth, we read and coded all the 349 abstracts independently to assess which articles concerned QCA in SPARD. The articles were first coded to assess whether they concerned QCA. There was disagreement about three articles, yielding an intercoder reliability of 99.14 percent. After discussion, fifty-nine QCA articles were identified. Subsequently, the fifty-nine articles were assessed independently to determine whether they concerned SPARD. To be included, an article had to discuss or have implications for space-, place-, or environment-related issues. There had to be a clear spatial dimension relevant to the research. That is, the spatial dimension (space, place, environment) should be expected in the article to have a causal relevance to the phenomenon being studied (as a condition X) or the phenomenon itself should be spatial (as a case, research location, or as an outcome Y). We excluded articles that were clearly and solely in the disciplines of international relations, political science, or development studies. When in doubt, we included an article to ensure inclusiveness. There was disagreement about five articles, yielding an intercoder reliability of 91.53 percent. After discussion, thirty-six articles remained. Three of those articles were eventually also excluded because they did not involve an empirical application of QCA (i.e., Liyanage and Villalba-Romero 2015; López-i-Gelats et al. 2016; Mollinga and Gondhalekar 2014). This yielded a final selection of thirty-three articles for further analysis.
Coding Scheme for Data Analysis
Building on existing QCA literature, we derived the codes in the coding scheme from existing systematic literature reviews and inventories of QCA research in other research disciplines (i.e., Gerrits and Verweij 2016, 2018; Jordan et al. 2011; Rihoux et al. 2013; Rihoux, Rezsöhazy, and Bol 2011; Roig-Tierno, Gonzalez-Cruz, and Llopis-Martinez 2017; Seny Kan et al. 2016) and from categorizations found in the methodological QCA literature. Next to the general descriptive codes (i.e., authors, journal title, volume, issue, article title, year of publication), the thirty-three articles were coded as per the codes provided in Table 1. The coding was done between February 1 and March 16, 2018.
Coding Scheme.
Note. QCA = qualitative comparative analysis.
Use of QCA in Spatial Planning Research
Types, Objectives, and Disciplines
Compared to other disciplines, QCA is relatively little used in SPARD. However, the method has become increasingly popular in recent years. This is shown in Figure 1 (cf. Marx, Rihoux, and Ragin 2014; Rihoux et al. 2013; Roig-Tierno, Gonzalez-Cruz, and Llopis-Martinez 2017). Fuzzy-set QCA was the most used technique (64 percent), followed by crisp-set QCA (24 percent) and multi-value QCA (12 percent). An example of mvQCA can be found in Qin and Liao’s (2016) study into labor-out migration and agricultural change in China. The authors calibrated the condition “region” as follows: “east region” {0}, “central and northeast region” {1}, and “west region” {2}. They also used crisp-set QCA (csQCA) with the condition “topography” where cases received a score of {0} when it was plain and {1} when the topography was hilly or mountainous. Examples of fuzzy-set QCA (fsQCA) can be found in, for example, Kirchherr, Charles, and Walton’s (2016) research into conditions that explain public opposition to dam projects in Asia. They used the corruption perception index (CPI) and calibrated the condition “corruption” as follows: 0.00 (“no corruption perceived in the country”—CPI score of ≥4), 0.33 (“limited corruption perceived in the country”—CPI score of ≥3 and >4), 0.67 (“corruption perceived to be a significant challenge in the country”—CPI score of ≥2), and 1.00 (“corruption perceived to be pervasive in the country”—CPI score of <2). (2016, 38). Although the high frequency of fsQCA in the sample of articles should not be understood to mean that it is necessarily the best technique (this may instead depend on research design, theory, and data), a noteworthy advantage of fuzzy-set QCA over crisp-set QCA is that more of the complexity of the cases can be retained (Gerrits and Verweij 2018). The most used fuzzy-set techniques were continuous fuzzy sets (eight of the twenty-one fsQCA studies) and four-value fuzzy sets (seven of the twenty-one fsQCA studies). With continuous fuzzy sets, cases can receive scores on the conditions and the outcome in the full range of 0.0 ≤ x ≤ 1.0. This technique is best applied when fine-grained quantitative data are available that can be directly transformed using a logarithmic function (Ragin 2008b). With four-value fuzzy sets, cases receive scores of 0.00, 0.33, 0.67, or 1.00. This technique is more suitable in situations where qualitative data are available or where small differences between cases (e.g., a calibrated score of 0.87 vs. a score of 0.89) cannot be meaningfully interpreted. Different types of fuzzy sets can be combined in one single analysis (six of the twenty-one fsQCA studies). Notably, it was unclear in five of the twenty-one fsQCA studies which exact calibration technique was applied. It is important that the calibration is transparent and detailed, so that research results can be replicated and are open to scrutiny (Schneider and Wagemann 2010).
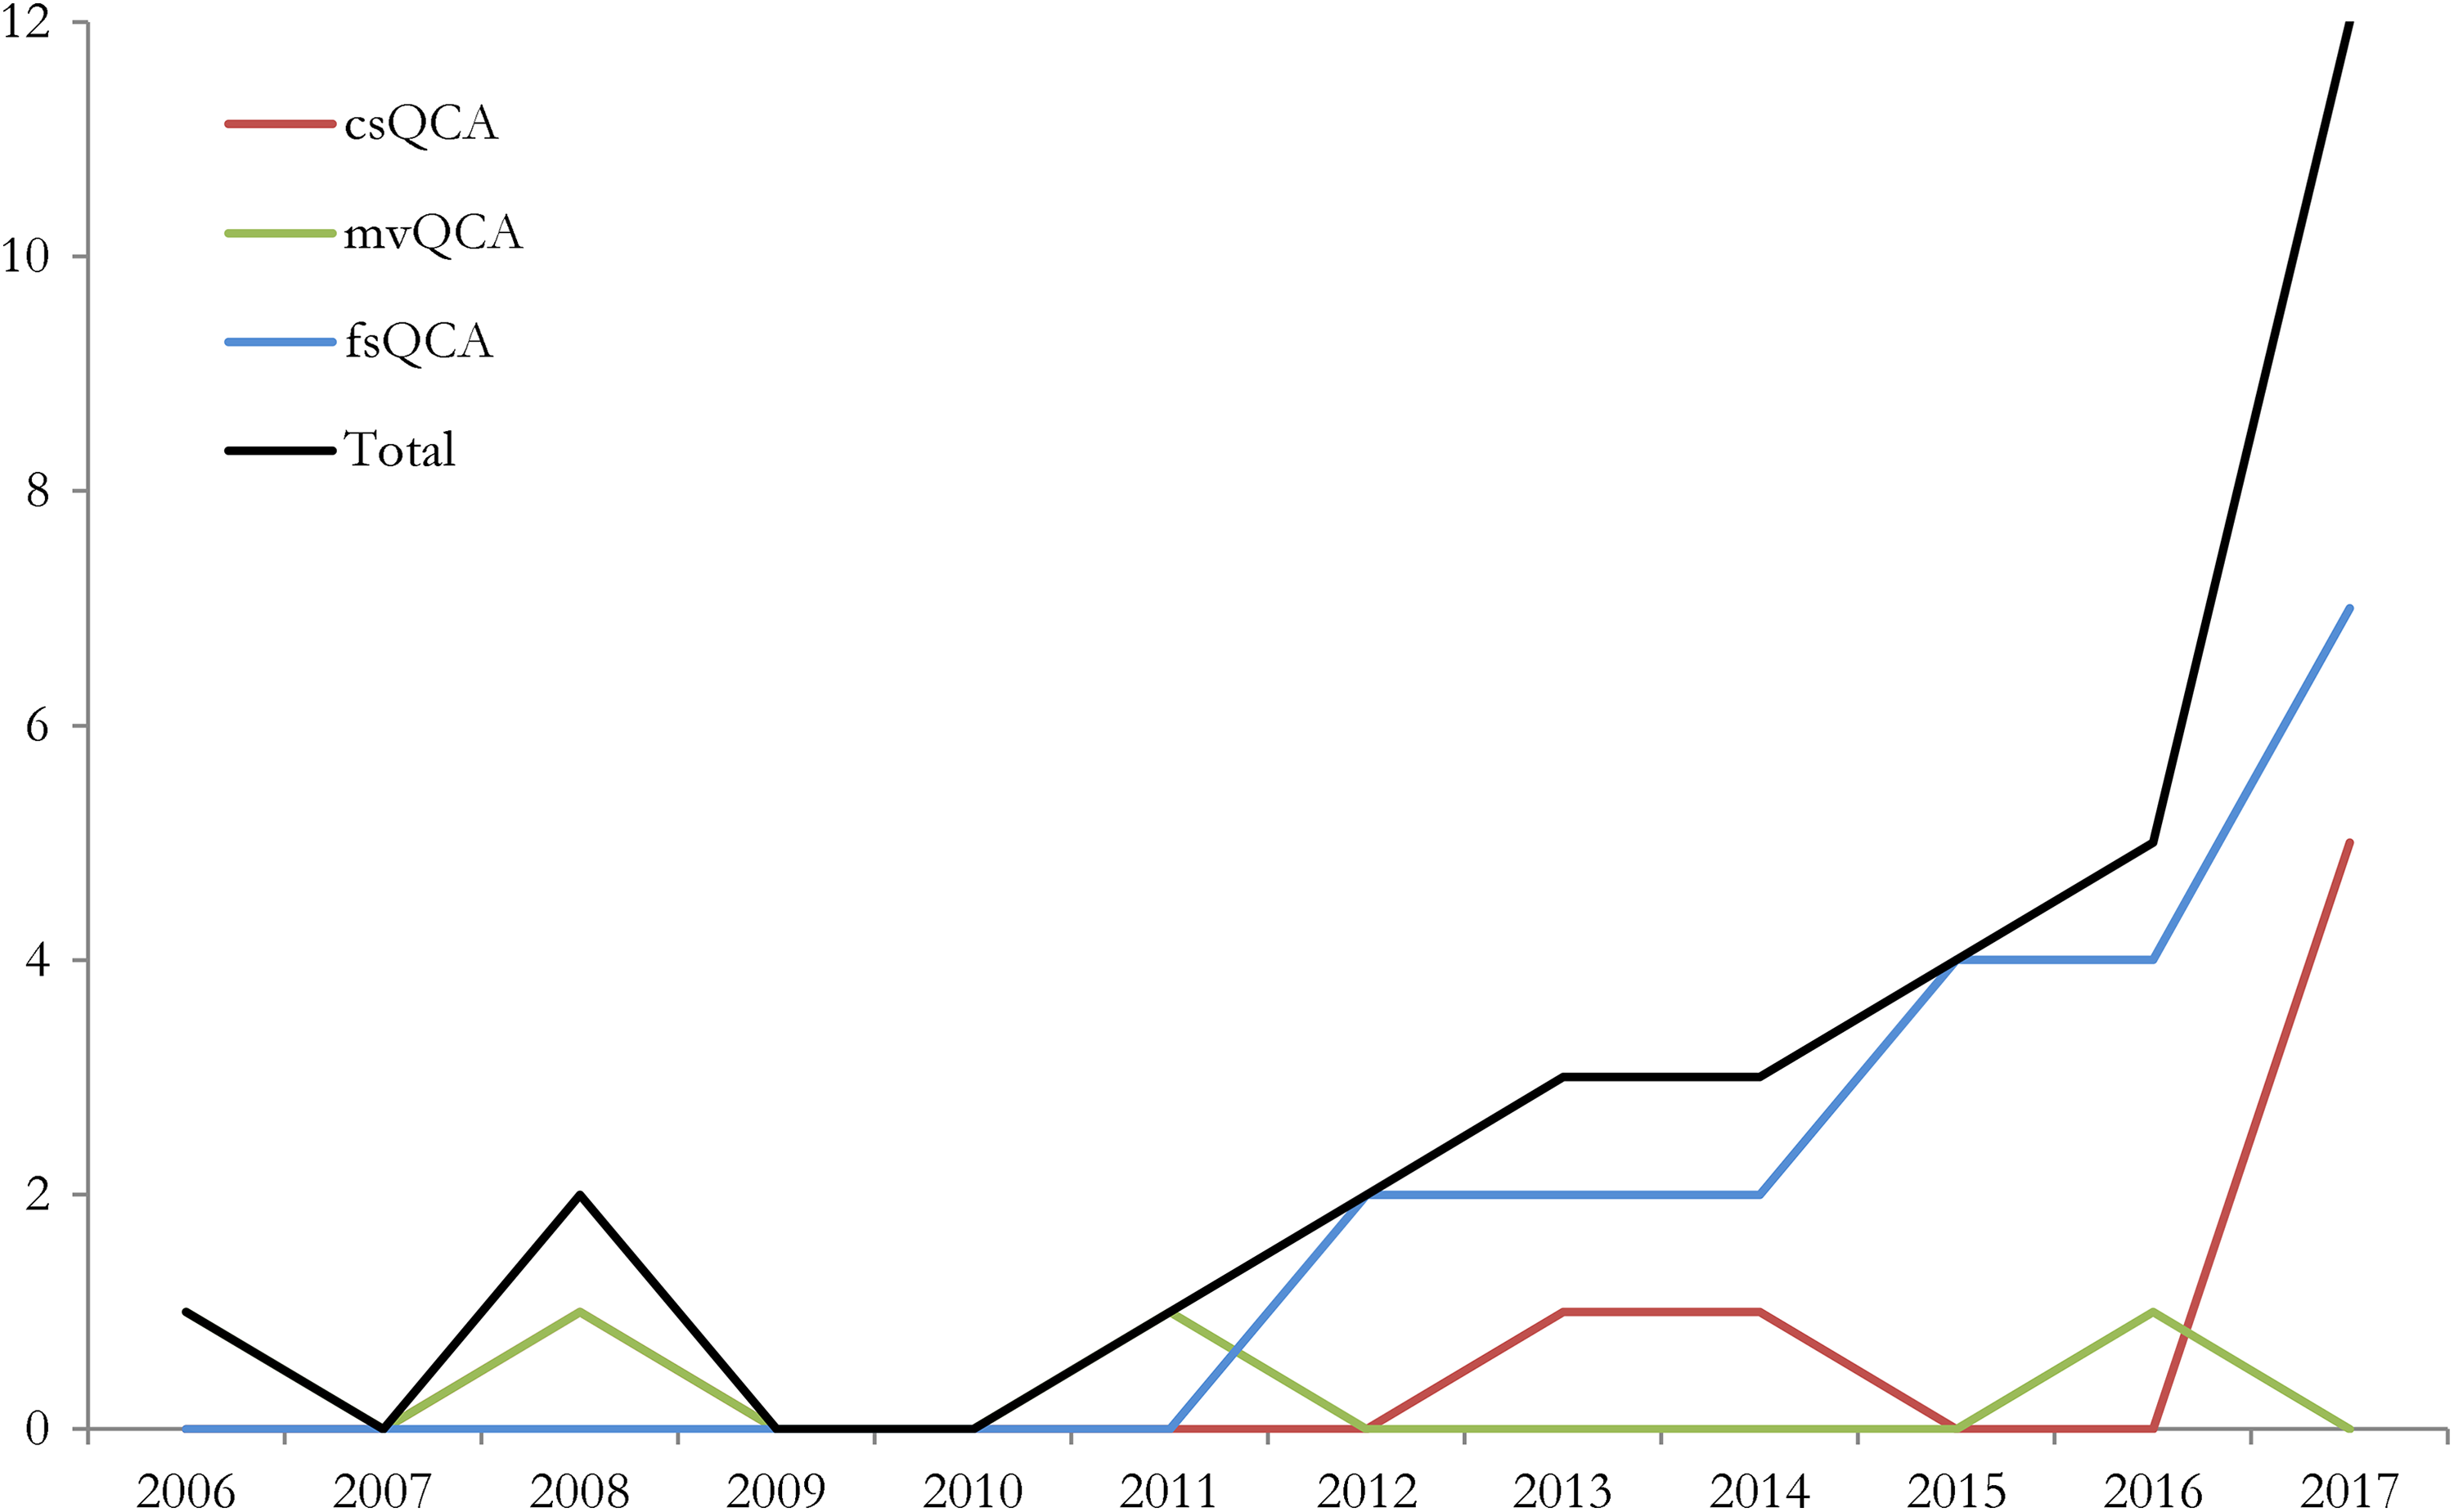
Number of articles by qualitative comparative analysis technique.
Rihoux and Ragin (2009) distinguished five main objectives for which QCA can be used: (1) summarizing patterns in the data and showing the similarities/differences between cases, (2) checking for coherence in the data or finding contradictory configurations, (3) testing existing theories, (4) testing researchers’ ideas/assumptions that are not part of existing theories, and (5) formulating new theories (see also Table 1). We found that in the reviewed articles, often multiple objectives were expressed or no clear objective was expressed. Still two conclusions were clear. First, with the exception of Cairns, Wistow, and Bambra’s (2017) research, QCA was not used for checking the coherence in the data or finding contradictory configurations so as to gain a more thorough understanding of the cases qualitatively (Berg-Schlosser et al. 2009). Second, by far, the most prominent reasons for using QCA were the formulation of new theories or theoretical arguments and the testing of existing theories. An example of a study that used QCA to test existing theories can be found in Kirchherr, Charles, and Walton’s (2016) article. Building on existing literature on political opportunity structures, their study aimed to test whether explanatory necessary or sufficient conditions identified in single-case studies would hold in a fuzzy-set QCA including a larger sample of cases. Another example is the study of Pahl-Wostl and Knieper (2014). They formulated configurational hypotheses about the relationship between the characteristics of governance systems and their capacity to adapt to climate change. They compared twenty-seven cases of domestic river basins and tested the hypothesis that polycentric governance regimes are characterized by high adaptive capacity. Basurto (2013), instead, used QCA to formulate a new theory, about how multilevel institutional arrangements (i.e., programs) for biodiversity conservation in Costa Rica influence the likelihood of local autonomy. Another example is Jang, You, and Han (2015) who applied QCA to develop a decision-making model that supports the application of green technologies to reduce carbon emissions during the construction stage of road construction projects in Korea. We suggest that the clear dominance of using QCA for developing or testing theories means that there is a lot of untapped potential for the method in SPARD. QCA can be used for more than theory development and testing alone (Berg-Schlosser et al. 2009).
We also coded the articles for the discipline to which they belong. Of the thirty-three articles, sixteen articles were coded to fall into two disciplines. Across the thirty-three articles, the discipline of environmental sciences was represented the most (N = 15/8 for with/without double-counted disciplines), followed by planning (N = 10/7), geography (N = 9/6), and tourism studies (N = 6/6). QCA was least used in climate and disaster studies (N = 4/2), urban studies (N = 3/3), and transportation (N = 2/1). More details can be found in Table 2.
Units of Analysis in QCA Studies in SPARD.
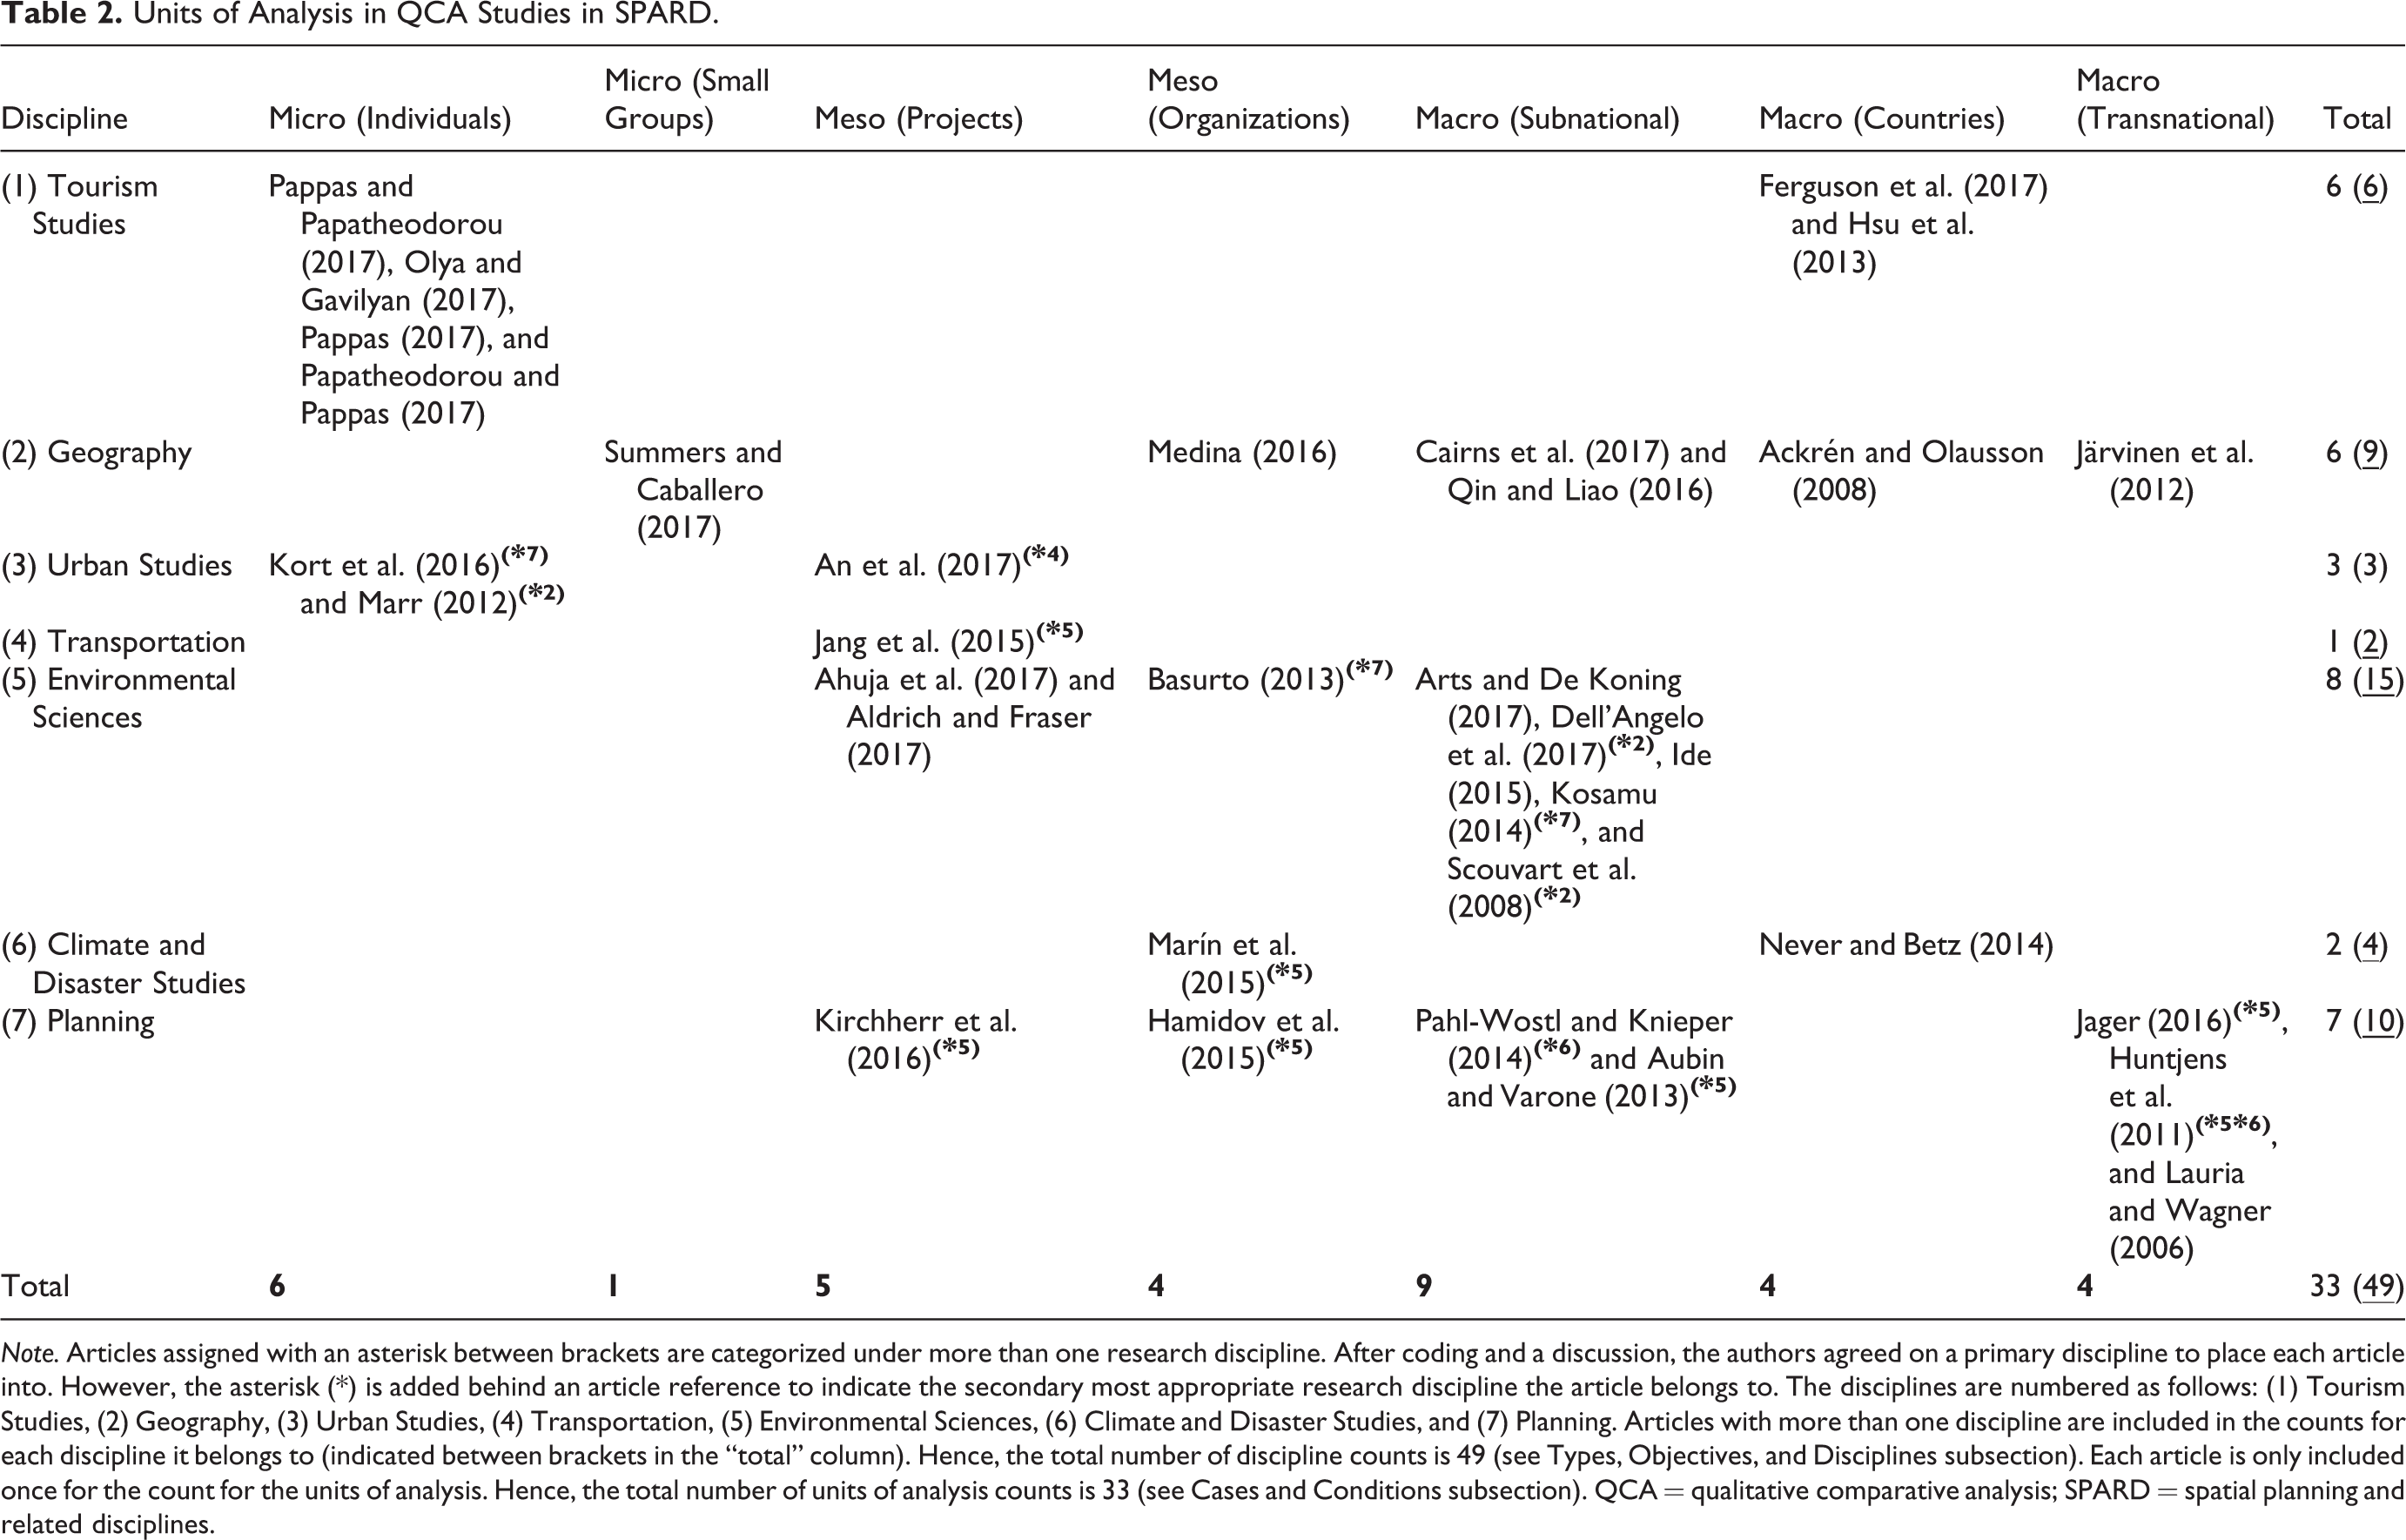
Note. Articles assigned with an asterisk between brackets are categorized under more than one research discipline. After coding and a discussion, the authors agreed on a primary discipline to place each article into. However, the asterisk (*) is added behind an article reference to indicate the secondary most appropriate research discipline the article belongs to. The disciplines are numbered as follows: (1) Tourism Studies, (2) Geography, (3) Urban Studies, (4) Transportation, (5) Environmental Sciences, (6) Climate and Disaster Studies, and (7) Planning. Articles with more than one discipline are included in the counts for each discipline it belongs to (indicated between brackets in the “total” column). Hence, the total number of discipline counts is 49 (see Types, Objectives, and Disciplines subsection). Each article is only included once for the count for the units of analysis. Hence, the total number of units of analysis counts is 33 (see Cases and Conditions subsection). QCA = qualitative comparative analysis; SPARD = spatial planning and related disciplines.
Data and Methods
The majority of the articles applied only QCA as an analytical method (55 percent). QCA was applied in combination with a quantitative method (36 percent), in particular when a higher number of cases were available. The quantitative methods applied were statistical tests, correlational tests, and various regression analyses. In one article, QCA was combined with social network analysis (Järvinen, Lamberg, and Pietinalho 2012). In three studies, QCA was combined with a qualitative analytical method (9 percent) such as process tracing (Aldrich and Fraser 2017). The mixed-method applications highlight the complementarity of QCA with other methods. For instance, regression-based methods can be used to identify significant conditions that are then further analyzed with QCA (Amenta and Poulsen 1994) or QCA can be used to identify typical or deviant cases for further analysis using process tracing (Schneider and Rohlfing 2013).
A variety of data and methods for data collection was used (see Figure 2). Interviews and secondary data (mainly published case studies) were used the most, followed by survey data. It is noteworthy that fourteen of the thirty-three studies (42 percent) used multiple types of data to calibrate their cases. This highlights that, within a single study, different conditions can be calibrated differently (e.g., combining crisp-set QCA, four-value QCA, and continuous fuzzy sets), depending on the data at hand. 5 It also highlights the advantage of QCA over many other methods: through calibration, it can integrate qualitative and quantitative data in a single research framework (Trueb 2013). QCA can accommodate all types of data, which is clearly evidenced by the reviewed articles, and through calibration the data are made compatible with each other.
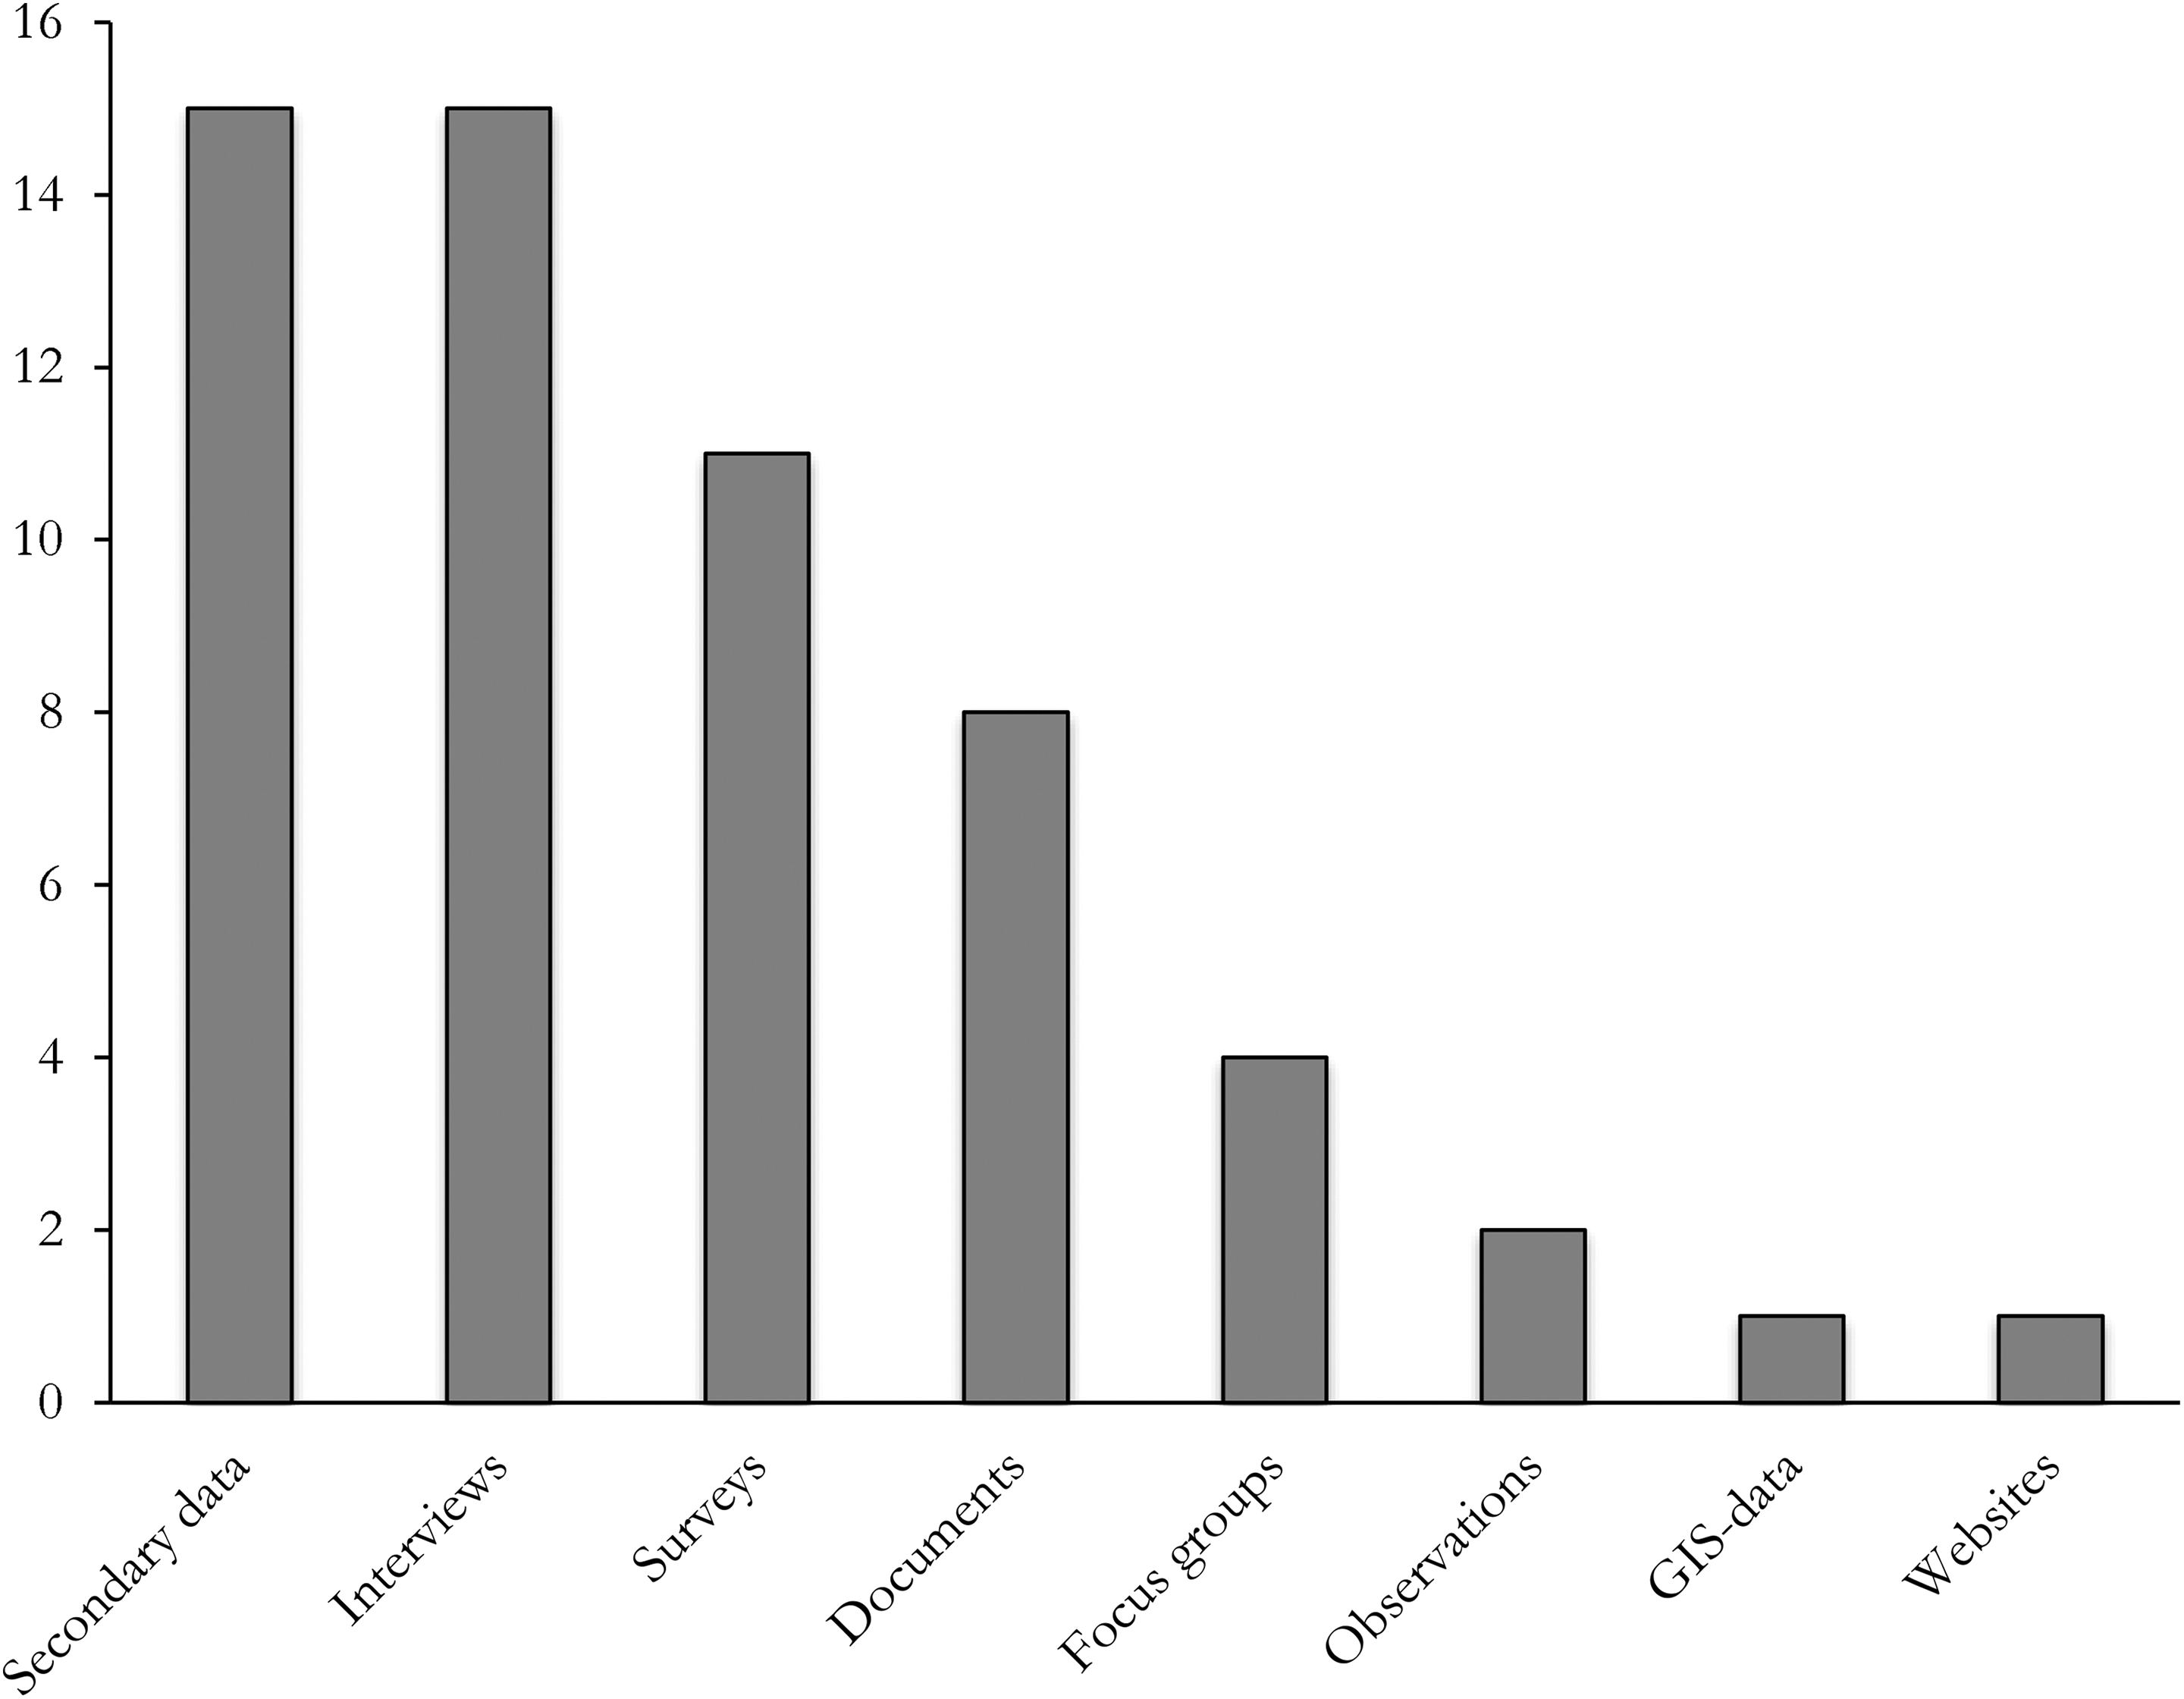
Data sources used in the qualitative comparative analysis studies.
Cases and Conditions
Among the thirty-three articles, units of analysis at the macro-level were most common (52 percent), followed by units of analysis at the meso-level (27 percent) and the microlevel (21 percent; see Table 2). This does not imply, however, that QCA is more suitable for macro-level cases than for example meso-level cases; QCA can be used for comparatively analyzing cases at all levels, as long as the cases within a study are on the same level. A total of seventeen articles analyzed macro-level cases, of which cases at the subnational/regional level were most common (N = 9). Examples include health regions in England (Cairns, Wistow, and Bambra 2017), villages and regions in tropical countries (Arts and De Koning 2017), and fishing villages in Malawi (Kosamu 2014). Macro-level cases at the country level (N = 4) and the transnational level (N = 4) were analyzed an equal number of times. At the transnational level, the cases concerned cross-country studies of communicative planning theories (Lauria and Wagner 2006), economic regions in the world (Järvinen, Lamberg, and Pietinalho 2012), and international river basins (Huntjens et al. 2011; Jager 2016). Meso-level cases were analyzed in nine articles. Examples of project-level cases (N = 5) are residential and commercial building projects in India (Ahuja, Sawhney, and Arif 2017) and the use of green technologies in Korean road construction projects (Jang, You, and Han 2015). Examples of organizational-level cases include small-scale fisher organizations in Chile (Marín et al. 2015) and water consumers associations in the Bukhara region in Uzbekistan (Hamidov, Thiel, and Zikos 2015). Microlevel cases were analyzed in seven articles, the majority of which featured individuals as the units of analysis (N = 6). The individuals analyzed were tourism accommodation managers (Pappas and Papatheodorou 2017), holidaymakers (Papatheodorou and Pappas 2017; Pappas 2017), residents (Olya and Gavilyan 2017), urban project managers (Kort, Verweij, and Klijn 2016), and individuals using transitional housing programs (Marr 2012). Five of these six microlevel case articles relied on surveys for the data collection, featuring large numbers of cases, ranging from 50 to 811 cases (see also Table 3). This underscores the recent trend that QCA is no longer exclusively applied to small-n and medium-n data sets and that the method is increasingly used as a condition-oriented approach for the analysis of large-n data sets (Rihoux et al. 2013). The article with small groups as the unit of analysis concerned a comparative study of 625 street robberies in Austin, Texas, using inter alia Geographic Information System (GIS) data (Summers and Caballero 2017). An overview of the articles is provided in Table 2, also showing the discipline(s) to which each of the articles belongs.
Diversity of Cases and Conditions in the QCA Studies.
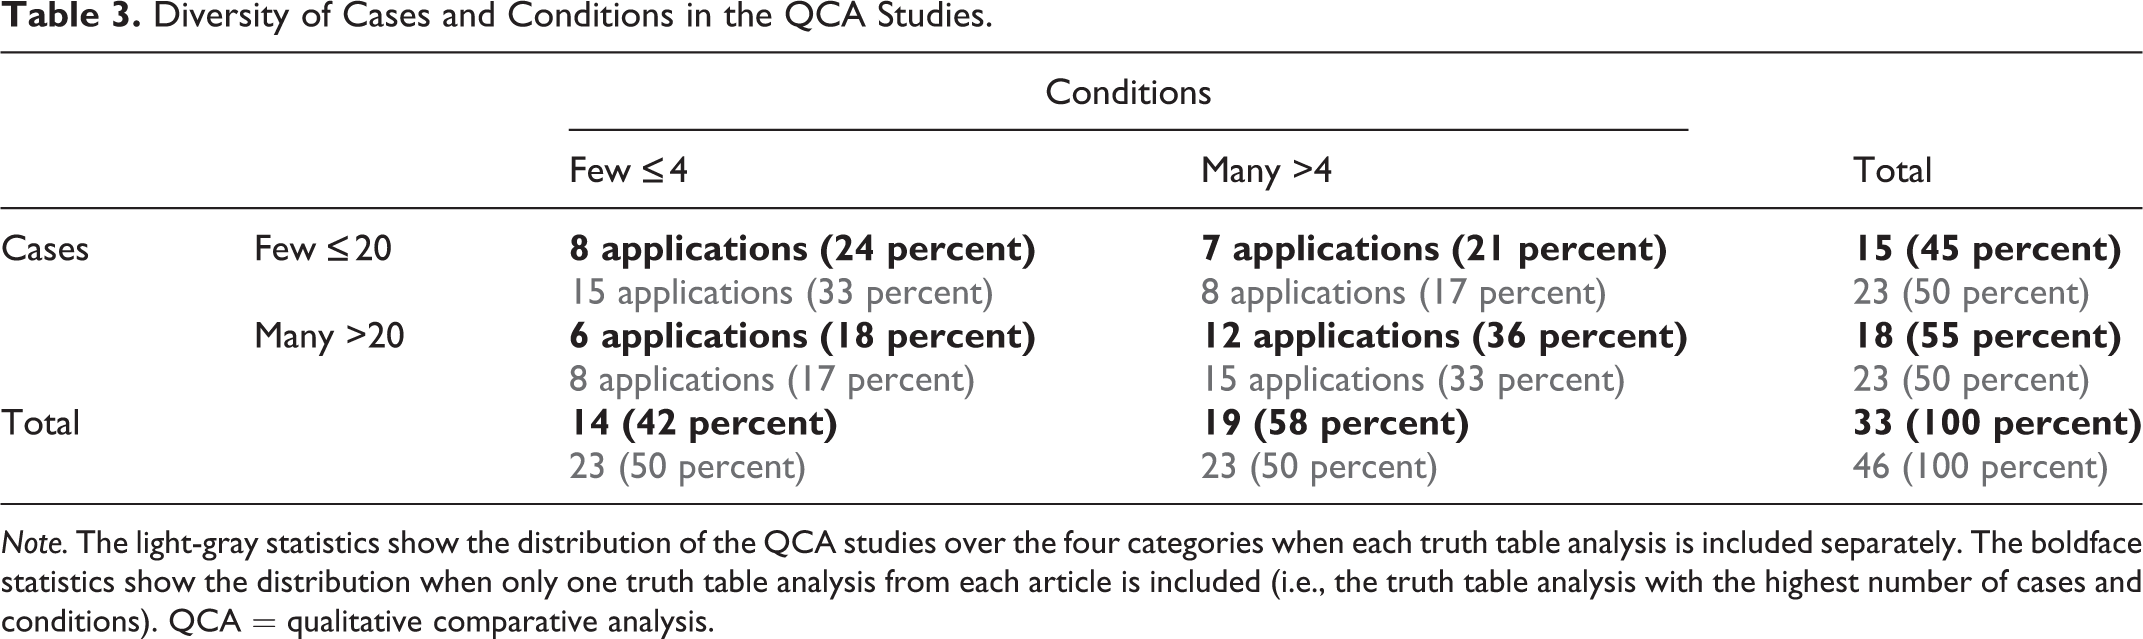
Note. The light-gray statistics show the distribution of the QCA studies over the four categories when each truth table analysis is included separately. The boldface statistics show the distribution when only one truth table analysis from each article is included (i.e., the truth table analysis with the highest number of cases and conditions). QCA = qualitative comparative analysis.
Table 3 shows the diversity of practices in the QCA applications with regard to the numbers of cases and conditions. 6 Four of the QCA studies featured multiple truth table analyses where different numbers of cases and conditions were included. In those studies, the researchers tested multiple configurational–theoretical models where each model featured a different (sub)set of conditions (and cases). (Hsu, Woodside, and Marshall 2013; Olya and Gavilyan 2017; Pahl-Wostl and Knieper 2014) or they conducted separate truth table analyses for different time periods and policymaking levels (Basurto 2013). The table indicates that small-n and large-n applications are more or less evenly common in SPARD.
Our analysis shows that QCA applications with many conditions (>4) and many cases (>20) are most common in spatial planning research; applications with few conditions (≤4) and many cases (>20) are least common (see Table 3). This is comparable to how QCA is generally applied across disciplines (see Rihoux et al. 2013). However, a recent inventory of Gerrits and Verweij (2018) into QCA applications in the related disciplines of infrastructure, construction, and transport provides a contrasting picture. They found that small-n applications are most common (75 percent). Of the fifteen small-n applications they identified (cases ≤20), eight studies analyzed a small number of conditions (≤4) and seven studies a larger number of conditions (>4). It thus seems that, compared to SPARD, QCA studies on infrastructure, construction, and transport have a stronger focus on small-n applications. This is possibly explained by the inclusion of tourism studies in our sample of QCA studies, which more than half of the time feature large numbers of cases (Olya and Gavilyan 2017; Papatheodorou and Pappas 2017; Pappas 2017; Pappas and Papatheodorou 2017). It may also be explained by the nature of the research disciplines; the inventory of Gerrits and Verweij (2018) shows that a clear majority of the studies involves meso-level cases (i.e., projects and organizations) such as road (construction) projects. Meso-level cases are likely to be available in smaller quantities than microlevel cases, which are more easily researched using surveys as exhibited by the abovementioned QCA studies on tourism.
We also calculated the simple ratio between the number of logically possible configurations (i.e., truth table rows) and the number of cases for the boldface statistics in Table 3. This ratio is interesting because if a truth table has many empty truth table rows (i.e., logically possible configurations devoid of cases), then fewer pairwise comparisons can be made, yielding more complex simplified expressions. Having a good ratio between the number of truth table rows and the number of cases may curtail the issues of arithmetic and clustered remainders. 7 Arithmetic remainders are empty truth table rows caused by a situation where the number of truth table rows simply outnumbers the number of cases; clustered remainders occur when many cases cluster in the same truth table row (Schneider and Wagemann 2012). The total average ratio for the thirty-three studies was 2.79. This means that, on average across the QCA studies, 2.79 cases were available per truth table row. The ratio was best for the category with many cases and many conditions (i.e., 5.60). As expected, the ratio is worst for the category with few cases and many conditions, with an average of 0.21 cases per truth table row.
Producing and Visualizing Results
The dominant software used for the analyses was fs/QCA (N = 14), followed by Tosmana (N = 6) and the QCA package in R (N = 4). Tosmana was developed for the analysis of multinomial conditions in QCA (Cronqvist 2004), and it is hence no surprise that three of the four multi-value QCA (mvQCA) studies used the software for their analysis (Ackrén and Olausson 2008; Huntjens et al. 2011; Qin and Liao 2016). The QCA package in R was used in articles dating from 2015. In three studies, other QCA software was used, that is, the DOS 3.0 software (Lauria and Wagner 2006; Scouvart et al. 2008) and the program “fuzzy” in Stata (Aldrich and Fraser 2017). For seven studies, it is not clear if and which software was used. Although the software should not be used as a press-button technique without understanding and considering the assumptions that are fed into the analysis, using the software ensures that no manual errors occur in the process of pairwise comparison (Schneider and Wagemann 2010). The different softwares have different advantages and disadvantages; an overview can be found on www.compasss.org.
Regarding the visualization of the results, the regular results table is dominant (N = 27). These tables are produced by the QCA software and are therefore easy to include in a study report or article. This does not imply that it is also the only correct visualization format. The results were in fact also visualized in XY plots (N = 7), where the x-axis represents a condition or the minimized configuration(s) and the y-axis the outcome. Flowchart-like figures were not used much. However, such visualization is quite attractive and allows for an easy grasp of the sometimes rather complex results; it resonates rather well with the understanding in the QCA literature that minimized configurations are “paths” toward an outcome (Gerrits and Verweij 2018). Flow diagrams were featured in four articles (Ahuja, Sawhney, and Arif 2017; An, Garvin, and Hall 2017; Jager 2016; Marín et al. 2015).
Good Practices
In their article, Standards of Good Practice in Qualitative Comparative Analysis (QCA) and Fuzzy-Sets, Schneider and Wagemann (2010) formulated rules of thumb to guide researchers in conducting QCA proper. Their good practices relate to both QCA as an approach and QCA as a set of techniques. Because QCA is currently subject to many methodological debates and developments, both as an approach and a set of techniques, it should be noted that, first, the good practices apply to greater or lesser extent depending on the specific take and use of QCA. For instance (see Table 1), different terminology is often used depending on how QCA is viewed epistemologically (cf. Thiem, Baumgartner, and Bol 2016), there are fierce discussions about the (one-and-only) “correct” solution type in QCA (e.g., Schneider 2018; Baumgartner 2015; Thiem 2016), and whether reporting the raw data matrix makes sense depends on the number of cases studied, that is, whether the application conforms to the case-oriented or condition-oriented take on QCA. Still the good practices listed by Schneider and Wagemann (2010) remain a well-cited source and good start for beginning QCA researchers. Second, it should be noted that some of the reviewed QCA studies were conducted before Schneider and Wagemann’s good practices were published. This being said, we coded the thirty-three QCA studies in SPARD on a selection of the good practices and scored how well the articles adhered to them. The results are provided in Table 4. The full overview of the good practices in QCA can be found in Schneider and Wagemann (2010). We also refer the reader to QCA handbooks that detail guidelines for conducting QCA proper (e.g., Gerrits and Verweij 2018; Rihoux and Ragin 2009).
Assessment of Good Practices in the QCA Studies.
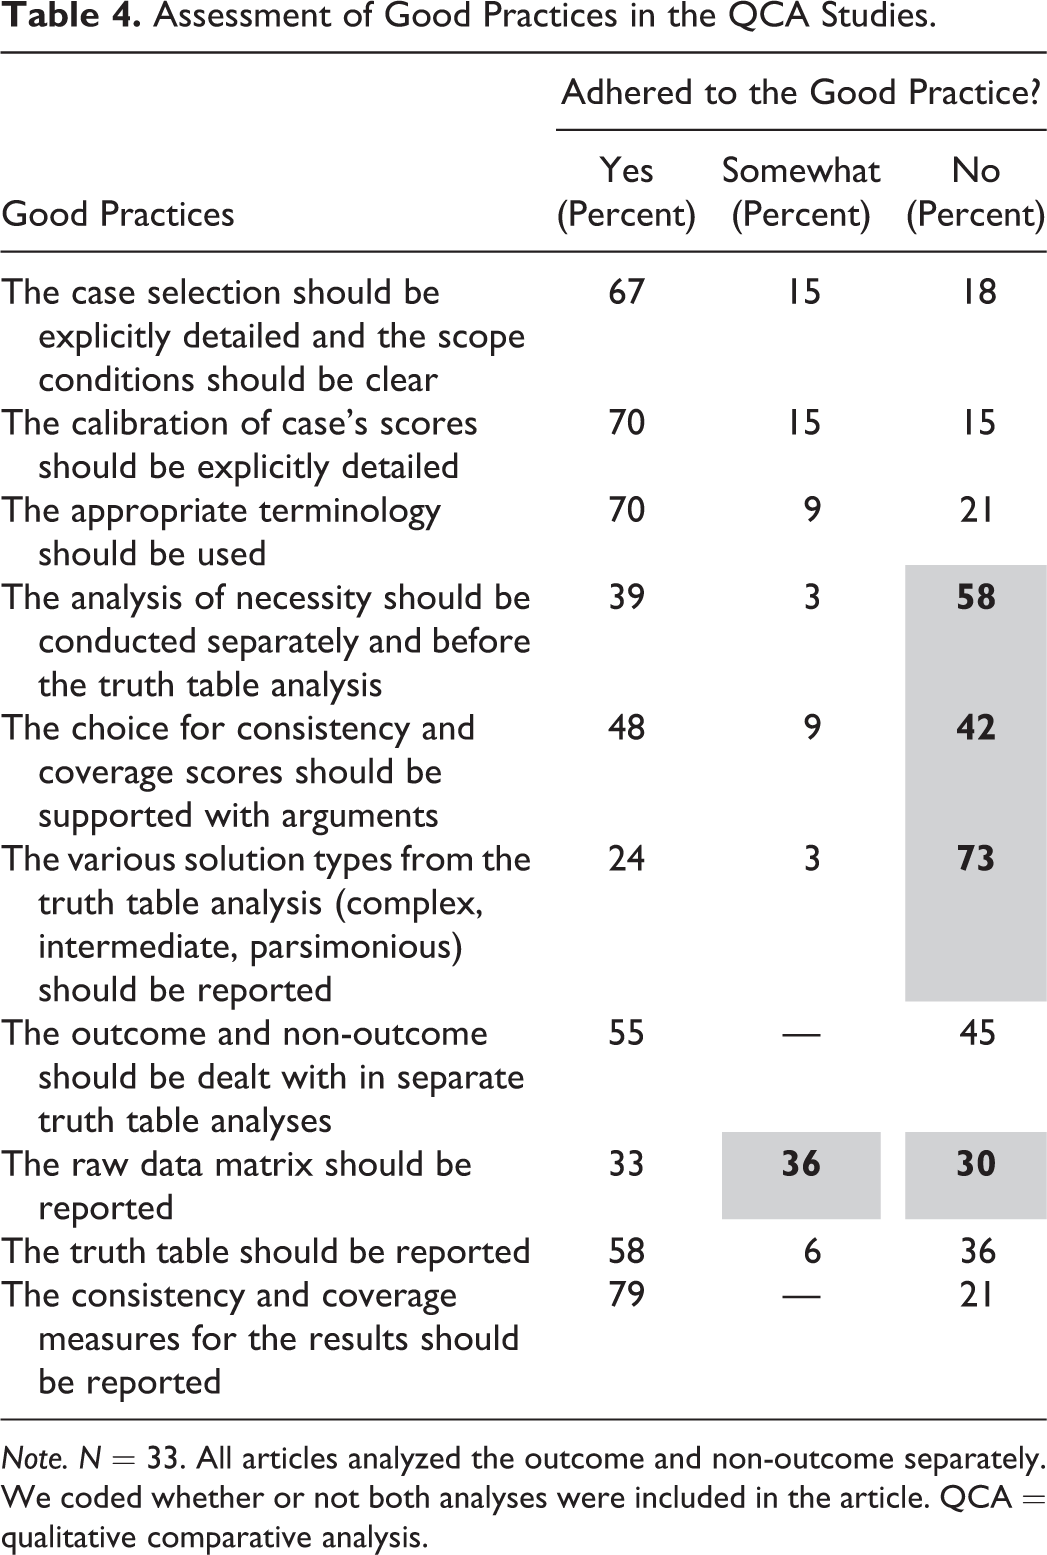
Note. N = 33. All articles analyzed the outcome and non-outcome separately. We coded whether or not both analyses were included in the article. QCA = qualitative comparative analysis.
First, often no analysis of necessity was performed or the necessity of conditions was inferred from the truth table minimization only (58 percent). There is rather broad agreement among QCA scholars that it is important to analyze necessity separately and prior to the truth table analysis, using appropriate software, so as to prevent wrongly claiming necessity of conditions.
Second, more attention needs to be paid to the reporting of the consistency scores of the truth table. In 42 percent of the studies, consistency scores were not reported or they were too low to justify the inclusion of the truth table rows in the minimization process. If the consistency scores are not reported, it is hard to evaluate the quality of the analysis. If the consistency scores are too low, the data may include too many contradictory cases to warrant robust results.
Third, in many cases, only one solution type was reported (73 percent). This is not problematic per se. Problematic is, however, that it was unclear in quite a few of those instances which solution type (the complex, an intermediate, or the parsimonious result) was reported. This means that it is unclear how logical remainders were dealt with. Logical remainders are truth table rows devoid of any cases, which can be included still to create a more parsimonious result. In effect, it means that the researcher performs a kind of counterfactual analysis on types of cases (i.e., configurations) that were not present in the data. However, if it is unclear how the logical remainders are dealt with, it means that in many studies, logical remainders may have been wrongly included. For instance, some remainders may actually express theoretical assumptions that are impossible or that contradict the evidence that is provided by the empirical material (see Schneider and Wagemann 2012). It is important to explicate the treatment of logical remainders in the study.
Fourth, in more than half of the studies, the raw data matrix was not reported. Specifically, in 30 percent of the cases, no data matrix was reported at all. However, this was justified in half of those studies (15 percent) by the fact that the studies concerned large numbers of cases. In 36 percent of the studies, only the calibrated data matrix was reported. These practices are troublesome when the calibration rules are also unclear. To be able to assess the quality of the data and its calibration, it is recommended that the calibration rules and raw data matrix are provided, either in the main text or as an (online) appendix.
Advantages of QCA for Spatial Planning Research
What advantages does QCA offer to spatial planning researchers? We coded the advantages of QCA in SPARD as stated in the articles. We identified three dominant themes: QCA is sensitive to context (N = 10), QCA enables the use of small-/medium-n of cases and to bridge the quantitative–qualitative divide (N = 14), and QCA enables the study of complex wholes (causal complexity, conjunctural causation) which makes it a method well suited in the context of complexity theory (N = 21).
The article by Cairns, Wistow, and Bambra (2017) illustrates that, due to its sensitivity to context, QCA can be very useful for researchers who aim to explain spatial variations in, for example, health outcomes. Making a case for the use of QCA in geographical research, the authors point out that, since QCA “can consider contextual information about place in relation to characteristics of human and organization systems and be used to generate insights about variations in outcomes” (2017, p. 369), it is a particularly appropriate method for geographers. Besides QCA’s sensitivity to geographical location and the physical context, different authors also emphasize its sensitivity to socioeconomic and political aspects of different national–regional–local contexts. For instance, researching one of the key domains of spatial planning (i.e., water management), Jager (2016) argues that “international cooperation around transboundary rivers is subject to a number of context-sensitive factors, such as the water problems at hand or the integration between states, related by various causal paths of interaction” and that therefore the application of QCA “may provide valuable insights into the interlinkages and interdependences between conditions leading to international cooperation” (p. 289). Particularly relevant for spatial planning—which often seeks to draw out policy implications of research and provide guidelines for practice and action (Alexander 2016)—is that QCA was regarded in the articles as an appropriate method for informing policy making and “context-specific intended institutional change” (Hamidov, Thiel, and Zikos 2015, 176), a method able to inform evidence-based development, planning, and policy making (Qin and Liao 2016), or was recommended for the analysis of multilevel policies (Never and Betz 2014). QCA thus enables planners to draw lessons that can inform practices across different contexts and policy levels (Marr 2012).
Second, it was stated in the reviewed articles that QCA enables the use of small-/medium-n cases and to bridge the quantitative–qualitative divide. In that respect, QCA was often positioned as superior to other methods. It enabled the authors to generalize from small-/medium-n cases. It is important that we stress here, however, that the number of cases is a poor justification for the use of QCA (Thiem 2014). For one thing, although QCA is rightfully appreciated for being able to systematically compare small-n complex cases (Gerrits and Verweij 2018), it is also suitable for the analysis of large-n data sets (Thiem 2014; see Cases and Conditions subsection for examples). A better justification of the use of QCA is the researcher being explicitly interested in analyzing complex configurational relationships. That being said, the reviewed articles furthermore appreciated that the method made analysis replicable and transparent, thus being superior to many other qualitative methods (Hsu, Woodside, and Marshall 2013), and that QCA at the same time allowed retaining a great extent of within-case complexity, detail, and nuance, thus being superior to many quantitative methods (Arts and De Koning 2017; Medina 2016). For instance, in his study of environmental governance and conflicts over renewable resources, Ide (2015, 62) stated that “QCA is well suited to deal with complex causal relationships and to uncover relevant context factors and interaction effects. Since cases are selected from a variety of locations and contexts, the results are much more generalizable than single-case studies. However, the analysis is still essentially based on in-depth, qualitative knowledge of the twenty cases under study. In this sense, the QCA provides a middle ground between quantitative large-n and qualitative case studies” (see also Aldrich and Fraser 2017; Arts and De Koning 2017; Never and Betz 2014). It was also argued that QCA enables to better bridge the global–local gap, for example, to understand how global processes interact with local contexts/conditions to shape processes, experiences, and outcomes of inter alia urban marginality (Marr 2012).
Third, the most often stated advantage of QCA relates to complexity. In some cases, explicit links were made between QCA and its fit with complexity theory, alongside systems theory, chaos theory, and fuzzy logic (e.g., Olya and Gavilyan 2017; Pappas and Papatheodorou 2017). The majority of articles, however, discussed the advantage of QCA in terms of causal complexity (in particular the configurational nature of QCA), which allows researchers to study “complex wholes” (Ferguson, Megehee, and Woodside 2017). Referring specifically to spatial science research, Cairns, Wistow, and Bambra (2017) state that “the major benefit of QCA is that it can handle complexity by exploring different pathways that generate the same outcome, which applies to much spatial research” (p. 396). Other authors (e.g., Pappas and Papatheodorou 2017) are even more explicit, explaining that they applied fsQCA in order to “capsulate the essence of complexity” (p. 34).
QCA’s focus on complexity is also linked to its small/medium-n property and then to its advantage to policy and planning: “in studies limited by a small number of cases in existence (for example, reactors), causal configurations of multiple conditions better explain policy puzzles than single independent variables (…). Ragin’s qualitative comparative analysis (QCA) remedies the problem of spurious correlation by identifying a ‘solution formula’ that includes all possible causal configurations of conditions that lead to a given outcome (for example, a restart or stall) among a set of cases” (Aldrich and Fraser 2017, 446; cf. Huntjens et al. 2011). Links were also made between complexity and context sensitivity, through QCA’s focus on equifinality. Equifinality and complexity theory both propose that there are a number of alternative paths explaining the outcome (Olya and Gavilyan 2017). From the perspective of spatial planners, QCA can thus illuminate the different ways to achieve a spatial planning outcome that can be tailor-made to different contexts in for instance different cities. QCA’s focus on equifinality provides spatial planners alternative options to come to a certain positive outcome appropriate for a specific context (Gerrits and Verweij 2018). In sum, it becomes clear from the articles that, in order to more efficiently study complex sociospatial wholes, and in order to draw lessons and develop institutional and spatial designs that can deal with increasing uncertainty across different contexts, QCA seems to be a promising way forward.
Discussion and Conclusions
With this article, we aimed to further introduce QCA in spatial planning research. We introduced and discussed the various ways in which the method can and should be used and we highlighted the primary reasons why QCA is interesting for spatial planning researchers. Having discussed the main properties, applications, and advantages of the method, this article can contribute to the visibility and application of QCA, thereby supporting recent calls for more comparative work in planning research (Markusen and Gadwa 2010). In SPARD research, the method can also be a valuable addition to international research projects, to more systematically generalize and draw lessons across cases (Pallagst 2010).
Especially because of QCA’s sensitivity to context, its ability to comparatively analyze small-/medium-n cases, and its attention to causal complexity, the method is considered interesting by spatial planning researchers. It is important to reiterate here, however, that QCA is no panacea and that SPARD researchers novel to the method are advised to also consult publications discussing specific disadvantages as well as solutions available to cope with them. Several limitations of QCA were also mentioned in the reviewed articles. We briefly discuss them here because they are informative for improving QCA practices in SPARD. First, the use of small-n cases means that the inclusion of only a single paradoxical case may strongly influence the results and even lead to inappropriate conclusions (Pahl-Wostl and Knieper 2014; see also De Meur, Rihoux, and Yamasaki 2009). Second, QCA’s sensitivity to small changes in the calibration was mentioned as a potential challenge (Marín et al. 2015; Kirchherr, Charles, and Walton 2016). A different calibration can namely cause a case to shift to another truth table row, meaning that the result of the minimization may also change. These are two important issues that are currently being tackled in the QCA literature through the development of sensitivity analyses and robustness tests (Skaaning 2011; Ide 2015), which SPARD researchers are encouraged to consult when setting up their QCA research projects. A third shortcoming discussed is that QCA is a static method. With QCA, cases are, as it were, “frozen in time” (Caren and Panofsky 2005, 149). The method is not well equipped to analyze case dynamics over time (De Meur, Rihoux, and Yamasaki 2009). This presents a challenge for QCA in SPARD. Cases in spatial planning research are namely often dynamic and this requires methods that are able to take these dynamics into account (De Roo and Silva 2010; Teisman, Van Buuren, and Gerrits 2009). SPARD researchers whose projects seek to analyze case dynamics comparatively are therefore encouraged to look into some strategies available in QCA to address it (e.g., Castro and Ariño 2016; Williams and Gemperle 2017; Caren and Panofsky 2005; Hino 2009; see for overviews Fischer and Maggetti 2017; Gerrits and Verweij 2018). Several articles from the reviewed sample may provide SPARD researchers with points of reference for analyzing case dynamics (i.e., Basurto 2013; Järvinen, Lamberg, and Pietinalho 2012; Never and Betz 2014; Scouvart et al. 2008). A final point of attention, closely related to the previous one, is the challenge in QCA to draw causal inferences from observational, cross-sectional data (De Meur, Rihoux, and Yamasaki 2009). With QCA, it is possible to identify necessary and/or sufficient (configurations of) conditions that produce a certain outcome of interest, but the question what the underlying mechanisms and processes that truly explain outcomes are, remains unanswered. To take into account and to perhaps overcome this potential limitation, SPARD researchers aiming to use QCA are encouraged to seek advice from literature that is being developed on how QCA can be combined properly with process tracing (Beach and Rohlfing 2018; Schneider and Rohlfing 2013, 2016). By combining QCA with process tracing, it is also possible to integrate time more evidently in the analysis and to reveal the causal mechanisms and processes that are at work behind the conditions in the cases.
We categorized the articles on a variety of variables to show when, where, and how QCA was used in SPARD. The overviews we presented in the present article are entry points for spatial planning researchers who are thinking about applying QCA. In particular, Table 2 provides an “index” of how QCA has been applied in terms of the units of analysis in different research disciplines. Admittedly, as a result of our approach to delimiting the scope of investigation (see Delimiting the Scope of Investigation subsection), we have sacrificed inclusiveness for transparency and systematicity in the collection of the articles for the review. As a consequence, QCA applications in spatial planning research that are published outside the journals identified as SPARD, such as the work by Sager (2005, 2006, 2007), have been missed. More inclusive reviews that span the larger population of QCA applications may be consulted (Rihoux et al. 2013) but will require updating given the recent increase in the uptake of the method.
A key challenge for spatial planning researchers is the translation of research into practice, as such contributing to learning and lesson transfer (Booth 2015; Alexander 2016). In some way or another, this involves comparison. QCA allows for the very transparent and systematic comparison of cases. However, if learning and lesson transfer are to be done properly with QCA, that is, if valid lessons are to be produced, it is important that good practices and guidelines are adhered to. Notwithstanding the caveats of assessing the articles on the good practices (as noted in the Good Practices subsection), we found that in many applications, this is not always or not fully the case. A possible explanation is that QCA is a novel method for SPARD and that the discipline has not yet accumulated the experience and concomitant pool of reviewers able to assess QCA applications in journal review processes to the highest and most recent standards. This is a shared concern in the QCA community. Educating researchers about QCA, especially in new disciplines such as SPARD, is a matter that requires attention. QCA courses are increasingly offered, but mostly in disciplines such as political science or management studies. The development of QCA-training programs in SPARD is important to ensure high-quality QCA applications in spatial planning research as well. It is important to mention here, though, that the guidelines are constantly subject to debate, given the rapid methodological developments and discussions in QCA. Basic guidelines on applying QCA proper can be found in, for example, Rihoux and Ragin (2009), Schneider and Wagemann (2010), and Gerrits and Verweij (2018), but QCA users are advised, depending on their specific take and use of QCA, to consult recent publications in the QCA literature for applying the approach and its techniques proper (cf. Thomann and Maggetti 2017). Finally, to contribute to learning and lesson transfer, researchers are warned that some specific challenges may be encountered that have to do with the target audience of the lessons. QCA is built on a specific set of premises on how cases and causality are to be understood (i.e., configurational, equifinality, multifinality, and asymmetry). This goes against how many practitioners are used to understand and interpret research results. It can be expected that the target audience of the lessons will struggle with understanding and accepting the results from a QCA study. This issue is gaining increasing attention in the QCA literature (e.g., Gerrits and Verweij 2018; Pattyn, Molenveld, and Befani 2017). Yet we believe that more on-the-ground work is also needed to further develop the method explicitly as a tool for learning and transferring lessons, both from research-to-practice and from case-to-case.
Footnotes
Declaration of Conflicting Interests
The author(s) declared no potential conflicts of interest with respect to the research, authorship, and/or publication of this article.
Funding
The author(s) received no financial support for the research, authorship, and/or publication of this article.