
Abstract
A range of crystalline and nano-sized carbonate- and silicate-substituted hydroxyapatite has been successfully produced by using continuous hydrothermal flow synthesis technology. Ion-substituted calcium phosphates are better candidates for bone replacement applications (due to improved bioactivity) as compared to phase-pure hydroxyapatite. Urea was used as a carbonate source for synthesising phase pure carbonated hydroxyapatite (CO3-HA) with ≈5 wt% substituted carbonate content (sample 7.5CO3-HA) and it was found that a further increase in urea concentration in solution resulted in biphasic mixtures of carbonate-substituted hydroxyapatite and calcium carbonate. Transmission electron microscopy images revealed that the particle size of hydroxyapatite decreased with increasing urea concentration. Energy-dispersive X-ray spectroscopy result revealed a calcium deficient apatite with Ca:P molar ratio of 1.45 (±0.04) in sample 7.5CO3-HA. For silicate-substituted hydroxyapatite (SiO4-HA) silicon acetate was used as a silicate ion source. It was observed that a substitution threshold of ∼1.1 wt% exists for synthesis of SiO4-HA in the continuous hydrothermal flow synthesis system, which could be due to the decreasing yields with progressive increase in silicon acetate concentration. All the as-precipitated powders (without any additional heat treatments) were analysed using techniques including Transmission electron microscopy, X-ray powder diffraction, Differential scanning calorimetry, Thermogravimetric analysis, Raman spectroscopy and Fourier transform infrared spectroscopy.
Introduction
Synthetic hydroxyapatite (HA, Ca10(PO4)6(OH)2, Ca:P molar ratio 1.67), is a bioactive material that is chemically similar to biological apatite, the mineral component of bone.
1
However, biological apatite is a poorly crystalline, non-stoichiometric material (Ca:P molar ratio < 1.67) that contains additional ions in the structure (
Human bone contains up to 8 wt% carbonate ions that occupy phosphate and hydroxide positions in the apatite lattice. 15 It has been shown that the presence of carbonate in synthetic HA leads to structural disorder and a higher solubility.15,16 This is useful because although HA can bond to surrounding tissue, this process is very slow. 17 Carbonate-substituted HA is therefore, considered as an optimised biomaterial, which leads to faster bonding between an inserted implant surface and human bone.17–21
Substitution of carbonate ions in the HA lattice can be of two types, A-type, where carbonate ion substitutes the hydroxyl ion and B-type, where the carbonate ion substitutes the phosphate ion.15,16,22,23 A-type carbonated HA can be formed when carbon dioxide gas is passed over HA at high temperature in the range 500 – 1100℃.15,16 This substitution reaction can be represented as follows
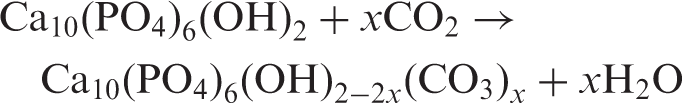
B-type CHA can be formed by precipitation from solution and can give a material with less particle crystallinity and smaller crystal size.15,16 B-type carbonate substitution is more complicated than A-type carbonate substitution into HA. Carbonate ions (

Sodium ions (Na+) can partially substitute calcium ions (Ca2+) in HA leading to stabilisation of a B-type carbonate-substituted HA.23,25 This substitution leads to Ca10
-x
Na
x
(PO4)6
-x
(CO3)
x
(OH)2. The charge balance can be represented as follows

In reports by Vignoles et al.
26
and Doie et al.
27
ammonium carbonate was used as a carbonate source, in order to avoid using a sodium-based source. However, this resulted in incorporation of ammonium ions (
In addition to calcium phosphates, calcium carbonate is also a known biocompatible material.31–33 Indeed, calcium carbonate implants have been studied, due to their relatively faster resorption, and therefore, quicker onset of neo bone formation. Three weeks after implantation 10.8% bone formation was observed under microscope as compared to 4.8% for HA implants inserted in muscular cavities of rats.32,34 Bone regeneration, around dental implants used in alveolar ridge treatment, has been reported after use of compositions which included calcium carbonate. 35 Stephen Mann’s research group based at University of Bristol has reported extensively on morphological and phase control of calcium carbonate particles synthesised using microemulsions and its biological uses.36,37 However, complete resorption of a porous bone substitute (before bone has filled the pores), is disadvantageous as a controlled replacement is preferred. 32 Hence, calcium carbonate and calcium phosphate mixtures are of interest as they may offer tailorable dissolution and regrowth rates. This way the defect is able to function or take a load whilst the repair process is underway.
Although HA is known to be bioactive and osteoconductive, it has a relatively slow rate of dissolution and osseointegration.
38
One of the methods to improve the osseointegration of HA is to substitute traces of elements such as silicon, in the HA lattice.
39
One of the earliest works on role of silicon in bone was reported in the 1970s by Carlisle, wherein the presence of 0.5 wt% silicon was reported in mineralising osteoid regions in young mice and rats.40 Silicon has also been reported to play an important role in the formation of collagen.
41
Silicon-substituted HA (Si-HA) has been reported to promote rapid bone mineralisation; however, it also leads to a smaller crystallite size and faster dissolution.42–45 Use of silicon-substituted HA as sintered granules in femoral condyles of rabbits resulted in significantly greater bone formation (37.5%) when compared (after 23 days of implantation) with the case where phase-pure HA (22.0%) was used.
45
Due to the importance attached to presence of silicon in calcifying regions of bone, attempts have been made to incorporate silicon in the HA lattice. Silicon-substituted HA has been synthesised using wet-precipitation and batch hydrothermal techniques.46–50 There have also been many reports on the development of silicon-substituted HA coatings on metallic substrates for enhanced osseointegration.14,51,52 Silicon enters the HA lattice in the form of silicate ions (
The current methods for the synthesis of nano-sized calcium phosphates (and ion-substituted calcium phosphates) can be slow, irreproducible or involve use of organic solvents.54,55 Supercritical fluids such as supercritical water (critical temperature Tc = 374℃; critical pressure, Pc = 22.1 MPa) and carbon dioxide have attracted interest for a range of materials processes due to their exotic reaction conditions, lack of solvent residues and often enhanced diffusion or reaction kinetics.56–59 A supercritical fluid is a single phase fluid in which the substance is neither a fluid or a gas but can possess the properties of both simultaneously. Continuous hydrothermal flow synthesis of nanoparticles (using a flow of supercritical water) is a route that allows rapid, single step synthesis of ceramic nanoparticles for diverse applications.60–67 The authors previously demonstrated in an initial communication that the rapid crystallising continuous environment in a CHFS system, resulted in one-step rapid formation of HA. 68 In a further publication, the authors reported the use of CHFS for the rapid and direct manufacture of magnesium containing calcium phosphates. 69 The authors have also highlighted the benefits of the CHFS technology to obtain nano-sized HA (and ceramic–ceramic nanomixtures) which sinters to translucent fully dense discs under spark plasma sintering whilst retaining its nanostructure and high flexural strength.70,71
Herein CHFS was used to incorporate carbonate and silicate ions into the HA lattice. These materials were characterised using various analytical techniques to assess the effects of silicate and carbonate substitution.
Experimental section
Materials and equipment
Diammonium hydrogen phosphate, [(NH4)2HPO4, 98.3%], calcium nitrate tetrahydrate [Ca(NO3)2.4H2O, 99%] and silicon tetraacetate [Si(OCOCH3)4, 98%] were supplied by Sigma-Aldrich Chemical Company (Dorset, UK) and used as obtained. Ammonium hydroxide solution (NH4OH, ≥30% w/w) used to adjust the solutions’ pH, and Urea [(NH2)2CO, 99.5%] were supplied by VWR International (UK). Ten mega-ohms deionised water was used in all reactions.
Samples were freeze-dried using a Vitris Advantage Freeze Dryer, Model 2.0 ES, supplied by BioPharma. A JEOL 2010 transmission electron microscope (TEM) (200
PXRD (Powder X-ray Diffraction) data were collected on a Siemens D5000 X-Ray diffractometer using Cu-Kα radiation (λ = 1.5418 Å) over the 2θ range 5–70° with a step size of 0.02° and a count time of 1 s.
Simultaneous differential scanning calorimetry (DSC) and thermogravimetric analyses (TGA) were carried out using a Polymer Labs STA 1500 using a heating rate of 10℃/min in the 30–1200℃ temperature range under nitrogen. A Nicolet Almega dispersive Raman spectrometer (785 nm laser) was used in the wavenumber range 1200–400 cm−1 averaging 20 scans for 2 s each. Fourier transform infrared (FTIR) spectra of the samples were collected using a Nicolet FTIR 800 spectrometer fitted with a photoacoustic sampler (MTech PAS Cell). Spectra were obtained in the range 4000–400 cm−1, at 8 cm−1 resolution averaging 256 scans. BET surface area measurements (using N2 gas adsorption method), were performed on a Micromeritics Gemini analyser; powders were first degassed at 80℃ for 3 h prior to analyses. 29Si magic angle spinning nuclear magnetic resonance (MAS-NMR) was carried for sample 5-SiHA using the solid-state NMR research service at Department of Chemistry, Durham University.
Synthesis and methodology
Carbonate (
)-substituted calcium phosphate
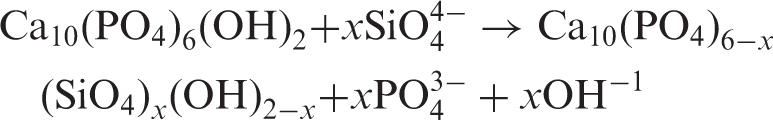
Sample IDs, expected wt% of carbonate, y values (according to Ca10(PO4)6 -y (CO3) y (OH)2) and corresponding amounts of reagents used.
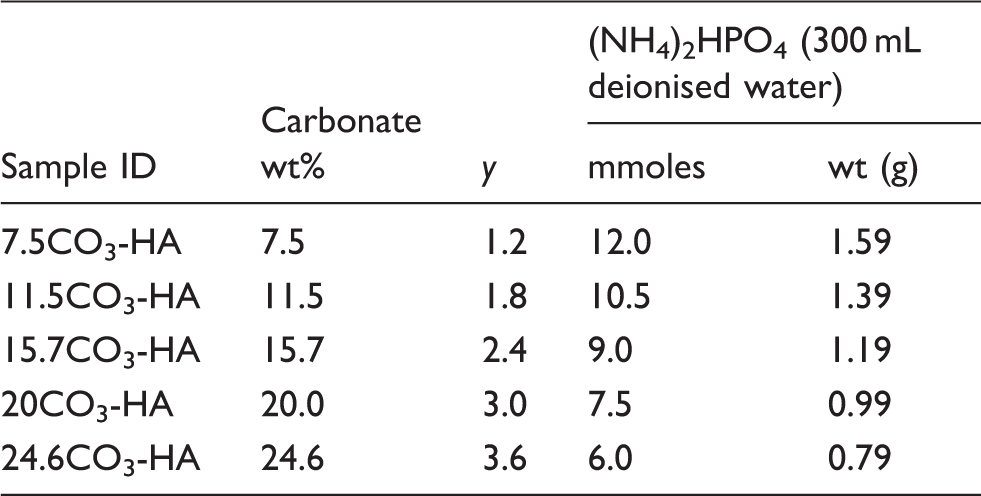
Scheme of the three-pump continuous hydrothermal flow synthesis system used for the preparation of Mg-substituted calcium phosphates. Key: P = HPLC pump, H = heater, C = cooler, F = filter, B = back-pressure regulator, R = counter-current reactor, T = stainless steel T-piece mixer.
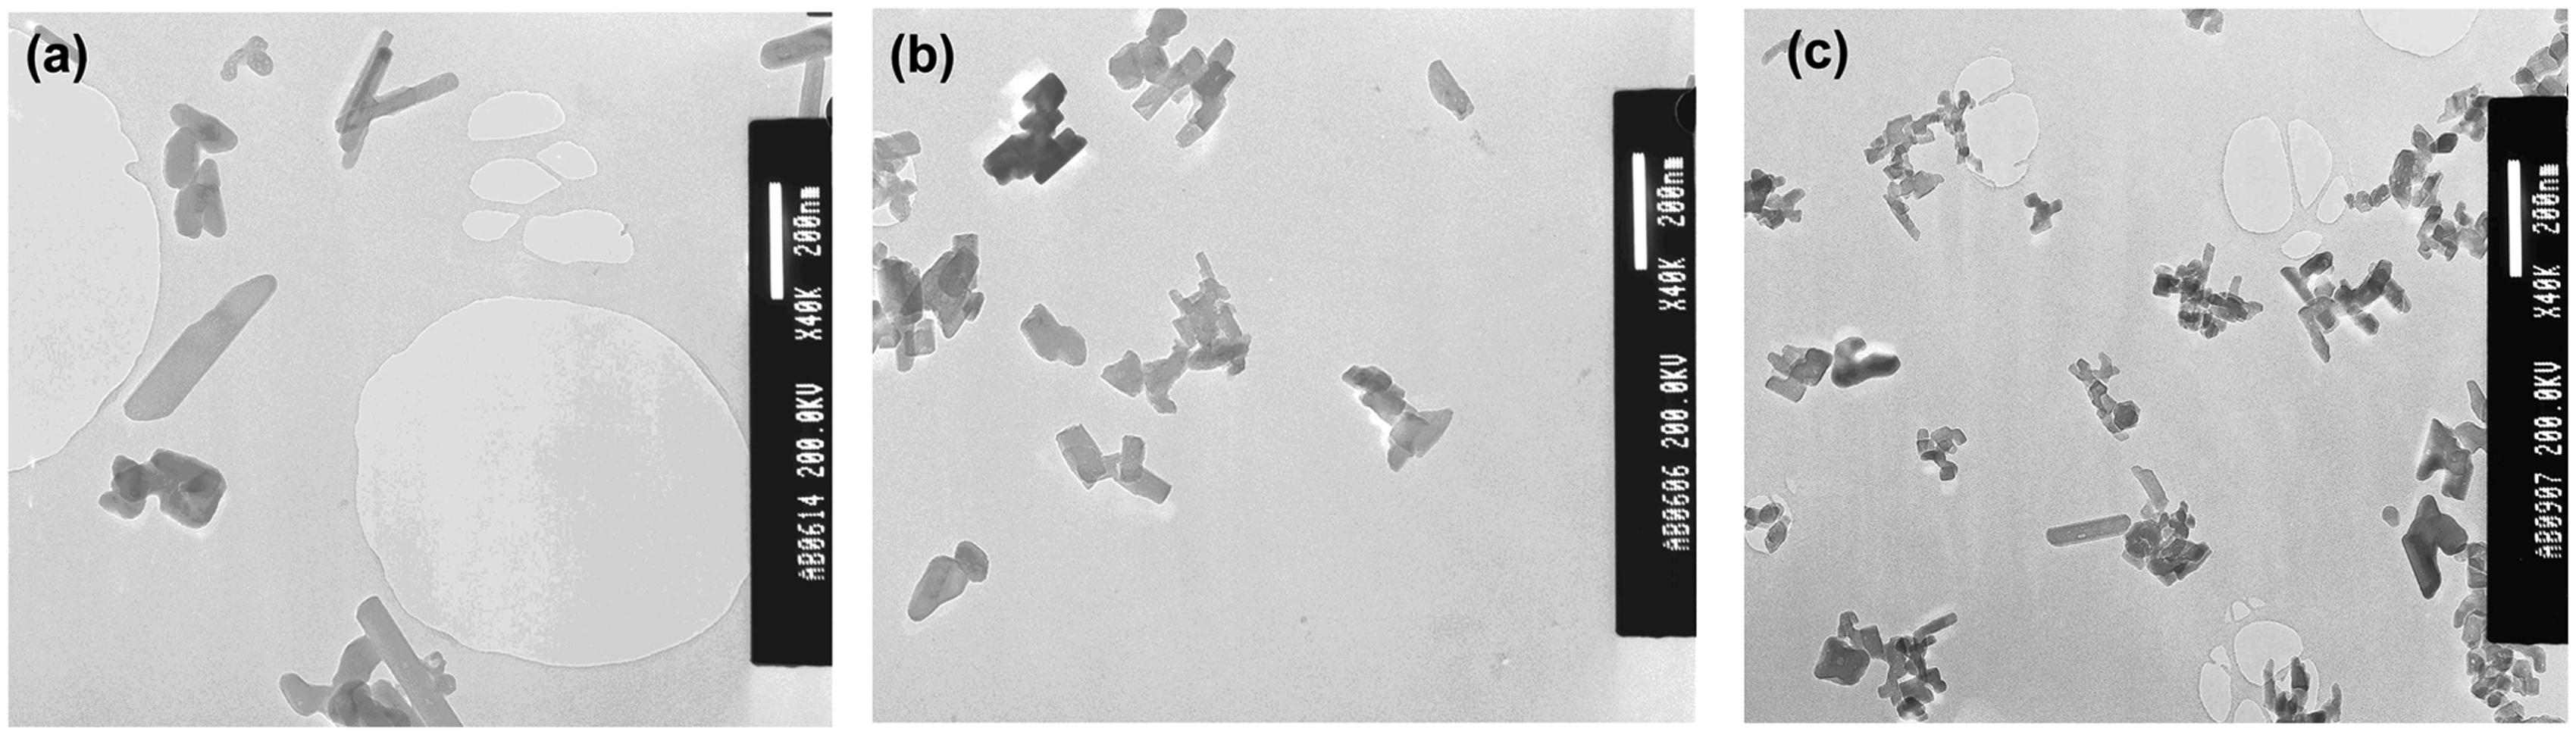
Transmission electron microscope images of: (a) sample 7.5CO3-HA at ×40 k magnification (bar = 200 nm); (b) sample 15.7CO3-HA at ×40 k magnification (bar = 200 nm) and (c) sample 24.6CO3-HA at ×40 k magnification (bar = 200 nm).
A continuous hydrothermal flow synthesis (CHFS) system with three HPLC pumps and similar to that described elsewhere, was used for syntheses (Figure 1).64,72–74 Briefly, the CHFS system allows pumping and then mixing of the Ca salt and a basic phosphate source (with urea) at a ¼” stainless steel Swagelok™ T-piece mixer (whereupon initial precipitation at ambient temperature occurs in flow). This slurry then meets the flow of superheated water in a stainless steel counter-current mixer,68,72 whereupon the bioceramic material is crystallised in a continuous fashion. The products are then cooled, filtered to remove large agglomerates and pass out of a back-pressure regulator which maintains system pressure. Pump rates of 10.0, 5.0 and 5.0 mL/min were used for the superheated water feed, calcium nitrate and diammonium hydrogen phosphate/urea solutions, respectively. A Ca:[ Transmission electron microscope images of: (a) HA at ×40 k magnification (bar = 200 nm) and (b) 5SiHA at ×40 k magnification (bar = 200 nm).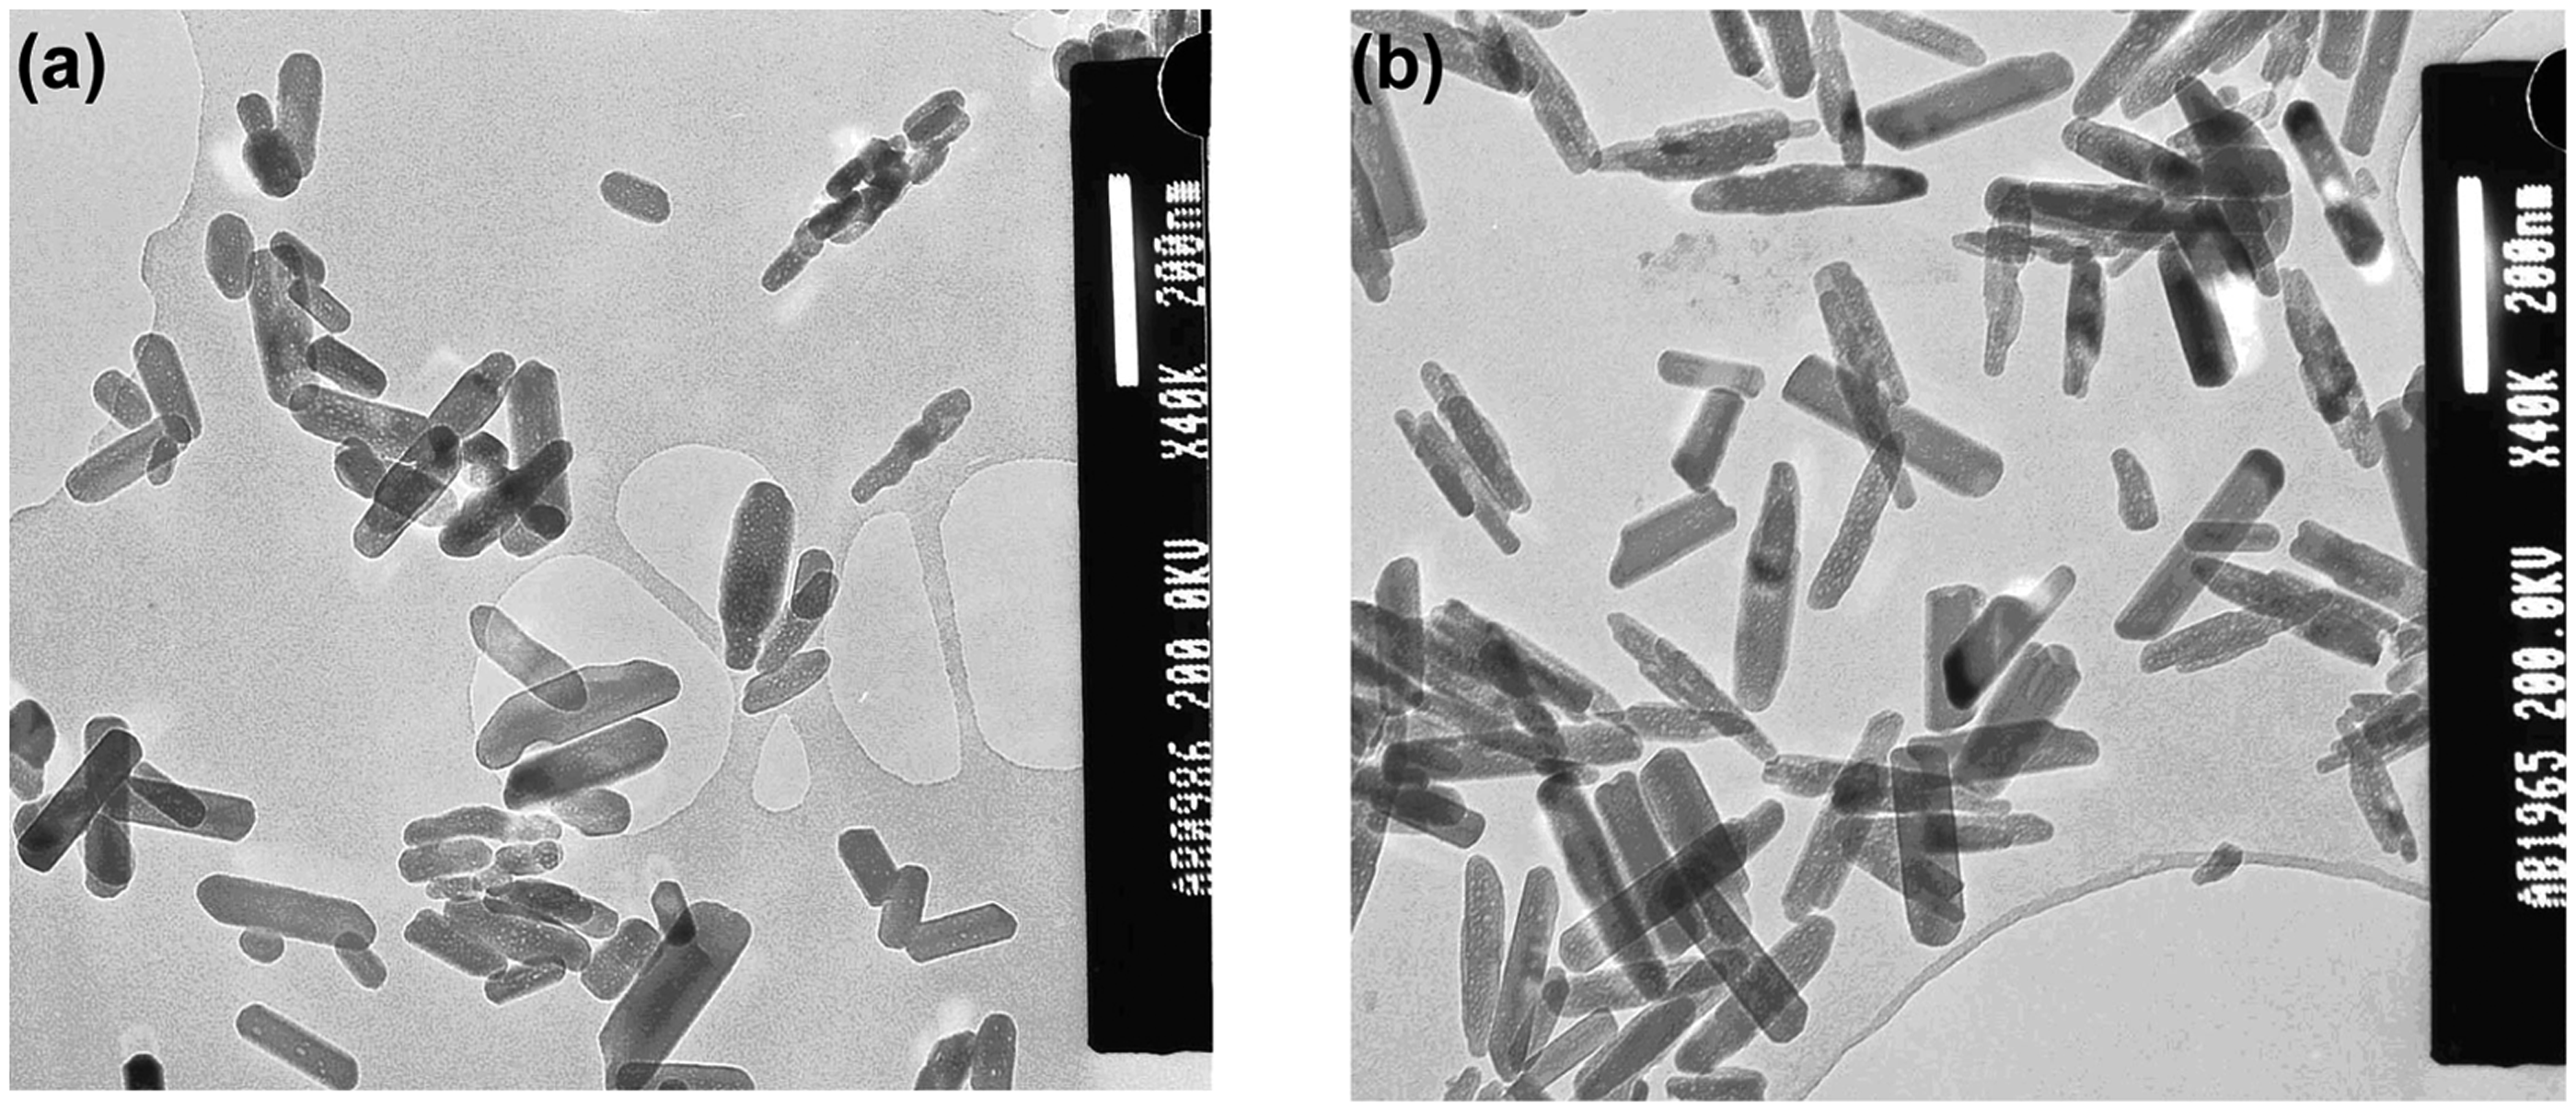
Silicate (
)-substituted calcium phosphate
Sample IDs, expected wt% of silicon, x values (according to Ca10(PO4)6 -x (SiO4) x (OH)2 -x ) and corresponding amounts of reagents used.
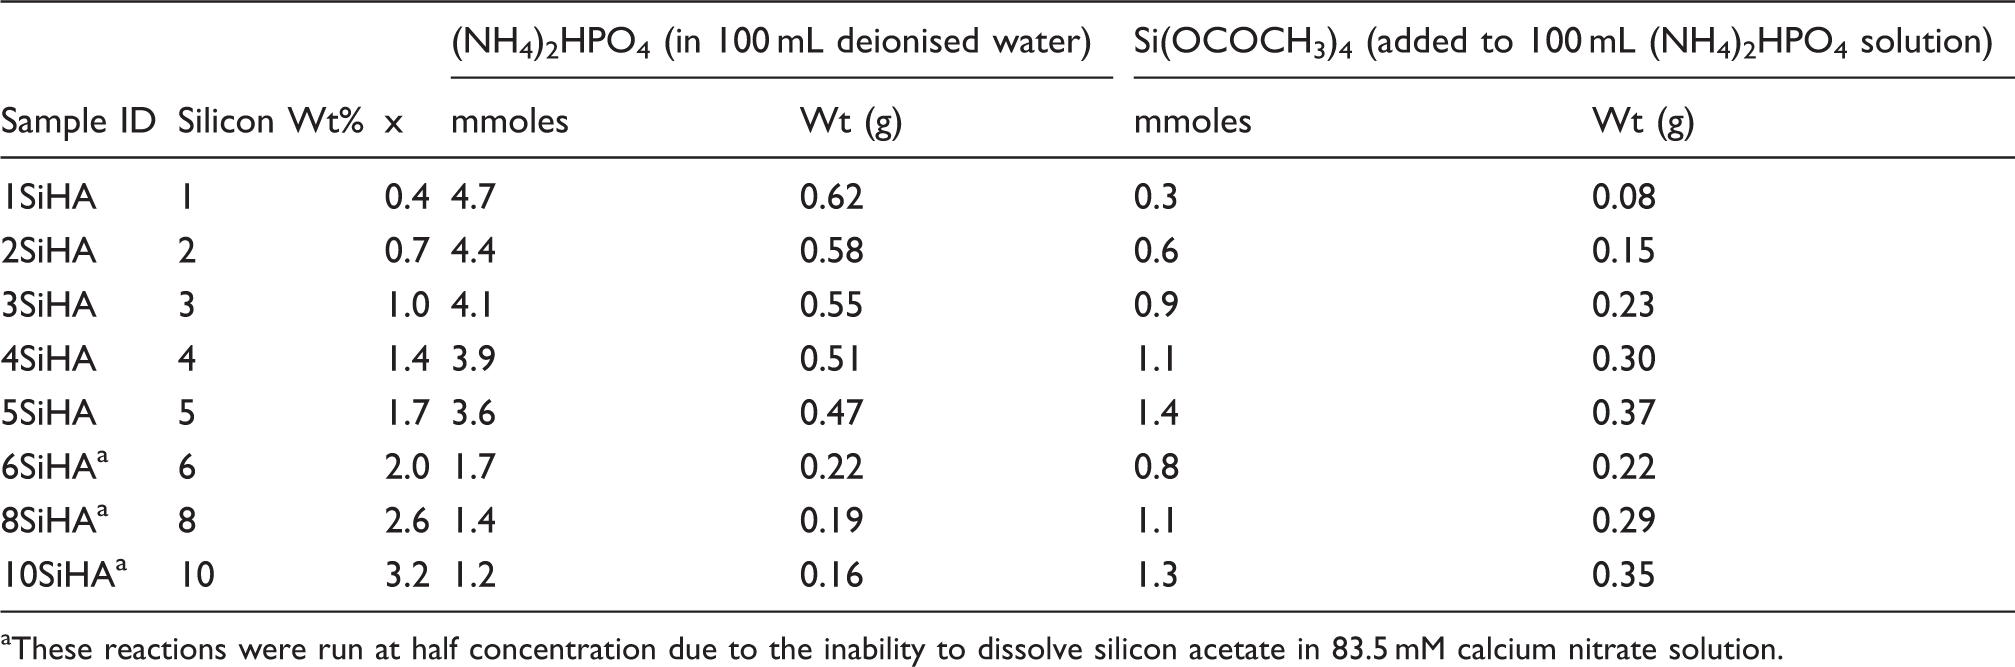
These reactions were run at half concentration due to the inability to dissolve silicon acetate in 83.5 mM calcium nitrate solution.
A similar CHFS system (as used for carbonate substitution, Figure 1) was used for these reactions and pump rates of 10.0, 5.0 and 5.0 mL/min were used for superheated water feed, combined calcium nitrate/silicon acetate feed and diammonium hydrogen phosphate solutions, respectively. A Ca:[
Results and discussion
TEM was carried out to determine particle size and morphology. Figure 2(a) for sample 7.5CO3-HA shows rods of size ∼146 (±77) × 50 (±18) nm (aspect ratio ∼2.92, 50 particles sampled). Deviation from strict rod-like shape of particles of HA as reported in the previous study, was evident.
68
The particle size was further reduced with increasing carbonate content, from ∼109 (±34) × 41 (±10) nm in Figure 2(b) for sample 15.7CO3-HA (aspect ratio ∼2.7, 50 particles sampled) to ∼64 (±34) × 27 (±8) nm in Figure 2(c) for sample 24.6CO3-HA (aspect ratio ∼2.4, 50 particles sampled). The cube-like morphology of some particles in Figure 2(c) was similar to that of calcium carbonate (calcite) as reported in a previous TEM investigation.
75
STA data showing DSC (dotted line) and TGA (solid line) plots for samples: (a) 7.5CO3-HA, and (b) 24.6CO3-HA.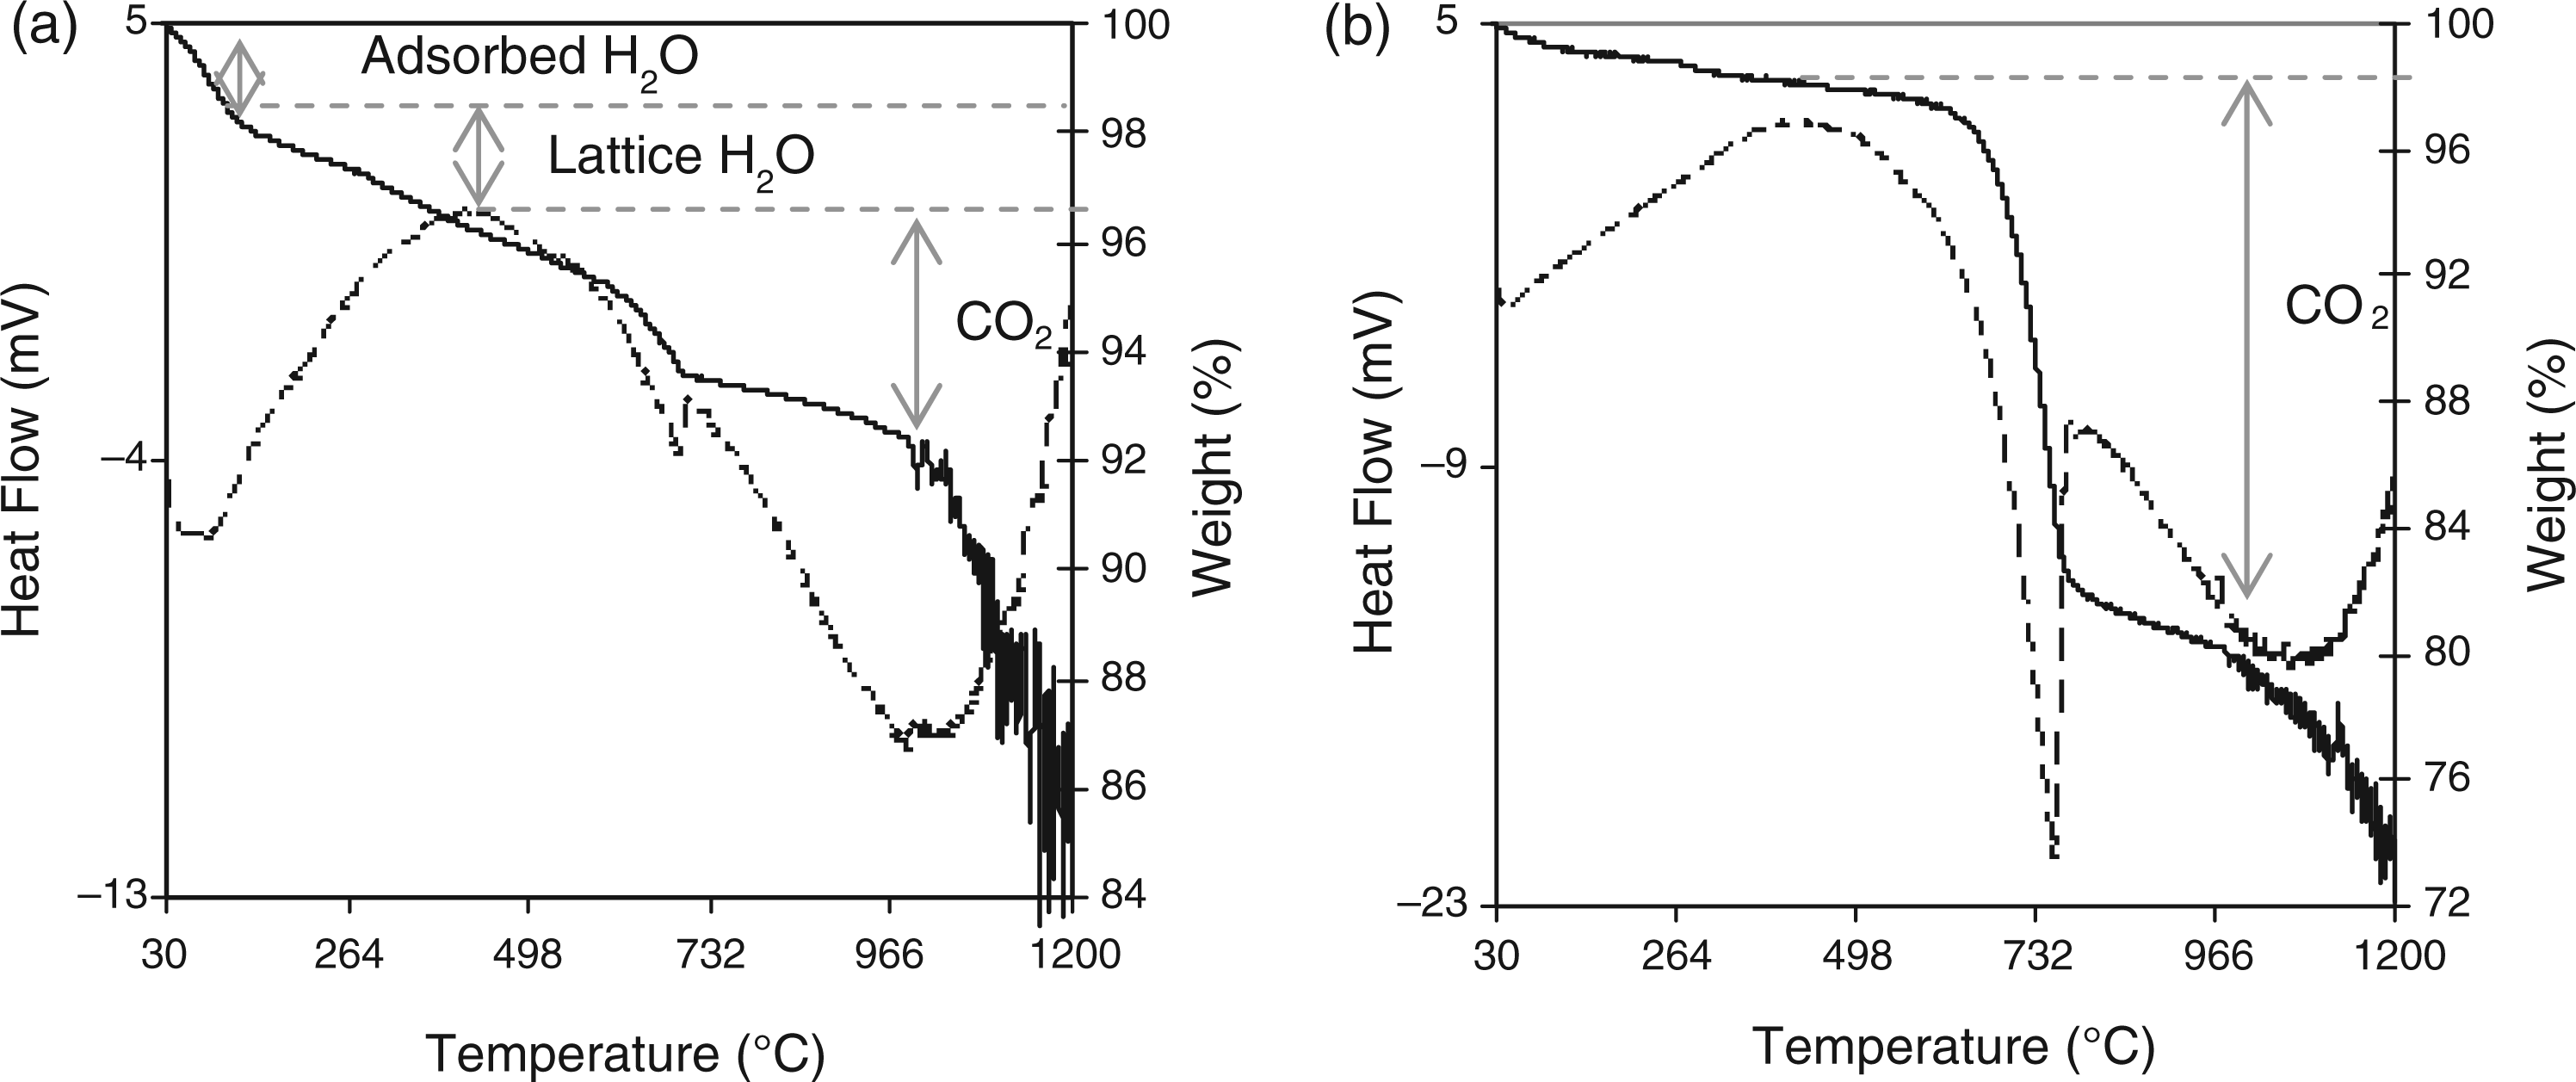
TEM was also carried out to assess the effect of silicon substitution in HA on particle morphology and size. Figure 3(a) and (b) shows TEM images of HA (synthesis reported earlier
68
) [∼140 (±58) × 40 (±12), aspect ratio 3.5] and sample 5SiHA (∼184 (±28) × 41 (±7) nm, aspect ratio 4.4, 50 particles sampled), respectively. It was observed that the presence of silicon slightly increased the particle size (aspect ratio changes from ∼3.5 to 4.4), narrows the size distribution (lower standard deviations) as compared to HA and makes the nanorods less defined on its growing edges. The TEM investigation suggested opposite effects of presence of carbonate ions as compared to that of silicate ions in solution on particle size and morphology. BET surface area of carbonate and silicate substituted samples as function of substitution levels.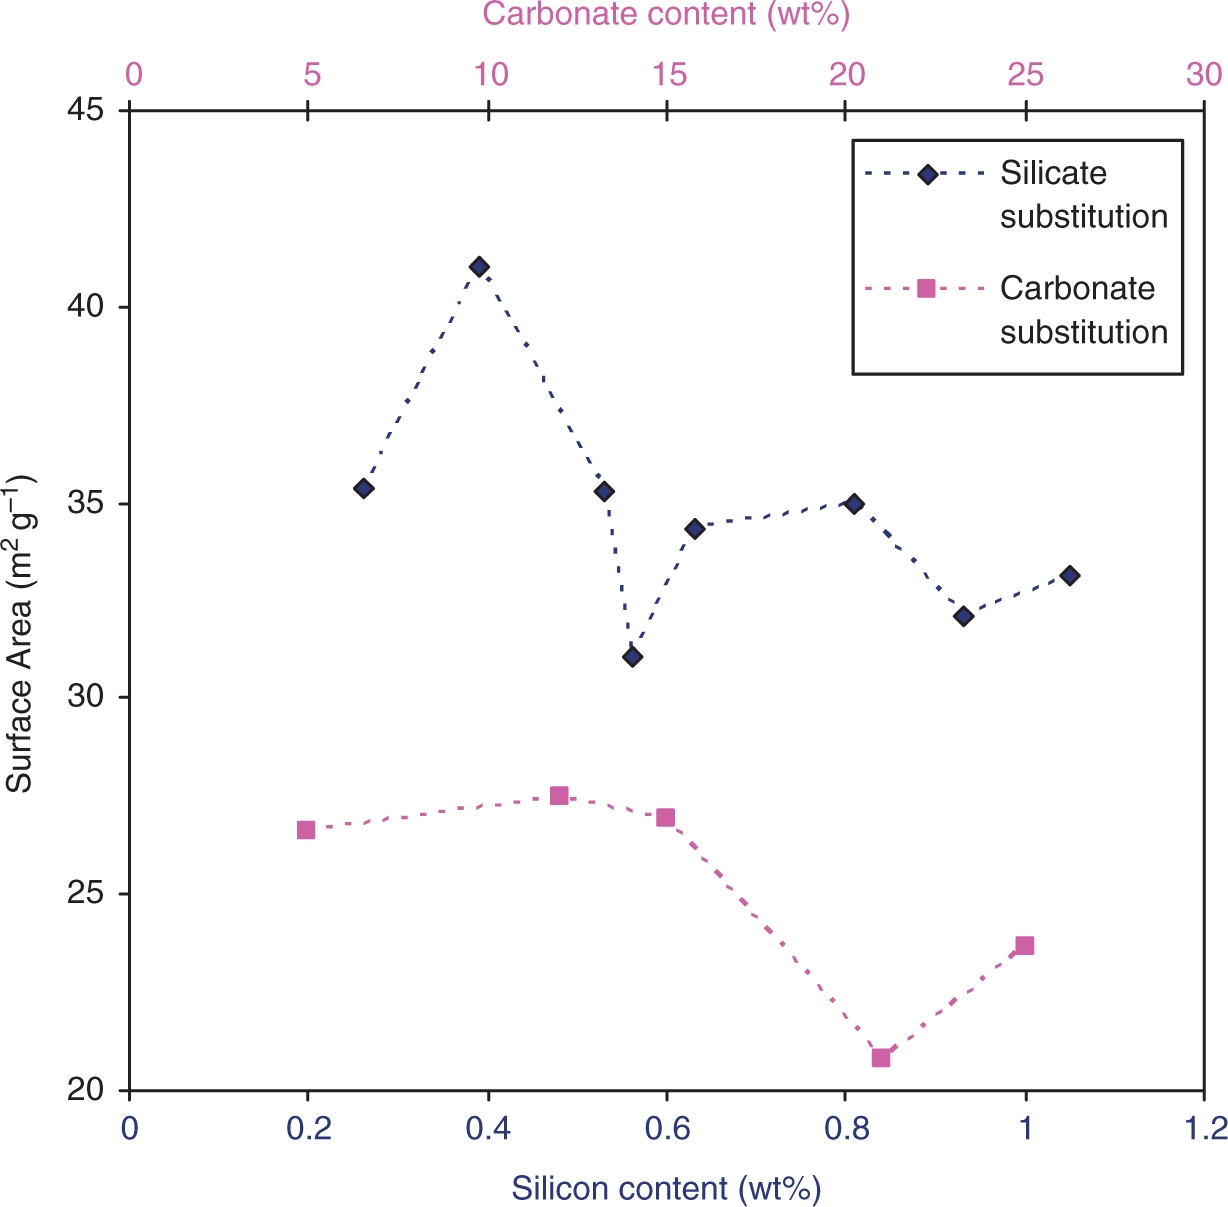
The Ca:P molar ratio of sample 7.5CO3-HA was determined to be ∼1.45 (±0.04) using an EDX detector attached to a SEM (each area is averaged from 5 measurements). The elemental compositions for carbonate-substituted samples are reported in Supplementary Data Table 1 (later found out to be biphasic mixtures). Carbonate contents were determined using simultaneous TGA and DSC. The corresponding plots for samples 7.5CO3-HA and 24.6CO3-HA are shown in Figure 4. TGA and DSC plots for remaining carbonate-substituted samples are reported in Supplementary Data Figure 1. The TGA and DSC plots for sample 7.5CO3-HA shown in Figure 4(a) showed three overlapping regions of weight loss at 30–200℃ (2.2 wt%), 200–460℃ (1.7 wt%) and 460–990℃ (3.7 wt%). Thereafter there was a sudden weight loss (8.2 wt%) up to 1200℃ to give a final weight loss of 15.8 wt%. The first weight loss was presumably due to loss of weakly associated water, whilst the loss of lattice water and CO2 occur for the second and third weight losses respectively. Decomposition accounted for the weight loss after 990℃. X-ray diffraction patterns of samples: (a) 7.5CO3-HA; (b) 11.5CO3-HA; (c) 15.7CO3-HA; (d) 20CO3-HA; and (e) 24.6CO3-HA.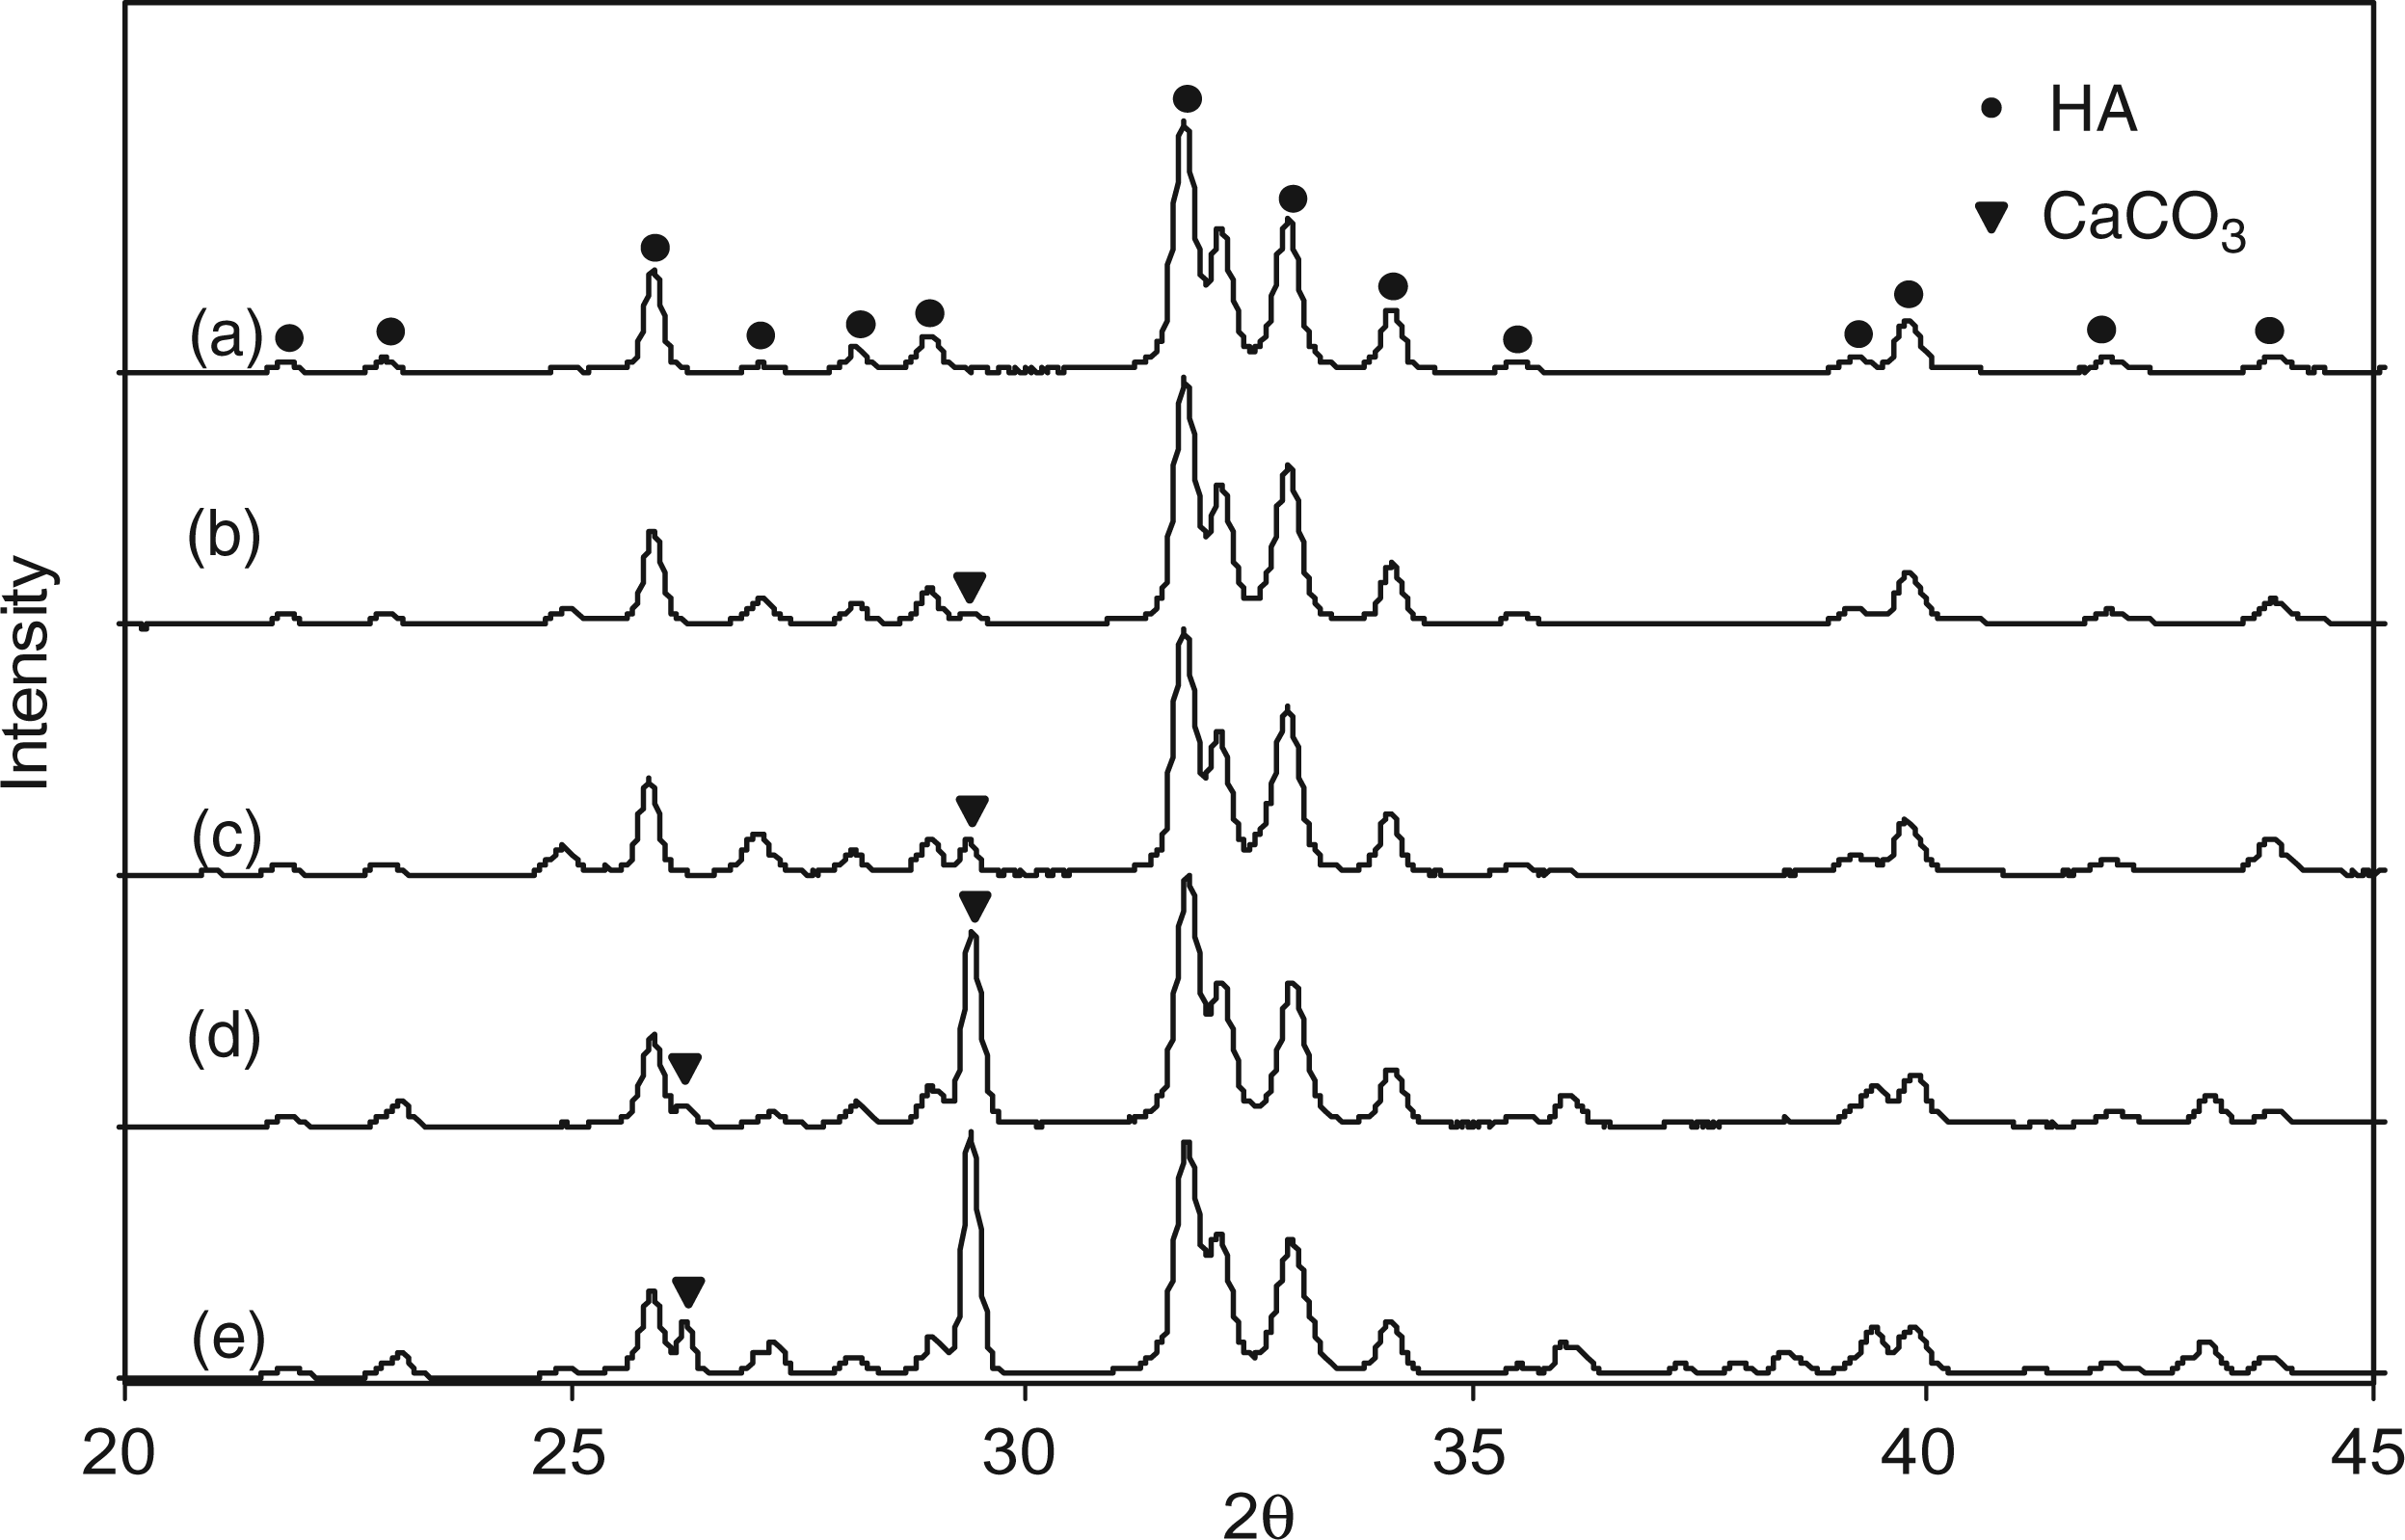
Expected and measured carbonate content (determined using TGA) of carbonate substituted samples.
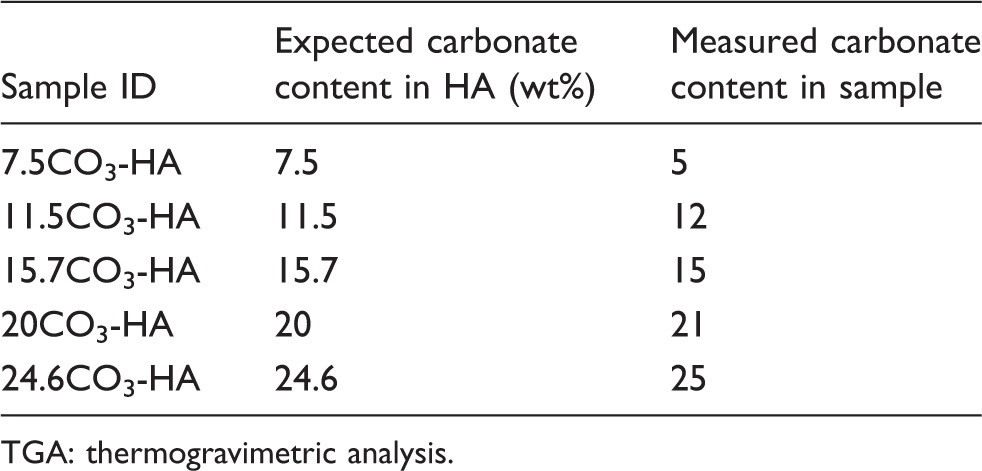
TGA: thermogravimetric analysis.
Silicon content (as an average of 10 area scans on EDX) and corresponding yields.

EDX: Energy-dispersive X-ray spectroscopy.
Figure 5 shows the variation in surface areas with increasing carbonate content (determined using TGA) for carbonate-substituted samples. There was little or no change in surface area with increase in urea content with all the surface areas falling in the range 20.8–27.5 m2/g. Although the TEM images in Figure 2(a) to (c) revealed decreasing crystallite size with increase in urea in solution, it was also observed that the particles appeared to be more agglomerated and less distinct (Figure 2(c)). This might account for the slight decrease in surface area witnessed for samples 20CO3-HA and 24.6CO3-HA. X-ray diffraction patterns of sample 7.5CO3-HA heat treated at: (a) 730℃; (b) 850℃; and (c) 990℃.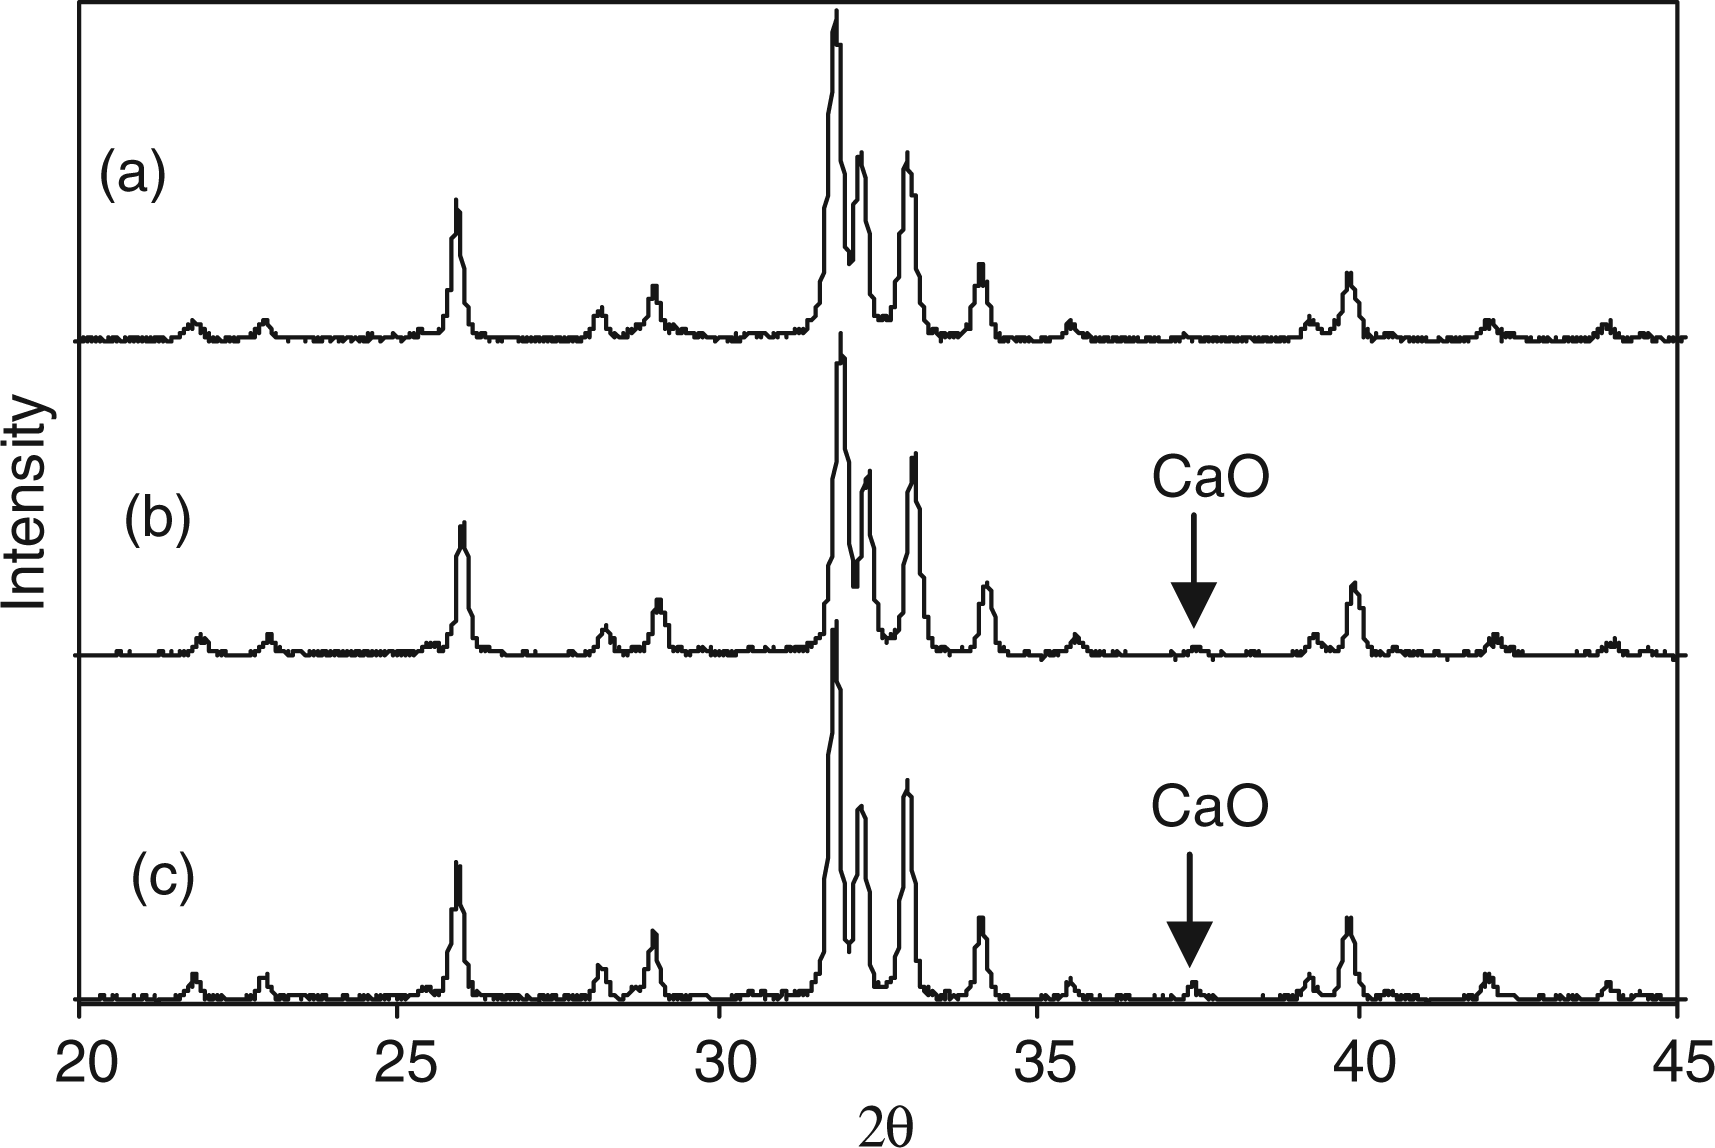
Figure 5 also shows the variation in surface areas with silicon content in silicate-substituted samples. It was observed that the surface area increases slightly for sample 2SiHA (41 m2/g) but overall remains relatively unchanged in the range 31.1–35.4 m2/g. This result suggested that the amount of silicon substituting into HA was not too different for all samples. Indeed, this was confirmed by elemental analysis shown in Table 4.
Powder X-ray diffraction data was collected for all samples in order to analyse the effect of carbonate and silicate substitution on crystallinity and phase-purity. XRD pattern for sample 7.5CO3-HA in Figure 6(a) gave a good match to line pattern for phase-pure HA (ICDD pattern 09-0432). XRD pattern in Figure 6(b) shows the on-set of formation of calcium carbonate (compared to ICDD pattern 47-1473, calcite) in sample 11.5CO3-HA. With increasing carbonate content, it was seen in Figure 6(c) (for sample 15.7CO3-HA) and Figure 6(d) (for sample 20CO3-HA) that the peaks corresponding to calcium carbonate (calcite) increased in intensity. Peaks at 31.8° and 32.2°, corresponding to HA, became broader with increasing carbonate content, the peaks in Figure 6(e) for sample 24.6CO3-HA being clearly less distinct as compared to Figure 6(a) for sample 7.5CO3-HA. This was possibly due to decrease in particle size (as seen in TEM images) and crystallinity. X-ray diffraction patters for samples: (a) 1SiHA; (b) 2SiHA; (c) 3SiHA; (d) 4SiHA; (e) 5SiHA; (f) 6SiHA; (g) 7SiHA; and (h) 8SiHA.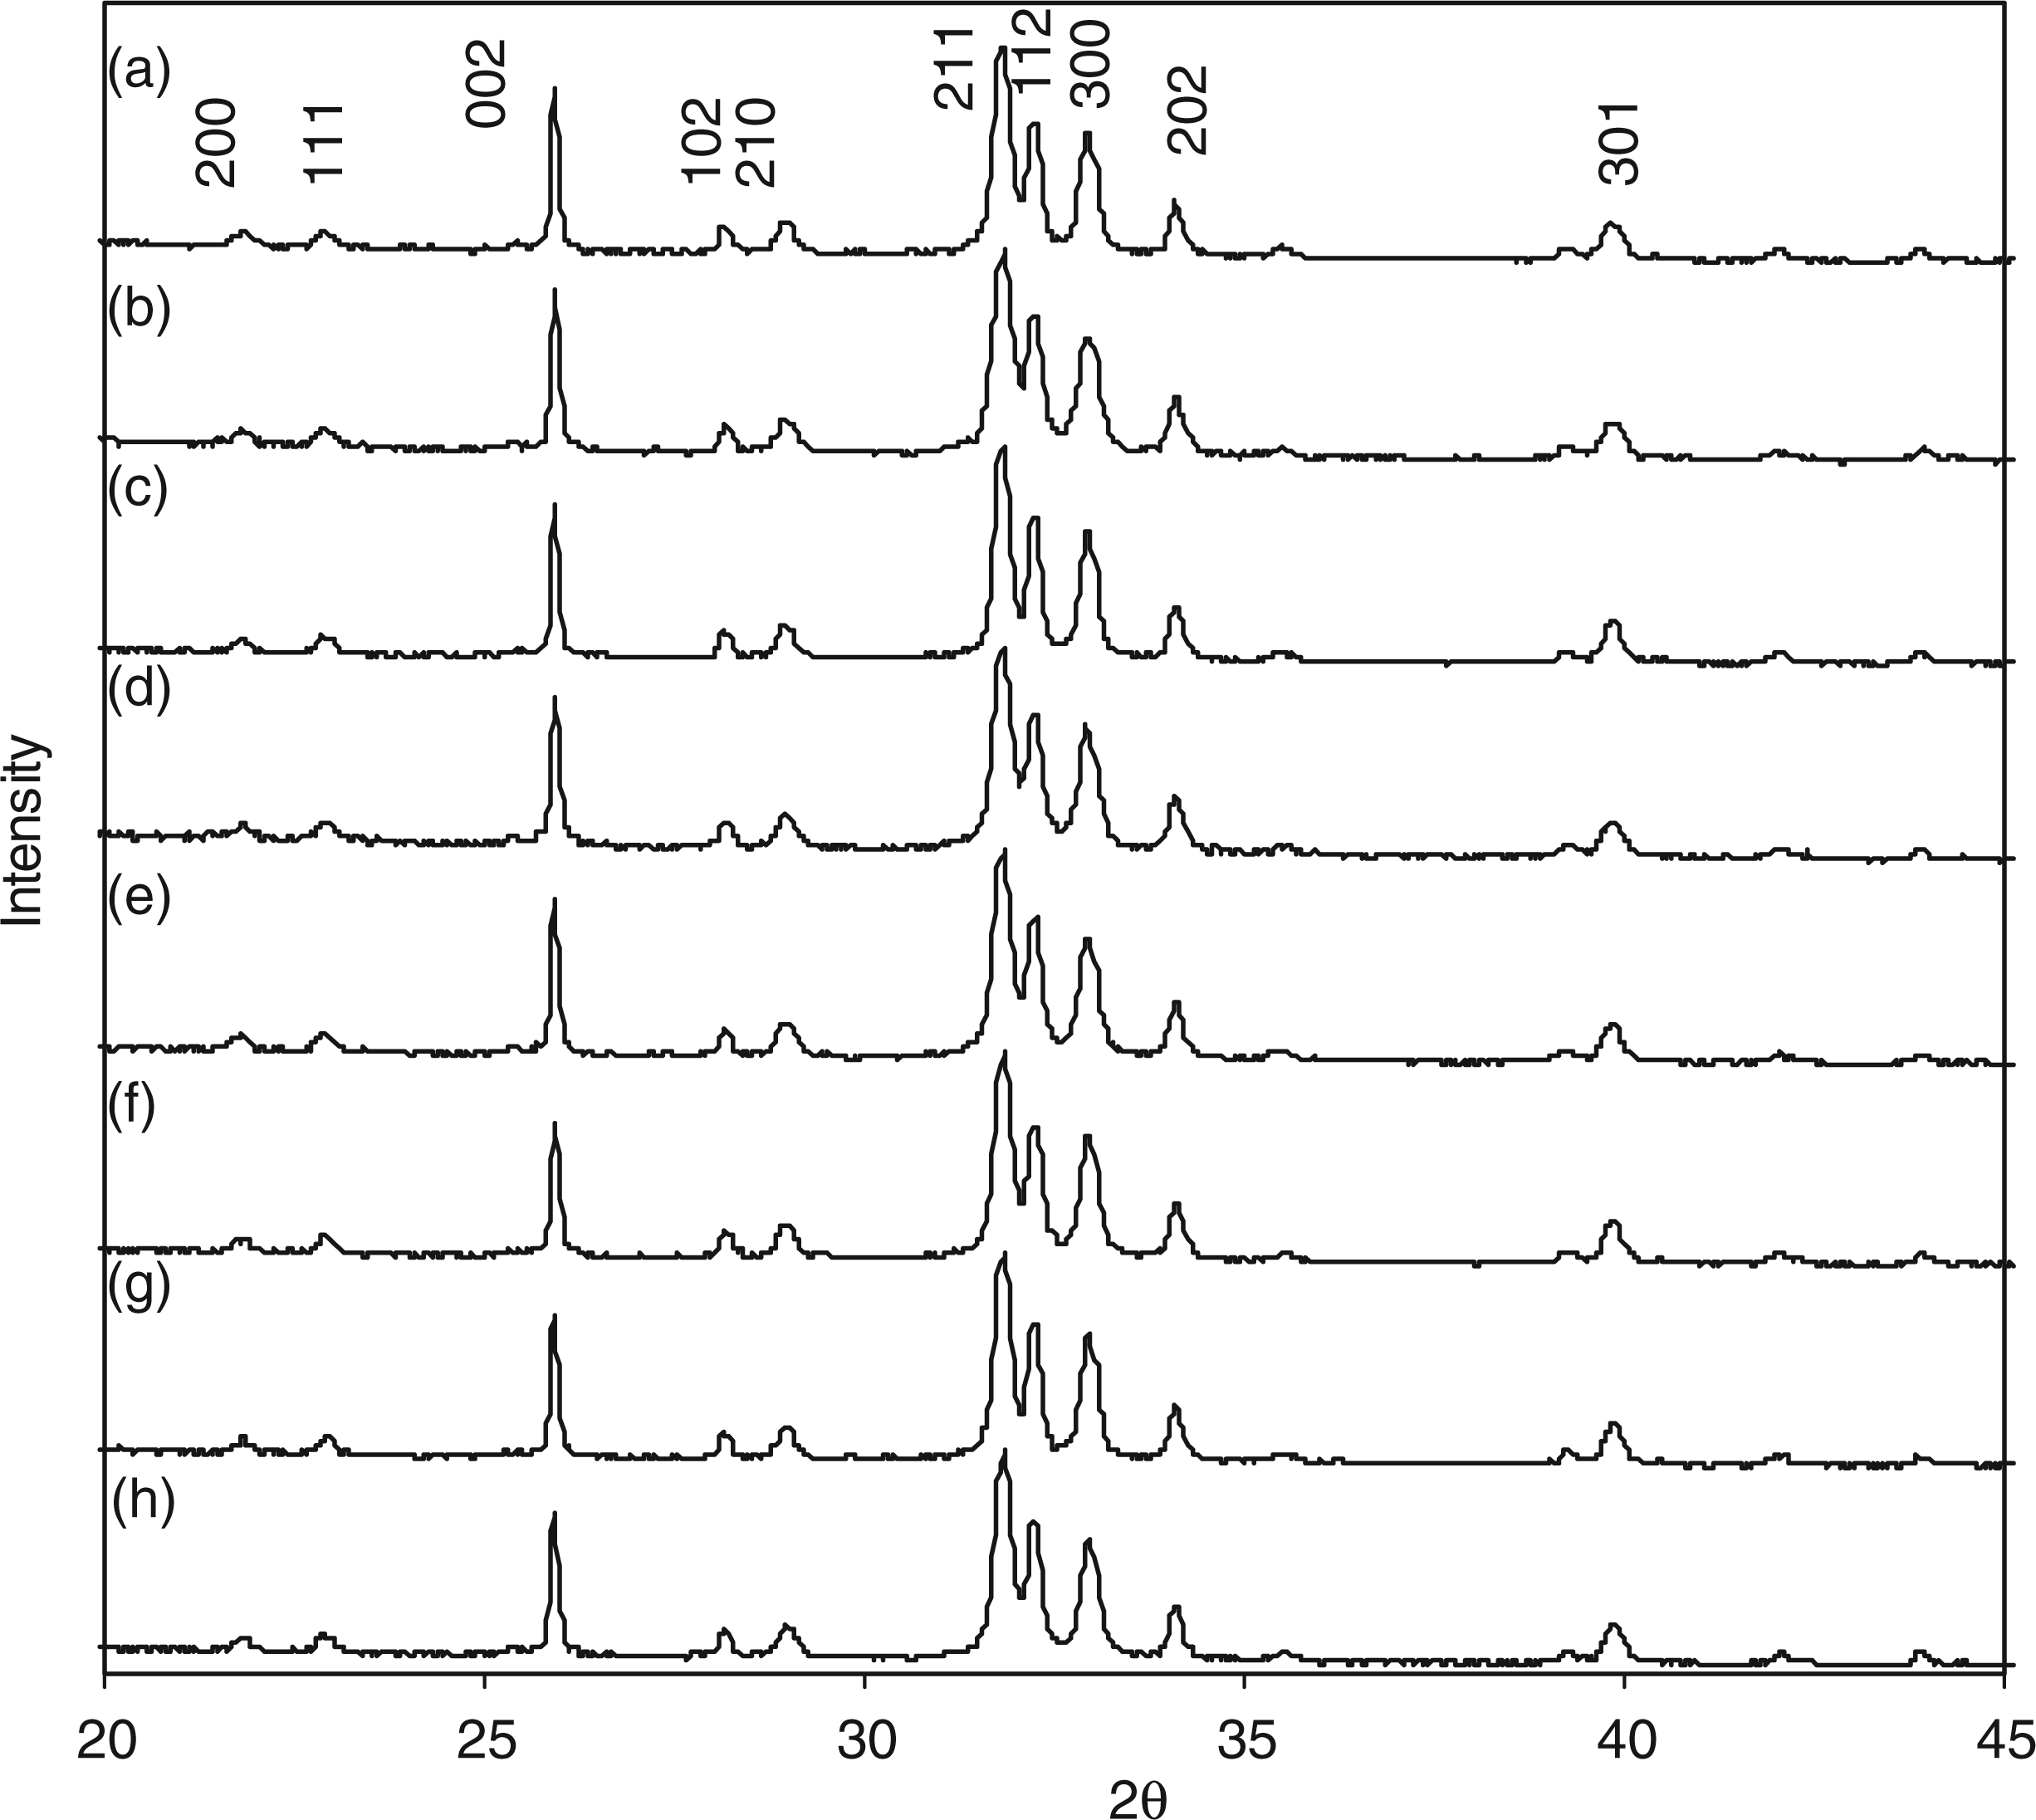
Figure 7 shows the XRD patterns of sample 7.5CO3-HA heat treated at 730℃, 850℃ and 990℃ for 1 h. These temperatures were chosen from the corresponding TGA plot of the same sample. As compared to Figure 6(a) peaks corresponding to HA in Figure 7 were understandably sharper (due to crystallisation upon heating). Heat treatment at 730℃ resulted in phase-pure crystalline HA (Figure 7(a)). This confirmed that the corresponding weight loss in the TGA plot shown in Figure 4(a) was not due to any thermal decomposition and correctly represented CO2 loss. However, heat treatment at 850℃ and 990℃ resulted in appearance of a small peak of calcium oxide (compared to ICDD pattern 37-1497). This was due to thermal decomposition of calcium deficient HA lattice for sample 7.5CO3-HA. Raman spectroscopy data for the range 1200–400 cm−1 for samples: (a) 7.5CO3-HA; (b) 11.5CO3-HA; (c) 15.7CO3-HA; (d) 20CO3-HA; and (e) 24.6CO3-HA.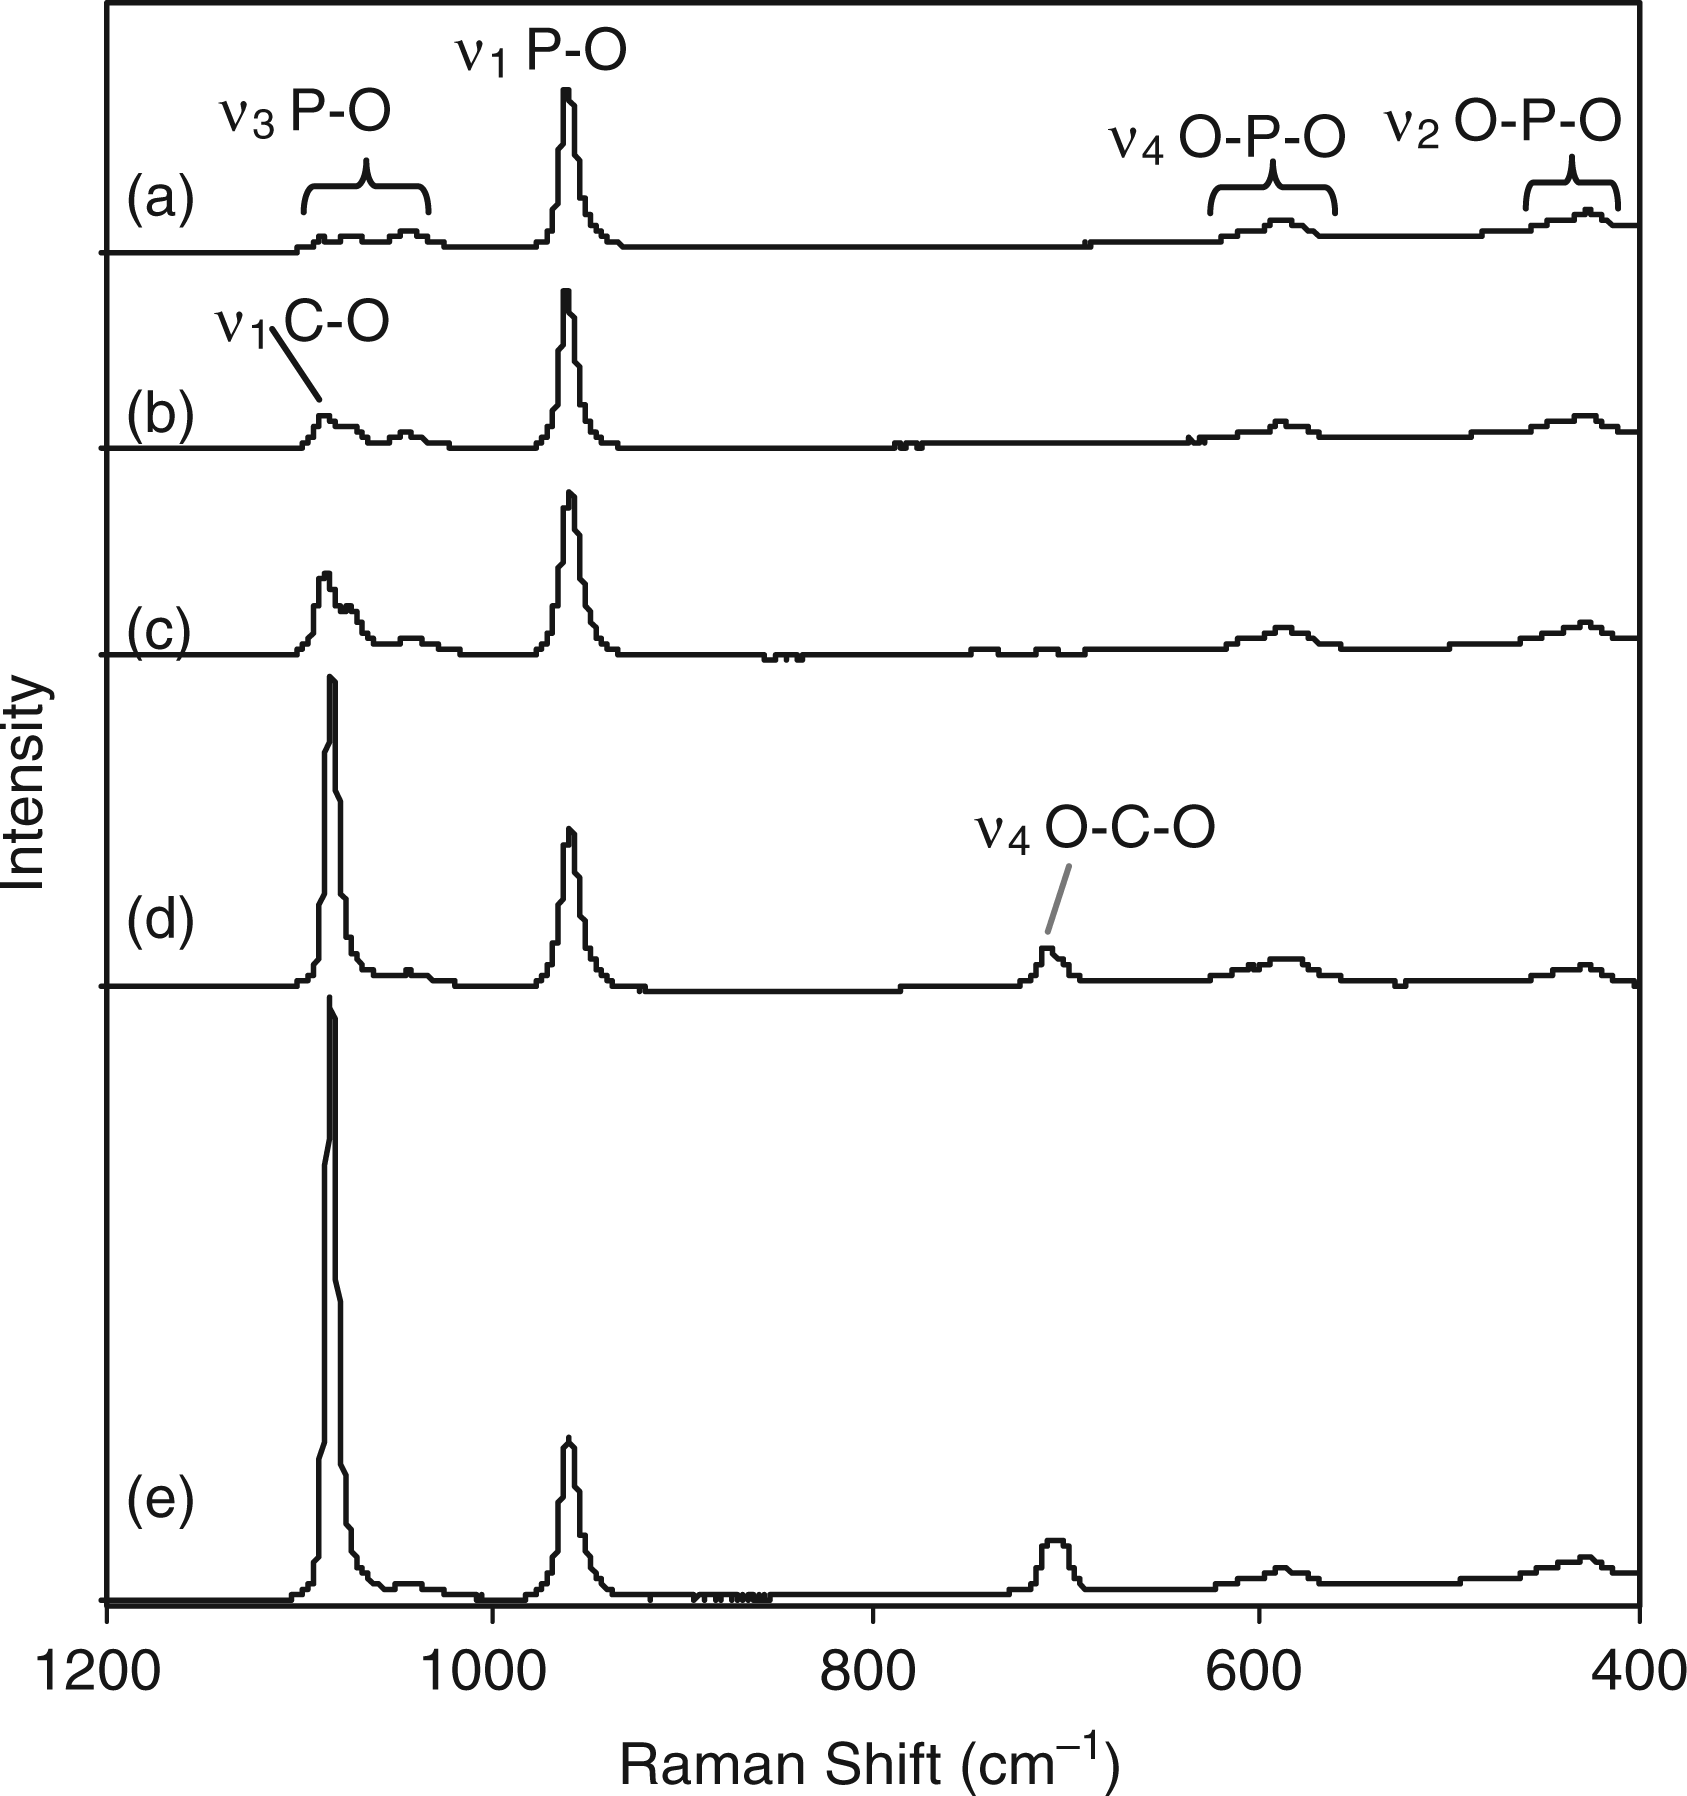
All XRD patterns for silicate-substituted samples in Figure 8 gave a good match to JCPDS pattern 09-432, corresponding to crystalline HA. Figure 8(a) to (h) revealed no visible effect of increasing silicon content on phase-purity or crystallinity of the HA phase. This result and the decrease in percentage yield from 77% (for sample 1SiHA) to 33% (for 10SiHA) suggested that the progressive addition of the silicate precursor gave increasingly lower yields and reached a maximum substitution level under such CHFS conditions used herein. The main crystallographic planes (hkl) are also marked on the corresponding peaks in Figure 8. Raman spectroscopy data in the range 1200–400 cm−1 for samples: (a) 1SiHA; (b) 2SiHA; (c) 3SiHA; (d) 4SiHA; (e) 5SiHA; (f) 6SiHA; (g) 8SiHA; and (h) 10SiHA.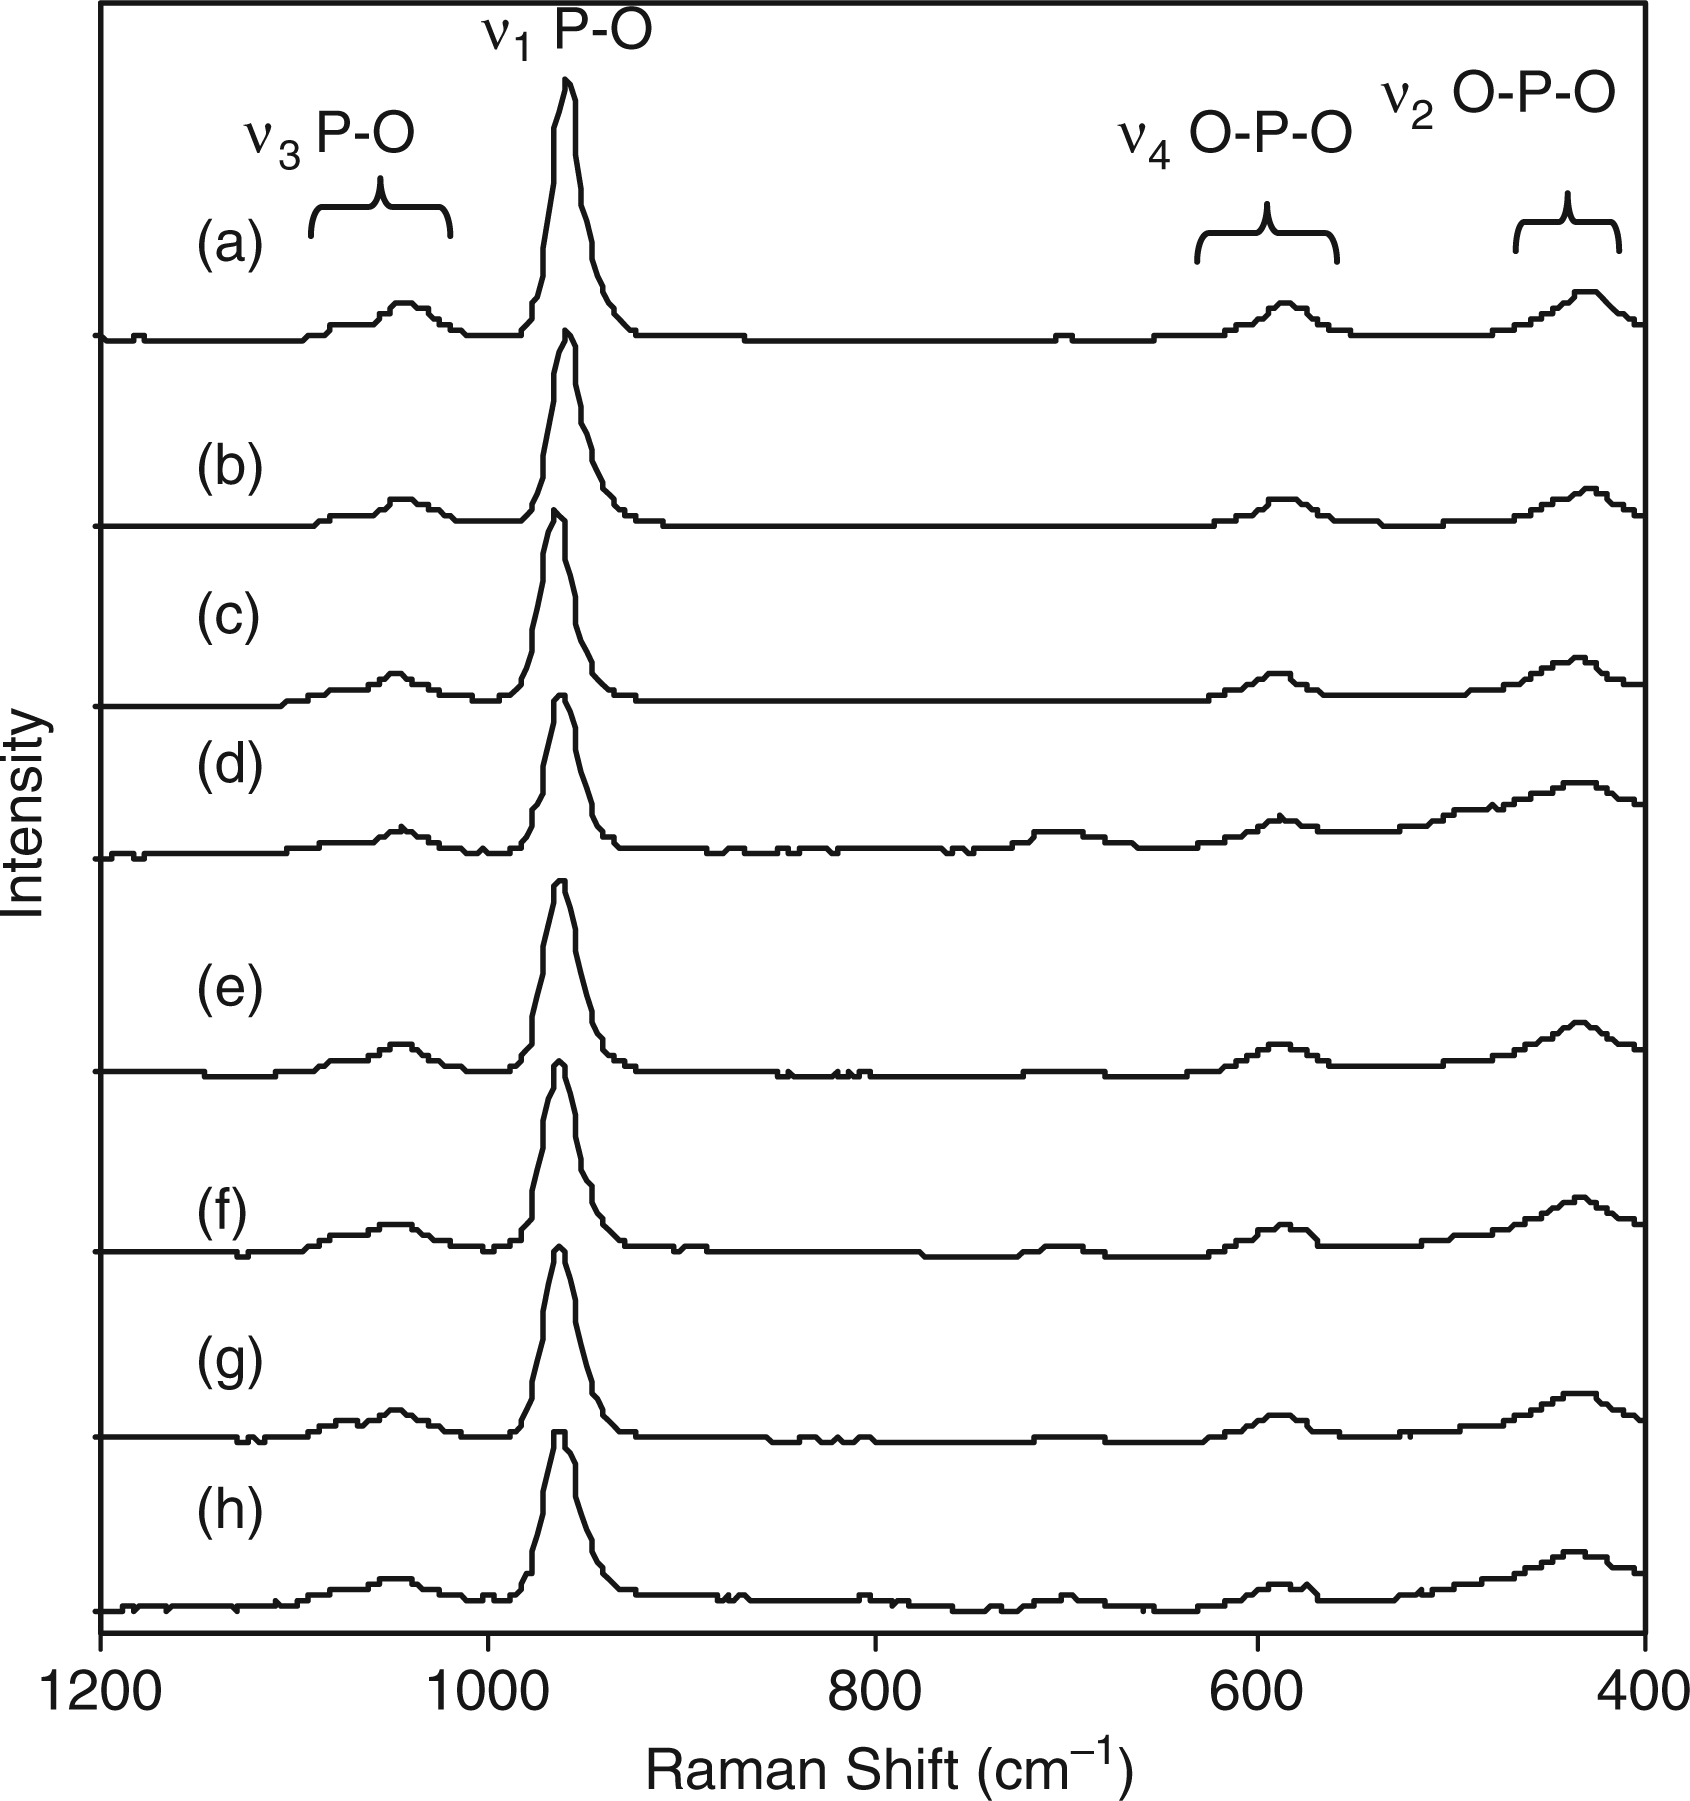
Raman spectroscopy was carried out in order to reinforce crystallographic observations and assess phase purity. Figure 9 shows Raman spectra for all the carbonate-substituted samples. In Figure 9(a) for sample 7.5CO3-HA the very weak peak at 1090 cm−1 corresponded to asymmetric stretching (ν1) of the C–O bond in carbonate from calcium carbonate (calcite).
76
However, this was not observed in the corresponding XRD pattern, shown in Figure 6(a). This suggested that this peak might be due to asymmetric stretching (ν3) of the P–O bond in phosphate. The increase in the intensity of peak at 1090 cm−1 in Figure 9(a) to (e) was due to an increase in calcium carbonate content, as confirmed by analogous XRD data. Peaks at 1072 and 1048 cm−1 corresponded to asymmetric stretching (ν3) of the P–O bond in phosphate. The peak at 1072 cm−1 may also represent symmetric stretching (ν1) of the C–O bond in carbonate.77,78 With an increase in carbonate content it was observed that the peak at 1072 cm−1 increased in intensity (for samples 7.5CO3-HA, 11.5CO3-HA and 15.7CO3-HA in Figure 9(a) to (c), respectively). This peak was partially obscured by the peak at 1090 cm-1 for samples 20CO3-HA and 24.6CO3-HA as shown in Figure 9(d) and (e), respectively. In Figure 9(a), peak at 961 cm−1 corresponded to the symmetric stretching mode (ν1) of the P–O bond in phosphate, whilst peaks at 606 cm−1, 593 cm−1 and 581 cm−1 corresponded to ν4 bending modes of the O–P–O linkage in phosphate. The peaks at 444 cm−1 and 435 cm−1 corresponded to ν2 bending modes of the O–P–O linkage in phosphate. The appearance of a weak peak at 712 cm−1 in Figure 9(d) and (e) was possibly due to bending mode (ν4) of the O–C–O linkage in carbonate from larger amounts of calcite present in samples 20CO3-HA and 24.6CO3-HA.
76
FTIR data for ranges (i) 3800–2800 cm−1 and (ii) 2000–400 cm−1 for samples: (a) 7.5CO3-HA; (b) 11.5CO3-HA; (c) 15.7CO3-HA; (d) 20CO3-HA; and (e) 24.6CO3-HA.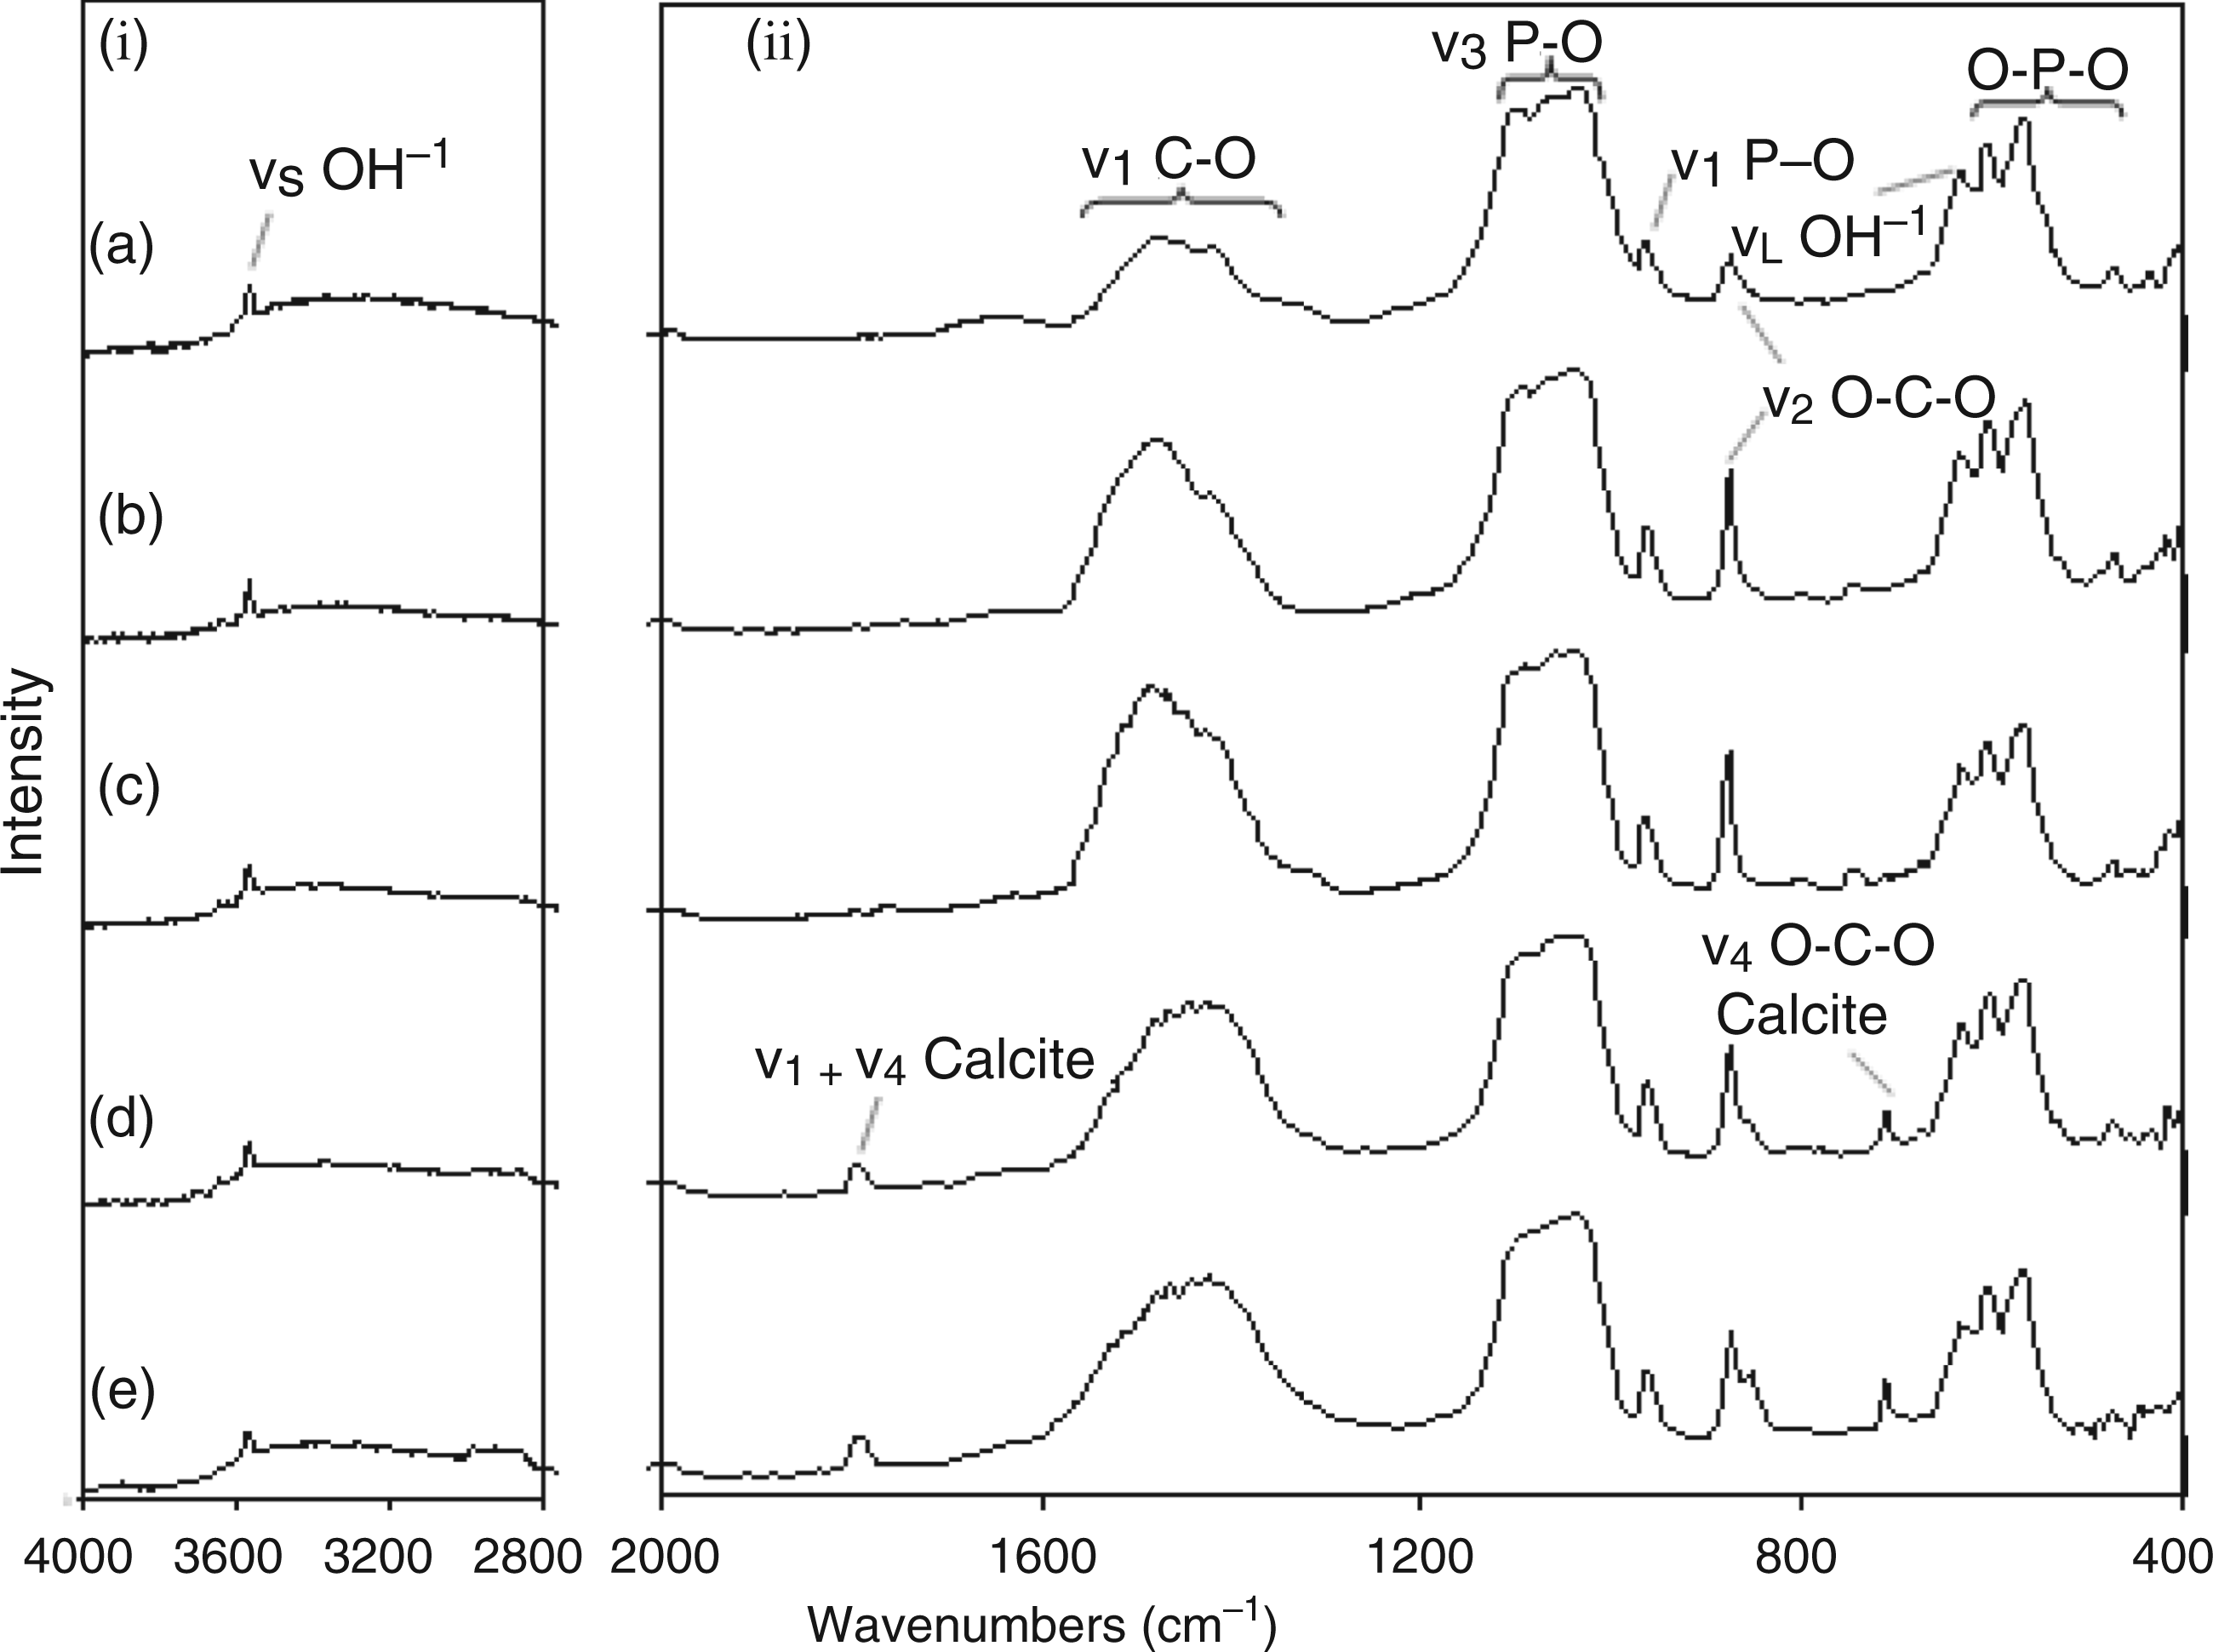
Raman spectra for all silicon-substituted samples are shown in Figure 10. Figure 10(a) showing the Raman spectrum for sample 1SiHA revealed peaks at 1080 cm−1 and 1049 cm−1 attributed to asymmetric stretching (ν3) of the P–O bond in phosphate. The peak around 960 cm−1 corresponded to the symmetric stretching mode (ν1) of the P–O bond in phosphate (as in the case with carbonate-substituted samples). Peaks at 595 and 438 cm−1 corresponded to the ν4 and ν2 bending, respectively, of the O–P–O linkage in phosphate. No change was observed in Figure 10(a) to (h) with increasing silicon content in solution. FTIR spectroscopy data for samples (a) 1SiHa; (b) 2SiHa; (c) 3SiHa; (d) 4SiHa; (e) 5SiHa; (f) 6SiHa; (g) 8SiHa; (h) 10SiHa.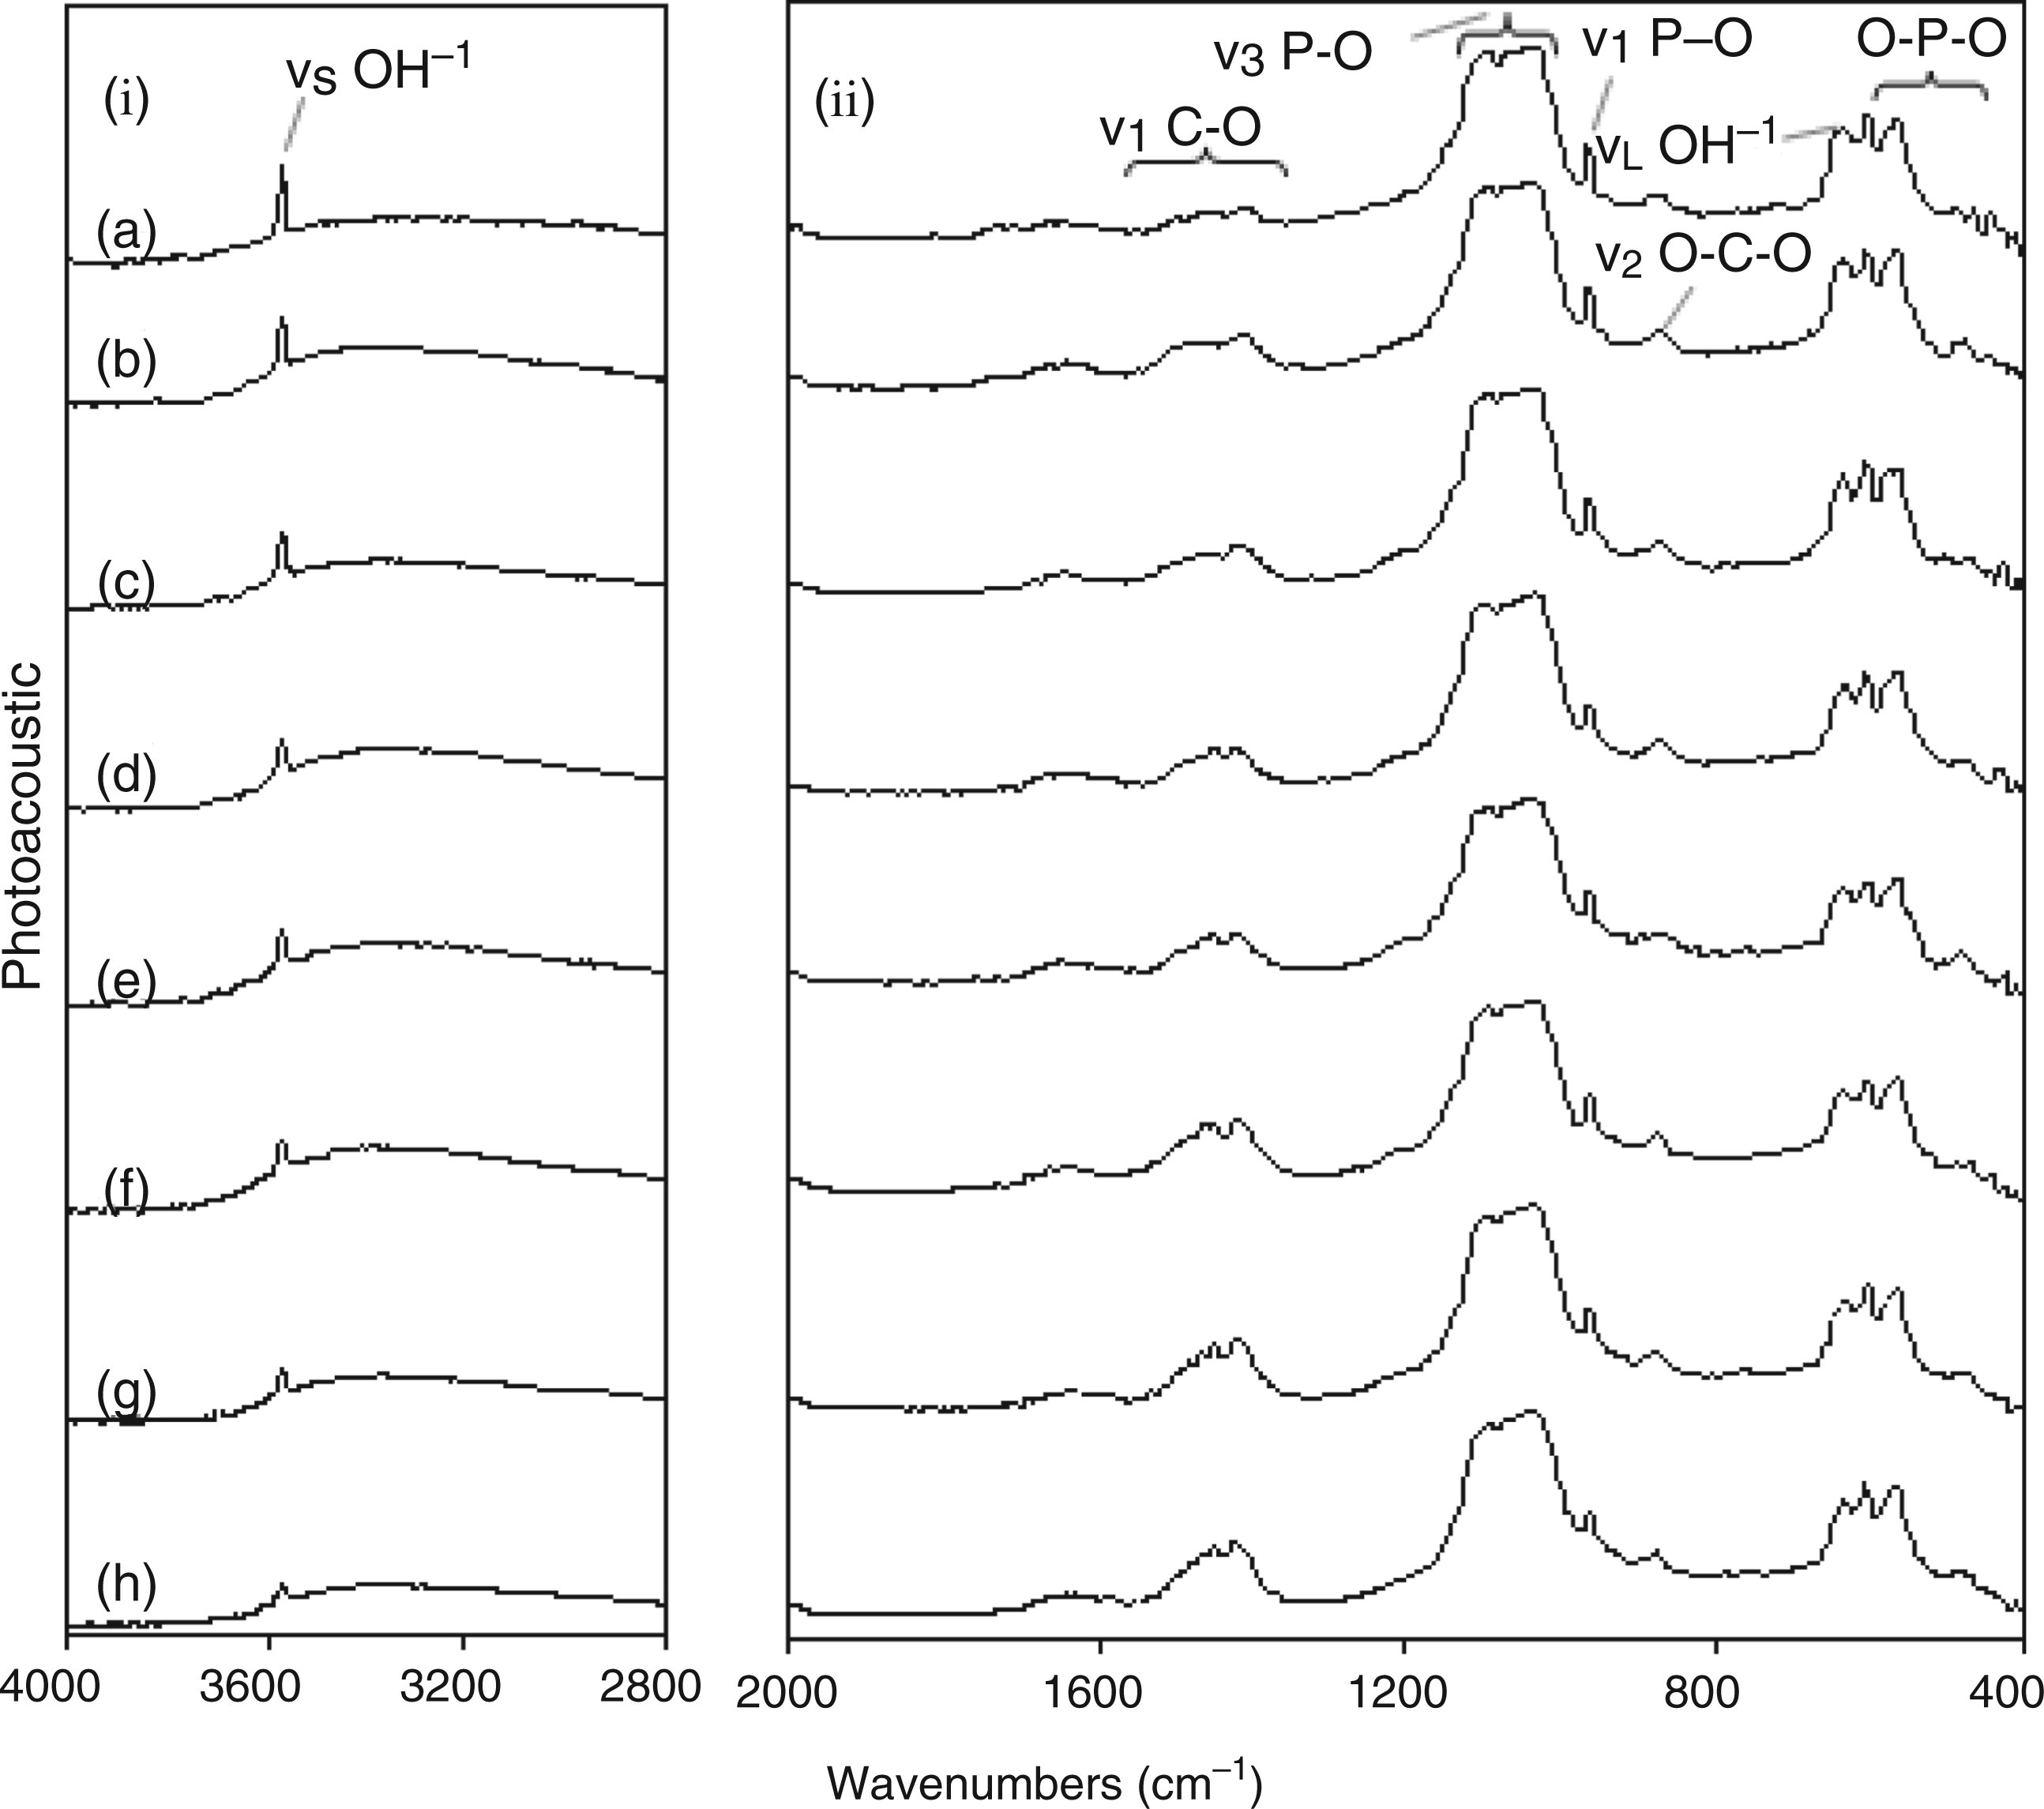
FTIR spectroscopy was carried out on all carbonate- and silicate-substituted samples in order to aid observations made using XRD and Raman spectroscopy. Figure 11 shows the FTIR spectra of the carbonate-substituted samples. In Figure 11(a) for sample 7.5CO3-HA, peaks at 3570 and 633 cm−1 corresponded to stretching mode (vs) and liberational mode (νL) of the hydroxyl group in a HA lattice. The bands in the range 1590–1300 cm−1 corresponded to asymmetric stretching (ν3) of the C–O bond of carbonate in both A- and B-type carbonate substitutions in HA. However given the fact that CHFS is a wet chemical method, B-type carbonate substitution was expected (where carbonate ions are substituted for phosphate ions in the HA lattice). This is also supported by the observation that the peak at 3570 cm−1 did not diminish with an increase in urea concentration in the reagent solution suggesting that carbonate substitution for hydroxyl groups in the HA lattice does not take place. With an increase in urea concentration there was an increase in the intensity of the bands in the range 1590–1300 cm−1, corresponding to carbonate asymmetric stretching (Figure 11(a) and (b) representing samples 7.5CO3-HA and 11.5CO3-HA, respectively]. This may be due to increased carbonate substitution into the HA lattice and/or appearance of calcite. The band 1090–1030 cm−1 corresponded to asymmetric stretching modes (ν3) of the P–O bond in phosphate. Peak at 961 cm−1 corresponded to the symmetric stretching mode (ν1) of the P–O bonds of phosphate. In Figure 11(a) the peak at 876 cm−1 corresponded to the bending mode (ν2) of the O–C–O linkage in carbonate. This peak showed a marked increase in intensity with an increase in amount of urea concentration in solution as witnessed in Figures 11(b) to (e). Peaks at 603 cm−1, 568 cm−1 and 472 cm−1 in Figure 11(a) corresponded to bending modes of O–P–O linkages in phosphate. From the FTIR data it was observed that the carbonate peaks (1590–1300 cm−1 and 876 cm−1) reached their maximum intensity for 11.5CO3-HA in Figure 11(b). Any further increase in amount of urea concentration in reagent solutions contributed to more formation of calcium carbonate as seen in analogous XRD and Raman data. In Figure 11(d), for sample 20CO3-HA, a peak appeared at 1793 cm−1 which has been reported to be due to presence of calcite. 79 Gunasekaran et al. 76 reported a peak at 1798 cm−1 for calcite and attributed it to a combination of asymmetric stretching (ν1) and bending (ν4) of bonds related to carbonate. Also, in the same spectrum, a shoulder appeared at 865 cm−1 which resolved into a peak for sample 24.6CO3-HA in Figure 11(e). This peak was attributed to the bending mode (ν2) of the O–C–O linkage in carbonate from calcite. 76 Peak at 713 cm−1 for samples 20CO3-HA and 24.6CO3-HA in Figure 11(d) and (e) corresponded to bending mode (ν4) of the O–C–O linkage in carbonate from calcite.
The FTIR spectrum for sample 1SiHA in Figure 12(a) revealed peaks similar to those observed for carbonate-substituted samples. However, the weak band in the range 1565–1380 cm−1 (corresponding to asymmetric stretching (ν3) of the C–O bond of carbonate in both A- and B-type carbonate substitutions in HA) was understandably much lower in intensity as compared to the intensity of the similar band seen in the FTIR spectrum of carbonate substitutes samples in Figure 11. The weak peak centred at ∼872 cm−1 due to the bending mode (ν2) of the O–C–O linkage in a small amount of carbonate which is present, was lower in intensity as compared to the similar peak observed at 876 cm−1 in Figure 11(a) (due to higher amount of carbonate ions present in carbonate-substituted samples). A notable difference from the FTIR spectrum seen in Figure 11 was that the OH−1 stretching peak at 3571 cm−1 decreased in intensity with increasing silicon substitution (Figure 12(a) to (h)). This confirmed that silicon was being substituted in the HA lattice in the form of silicate, 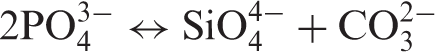
As we have reported earlier, the presence of carbonate peaks was unsurprising, as deionised water used in preparation of solutions and synthesis in the CHFS reactor was not degassed prior to use and may contain dissolved carbonate. 68
29
Si MAS-NMR result for sample 5SiHA is shown in Supplementary Data Figure 2. A range of environments were seen for silicon (−72.5, −91.1 and −99.2 ppm). The most intense peak at −72.5 comes from the silicate, Si(O−)4 environment (Q0) which corresponded to
Conclusions
In this work, the capability of the CHFS to synthesise substituted HA nanoparticles with tailorable properties in a rapid single step manner was highlighted. Phase pure, crystalline and nano-sized carbonate-substituted HA with ∼5 wt% substituted carbonate content (sample 7.5CO3-HA) was synthesised using the CHFS system using urea as a carbonate source. It was observed that a further increase in urea concentration in solution resulted in biphasic mixtures of carbonate-substituted HA and calcium carbonate (calcite). Increase in urea concentration in solution also decreased the particle size of HA. Sample 7.5CO3-HA was found to be calcium deficient with a Ca:P molar ratio of 1.45 (±0.04) which is akin to biological apatite, a calcium deficient carbonate-substituted HA.
Phase-pure crystalline and nano-sized silicate-substituted HA was also synthesised using the CHFS system with silicon acetate as a silicate ion source. The silicon content in samples increased with increasing silicon acetate concentration in the solution and a maximum of ∼1.1 wt% substituted silicon content was obtained. However, it is hypothesised that a substitution threshold of ∼1.1 wt% for this method exists for silicate-substituted HA made in the CHFS system (using silicon acetate as a silicate ion source).
Footnotes
Acknowledgments
Mick Willis and Zofia Luklinska are thanked for their help with TEM. Nicky Mordan (EDI, UCL) is thanked for her help regarding EDX (SEM) of all the samples.
Funding
EPSRC is thanked for funding an EPSRC Advanced Research Fellowship entitled ‘Next Generation Biomedical Materials Using Supercritical Fluids’ (JAD; grant GR/A11304). The Higher Education Commission (HEC), Government of Pakistan is thanked for a scholarship (AAC). This work was supported in part (JCK) by WCU Program through the National Research Foundation of Korea (NRF) funded by the Ministry of Education, Science and Technology (No. R31-10069).
References
Supplementary Material
Please find the following supplemental material available below.
For Open Access articles published under a Creative Commons License, all supplemental material carries the same license as the article it is associated with.
For non-Open Access articles published, all supplemental material carries a non-exclusive license, and permission requests for re-use of supplemental material or any part of supplemental material shall be sent directly to the copyright owner as specified in the copyright notice associated with the article.