
Abstract
Introduction
Hypoxemia, characterized by reduced arterial oxygen content and pressure in the arterial blood, presents a significant challenge in the management of critically ill patients.
1
Acute respiratory distress syndrome (ARDS) is the one of the primary causes of hypoxemia in the population.
2
The severity of ARDS is traditionally categorized as mild, moderate, or severe based on the PaO2/FiO2 ratio (P/F ratio) in conjunction with a positive end-expiratory pressure (PEEP) level of ≥5 cmH2O, as defined by the 2012 Berlin criteria.
3
However, these criteria have demonstrated limitations in the accurate diagnosis and prognosis of ARDS.4–7 One of the critical shortcomings of the P/F ratio lies in its exclusion of mechanical ventilator settings during its calculation, raising questions about its precision in assessing the severity of lung injury.
8
Furthermore, it does not consider the impact of elevated airway pressures on lung injury.
9
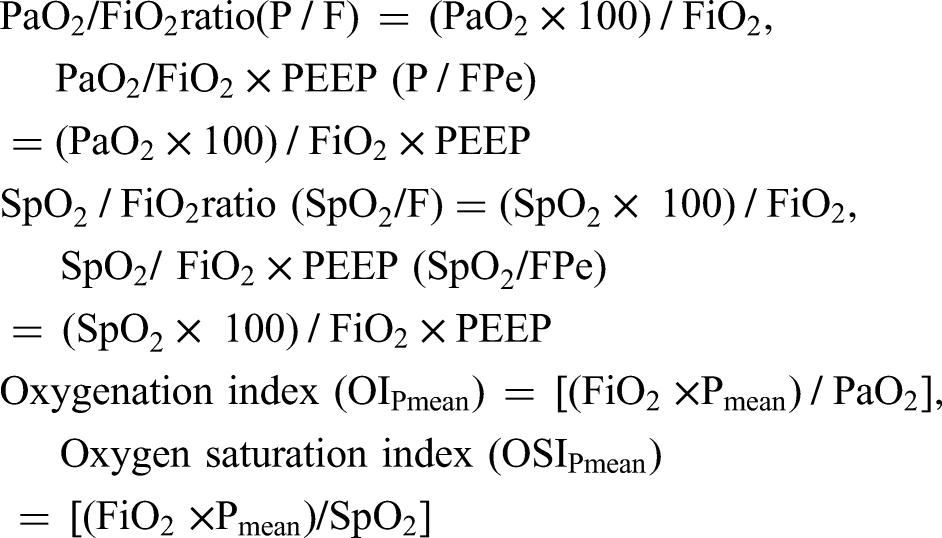
Similar drawbacks apply to the use of the SpO2/FiO2 ratio, a noninvasive alternative to the P/F ratio.8,10,11 These limitations have prompted the introduction of the oxygenation index (OI) and oxygen saturation index (OSI), both of which incorporate mean airway pressure (Pmean) to enhance the accuracy of ARDS diagnosis and mortality prediction.12,13

While oxygenation indices like OI and OSI, calculated by Pmean, consider key factors like Ppeak, Tinsp/Ttotal, and PEEP, they overlook variables such as tidal volume, minute volume, and respiratory rate, which play pivotal roles in the development of ventilator-induced lung injury (VILI).18–20
Mechanical power (MP), a comprehensive physical parameter encompassing all components contributing to VILI, has been identified as an independent risk factor associated with mortality in critically ill patients. 21 Therefore using mechanical power rather than Pmean in the calculations of OSI and OI enables a comprehensive assessment of all respiratory mechanics, along with saturation and oxygenation. Dynamic mechanical power represents the sum of dynamic elastic power and resistive dynamic power components, excluding PEEP. Driving pressure is as important as MP in the prediction of mortality in ARDS patients.22–24 The integration of total mechanical power (MPtot), dynamic mechanical power (MPdyn), and driving pressure (DP or ΔPinsp) into oxygenation and saturation indices has the potential to offer a more precise prediction of outcomes in critically ill patients.
In this study, we have caculated new saturation and oxygenation indices using MPdyn, MPtot, and ΔPinsp instead of Pmean upon admission and during the first seven consecutive days of COVID-19-associated ARDS (C-ARDS) patients. We aim to evaluate the predictive capabilities of these newly developed indices (OSI-MPtot, OI-MPtot, OSI-ΔPinsp, OI-ΔPinsp, OSI-MPdyn, OI-MPdyn) in terms of intensive care unit (ICU) mortality and compare them with existing indices, including P/F, SpO2/FiO2, PaO2/(FiO2xPEEP), SpO2/(FiO2xPEEP), OI and OSI. This study may contribute to a more accurate assessment of ARDS severity and improved clinical decision-making for critically ill patients.
Material and Methods
This study was approved by the University of Health Sciences, Bakırköy Dr SadiKonuk Training and Research Hospital Clinical Research Ethics Committee with protocol number 2021/293 and decision number 2021/10-22.
Study Design and Data Collection
The study involved a dataset comprising information from 784 patients diagnosed with COVID-19, who were hospitalized in the 28-bed ICU at Bakırköy Dr Sadi Konuk Training and Research Hospital during the period from March 18, 2020, to November 1, 2021. We retrieved this dataset by utilizing structured query language (SQL) queries from the ImdSoft-Metavision/QlinICU Clinical Decision Support (Israel) system.
We excluded certain subsets of patients based on specific criteria. Patients who did not receive invasive mechanical ventilation, remained in the ICU for less than 24 hours, were on mechanical ventilation for less than 24 hours, had a history of COPD or congestive heart failure, underwent tube thoracostomy, or received ECMO therapy were excluded from the study. As a result of these exclusions, a total of 361 patients were included in the study, as illustrated in Supplementary Figure 1S of the additional data.
Diagnosis of COVID-19-Related Acute Respiratory Distress Syndrome (C-ARDS)
The diagnosis of C-ARDS was confirmed by chest computed tomography and nasopharyngeal swab PCR samples (Bio-Speedy COVID-19 RT-Qpcrdetection Kit-Bioeksen, Türkiye). All patients (n = 361) had typical radiological findings and 308 of them were PCR positive. The diagnosis of C-ARDS was made on the first day of intensive care hospitalization according to Berlin criteria. 5
Demographic and Laboratory Parameters
Sequential organ failure assessment (SOFA), acute physiology and chronic health evaluation-II (APACHE II), Charlson comorbidity index (CCI), concomitant diseases, age, gender, height, predicted body weight (PBW), ideal weight, body mass index (BMI), pH, partial pressure of oxygen (PaO2), partial pressure of carbon dioxide (PaCO2), and lactate were obtained from the data pool.
Respiratory Parameters
All patients were orotracheal intubated, sedated and ventilated with Maquet Servo-i (Sweden) in pressure control ventilation (PCV) and volume control ventilation (VCV) modes. During the initial seven day period in the ICU, the following variables were recorded every minute and transferred into the software: End-inspiratory pressure (Ppeak), plateau pressure (Pplateau is considered as Ppeak = Pplateau for PCV), driving pressure (Pplateau - PEEP for VCV and pre-set ΔPinsp for PCV), PEEP, mean airway pressure [Pmean, calculated by ventilator: for PCV = (Ppeak - PEEP) × (Tinsp/Ttotal) + PEEP), for VCV = (Ppeak - PEEP) × 1/2 × (Tinsp/Ttotal) + PEEP], respiratory rate (RR), expiratory tidal volume (ΔV), inspiratory time (Tinsp), compliance [C, ΔV/(Pplateau - PEEP) for VCV and ΔV/(Ppeak - PEEP)for PCV], work of breathing ventilator (WOBv), inspiratory-expiratory ratio (I:E ratio) and fraction of inspired oxygen (FiO2).
Minute time slots were transferred from the data pool to Microsoft Excel as hourly time slots through the functions of SQL queries. The hourly mechanical ventilation parameters in the Excel dataset were calculated at 24-hour intervals (days) using the LEFT function of the Excel program as follows:
It was calculated by taking the difference of the first 10 characters of the signal date (Time 1) of the parameters transferred to the software from the mechanical ventilator and the first 10 characters of the patient's admission to the ICU (Time 2) (=LEFT (Time 1;10)-(LEFT(Time 2;10)).
The time periods during which patients in the study remained in the prone and supine positions were not recorded in the softwarebut were recorded by nurses in shift notes. Daily prone time was obtained from the nurses’ shift notes via SQL queries.
Calculation of Length of Stay in the ICU and Ventilator Free Days (VFD)
The length of stay in the ICU was calculated by the software as the time between the time point when the patient was intubated in the ICU (T admission) and the time point of death or discharge in the ICU (T death or discharge) (The length of stay in ICU = T death or discharge - T admission).
At a fixed time in ICU (for 28-day mortality), the VFDs are calculated as
25
:
If the patient dies while on mechanical ventilation, VFD = 28-time on mechanical ventilation (x) = 0. If the patient is successfully recovered from ventilation x days after being connected to the mechanical ventilator, VFD = 28 - x. If the patient is mechanically ventilated for >28 days, VFD = 0.
Since in this study, the duration of stay in the ICU was used instead of a fixed time (such as 28 or 30 days) for mortality estimation, the VFD's were calculated as follows: The ventilator-free minute was accepted as NULL for respiratory mechanics transferred from mechanical ventilators to the clinical decision support system between the time when the patient was intubated in the ICU (T1) and the time between death in the ICU or discharged (T2) (confirmed by nurse and doctor notes).
All the above-mentioned time intervals were recorded in the data pool by the software in minutes. Minute time slices were transferred from the data pool to Microsoft Excel under the name of the VFD parameter as hourly time periods through the functions of SQL queries. Hourly time periods in Microsoft Excel were converted into daily time periods by dividing by 24.
The following ratios and indices were calculated automatically by the software (see SDM):
Calculation of Mechanical Power
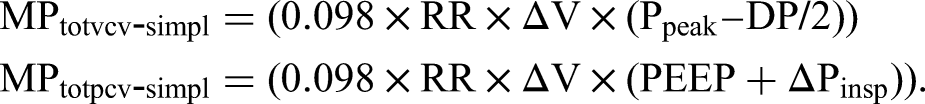
Calculation of Total Mechanical Power (MPtot)
For VCV mode, the volume control simplified equation (MPvcv−simpl) developed by Gattinoni et al and for PCV, the pressure control simplified equation (MPpcv−simpl) developed by Becher et al was used in this study.19,21–24,26–29
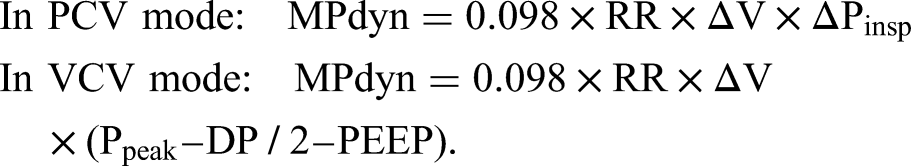
Calculation of Dynamic Mechanical Power (MPdyn)
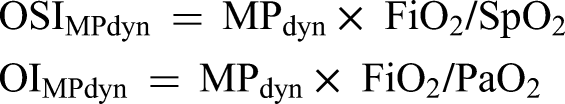
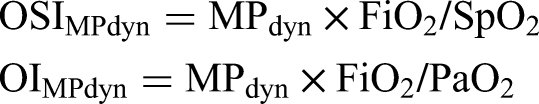
Calculation of the new Oxygenation Indices and Oxygen Saturation Indices
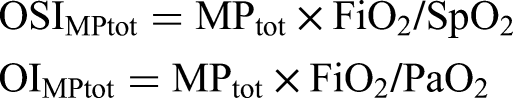
When pressure control simplified equation (MPtotpcv−simpl) is used for PCV mode instead of Pmean in the calculation of OSI and OI, the total power oxygen saturation index (OSIMPtot) and total power oxygenation index (OIMPtot) are calculated as follows:

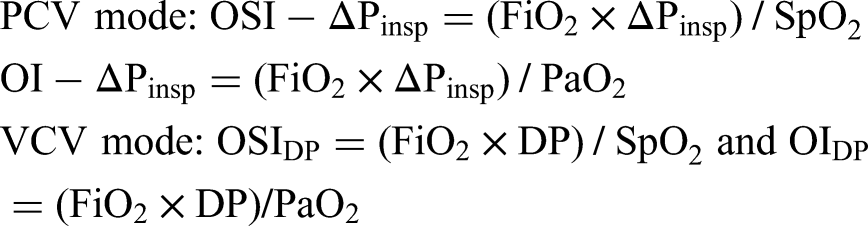
When DP for VCV mode and ΔPinsp for PCV mode are used instead of Pmean in the calculation of OSI and OI, the driving pressure oxygen saturation index (OSIDP or OSI-ΔPinsp) and Driving pressure oxygenation index (OIDP or OI-ΔPinsp) are calculated as follows:
Statistical Methods
The homogeneity of the variables in the study was evaluated with the Shapiro–Wilk normality test. Since the data of the patients were not homogeneous, Mann–Whitney U test was used for comparison of survival nonsurvivalgroups. Frequency distribution and percentages of categorical variables (gender, co-morbidities, etc.) were compared with the Chi-squared test (Fisher's exact test when the Chi-squared test conditions were not met). Median, interquantile range (IQR), number, and percentage values were used for statistical representation. Correlation of FiO2, PaO2, SpO2, PEEP, Pmean, ΔPinsp, MPtot, MPdyn, PaO2/FiO2, PaO2/FiO2xPEEP, SpO2/FiO2, SpO2/FiO2xPEEP, OIPmean, OSIPmean, OIΔPinsp, OSIΔPinsp, OIMPdyn, OSIMPdyn, OIMPtot, and OSIMPtot parameters was done with Spearman correlation test.
We calculated mean and 95% confidence interval (CI) of the parameters, PaO2/FiO2, PaO2/FiO2xPEEP, SpO2/FiO2, SpO2/FiO2xPEEP, OIPmean, OSIPmean, OI∆Pinsp, OSI∆Pinsp, OIMPdyn, OSIMPdyn, OIMPtot and OSIMPtot, stratified by survivor/non-survivor over time to determine the best (earliest most predictive) day of the 7 days' period to focus on for further study. We did receiver operating characteristic (ROC) curve analysis for each parameter on the selected day using scikit-learn machine learning library in Python 31 , and computed the area under the curve (AUC) for the generated ROC curves. We fitted Logistic regression models using statsmodels Python module and did bootstrapping to calculate AUC 95% CIs. 30 Moreover, we did DeLong's test (X1, X2) on AUC pairs to evaluate statistically significance of their difference. We determined the cutoff values based on the Youden's Index by selecting the threshold value that provides the highest Youden's Index.
We split the patients’ data into groups based on the cutoff values of the parameters considered, one with greater than or equal to (GE), the other, less than (LESS) the cutoff. We did survival analysis using lifelines package in Python. We fitted Kaplan-Meier estimate for the survival function for each of the groups and calculated 95% CIs. We did the analysis for each of ‘Length of stay in ICU (day)’ and ‘Number of days without MV’ as the duration subject was observed for and the event is the survival and non-survival of the patients. We presented median time in ICU (“half-life” of the patient population), the point in time where on average 50% of the patients has expired, for each group.
To investigate the effect of the considered parameters upon the survival-time, we implemented Cox's proportional hazards regressionmodel on grouped parameters. We provided hazards ratio (HR) for each parameter in addition to the associated P-values and 95% CIs.
We performed power analysis to evaluate the adequacy of our sample set forCox's regression. We calculated the power (1 - β) of each OSI parameter, (where β = Probability of failing to reject the null hypothesis under the alternative hypothesis, Type II error rate) using α = 0.05 (Type I error rate, two-tailed), proportion of patients in group GE, hazard ratio (HR), and population size (nonsurvivals). In addition, we presented the total number of samples (nonsurvivals) needed at 80% power level for each of the parameters, given α = 0.05, proportions of GE groups and HRs. We emphasized the necessary sample size for the parameters in case the studied population is inadequate for Cox's regression analysis (power analyses, Supplementary Table 1S).
Results
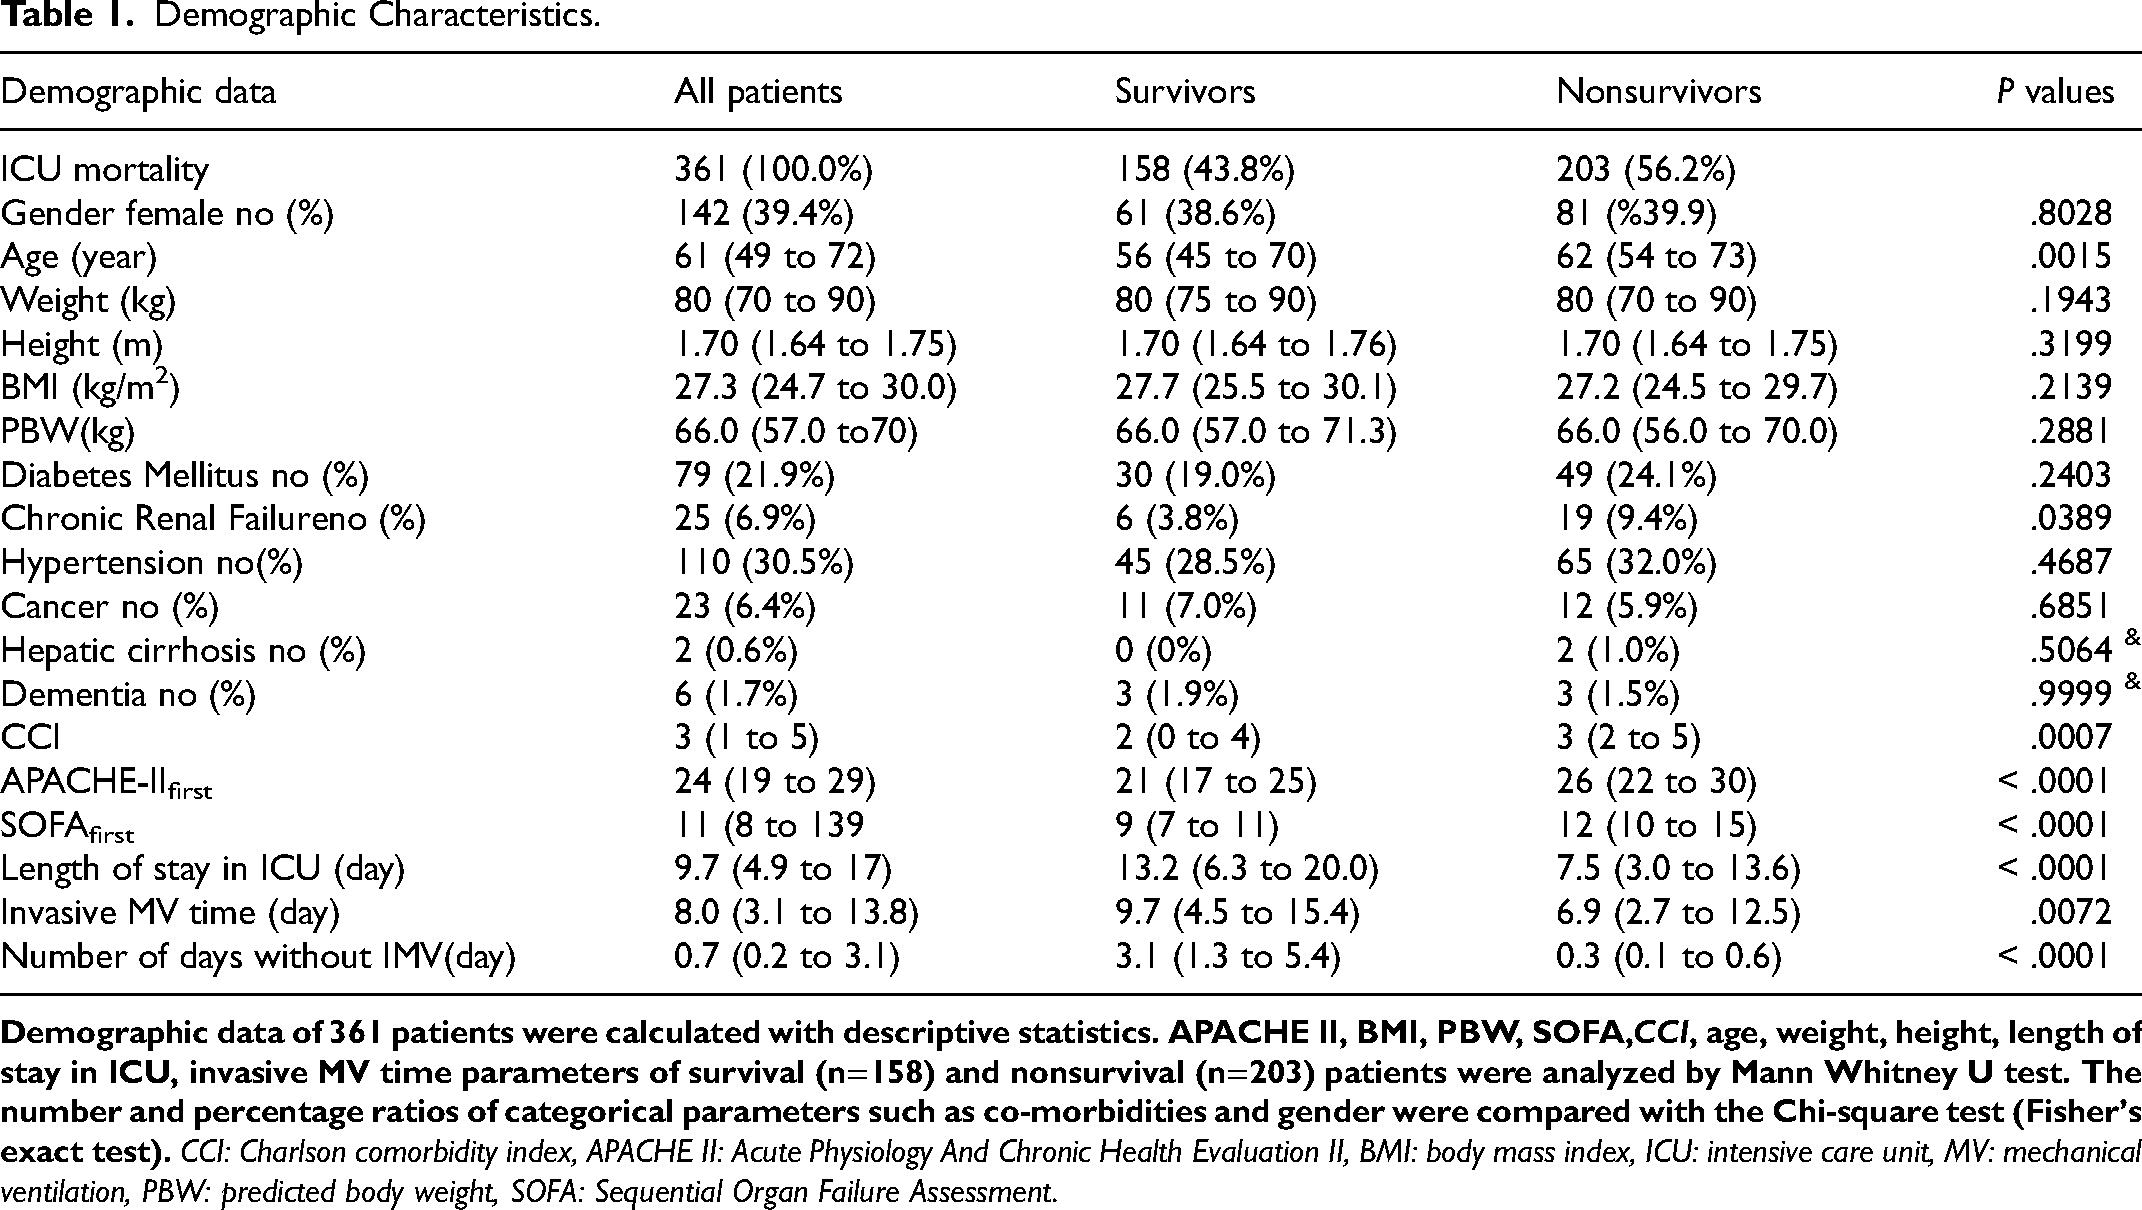
This study encompassed a cohort of 361 patients admitted to the ICU with a diagnosis of COVID-19-associated ARDS. Patient data were collected continuously for a total of 7212 h (averaging 60 min per data point) during the first 7 days of admission, concurrently with blood gas samples and respiratory parameter measurements. Detailed statistics for median and interquartile range (IQR) values can be found in Supplementary Figure 2S. On the first day of the protocol, the distribution of ARDS severity among the patients was as follows: 107 patients (29.6%) with mild ARDS, 217 patients (60.1%) with moderate ARDS, and 37 patients (10.2%) with severe ARDS. The daily placement of patients in the prone position during the first three days was analyzed, resulting in the following counts: 137 patients (38.0%) on day 1, 129 patients (38.6%) on day 2, and 109 patients (35.1%) on day 3. Pairwise comparisons of these counts using the Chi-square test revealed P-values of 0.8554 for day 1 versus day 2, 0.4362 for day 1 versus day 3, and 0.3472 for day 2 versus day 3, indicating that the observed differences were not statistically significant. (Supplementary Figure 3S). Table 1 presents detailed demographic data, including median values, IQR, counts, percentiles, and P-values, for all patients as well as a breakdown of survival and non-survival cases. For further insights into patient averages of respiratory and blood gas parameters on days 1 and 3 of the study protocol, please refer to Supplementary Table 2S.
Demographic Characteristics.
Survival and Nonsurvival Analysis (Mann–Whitney U Test)
To discern differences between survival and nonsurvival groups, daily average values of dynamic respiratory parameters (Supplementary Figures 4S and 5S) as well as all oxygenation and saturation indices (Figures 1 and 2) for the first seven consecutive days in the ICU were subjected to the Mann–Whitney U test. The most significant differences between survival and nonsurvival groups were observed in the mean and CI values on the third day.
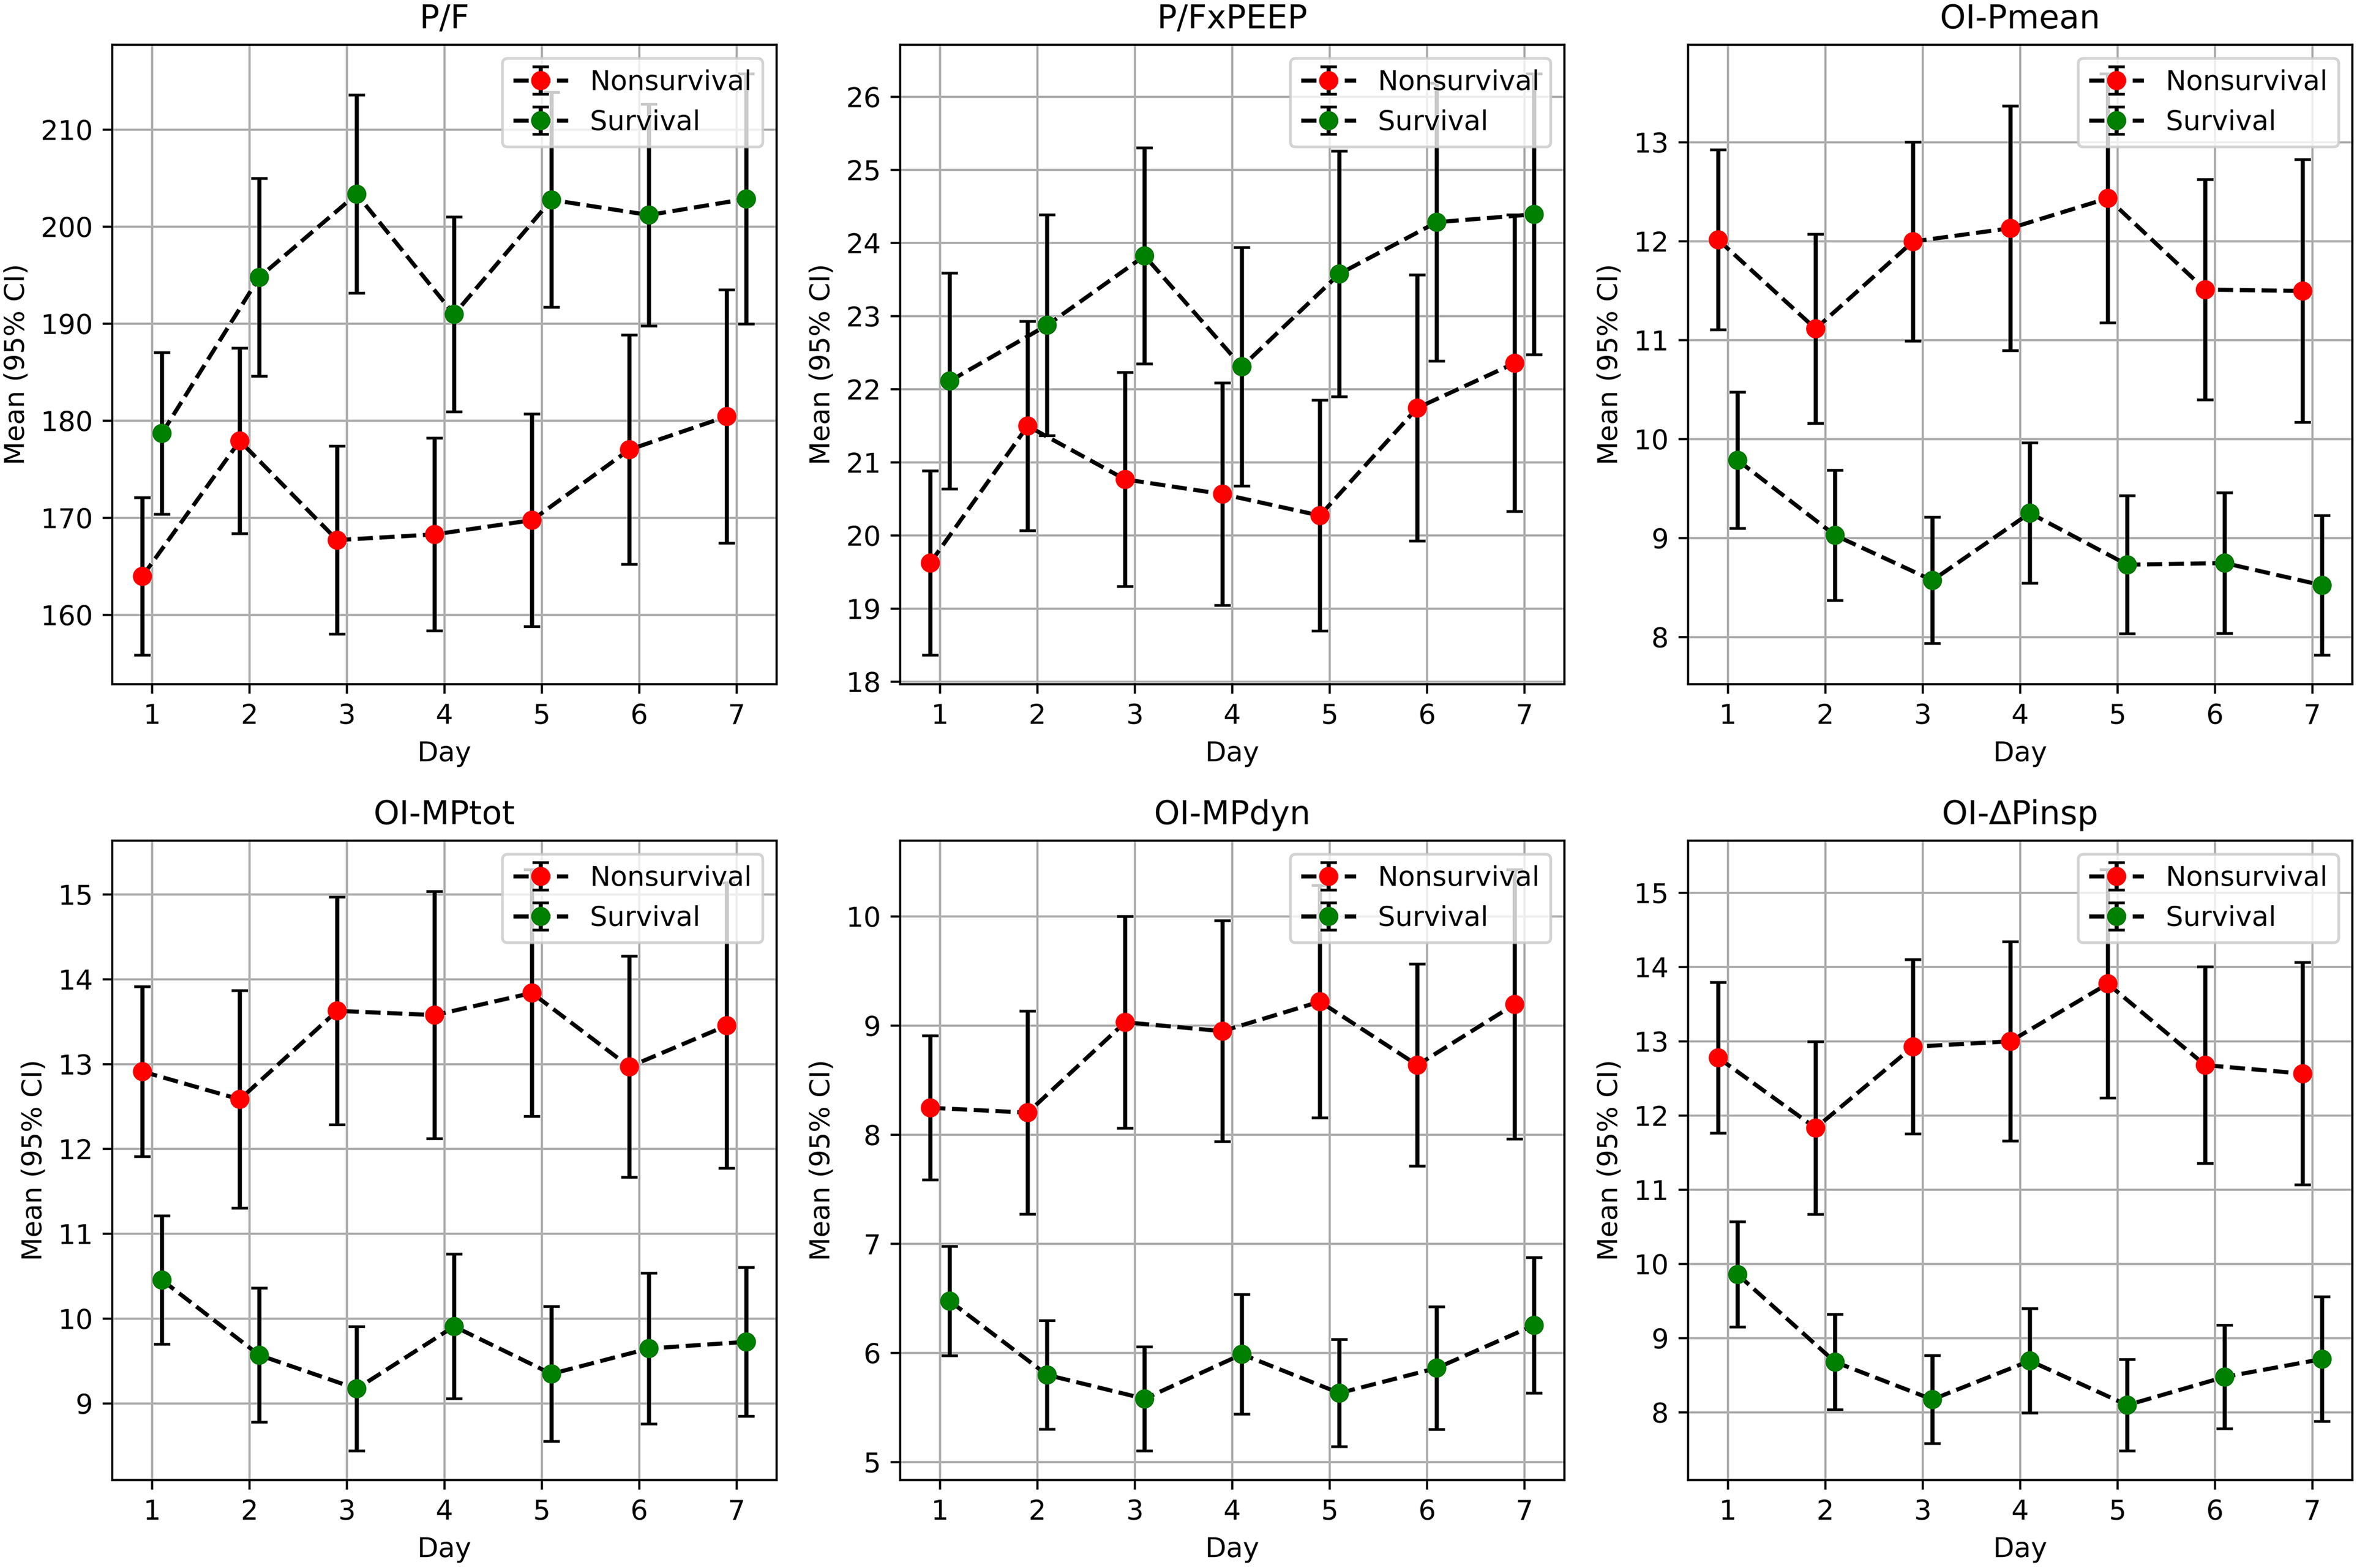
Comparison of PO2/FiO2, P/FxPEEP, OI-Pmean, OI-MPtot, OI-MPdyn, and OI-ΔPinsp parameters between survival and nonsurvival patients. Arterial oxygen pressure / fractionated oxygen ratio, OIPmean,: Oxygenation index, OI-ΔPinsp : Driving pressure oxygenation index, OIMPdyn: Dynamic power oxygenation index, OIMPtot:mTotal power oxygenation index. P/FxPEEP: Arterial oxygen pressure/fractionated oxygen ratio x positive end expiratory pressure.
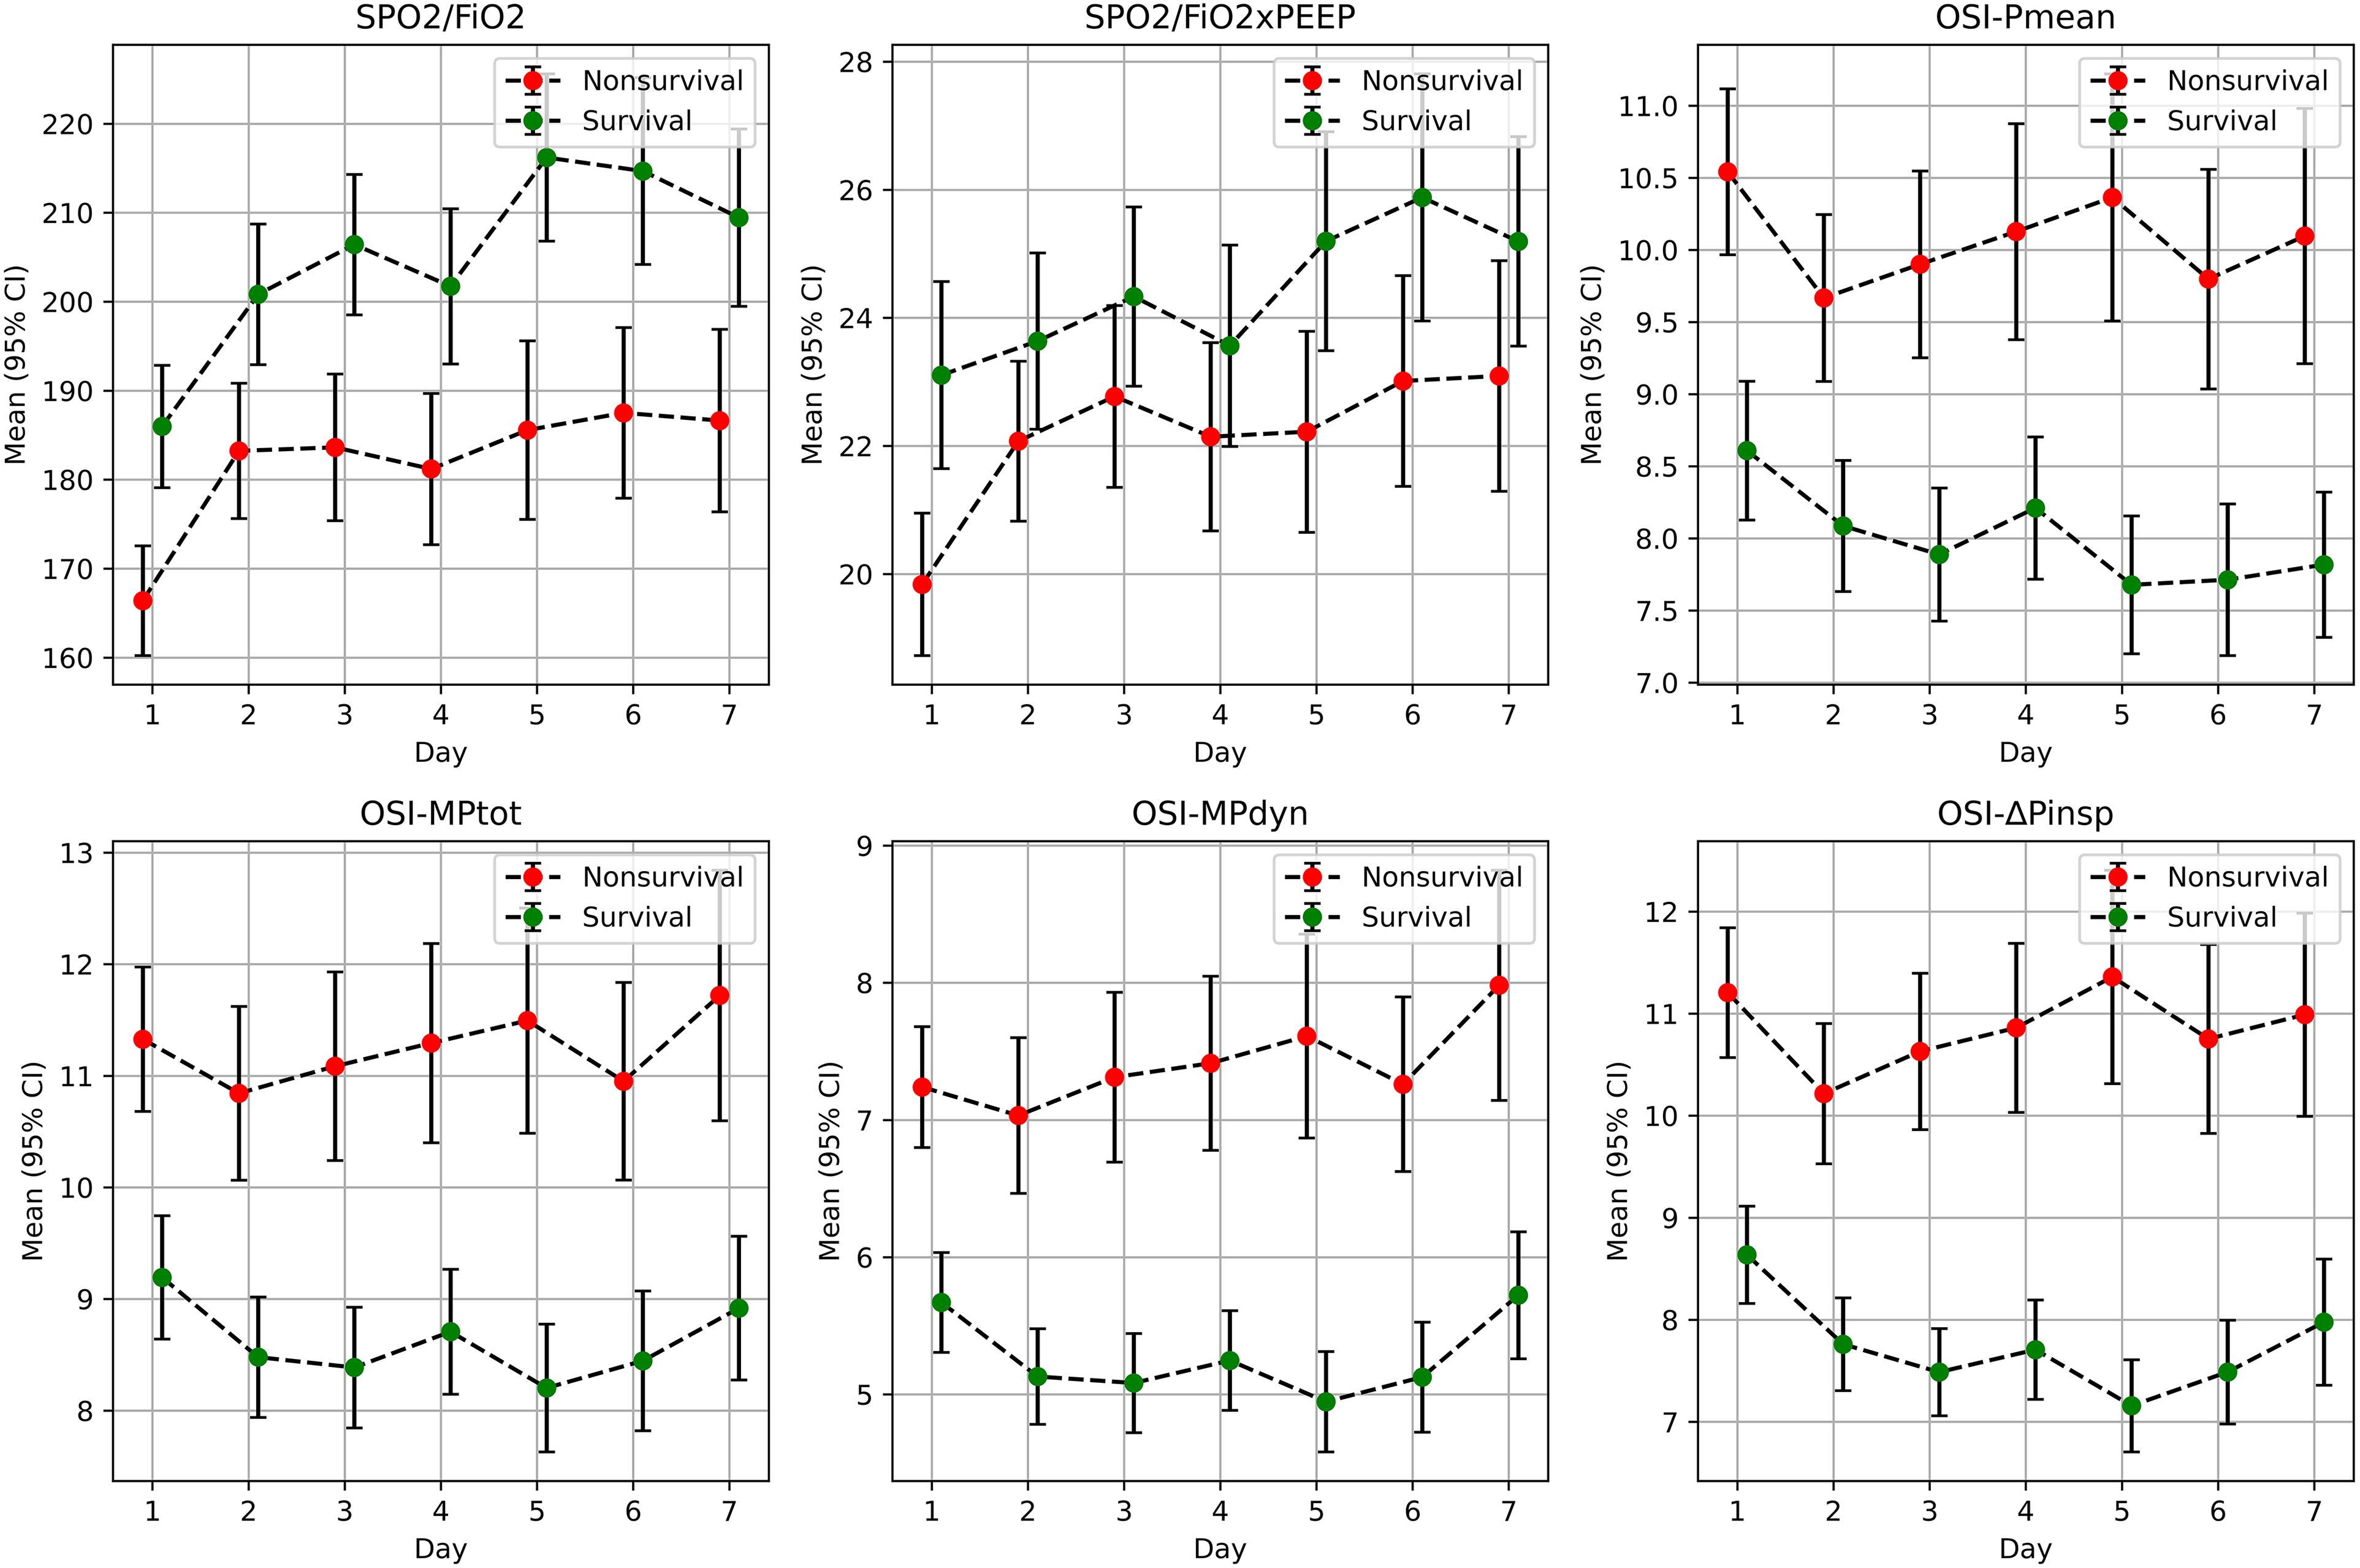
Figure 1. Comparison of SPO2/FiO2, SPO2/FiO2xPEEP, OSI-Pmean, OSI-MPtot, OSI-MPdyn, and OSI-ΔPinsp Parameters between Survival and Nonsurvival Patients SpO2/FiO2: Oxygen saturation / fraction of inspired oxygen, SpO2/FiO2 xPEEP (SpO2/FP) : Oxygen saturation / fraction of inspired oxygen×positive end expiratory pressure, OSIPmean,: Oxygen saturation index, OSIΔPinsp: Driving pressure oxygen saturation index, OSIMPdyn: Dynamic power saturation index, OSIMPtot: Total power saturation index.
On the third day, the following parameters exhibited notable differences between nonsurvival and survival patients (Figure 1):
P/F: 168 (158-177) versus 203 (193-214), P < .0001 P/FxPEEP: 20.8 (19.3-22.2) versus 23.8 (22.4-25.3), jP = .0013 OI-Pmean: 12.0 (11.0-13.0) versus 8.6 (7.9-9.2), P < .0001 OI-MPtot: 13.6 (12.3-15.0) versus 9.2 (8.5-9.9), P < .0001 OI-MPdyn: 9.0 (8.1-10.0) versus 5.6 (5.1-6.1), P < .0001 OI-ΔPinsp: 12.9 (11.8-14.1) versus 8.2 (7.6-8.8), P < .0001
For mean, CI, and P values calculated for other days, please refer to Supplementary Table 3S.
Similarly, on the third day, the following parameters exhibited significant differences between nonsurvival and survival patients (Figure 2):
SpO2/FiO2: 184 (176-192) versus 206 (199-214), P < .0001 SpO2/FiO2xPEEP: 22.8 (21.4-24.2) versus 24.3 (23.0-25.7), P = .0320 OSI-Pmean: 9.9 (9.3-10.5) versus 7.9 (7.4-8.4), P < .0001 OSI-MPtot: 11.1 (10.3-11.9) versus 8.4 (7.9-8.9), P < .0001 OSI-MPdyn: 7.3 (6.7-7.9) versus 5.1 (4.7-5.4), P < .0001 OSI-ΔPinsp: 10.6 (9.9-11.4) versus 7.5 (7.1-7.9), P < .0001
For mean, CI, and P values calculated for other days, please refer to Data Supplementary Table 4S. These findings highlight significant differences in oxygenation and saturation indices and dynamic respiratory parameters between patients who survived and those who did not, with the third day being particularly indicative of these distinctions.
Logistic Regression ROC Analyzes and Calculation of cut-off Values
Logistic regression ROC analysis was performed to assess the predictive performance of various clinical parameters on the third day of patient care, particularly in distinguishing between survival and non-survival outcomes. The analysis was carried out on 311 patients who were alive on the third day and receiving mechanical ventilator support, with 297 of them having a P/F ratio below 300. The AUC and CI values were calculated for several parameters, and the differences between these values were evaluated using the Delong test. Additionally, cut-off values for these parameters were determined using the Youden method, distinguishes between survival and death. For the P/F, P/FxPEEP, OI-Pmean, OI-MPtot, OI-MPdyn, and OI-ΔPinsp indices, the AUC and CI values were as follows: 0.66 (0.60-0.72), 0.61 (0.54-0.67), 0.66 (0.59-0.72), 0.66 (0.60-0.72), 0.69 (0.63-0.74) and 0.72 (0.66-0.77) respectively (Figure 3). After performing the Delong test to compare these parameters, it was found that only the AUC value of OI-ΔPinsp among the new oxygenation indices was statistically significantly higher than P/F and OI-Pmean (P-values .0002 and <.0001, respectively). The cut-off values of P/F, P/FxPEEP, OI-Pmean, OI-MPtot, OI-MPdyn and OI-ΔPinsp indices were calculated with the Youden method (172, 16.51, 10.55, 10.43, 7.12 and 7.06, respectively).
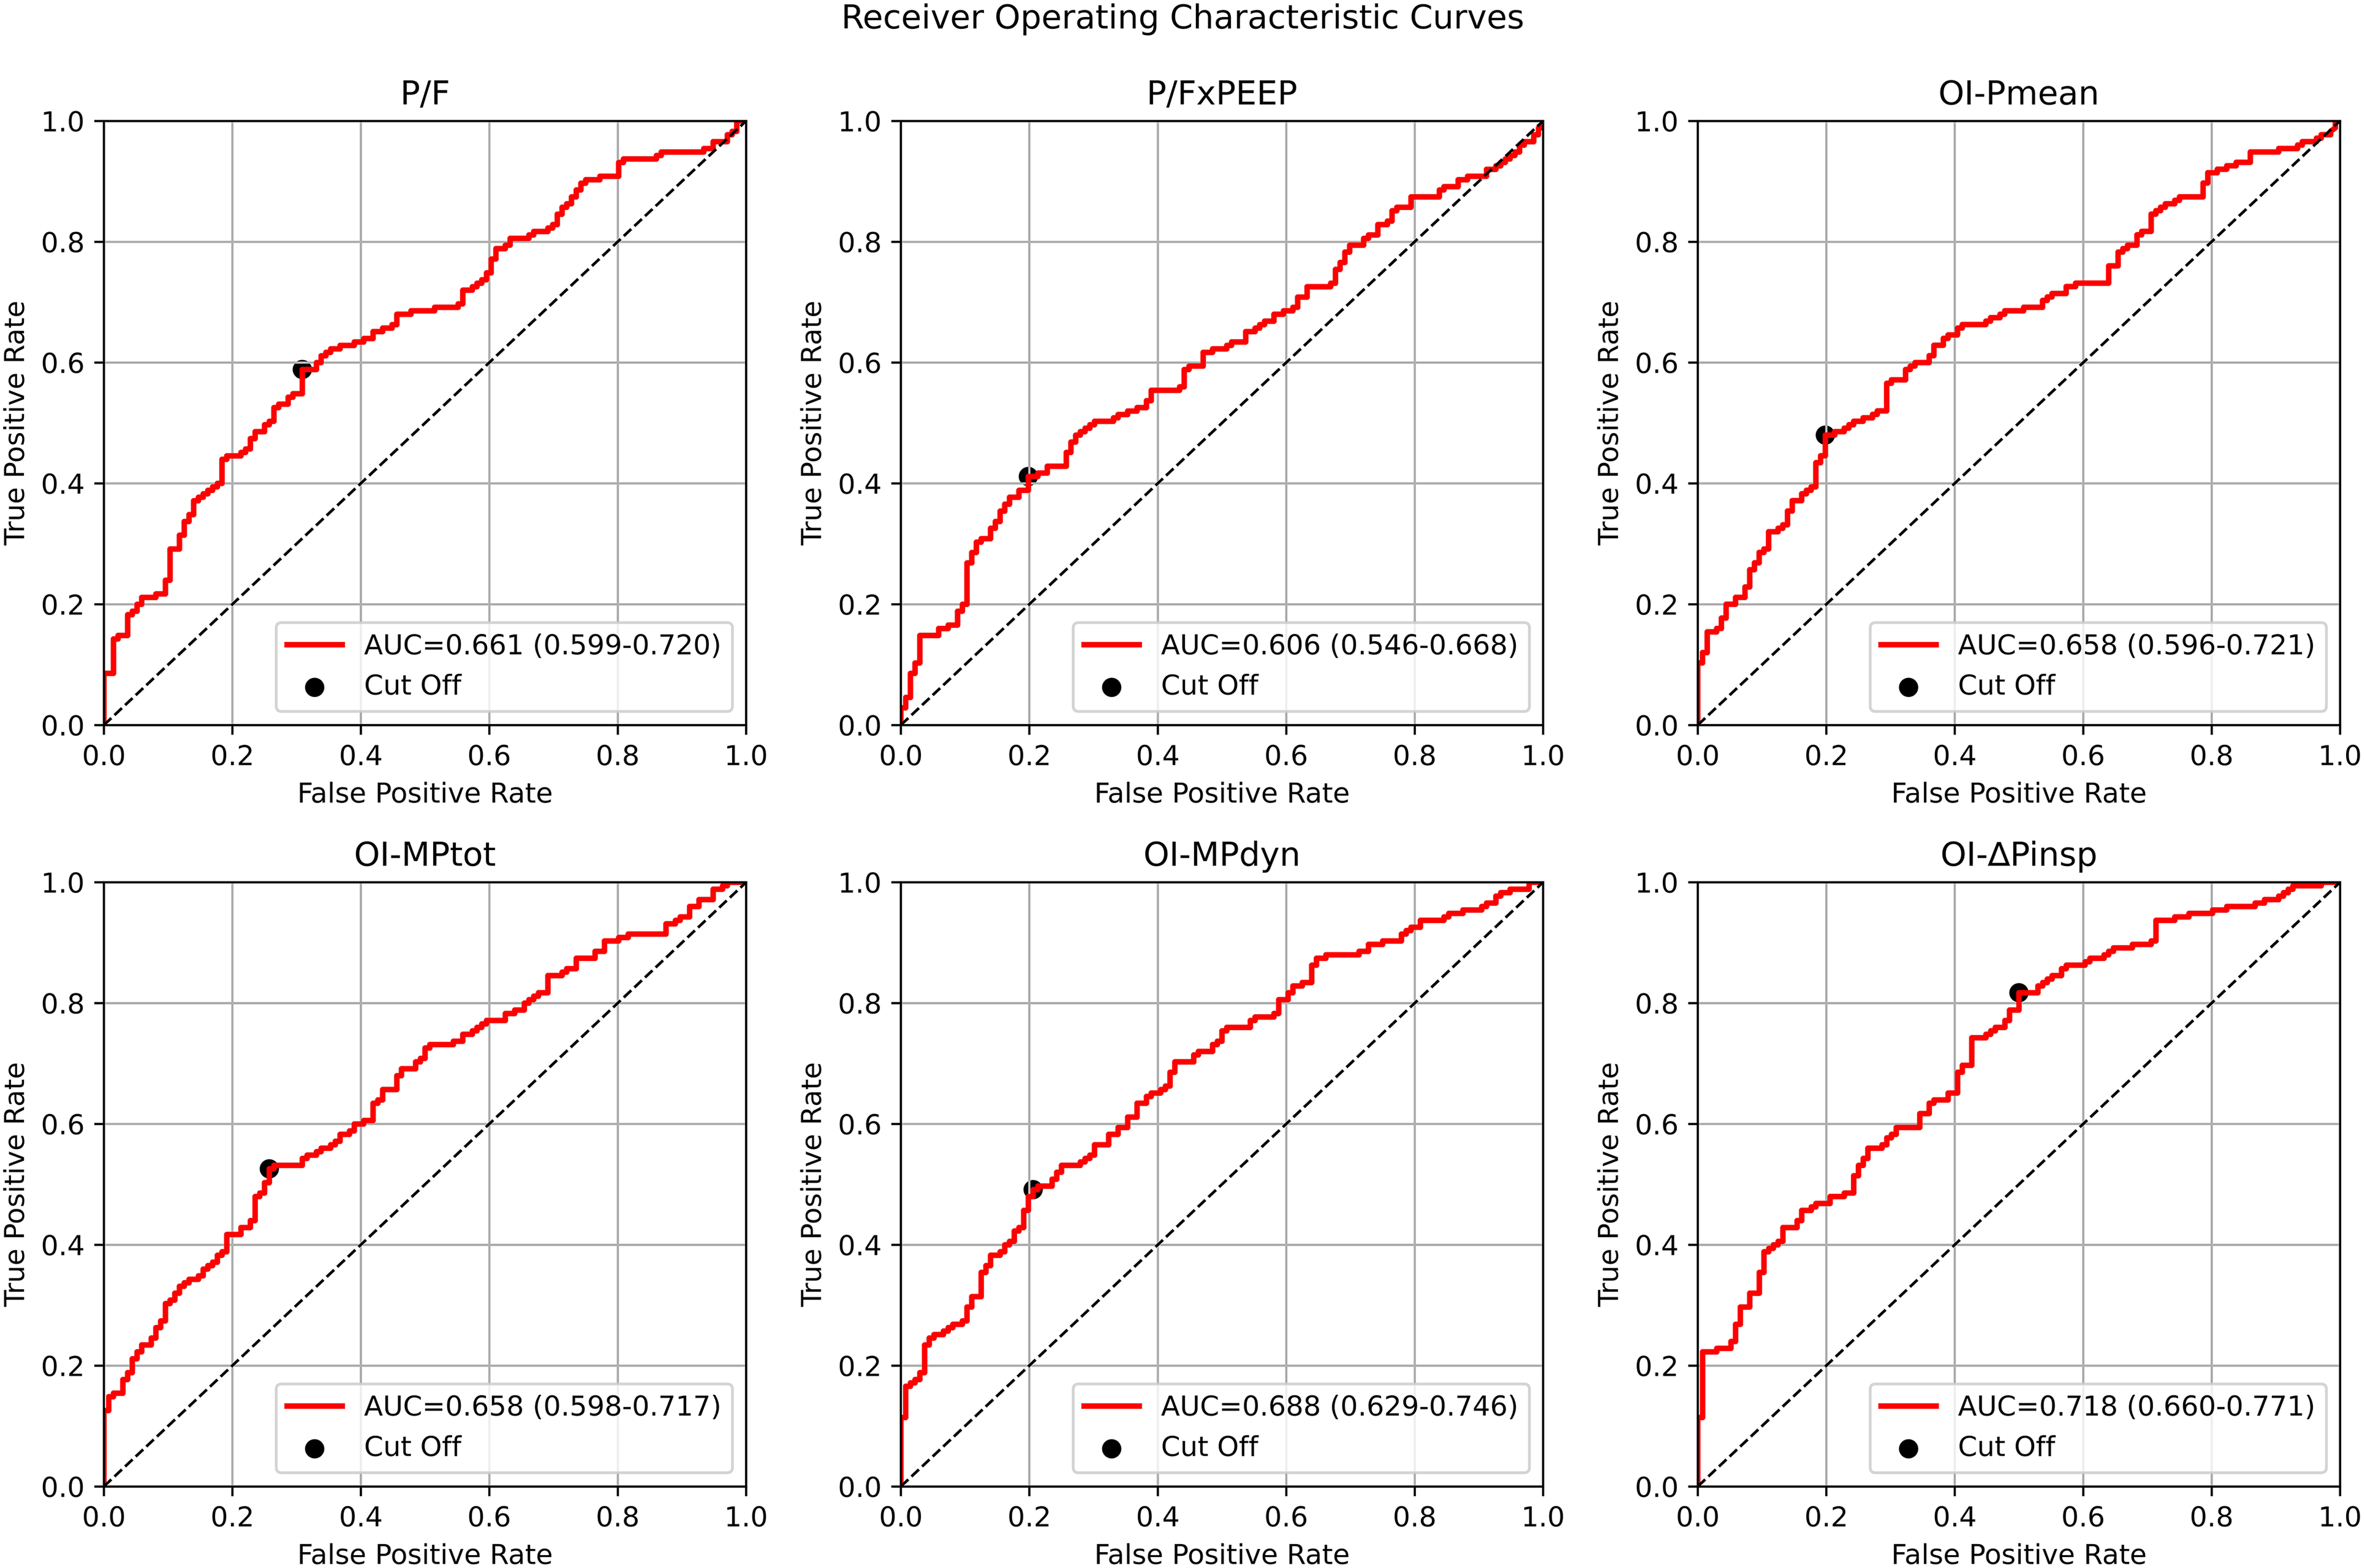
The median values of AUC, CI, true positive rate, and false positive rate for the parameters P/F, P/FxPEEP, OI-Pmean, OI-MPtot, OI-MPdyn, and OI-ΔPinsp were calculated for 311 surviving patients on the third day. These values were categorized into six categories for estimating ICU mortality. P/F: Arterial oxygen pressure / fraction of inspired oxygenratio, P/FxPEEP: Arterial oxygen pressure / fraction of inspired oxygen×positive end expiratory pressure, OI-Pmean,: Oxygen index, OI-MPtot: Total power oxygen index, OIMPdyn: Dynamic power oxygenation index,OI-ΔPinsp: Driving pressure oxygenationindex.
For the SPO2/FiO2, SPO2/FiO2xPEEP, OSI-Pmean, OSI-MPtot, OSI-MPdyn, and OSI-ΔPinsp indices, the AUC and CI values were as follows (Figure 4):
SPO2/FiO2: AUC = 0.64 (CI: 0.57-0.70) SPO2/FiO2xPEEP: AUC = 0.57 (CI: 0.51-0.63) OSI-Pmean: AUC = 0.63 (CI: 0.57-0.70) OSI-MPtot: AUC = 0.64 (CI: 0.58-0.70) OSI-MPdyn: AUC = 0.68 (CI: 0.62-0.74) OSI-ΔPinsp: AUC = 0.71 (CI: 0.65-0.77)
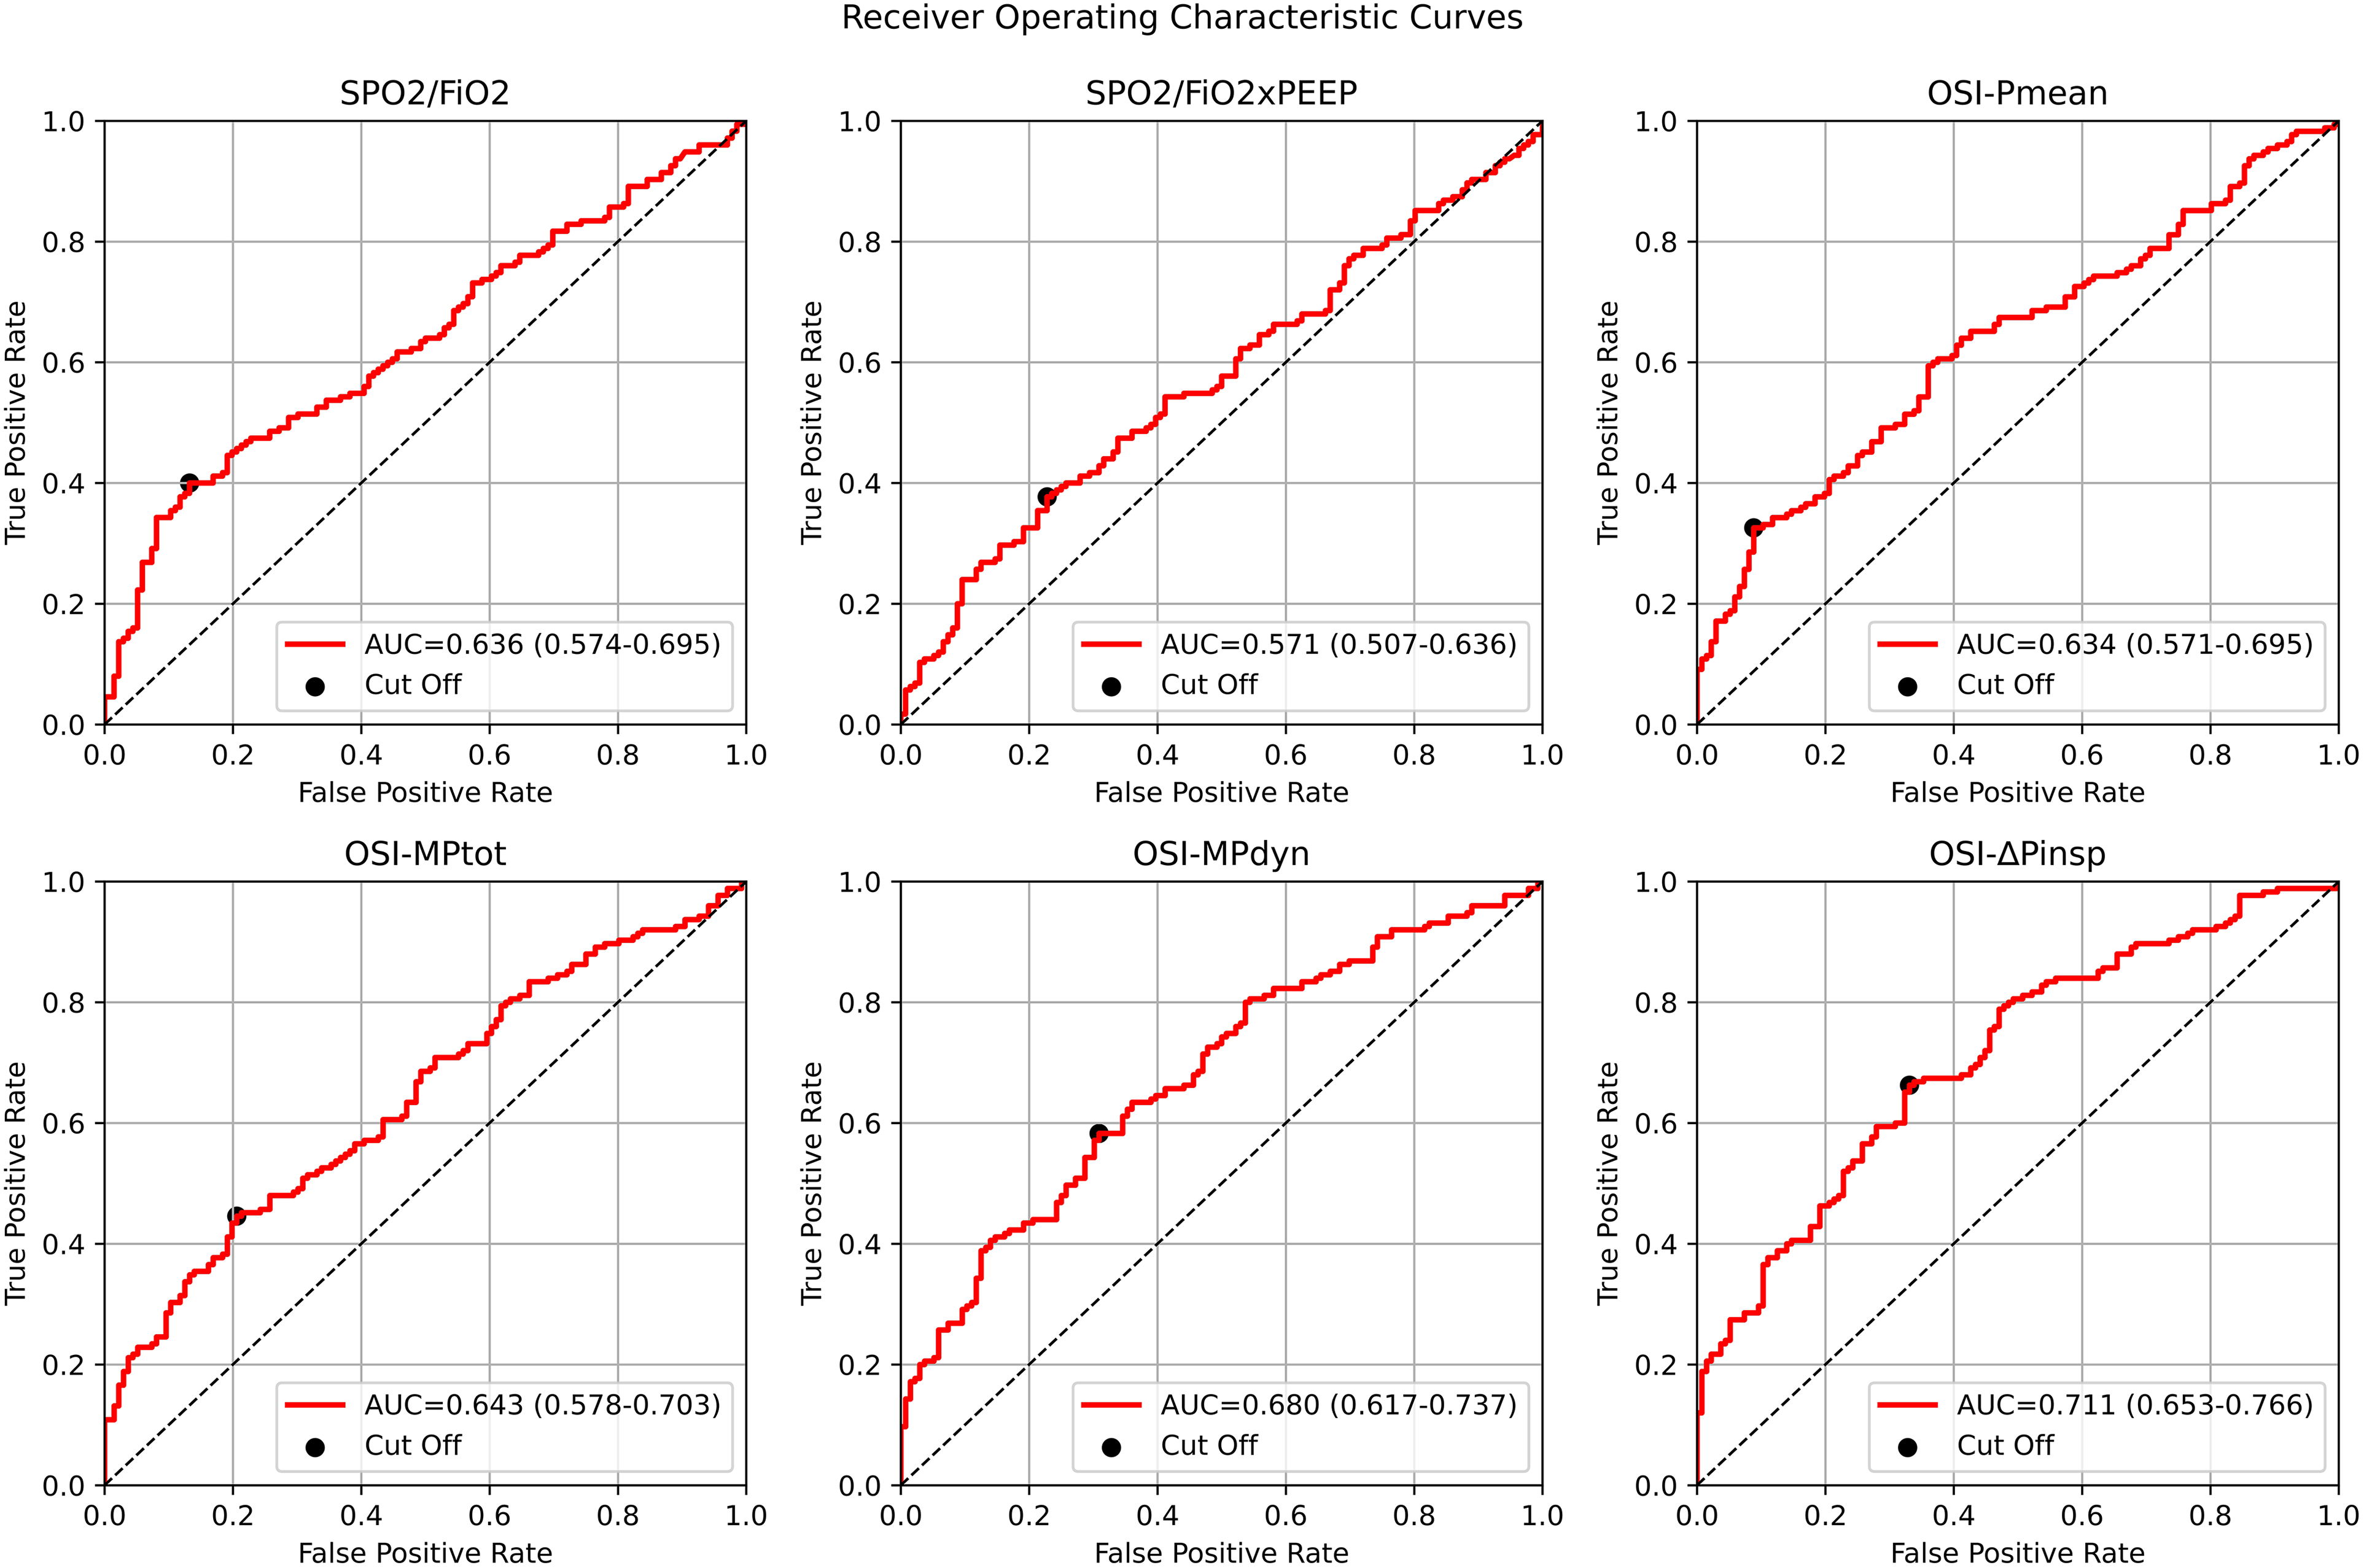
Median AUC, CI and true positive rate, false positive rate values of SpO2/FiO2, SpO2/FiO2× PEEP, OSI-Pmean, OSI-MPtot, OSI-MPdyn and OSI-ΔPinsp parameters of 311 surviving patients on day 3 of the protocol were calculated as 6 categories for ICU mortality estimation. SpO2/FiO2: Oxygen saturation / fraction of inspired oxygen, SpO2/FiO2xPEEP: Oxygen saturation / fraction of inspired oxygen×positive end expiratory pressure, OSIPmean,: Oxygen saturation index, OSIΔPinsp: Driving pressure oxygen saturation index, OSIMPdyn: Dynamic power saturation index, OSIMPtot: Total power saturation index.
After the Delong test, it was observed that the AUC and CI values of OSI-ΔPinsp were statistically significantly higher than those of SPO2/FiO2 and OSI-Pmean (P < .0001). Additionally, the AUC and CI values of OSI-MPdyn were found to be statistically significantly higher than those of SPO2/FiO2 and OSI-Pmean (P-values .047 and .028).
The cut-off values for these parameters, calculated using the Youden method, were as follows:
SPO2/FiO2: 160 SPO2/FiO2xPEEP: 18.15 OSI-Pmean: 10.97 OSI-MPtot: 10.68 OSI-MPdyn: 5.76 OSI-ΔPinsp: 8.04
AUC and CI values calculated by ROC analysis of dynamic respiratory mechanics (FiO2, sPO2, PaO2, MPtot, MPdyn, Pinsp, Ppeak, ΔPinsp, C, WOBv) and deLong analysis results are shown in Supplementary Figures 6S, 7S and Table 5S.
These results provide valuable insights into the predictive power of these parameters for distinguishing between survival and non-survival outcomes in patients receiving mechanical ventilator support on the third day of care.
Cox Regression (Log Rank Test) and Kaplan–Meier Curves
The analysis involved the application of Cox regression (log-rank) and the presentation of Kaplan–Meier curves to assess the likelihood of ICU survival and the duration of ventilator-free days (VFday) based on specified cut-off values for various clinical parameters. The findings yielded significant insights:
P/F and P/FxPEEP Parameters: The study identified that ICU mortality rates were notably higher among patients whose P/F and P/FxPEEP ratios fell below the designated cut-off values of 172 and 16.5. These patients exhibited HRs of 1.44 (P = .02) and 1.48 (P = .01) (Figure 5), respectively, highlights the importance of these ratios in predicting patient outcomes. Patients with ratios equal to or greater than the median values experienced significantly longer VFday, with values of 6.4 (2.8-10.3) days for P/F and P/FxPEEP ratios and 4.0 (1.4-9.9) days for CI VFday. The associated HRs and CIs were 1.94 (1.43-2.62, P = .0001) and 1.74 (P = .002) (Supplementary Figure 8S).
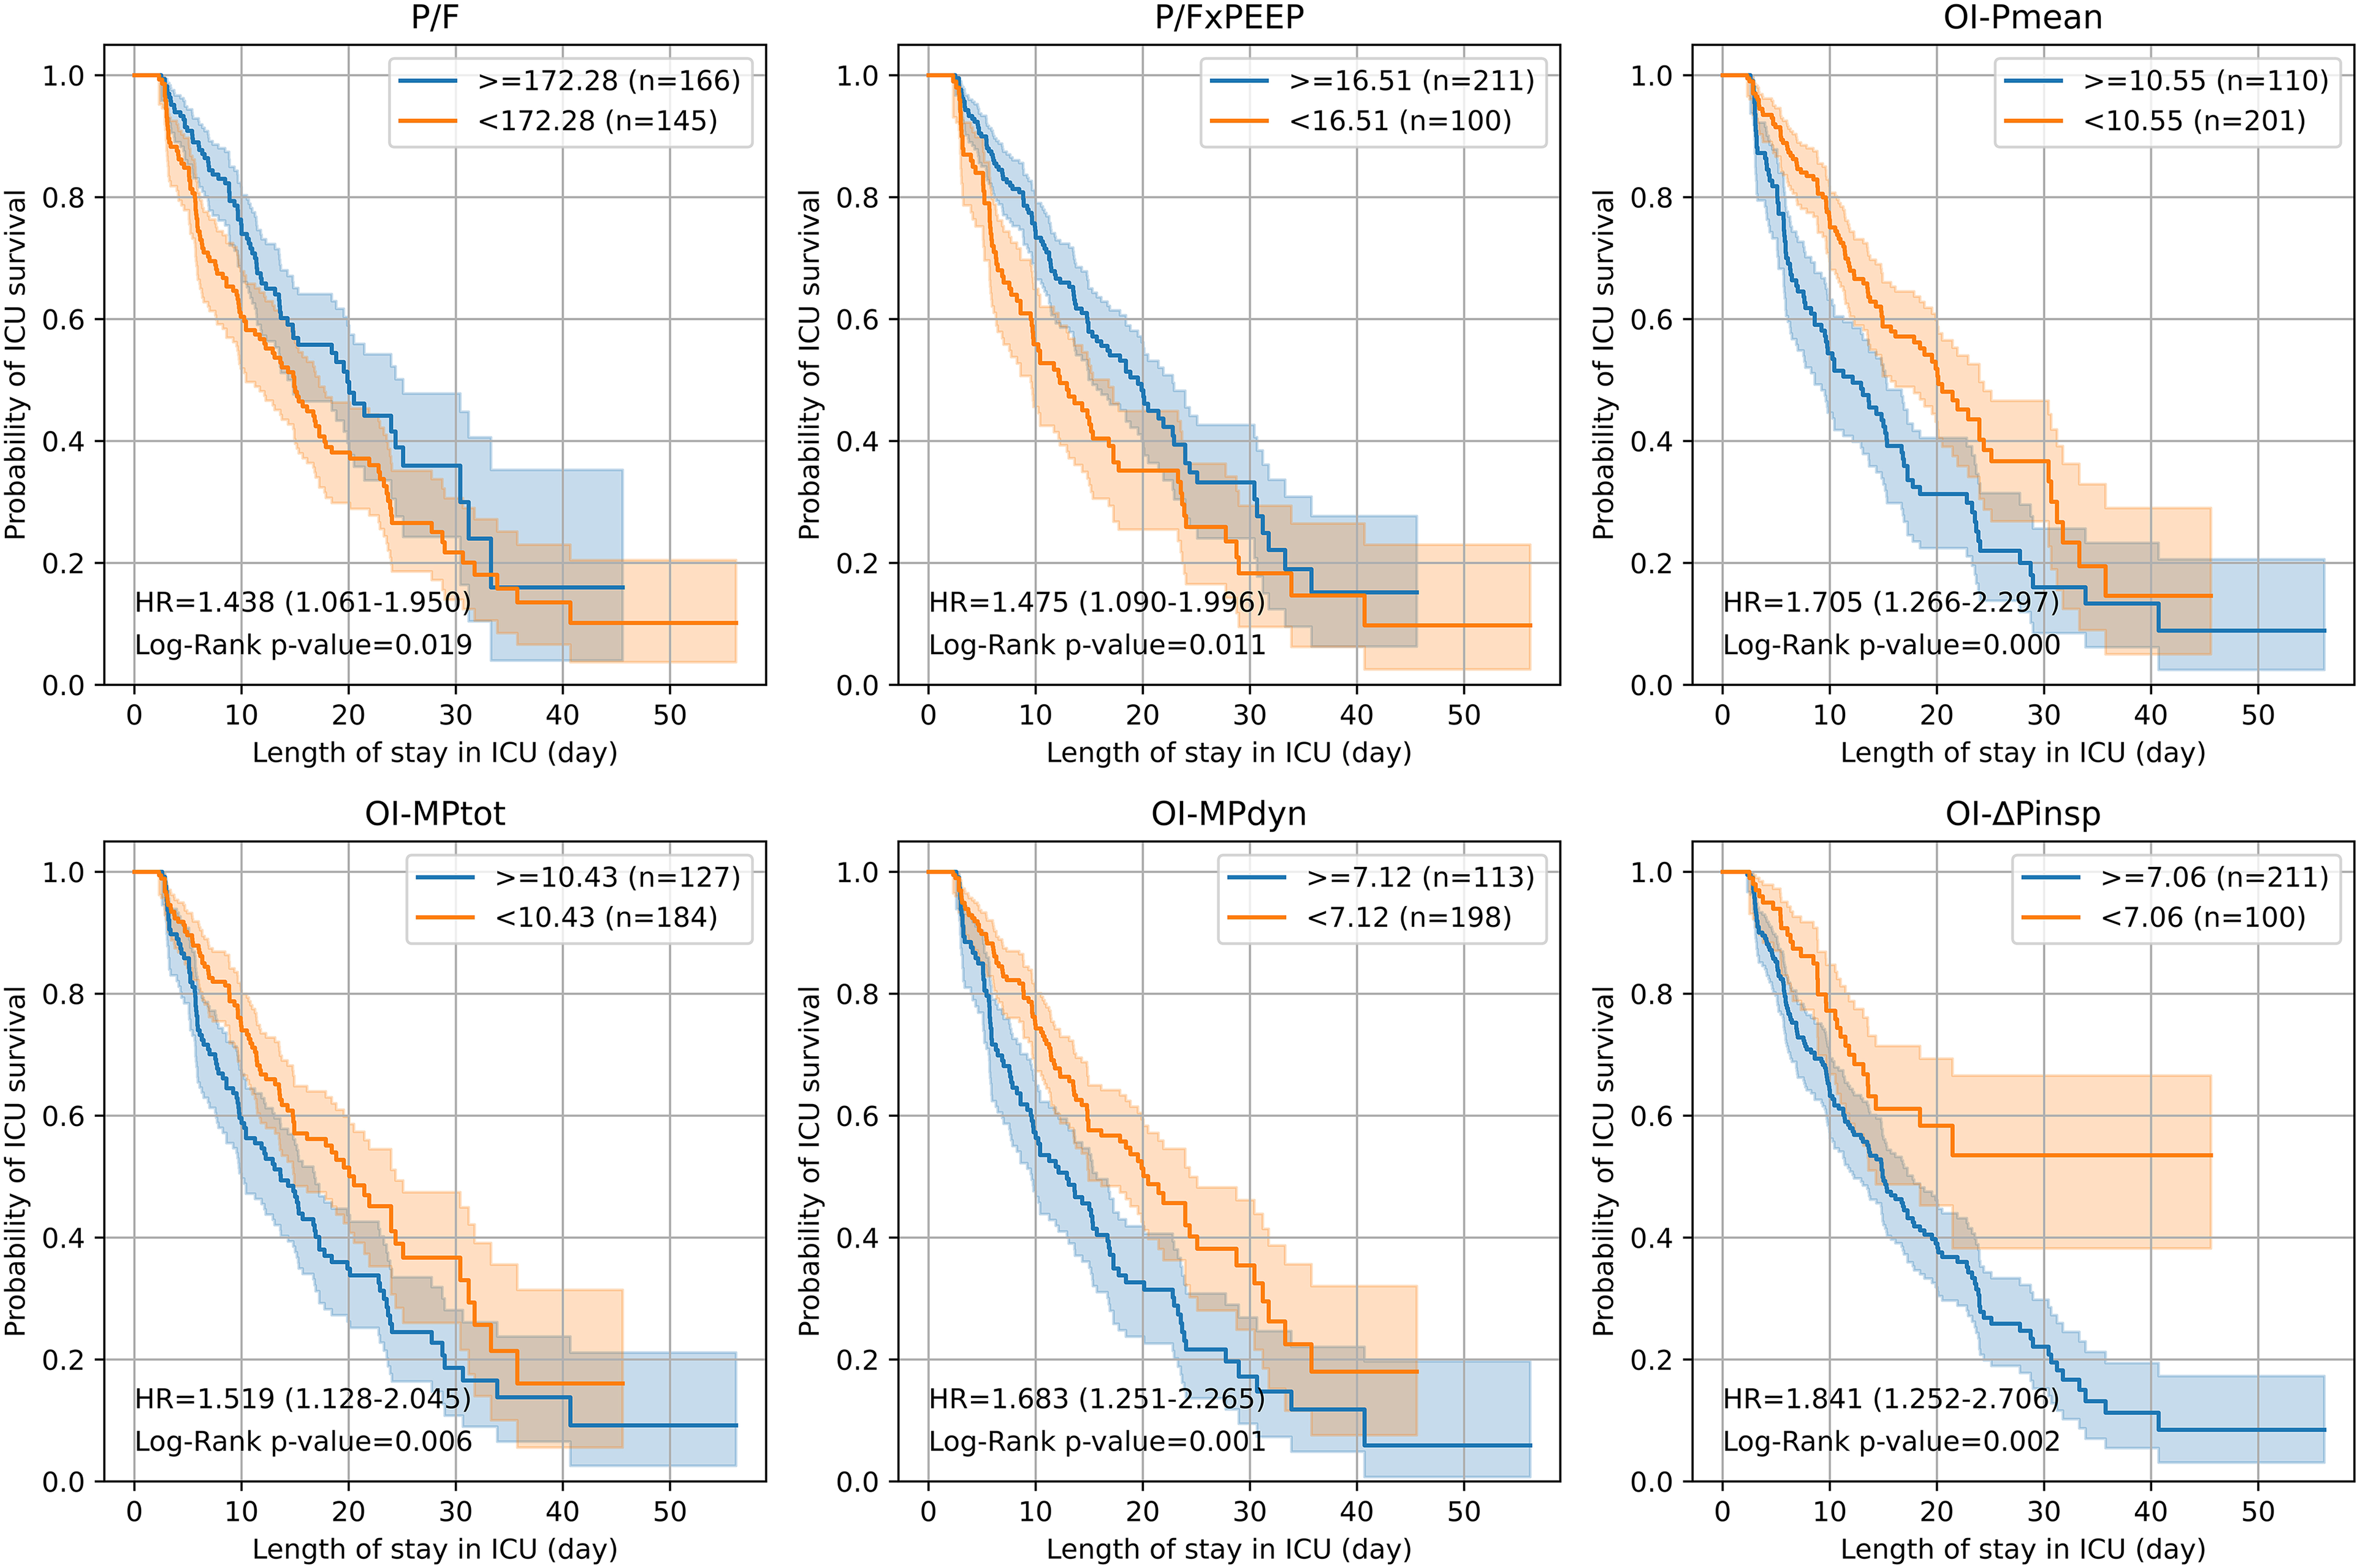
The ICU mortality of 311 patients who survived on day 3 of the protocol, with P/F, P/FxPEEP, OI-Pmean, OI-MPtot, OI-MPdyn, and OI-ΔPinsp parameters above (>=) and below (<) the cut-off values, was analyzed using Cox regression and depicted as Kaplan-Meier survival curves. PaO2/FiO2(P/F): Arterial oxygen pressure / fraction of inspired oxygen, OI-Pmean: Oxygenationindex, OI-ΔPinsp: Driving pressure oxygenation index, OI-MPdyn: Dynamic power oxygenationindex, OI-MPtot: Total power oxygenation index. P/FxPEEP (P/FP): Arterial oxygen pressure / fraction of inspired oxygen×positive end expiratory pressure.
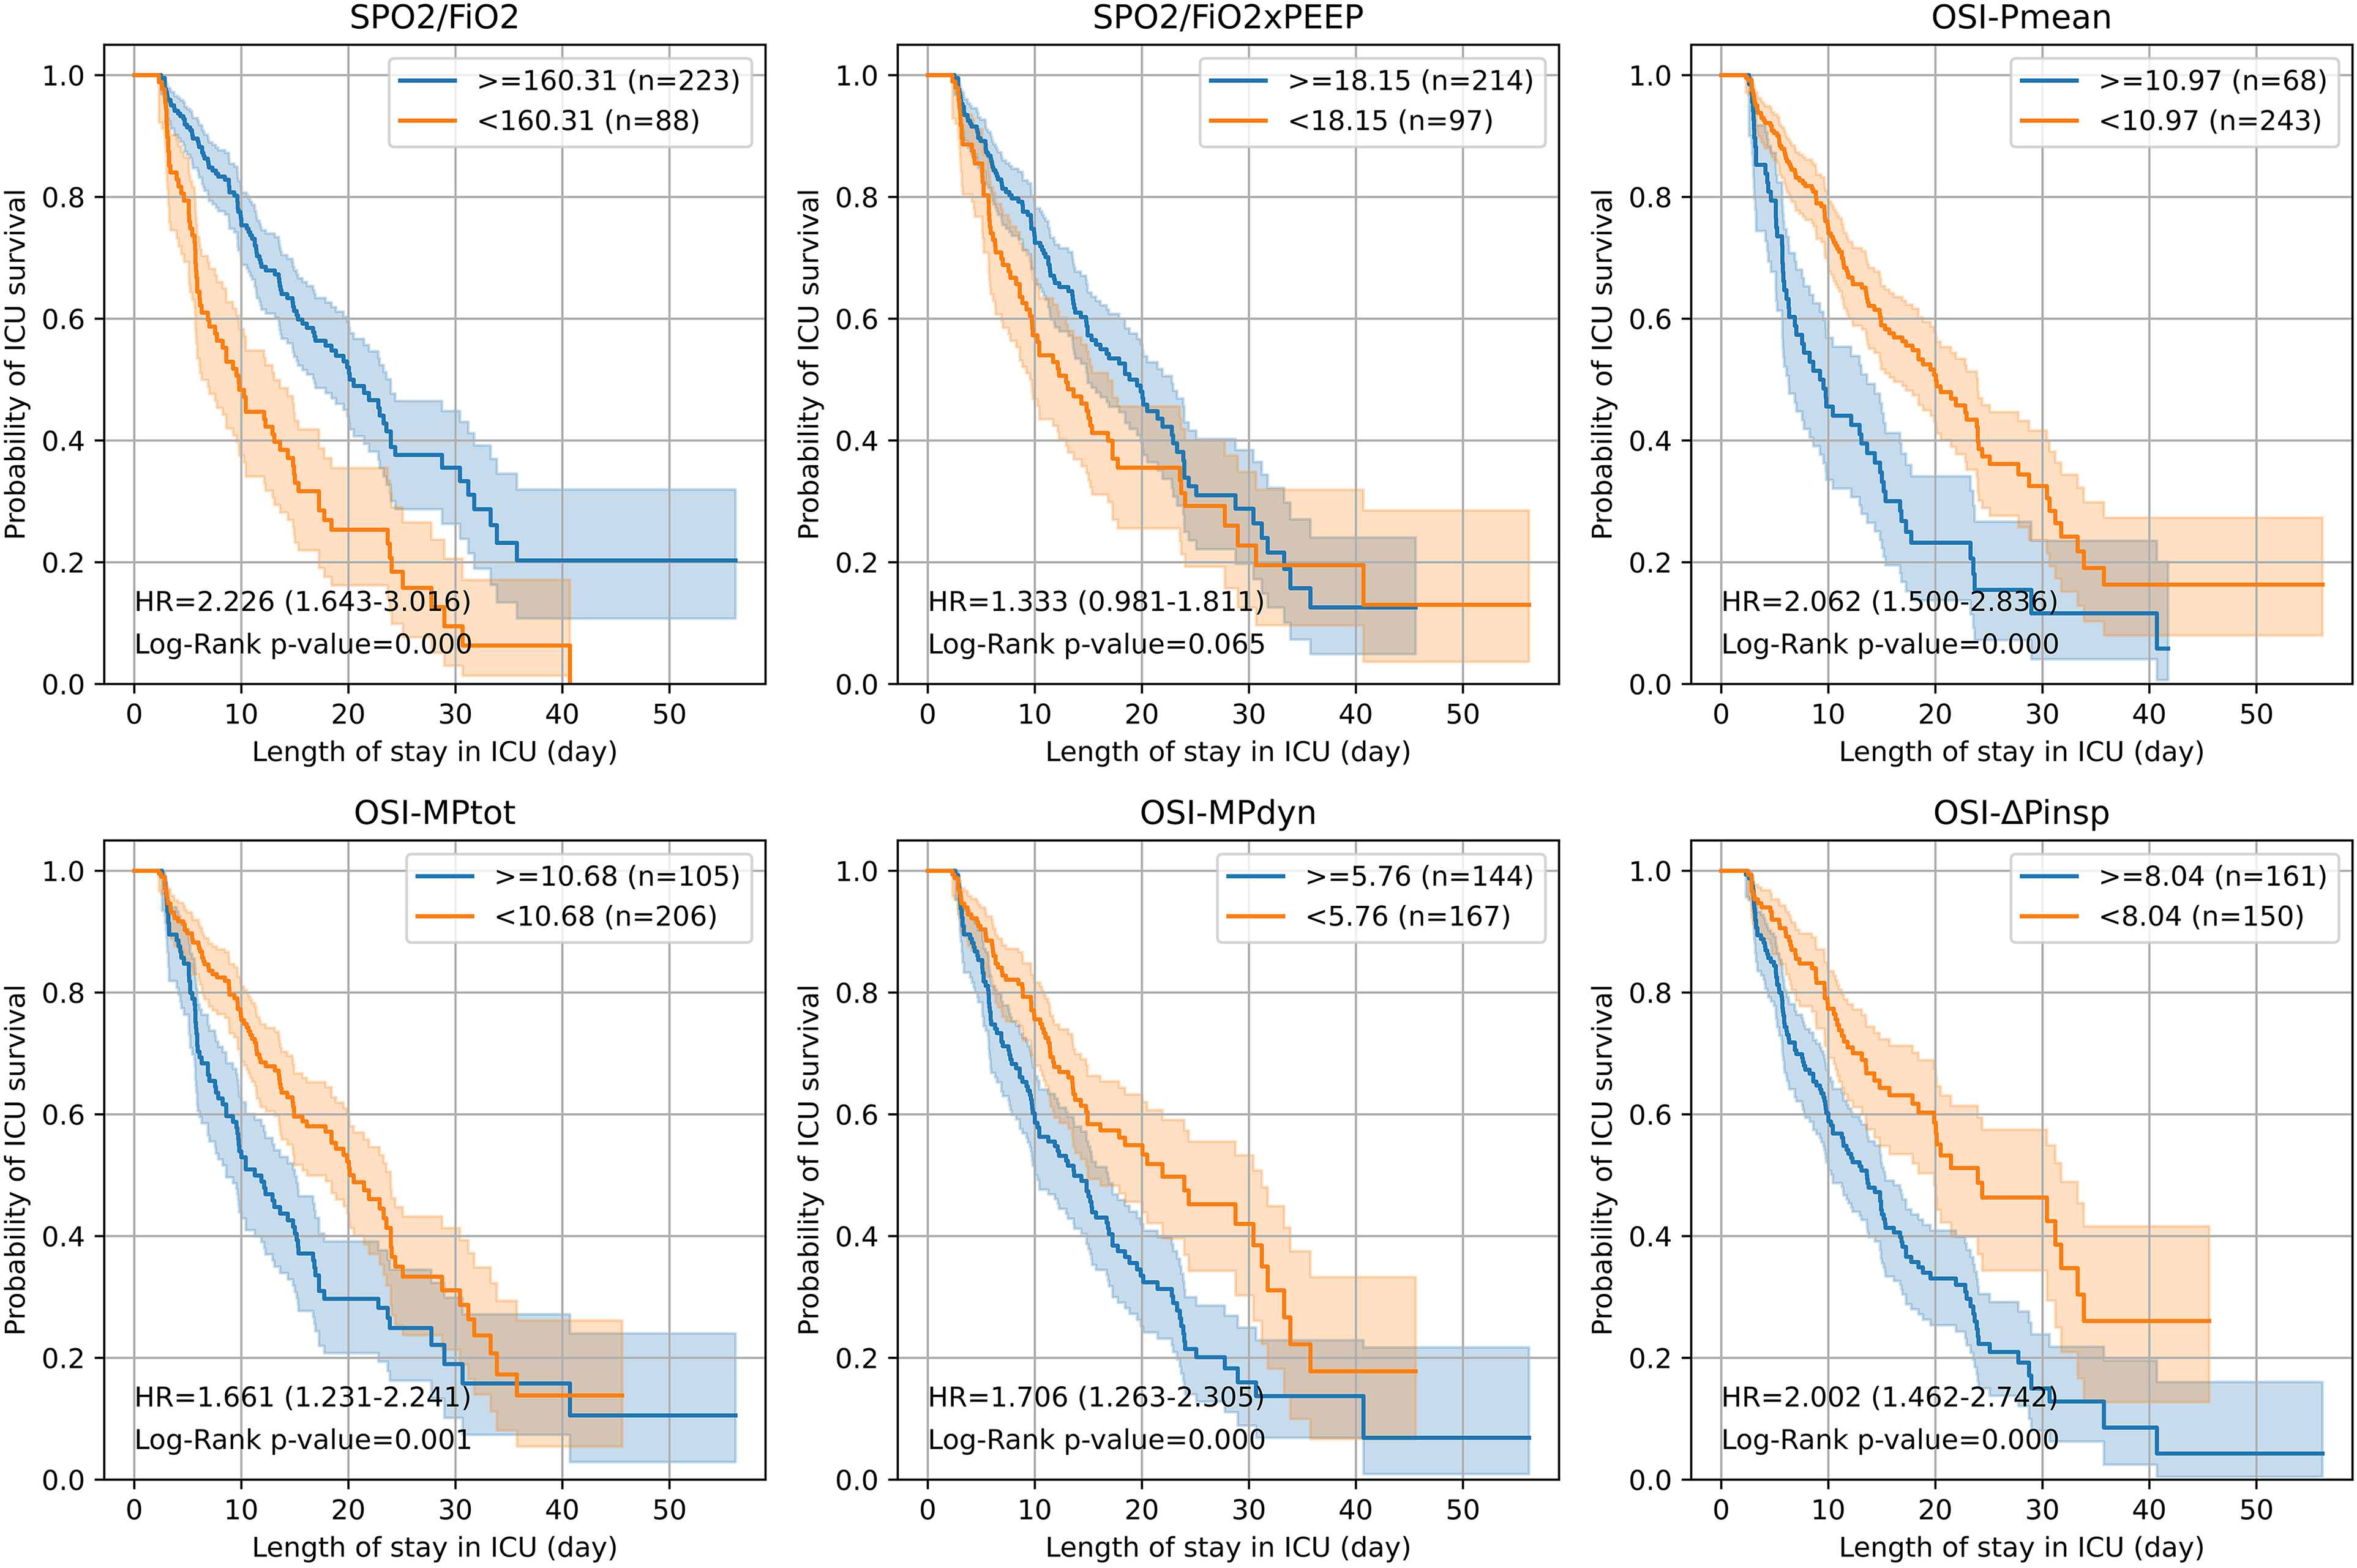
The ICU mortality of 311 patients who survived on day 3 of the protocol with SpO2/FiO2,SPO2/FiO2xPEEP,OSI-Pmean, OSI-MPtot, OSI-MPdyn and OSI-ΔPinsp parameters above (>=) and below (<) cut-off values were analyzed by cox regression and depicted as Kaplan-Meier survival curves. SpO2/FiO2 (SpO2/F): Oxygen saturation / inspired fraction of oxygen, SpO2/FiO2 xPEEP (SpO2/FP): Oxygen saturation / fraction of inspired oxygen×positive end expiratory pressure, OSI-Pmean,: Oxygen saturation index, OSI-ΔPinsp : Driving pressure oxygen saturation index, OSI-MPdyn: Dynamic power saturation index, OSI-MPtot: Total power saturation index.
OI-Pmean, OI-MPtot, OI-MPdyn, and OI-ΔPinsp Parameters: Patients with values exceeding the specified cut-off thresholds (10.55, 10.43, 7.12 and 7.06, respectively) for these indices demonstrated higher ICU mortality rates, with HR and P-values, which were calculated as 1.71 (1.27-2.30) P < .0001, 1.52 (1.13-2.05) P = .006, 1.68 (1.25-2.27) P = .001 and 1.84 (1.25-2.71) P = .002, respectively (Figure 5). Conversely, patients with values below the cut-offs experienced a more favorable outcome, with a substantial difference in VFday. Median values of VFday for these indices were 4.8 (1.6-10.4) days, 5.0 (2.1-10.4) days, 5.0 (2.0-10.4) days, and 7.0 (4.3-10.4) days for OI-Pmean, OI-MPtot, OI-MPdyn, and OI-ΔPinsp, respectively. HR and CI for these indices were 1.99 (1.48-2.68), 1.88 (1.40-2.53), 1.97 (1.46-2.65), and 2.66 (1.81-3.91) (Supplementary Figure 8S).
SpO2/FiO2 and SpO2/FiO2xPEEP Parameters: Patients with SpO2/FiO2 and SpO2/FiO2xPEEP ratios below the defined cut-off values (160 and 18.15, respectivley) experienced higher ICU mortality. HR and CI for these patients were 2.23 (1.64-3.02, P < .0001) and 1.33 (0.98-1.81, P = 0.065), respectively. Additionally, patients with ratios above the cut-off had significantly longer VFday, with median values of 4.3 (1.6-9.8) days and 2.8 (1.4-9.9) days for GE versus LESS in saturation rates. HR and CI for these parameters were 2.22 (1.63-3.01, P < .0001) and 1.51 (1.11-2.05, P = .008) (Supplementary Figure 9S).
OSI-Pmean, OSI-MPtot, OSI-MPdyn, and OSI-ΔPinsp Parameters: Patients with values exceeding the cut-off thresholds (10.97, 10.68, 5.76, and 8.04, respectively) for these indices displayed higher ICU mortality rates, with HR and P-values ranging from 1.66 to 2.06, all statistically significant. Conversely, patients with values below these cut-offs exhibited a marked increase in VFday. Median VFday values for these indices were 4.0 (1.6-10.0) days, 4.2 (2.0-10.0) days, 6.4 (2.8-10.2) days, and 6.8 (4.0-10.4) days for LESS versus GE, respectively. HR, CI, and P-values for these parameters were 1.99, 1.88, 1.97 (all P < .0001), and 2.66 (P < .0001), respectively (Supplementary Figure 9S).
Furthermore, correlations were established between parameters assessed on the third day of ICU hospitalization, including MPtot, MPdyn, Pmean, DP, and PEEP, and various oxygenation and ventilation indices. These correlations suggest potential associations that could contribute to a deeper understanding of patient outcomes. These findings collectively underscore the critical importance of these parameters in predicting ICU outcomes and ventilator-free days for critically ill patients (Supplementary Tables 6S and 7S).
MPtot, MPdyn, Pmean, DP, and PEEP parameters calculated on the third day of ICU hospitalization were found to be correlated with patient averages and PaO2/FiO2, PaO2/FiO2 × PEEP, SpO2/FiO2, SpO2/FiO2 × PEEP, OIPmean, OIΔPinsp, OIMPdyn, OIMPtot, OSIPmean, OSIΔPinsp, OSIMPdyn, and OSIMPtot (Supplementary Figure 10S).
Discussion
It is anticipated that modern mechanical ventilators will be capable of automatically calculating mechanical power, in addition to other respiratory parameters. 32 In this study, we compared newly developed oxygenation and saturation indices, namely the driving pressure oxygenation index (OI - ΔPinsp), dynamic power oxygenation index (OI-MPdyn), total power oxygenation index (OI-MPtot), driving pressure oxygen saturation index (OSI-ΔPinsp), dynamic power oxygen saturation index (OSI-MPdyn), and total power oxygen saturation index (OSI-MPtot) using COVID-19 ARDS patients data. These novel indices employ ΔPinsp (driving pressure) and mechanical power in lieu of Pmean, as opposed to traditional oxygenation and saturation rates and indices such as PaO2/FiO2, PaO2/FiO2 × PEEP, SpO2/FiO2, SpO2/FiO2 × PEEP, oxygen index-OI-Pmean, and oxygen saturation index-OSI-Pmean.
The new oxygenation and saturation indices showed a strong correlation with conventional oxygenation and saturation indices. The study identified a clear distinction between patients who survived and those who did not based on the mean and CI values recorded on the third day. Notably, the OI-ΔPinsp and OSI-ΔPinsp parameters demonstrated the highest predictive values for ICU mortality on the third day. The predictive values of OI-ΔPinsp were significantly higher than those of P/F and OI-Pmean, while a similar pattern was observed between OSI-ΔPinsp and SpO2/FiO2 and OSI-Pmean. However, the HRs (HR) and CIs calculated for the probability of ICU survival and probability of extubation using OI-ΔPinsp and OSI-ΔPinsp indices were close to the values calculated for SpO2/FiO2, OI-Pmean, and OSI-Pmean.
Among the newly calculated oxygenation and saturation indices based on mechanical power, only OSI-MPdyn exhibited significantly higher predictive values compared to SpO2/FiO2 and OSI-Pmean. No significant differences were observed in the predictive values between OI-MPtot, OSI-MPtot, and OI-MPdyn parameters and those of conventional indices. The indices with the lowest predictive values were P/FxPEEP and SpO2/FiO2xPEEP. Predictive values of P/F, SpO2/FiO2, OSI-Pmean, and OI-Pmean indices were close to each other in this analysis. These findings shed light on the varying degrees of predictability offered by different indices, emphasizing the potential superiority of OSI-MPdyn in prognosticating clinical outcomes.
The historical use of PaO2/FiO2 ve SpO2/FiO2 ratios as indicators for assessing oxygenation and predicting outcomes in ARDS patients has been well established.10,33 However, several studies have demonstrated the limitations of the PaO2/FiO2 ratio in both diagnosing ARDS and predicting patient outcomes.4,8,12 These limitations have spurred investigations into more effective methods for evaluating oxygenation in individuals with ARDS. Additionally, a recent study showed that Pmean, which is included in the OI-Pmean and OF formulas, is a non-specific variable because Pmean depends on many parameters such as inspiratory time flow, respiratory rate (RR), peak inspiratory pressure (Ppeak), and positive end-expiratory pressure (PEEP). 34
It has been demonstrated that the PaO2/FiO2xPEEP ratio, which includes PEEP in its formula, provides a more accurate prediction of ARDS severity and mortality compared to the traditional P/F ratio in the first 72 h of non-COVID-19 ARDS patients in the ICU.17,35 In our study conducted in C-ARDS patients, the third day values of PaO2/FiO2×PEEP and SpO2/FiO2×PEEP factors were found to be lower than the mortality prediction values of P/F and SpO2/FiO2. Of all the indices, the ICU mortality prediction, and the HR of indices calculated from PEEP and total mechanical power, which considers the contribution of PEEP, were found to be lower. On the contrary, the indices (especially OI-ΔPinsp, OSI-ΔPinsp and OSI-MPdyn) calculated from MPdyn (elastic component of power) with the contribution of ΔPinsp and ΔPinspwere found to be successful. This may be due to the protective effect of high PEEP and low ΔPinsp values in ARDS patients. 36 Especially limiting ΔPinsp levels (<15 cmH2O) are thought to be important in the protective mechanical ventilation strategy. 36 To our knowledge, there are no published studies examining the relationship between driving pressure and mechanical power with oxygenation and saturation.
According to the multivariate analysis results of the breakpoints of the third day values, the parameters that best predict intensive care mortality (OI-ΔPinsp, OI-MPdyn, OSI-ΔPinsp and OSI-MPdyn) were found to be correlated with the pressure and power values from which the indices were calculated (Supplementary Figure 10S). A similar situation was observed for conventional oxygenation and saturation indices. From this perspective, it can be considered that the mortality prediction performance of the indices is closely related to the pressure and power parameters included in the calculations.
Cut-off values of all indices were found to be associated with intensive care mortality. On the third day, it was observed that patients whose P/F and SpO2/FiO2 were below the cut-off values (172 and 160, respectively) had higher ICU mortality and fewer VF-days than those who were above them. Patients above the cut-off value of OI-Pmean, OSI-Pmean, OI-ΔPinsp, OI-MPdyn, OI-MPtot, OSI-ΔPinsp, OSI-MPdyn and OSI-MPtot indices had higher ICU mortality and fewer VF-days than those below the cut-off value. Critical values of all indices were found to be associated with intensive care mortality. However, the calculated risk values (close HR values) in terms of probability of ICU survival and probability of extubation were found to be close between the patients above and below the cut-off values of the the new indices and conventional indices. There is almost no difference between the prominent new indices (OI-ΔPinsp, OSI-ΔPinsp and OSI-MPdyn) and the OI and OSI values calculated from Pmean.
While OSI-Pmean and OI-Pmean were initially developed for diagnosing hypoxia in pediatric patients, their utility has expanded to include the diagnosis and outcome prediction for adult ARDS patients.37,38 However, it is worth noting that the reliability of these variables in predicting outcomes has been questioned, primarily due to their application in non-standard ventilator settings. 39 To address these concerns, recent research has shed light on alternative indicators. For instance, in a study involving C-ARDS patients, it was found that SpO2/FiO2 values exceeding 179 on the second day of intensive care and 199 on the third day were independently associated with 28-day intensive care mortality. 40 Additionally, a strong correlation has been identified between P/F and SpO2/FiO2, both of which are commonly used for risk assessment and patient monitoring in intensive care settings.40,41 These findings highlight the evolving landscape of diagnostic and prognostic tools in critical care medicine, emphasizing the need for ongoing research and evaluation of these parameters in diverse clinical contexts.
A recent study suggested that the SpO2/FiO2 ratio as a more reliable and noninvasive alternative to the P/F ratio, particularly in situations where maintaining arterial catheterization becomes challenging due to thrombotic complications. 41 In another analysis of C-ARDS patients, it was observed that P/F, SpO2/FiO2, OI-Pmean, and OSI-Pmean values were associated with hospital mortality on both the third and seventh days after intubation, with the odds ratio being higher on the seventh day compared to the third day. 42 High OI-Pmean and OSI-Pmean values were found to be correlated with negative outcomes in both C-ARDS and non-C-ARDS patients, reinforcing their significance in clinical assessments.12,13,16,42 These studies have reaffirmed the value of conventional oxygenation indices as reliable predictors of outcomes for ARDS patients. Moreover, the new oxygenation indices, OI-ΔPinsp, OSI-ΔPinsp, and OSI-MPdyn, have demonstrated superior mortality predictive capabilities compared to the traditional indices in C-ARDS patients. The incorporation of these novel indices into clinical practice may serve as valuable tools for intensivists in making critical decisions regarding patient care.
The critical values associated with intensive care mortality for various pressures and mechanical power parameters (Pmean; 17 cmH2O, Ppeak; 26 cmH2O, ΔPinsp; 15 cmH2O, PEEP; 9.3 cmH2O, MPtot; 17 j/min) were found to align with previously published studies, supporting the clinical relevance of these thresholds.21,43–45 Notably, patients who remained in the prone position for more than 15.5 h per day exhibited a lower rate of intensive care mortality. This observation corresponds with findings from other investigations, which have reported reduced mortality rates in patients who spent more than 16 h per day in the prone position.43,46 However, it's important to note that the difference in prone position duration between survival and non-survival patients became evident primarily on the seventh day of treatment (Supplementary Figure 4S). This timing is consistent with previous research, both in the context of C-ARDS and non-C-ARDS patients, indicating that the therapeutic benefits of prone positioning tend to become more pronounced around the 5-7 day mark after intubation.47–49
In summary, this study found that the novel saturation and oxygenation indices showed the strongest predictive value for ICU mortality on the third day of treatment. Particularly, OI-ΔPinsp, OSI-ΔPinsp, and OSI-MPdyn emerged as promising indicators for predicting clinical outcomes. OI-MPtot, OSI-MPtot and OI-MPdyn indices also demonstrated the ability to predict clinical outcomes at a level comparable to conventional indices. However, given their more complex calculations and the absence of any discernible advantages in this study, further commentary on these indices is withheld at this time. These findings contribute valuable insights into the potential utility of these novel indices in the clinical decision-making processes of intensive care physicians.
Limitations
This study is accompanied by several notable limitations that should be taken into consideration. Firstly, it is essential to acknowledge that although we intended to calculate mechanical power by measuring airway pressures (Pinsp or Ppeak) from the distal part of the ventilator, the capabilities of our ventilators limited us to proximal measurements. A significant majority of the patients in our study, accounting for 95% of the cohort (343 patients), were ventilated using pressure-controlled modes (PCV and PRVC). This limitation suggests that the results may have been more accurate if measured distally, and it highlights the need for further investigation into new oxygenation and saturation indices specifically tailored for volume-controlled ventilation (VCV) in larger patient groups.
Secondly, it is imperative to note that alveolar pressure (Pplateau) measurements were not conducted during ventilation in PCV mode as part of our study protocol. Typically, Pplateau is measured before exhalation begins after the patient has completed inhalation. This is achieved through an inspiratory hold or pause maneuver lasting for a brief period, typically 0.5 or 1.5 seconds. It is conventionally assumed that airway pressure (Pinsp) and Pplateau are equivalent in PCV mode,30,31 based on the belief that the pressure–time graph of Pinsp exhibits a flat shape. However, recent research has cast doubt on this assumption. 50
In the presence of high inspiratory resistance (as seen in conditions like COPD) or during instances of short inspiratory time, airflow may persist at the conclusion of inspiration, necessitating a manual inspiratory hold maneuver to accurately measure Pplateau. 50 At this point, the pressure curve will decrease and stabilize at Pplateau, which may be lower than Pinsp. 50 A study conducted by Aşar et al in patients with COVID-19-associated ARDS (C-ARDS) ventilated in PCV mode with inspiratory resistance (Ri) values of 10, 15, and 20 cmH2O. s/L indicated that Pplateau pressure was consistently approximately 1 cmH2O lower than Pinsp when the resistance was set at 15 cmH2O. s/L, a value typically accepted for ARDS patients.51,52 Nevertheless, it is important to note the necessity for future prospective studies to validate the mathematical methods employed in calculating this 1 cmH2O pressure difference. Such studies should incorporate Ri measurements conducted using the least-square fit method (LSF) and Pplateau measurements obtained through inspiratory hold maneuvers with corresponding Ri measurements conducted via LSF.
The timing of the patients’ placement into prone position during the study was not recorded in the software. Consequently, the status of the indices before, during, and after prone was not evaluated. Additionally, a limitation of the study is the lack of investigation into the performance of new saturation and oxygenation indices for predicting outcomes in non-COVID-19 ARDS patients, leading to uncertainty about their validity. The cutoff values and predictions of the new indices for diagnosing ARDS in COVID-19 and non-COVID-19 patients have not yet been investigated.
Conclusion
Critical values of all indices were associated with higher ICU mortality and longer duration of mechanical ventilation. ICU mortality prediction values were best for the OI-ΔPinsp, OSI-ΔPinsp and OSI-MPdyn indices. These new indices will assist intensivists in the clinical management and decision-making process of ARDS patients.
Supplemental Material
sj-docx-1-jic-10.1177_08850666231223498 - Supplemental material for Novel Oxygenation and Saturation Indices for Mortality Prediction in COVID-19 ARDS Patients: The Impact of Driving Pressure and Mechanical Power
Supplemental material, sj-docx-1-jic-10.1177_08850666231223498 for Novel Oxygenation and Saturation Indices for Mortality Prediction in COVID-19 ARDS Patients: The Impact of Driving Pressure and Mechanical Power by Sinan Aşar, Fatih Rahim, Payam Rahimi, Özlem Acicbe, Furkan Tontu and Zafer Çukurova in Journal of Intensive Care Medicine
Footnotes
Declaration of Conflicting Interests
The author(s) declared no potential conflicts of interest with respect to the research, authorship, and/or publication of this article.
Funding
The author(s) received no financial support for the research, authorship, and/or publication of this article.
Supplemental Material
Supplemental material for this article is available online.
References
Supplementary Material
Please find the following supplemental material available below.
For Open Access articles published under a Creative Commons License, all supplemental material carries the same license as the article it is associated with.
For non-Open Access articles published, all supplemental material carries a non-exclusive license, and permission requests for re-use of supplemental material or any part of supplemental material shall be sent directly to the copyright owner as specified in the copyright notice associated with the article.