
Abstract
Background
There is little information comparing the performance of community acquired central nervous system infections (CNSI) treatment by intensive care units (ICUs) specialized in infectious diseases with treatment at other ICUs. Our objective was to reduce these gaps, creating bases for benchmarking and future case-mix classification.
Methods
This is a retrospective observational cohort of 785 admissions with 82 cases of CNSI admitted to the ICU of an important Brazilian referral center for infectious diseases (INI) between January 2012 and January 2019. Comparisons were made to data retrospectively collected from the 303,500 intensive care admissions from the Brazilian state health care system included in the Epimed Monitor database. Clinical, epidemiologic, and performance indicators: the standardized mortality rate (SMR) and the standardized resource use rate per ICU surviving patient (SRU) were collected.
Results
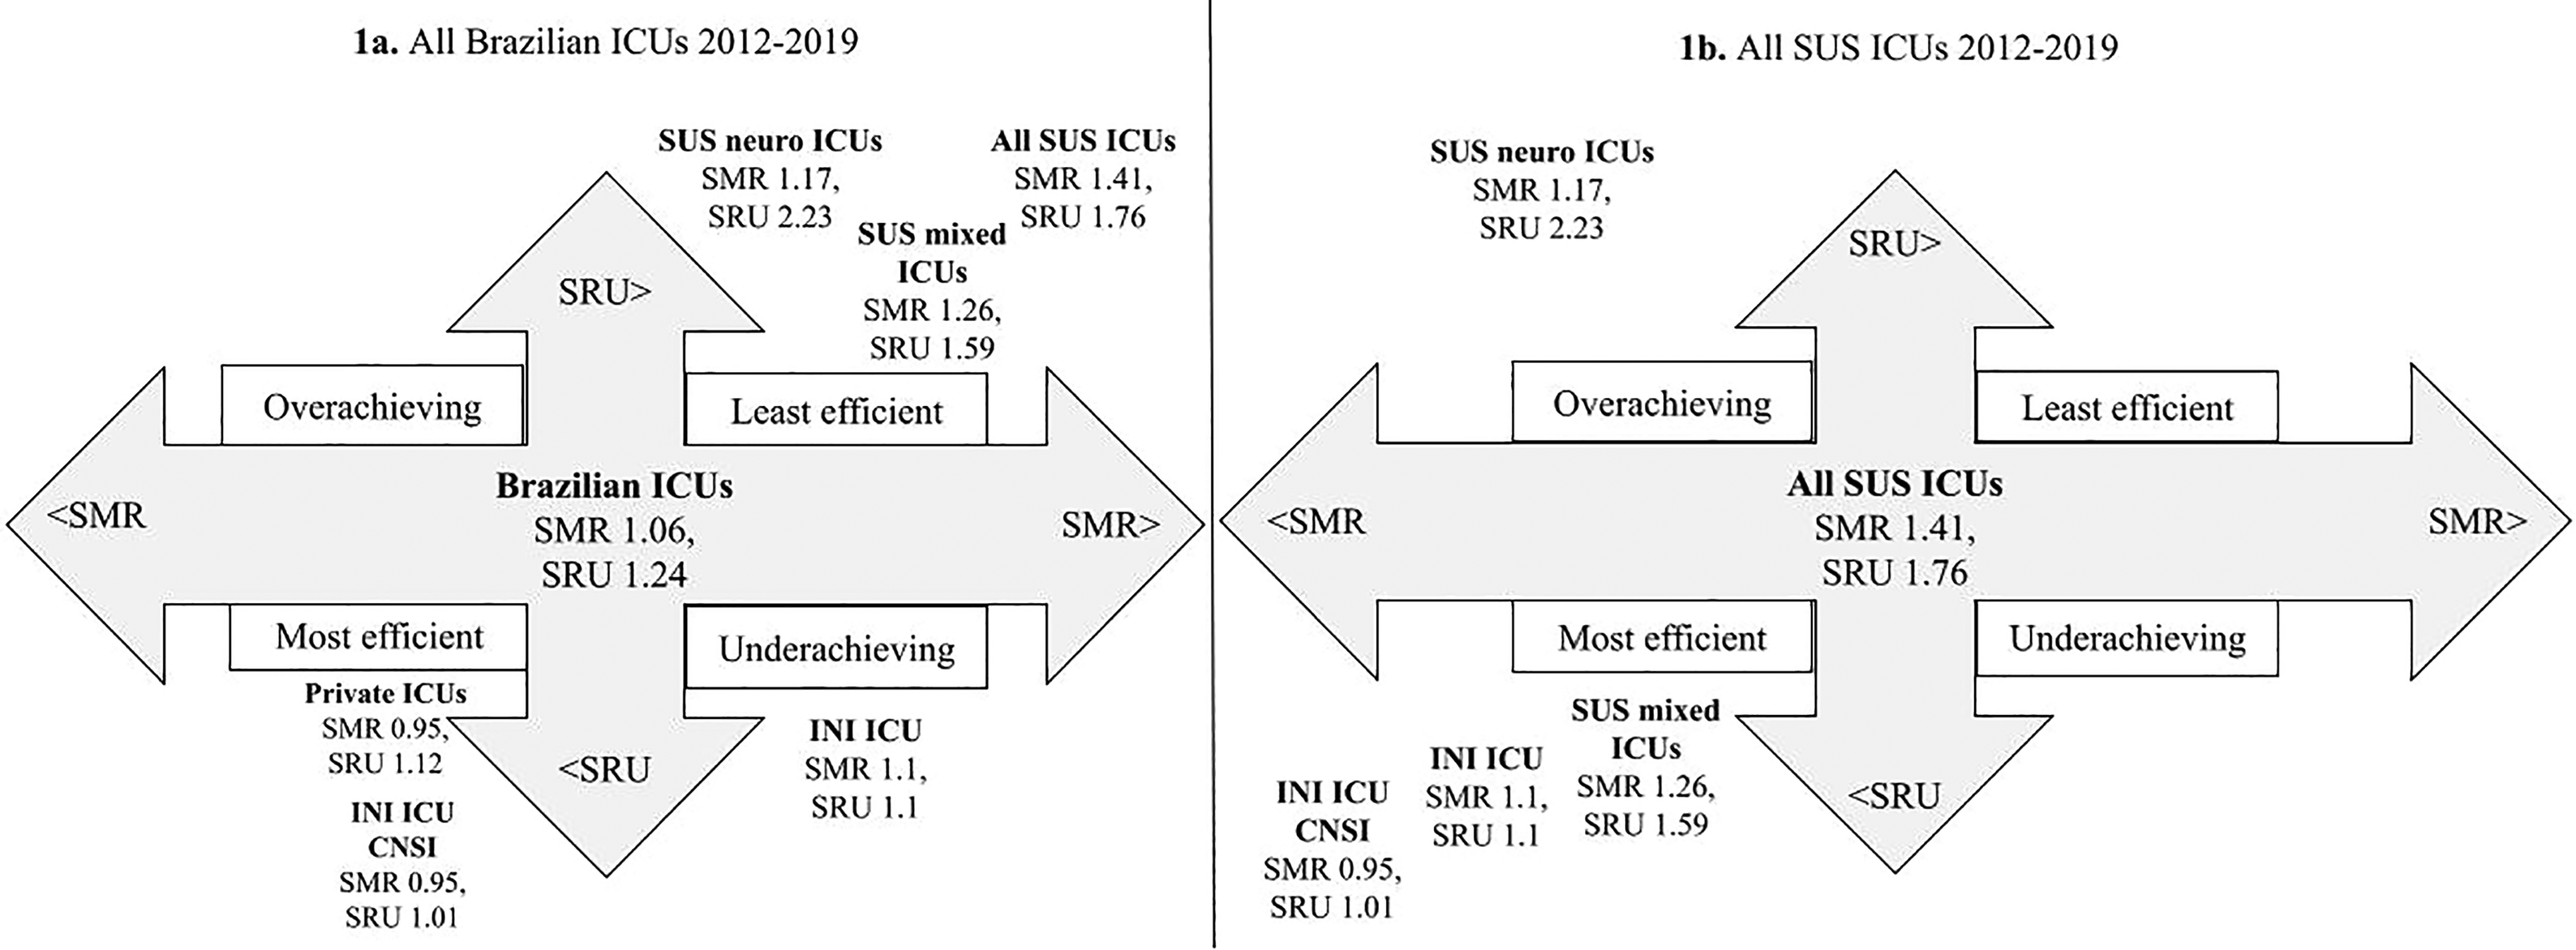
Case-mix infections profile and SMR/SRU data. SUS Mixed medical/surgical ICUs: SMR = 1.26, SRU = 1.59; SUS Neurological ICUs: SMR = 1.17, SRU = 2.23; INI ICU: SMR = 1.1, SRU = 1.1; INI ICU CNSI patients: SMR = 0.95, SRU = 1.01.
Conclusions
Severe patients with CNSI can be efficiently and effectively treated in an ICU specialized in infectious diseases when compared to mixed medical/surgical and neurological ICUs from the public health system. At the same time, we provided profiling and a case-mix that can help and encourage benchmarking by other institutions and other countries.
Key Messages
Introduction
In recent years, substantial research has been carried out to study the performance of intensive care units (ICUs) and comparisons between them, allowing for an improvement in the quality of care and, consequently, in patient outcomes.1,2 One of the pillars of intensive care is to reduce mortality with the highest possible quality of life. In 2010, the “Brazilian Association of Intensive Care Medicine” (Associação de Medicina Intensiva Brasileira -
The Epimed Monitor system 4 is present in more than 500 hospitals across Brazil with 1000 ICUs and 13,000 monitored beds, totaling more than 2,500,000 patients in its database. Among them, there are 378 ICUs with 6627 beds and 446,329 patients from the Sistema Único de Saúde (SUS), Brazilian state health care system. The ICUs are classified in general (mixed medical/surgical), cardiological, oncological, neurological, surgical, pediatric, and burn specialized units. This initiative allowed the creation of a benchmarking system: benchmarking involves the use of quantitative, standardized measurements to allow comparison of performance between ICUs. It can provide the unit staff and hospital managers with a broader view and clearer perspectives of targets for improvement. It has been used among hospital networks as well as in national and international registries providing both blinded and open comparisons. 4
However, specialized infectious diseases intensive care units (IDICU) are different from general ICUs regarding case mix, disease severity, and mortality rate. 5 There are few units in Brazil (less than 10 units) and there is also a large information gap about this type of unit in the medical literature and difficulties to compare and benchmark them.6,7 In many places, it is not even considered an official intensive care specialization. 8 Just recently, with the emergence/re-emergence of high consequence infectious disease (HCID), growing interest has been developing in this field. 9
HCID is an acute infectious disease with a high case-fatality rate with no or low-efficiency prevention or treatment. They may spread rapidly through communities, and they are usually challenging to differentiate from other common infections. Viral hemorrhagic fevers, airborne agents, and central nervous system infections (CNSI), like encephalitis, are important examples of HCID. 10 Encephalitis may be considered a hallmark, as it is a severe clinical manifestation of several emerging and reemerging pathogens. A systematic review and meta-analysis of 154 studies 11 of CNSI published between 1990 and 2016 concluded that the global prevalence was 0.4%, making them rare diseases. However, the prevalence can vary from 1%, in general ICUs to 10% or higher in IDICUs,5,12,13 suggesting that these units may be the ideal places for sentinel syndromic surveillance for CNSI and other HCID. This approach would allow focusing on new diseases with tremendous potential for severe morbidity and mortality. 14
There is also little information on the performance of intensive care for those infections in the literature or which is the best place to manage those patients: mixed medical/surgical ICUs, neurological ICUs or IDICUs. 15
In this study, we aimed to compare an IDICU with a sample of severe patients with community acquired CNSI to the SUS. This profiling could serve as a comparative basis for benchmarking other IDICUs and potentially provide a better understanding of case-mix classification, 16 treatment performance, and surveillance of infections in the central nervous system in ICUs.
Materials and Methods
This study is a retrospective observational cohort of admissions to the ICU of an important Brazilian referral center for infectious diseases (INI) with 25 beds, including four intensive care beds, and an average of 10 hospitalizations/month. We included all patients admitted to the ICU from January 2012 to January 2019 and excluded those with ICU length of stay less than 6 h (10 patients), and ICU admissions with missing data (20 patients). Comparisons were made to retrospectively collected data on over a million Brazilian intensive care patients and 303,500 intensive care patients from SUS included in the Epimed Monitor database (EPIMED) for the same time period.
Data Collection and Definitions
Clinical and operational intensive care information from the INI patients was obtained from the EPIMED and medical records review, and the Brazilian health system information, from the EPIMED. The Research Electronic Data Capture (REDCap) web-based form were used for collection and then data was exported to spreadsheet files of the Microsoft Excel 2020® for statistical analysis in the MedCalc® application, version 19.8, for Microsoft Windows.
Clinical and ICU Operational Profiling
All variables and the diagnostic criteria/definitions of comorbidities and of the CNSI are detailed Supplementary Data File 1. In short, the following data were collected:
General demographic data, dates of admission to the hospital and the ICU, dates of discharge from ICU and hospital, condition of discharge (dead/alive), reasons for admission to the ICU, comorbidities. Clinical and prognostic variables, in the first 24 h of admission to the ICU, that express severity of disease, among them the prognostic scores Simplified Acute Physiologic Score 3 (SAPS 3) with its estimated probability of death17,18 and the Sequential Organ Failure Assessment score (SOFA).19,20 ICU resources consumption and ICU complications/outcomes: The standardized resource use rate per ICU surviving patient (SRU) and the system standardized mortality rate (SMR). Central nervous system infectious profile for INI ICU.
Benchmarking
ICU performance was measured through the assessment of two parameters: the standardized mortality rate (SMR), which is the ratio between the actual mortality and the average expected mortality by an illness severity score; and the standardized resource use rate per ICU surviving patient (SRU), the ratio between the survivors’ length of stay (LOS) and the expected LOS, also estimated from and adjusted by the severity. We used SAPS 3 as the preferred ICU severity score.
Rothen et al 21 created an ICU efficiency evaluation system based on its SMR and the SRU. When the unit's SMR and SRU were below the median SMR and SRU from the other units of a time and place, it was classified as “most efficient”. The ICUs with both SMR and SRU above the median, “least efficient”; low SMR and high SRU, “overachieving”; and the ones with high SMR and low SRU were defined as “underachieving”. In their sample, median SMR values higher than 1.00 represented an “above average” mortality ratio, and median SRU values higher than 1.07 designated an “above average” resource use per surviving patient.
So, for benchmarking, SMR/SRU data from Brazilian ICUs were used. 3 First, as a general picture, all Brazilian ICUs, all SUS ICUs, and all ICUs from private hospitals (private ICUs) were compared to SUS mixed medical/surgical ICUs (SUS mixed ICUs), SUS’ neurological ICUs (SUS Neuro ICUs), admissions to INI's intensive care unit (INI ICU) and admissions to INI's ICU with central nervous system infections (INI ICU CNSI).
Then, clinical/epidemiological and ICU operational data from INI ICU admissions were compared with admissions to SUS mixed ICU, and INI ICU CNSI admissions were compared with admissions to SUS Neuro ICUs. These two types of units were chosen for detailing because they are the places with the closest clinical profile, and where cases of CNSI are expected to be found in the health system. So, INI ICU was used as a proxy for the few units specialized in infectious diseases in the country. Andrade et al showed, in a previous study, that the clinical profile of at least three IDICUs in the country is very similar. 22
Statistical Analysis
Categoric variables were presented as frequencies. Statistical comparisons of the discrete variables were performed using the χ2-statistic. The quantitative variables were presented as averages with standard deviation (SD) and as medians with interquartile range (IQR). Differences in continuously distributed data were evaluated using Student's t-test for means, or Mann–Whitney test (U) for medians, in some cases. For the confidence interval of the difference between the two rates, we used the “test-based method”, 23 where the p-value is obtained using the χ2-statistic. Confidence interval 95% (CI) and P-value < 0.05 were considered to indicate statistical significance.
Results
ICU Profiling
Demographics, clinical characteristics of the patients and the main causes of their admission are summarized in Table 1. Seven hundred and eighty admissions to INI ICU were included and compared to 291,500 admissions to SUS mixed ICUs. Eighty-seven INI CNSI admissions were compared to 12,000 SUS Neuro ICU admissions.
ICUs Demographics, Clinical Characteristics and Causes of Admission 2012–2019.
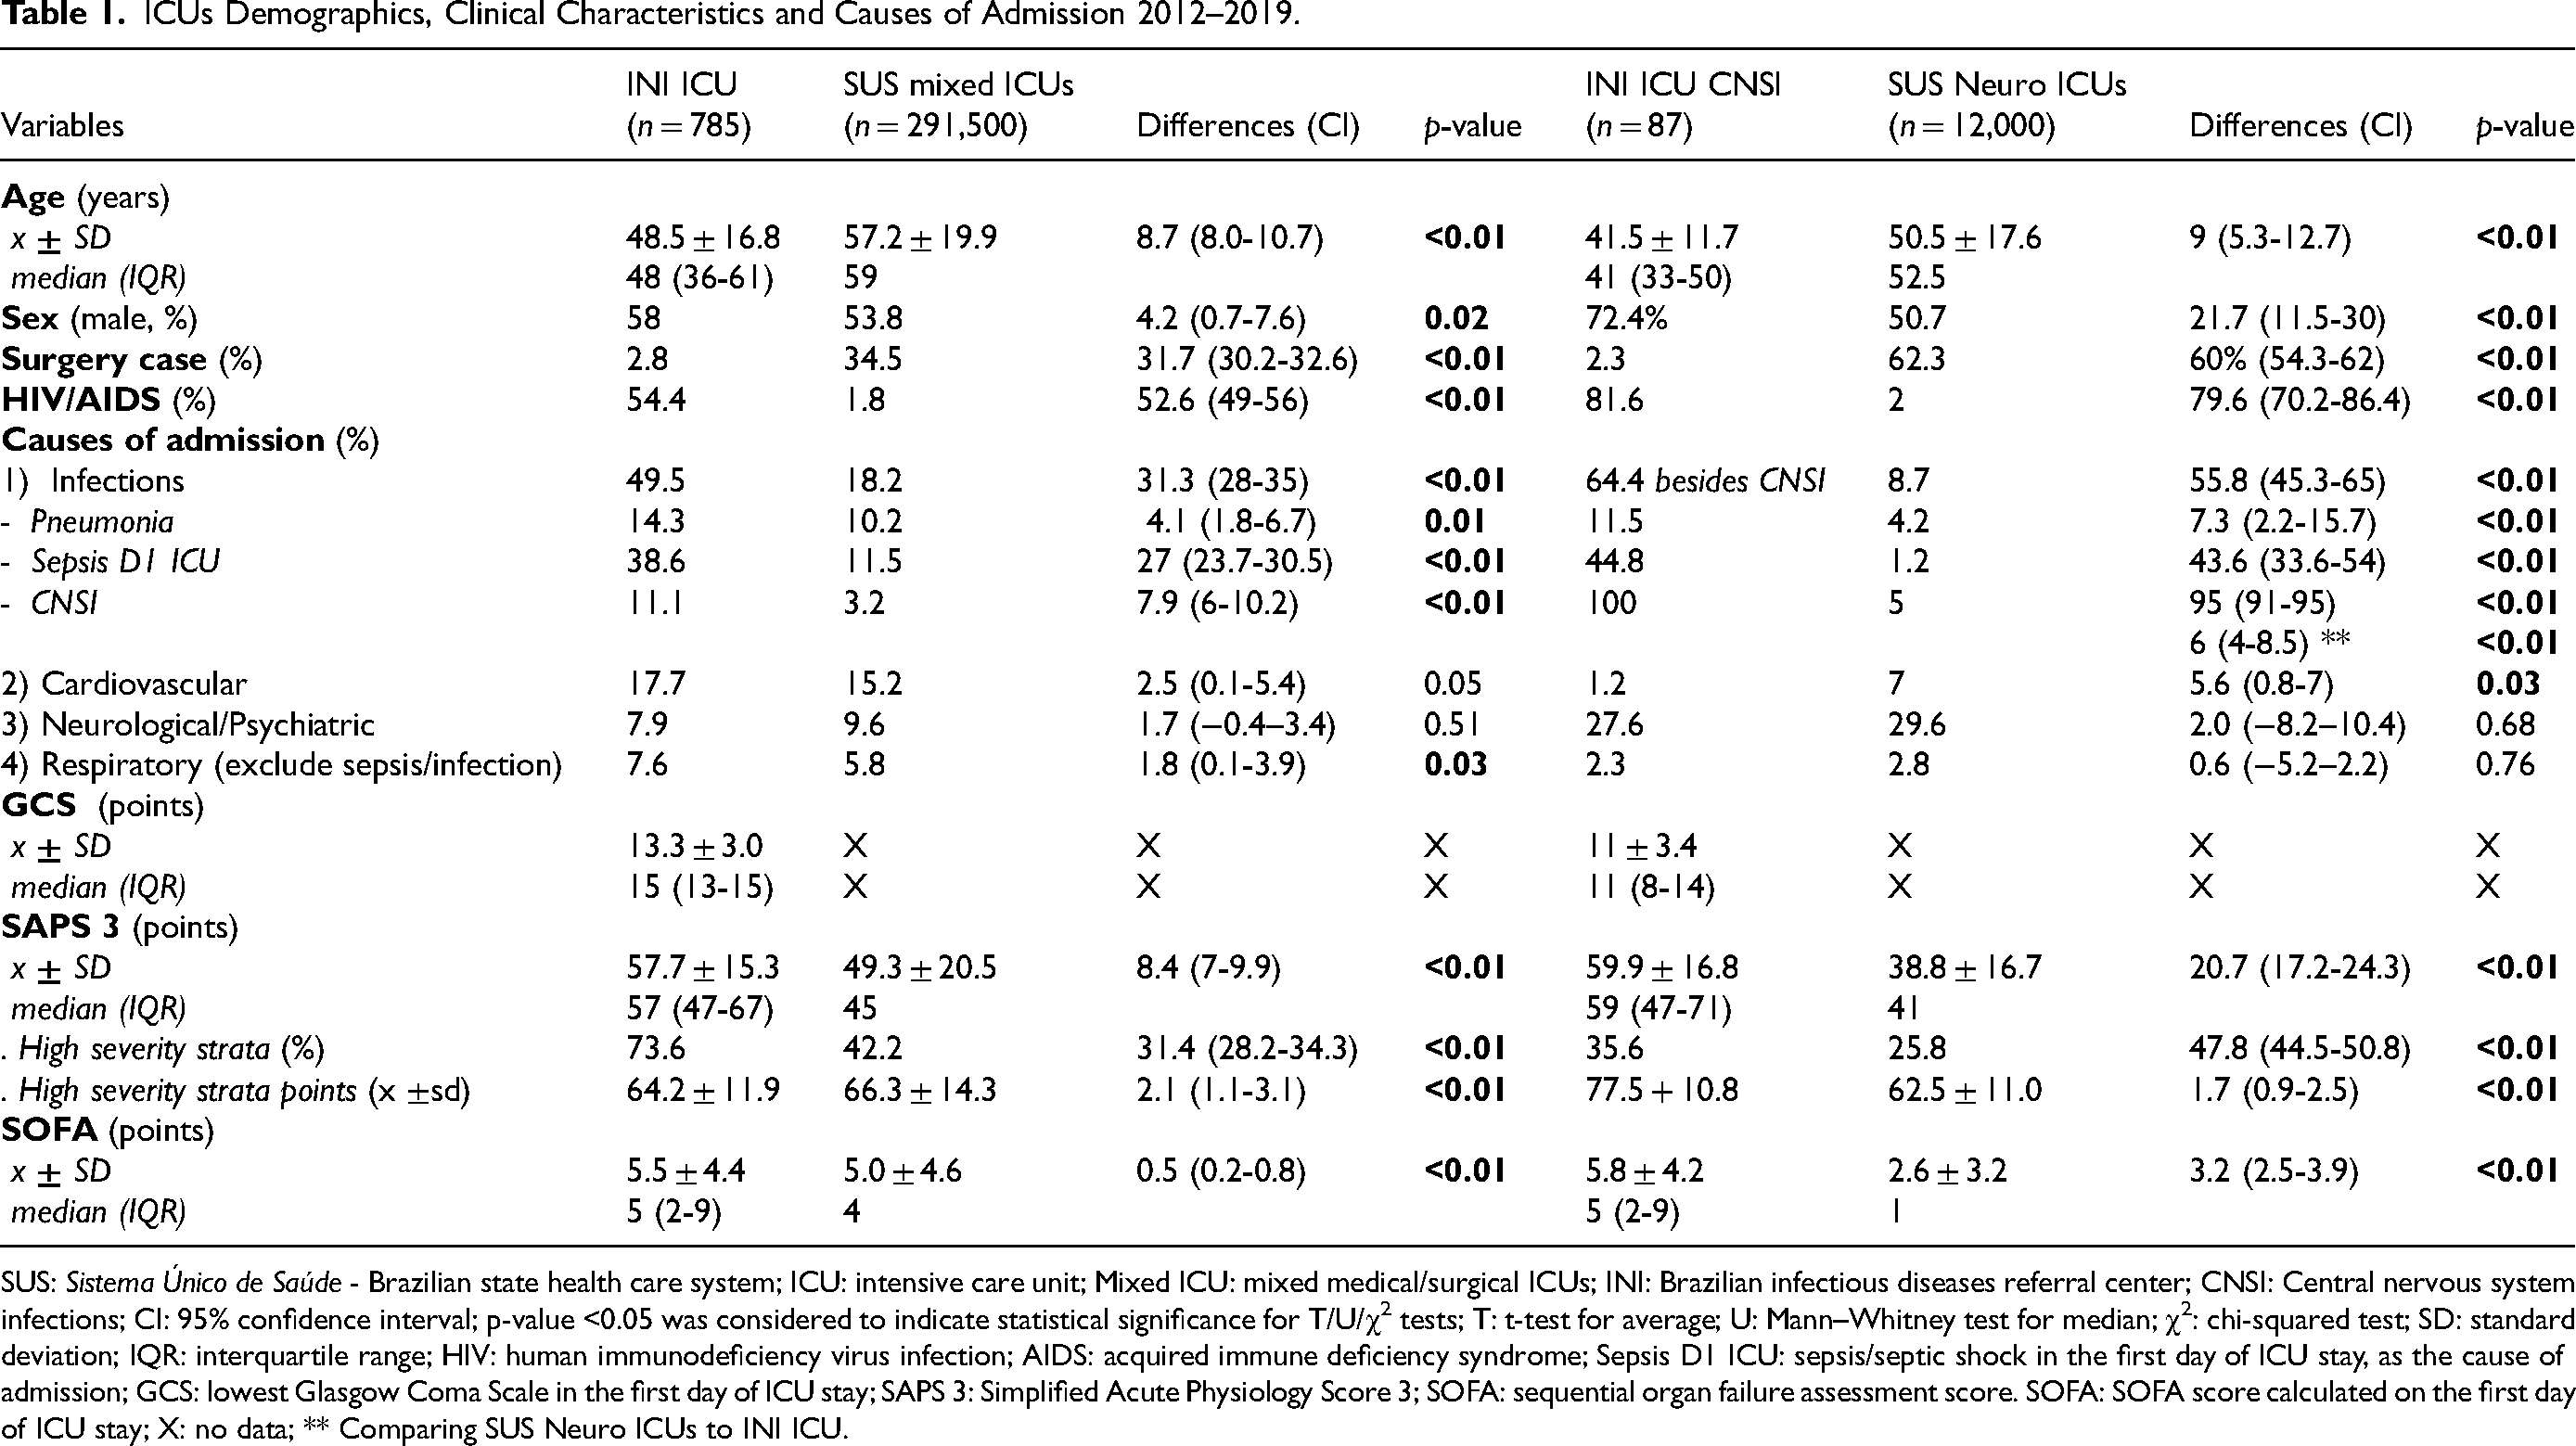
SUS: Sistema Único de Saúde - Brazilian state health care system; ICU: intensive care unit; Mixed ICU: mixed medical/surgical ICUs; INI: Brazilian infectious diseases referral center; CNSI: Central nervous system infections; CI: 95% confidence interval; p-value <0.05 was considered to indicate statistical significance for T/U/χ2 tests; T: t-test for average; U: Mann–Whitney test for median; χ2: chi-squared test; SD: standard deviation; IQR: interquartile range; HIV: human immunodeficiency virus infection; AIDS: acquired immune deficiency syndrome; Sepsis D1 ICU: sepsis/septic shock in the first day of ICU stay, as the cause of admission; GCS: lowest Glasgow Coma Scale in the first day of ICU stay; SAPS 3: Simplified Acute Physiology Score 3; SOFA: sequential organ failure assessment score. SOFA: SOFA score calculated on the first day of ICU stay; X: no data; ** Comparing SUS Neuro ICUs to INI ICU.
The average ± SD age was 57.2 ± 19.9 years old for SUS mixed ICUs and 50.5 ± 17.6 years for SUS Neuro ICUs, while INI ICU showed an average of 48.5 ± 16.6 years and 41.5 ± 11.7 years for INI ICU CNSI. Male sex was predominant in all scenarios: SUS mixed ICUs 53.8%, SUS Neuro ICUs 50.7%, INI ICU 58%, and 72.4% for INI ICU CNSI. HIV/AIDS prevalence in SUS mixed ICUs was around 2%, but it was 51% in INI ICU, and even higher among INI ICU CNSI admissions: 81.6%. In INI, less than 3% of cases were surgical, even for CNSI (2.3%). Performance status and other comorbidities information are described in Table S1 in Supplementary Data File 1.
Infections are the most frequent diagnosis for SUS mixed ICUs (18.2%) and INI ICU (49.6%). For the INI ICU CNSI, 64.7% had other infections besides the CNSI. The leading category in SUS Neuro ICU is neurological/psychiatric diseases, excluding infection (8.6%) and surgery (29.6%). In fact, the higher proportion of surgical admissions affected the distribution of diagnostic categories reflected by the most frequent reasons for ICU admission.
Pneumonia was the leading infection, except among SUS Neuro ICU admissions: 4.2% of SUS Neuro ICUs, 10.2% of SUS mixed ICUs, 11.5% for INI ICU CNSI admissions and 14.3% of all INI ICU admissions. The second most frequent infection, and leading for SUS Neuro ICU, was central nervous system infections: 5% of SUS Neuro ICUs, 3.2% of SUS mixed ICUs, and 11.1% of INI ICU admissions. Sepsis/septic shock on the first day of ICU stay, as the cause of admission (Sepsis D1 ICU), occurred in only 1.2% of SUS Neuro ICU admissions, 11.5% of SUS mixed ICUs, 37.8% for INI ICU non-CNSI, and as high as 45% for INI ICU CNSI admissions. Other clinical diagnostic categories are described in Table S2 in Supplementary Data File 1.
Table 2 describes the clinical profile of the 82 CNSI in INI ICU. The most prevalent ones, in decreasing order, were: 26.8% cryptococcosis, 18.3% toxoplasmosis, 15.6% tuberculosis, 7.1% progressive multifocal leukoencephalopathy, 7.3% bacterial meningitis, 6.1% cytomegalovirus, 6% Guillain Barré syndrome (GBS), 4.9% syphilis, and 2.4% histoplasmosis.
INI ICU - Central Nervous System Infection (CNSI) Profile 2012–2019.
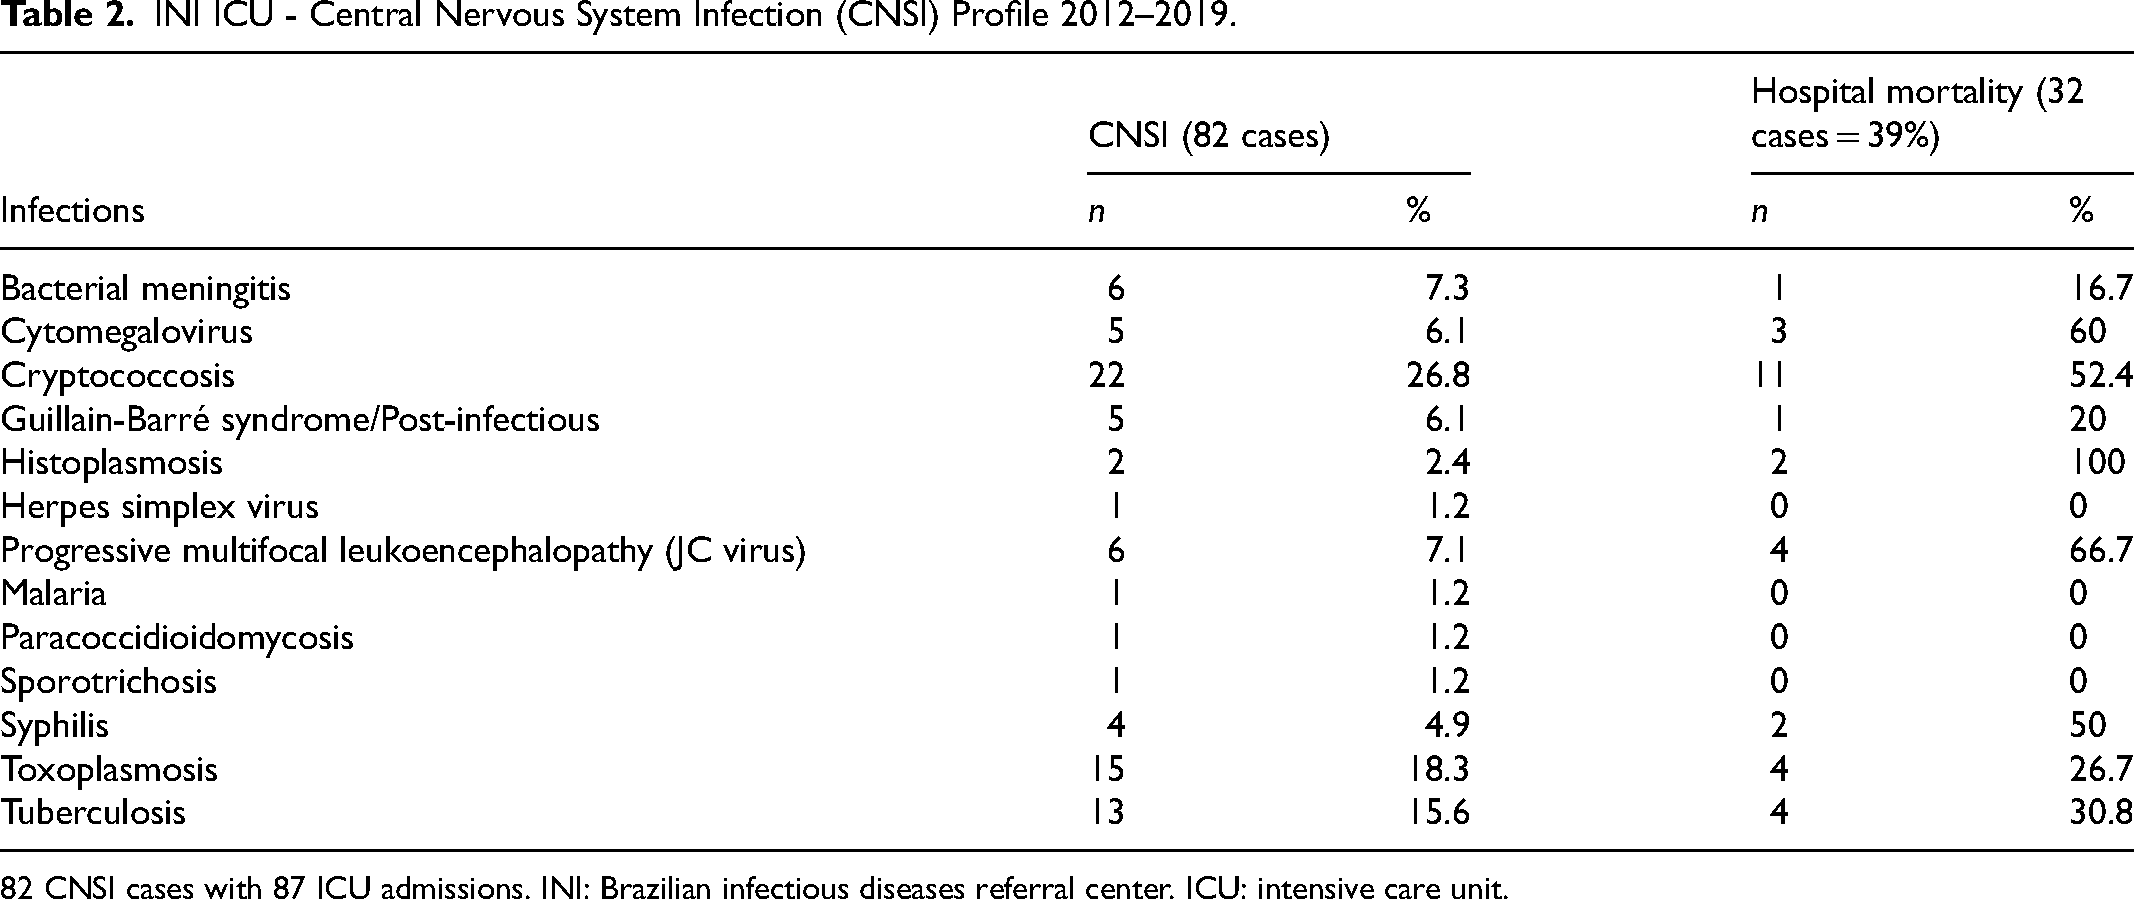
82 CNSI cases with 87 ICU admissions. INI: Brazilian infectious diseases referral center. ICU: intensive care unit.
INI ICU patients were more critically ill than SUS mixed ICUs and even more than SUS Neuro ICUs, either with SAPS 3 (57.7 ± 15.3 vs 49.3 ± 20.5, P < 0.01; vs 38.8 ± 16.7, P < 0.01), or with SOFA (5.5 ± 4.4 vs 5.0 ± 4.6, P < 0.01; vs 2.62 ± 3.22, P < 0.01). The mean severity was more significant, and 73.6% of INI ICU patients (vs 42.2% of SUS ICU - P < 0.01 and 25.8% of SUS Neuro ICU - P < 0.01) were high severity strata of SAPS 3.
ICU resource utilization is described in Table 3. A total of 51.7% of INI ICU and 57.5% of INI ICU CNSI admissions came from the general ward, and 38% and 25.3% from the emergency room, respectively. There was no data in the EPIMED about the origin of admissions. INI ICU's patients stayed 26 ± 35.6 days in the hospital, 4.1 days greater than SUS mixed ICU's (P < 0.01), while INI ICU CNSI patients stayed 22 days longer than SUS Neuro ICU's (P < 0.01) average of 21.2 ± 34.2 days. The LOS in INI ICU was also the longest: 10.3 ± 13.6 days, 2.5 days longer than SUS mixed ICUs (P < 0.01), while INI ICU CNSI patients stayed 4.2 days longer than SUS Neuro ICU's 8.8 ± 15.6 days.
ICUs Resources Utilization 2012–2019.
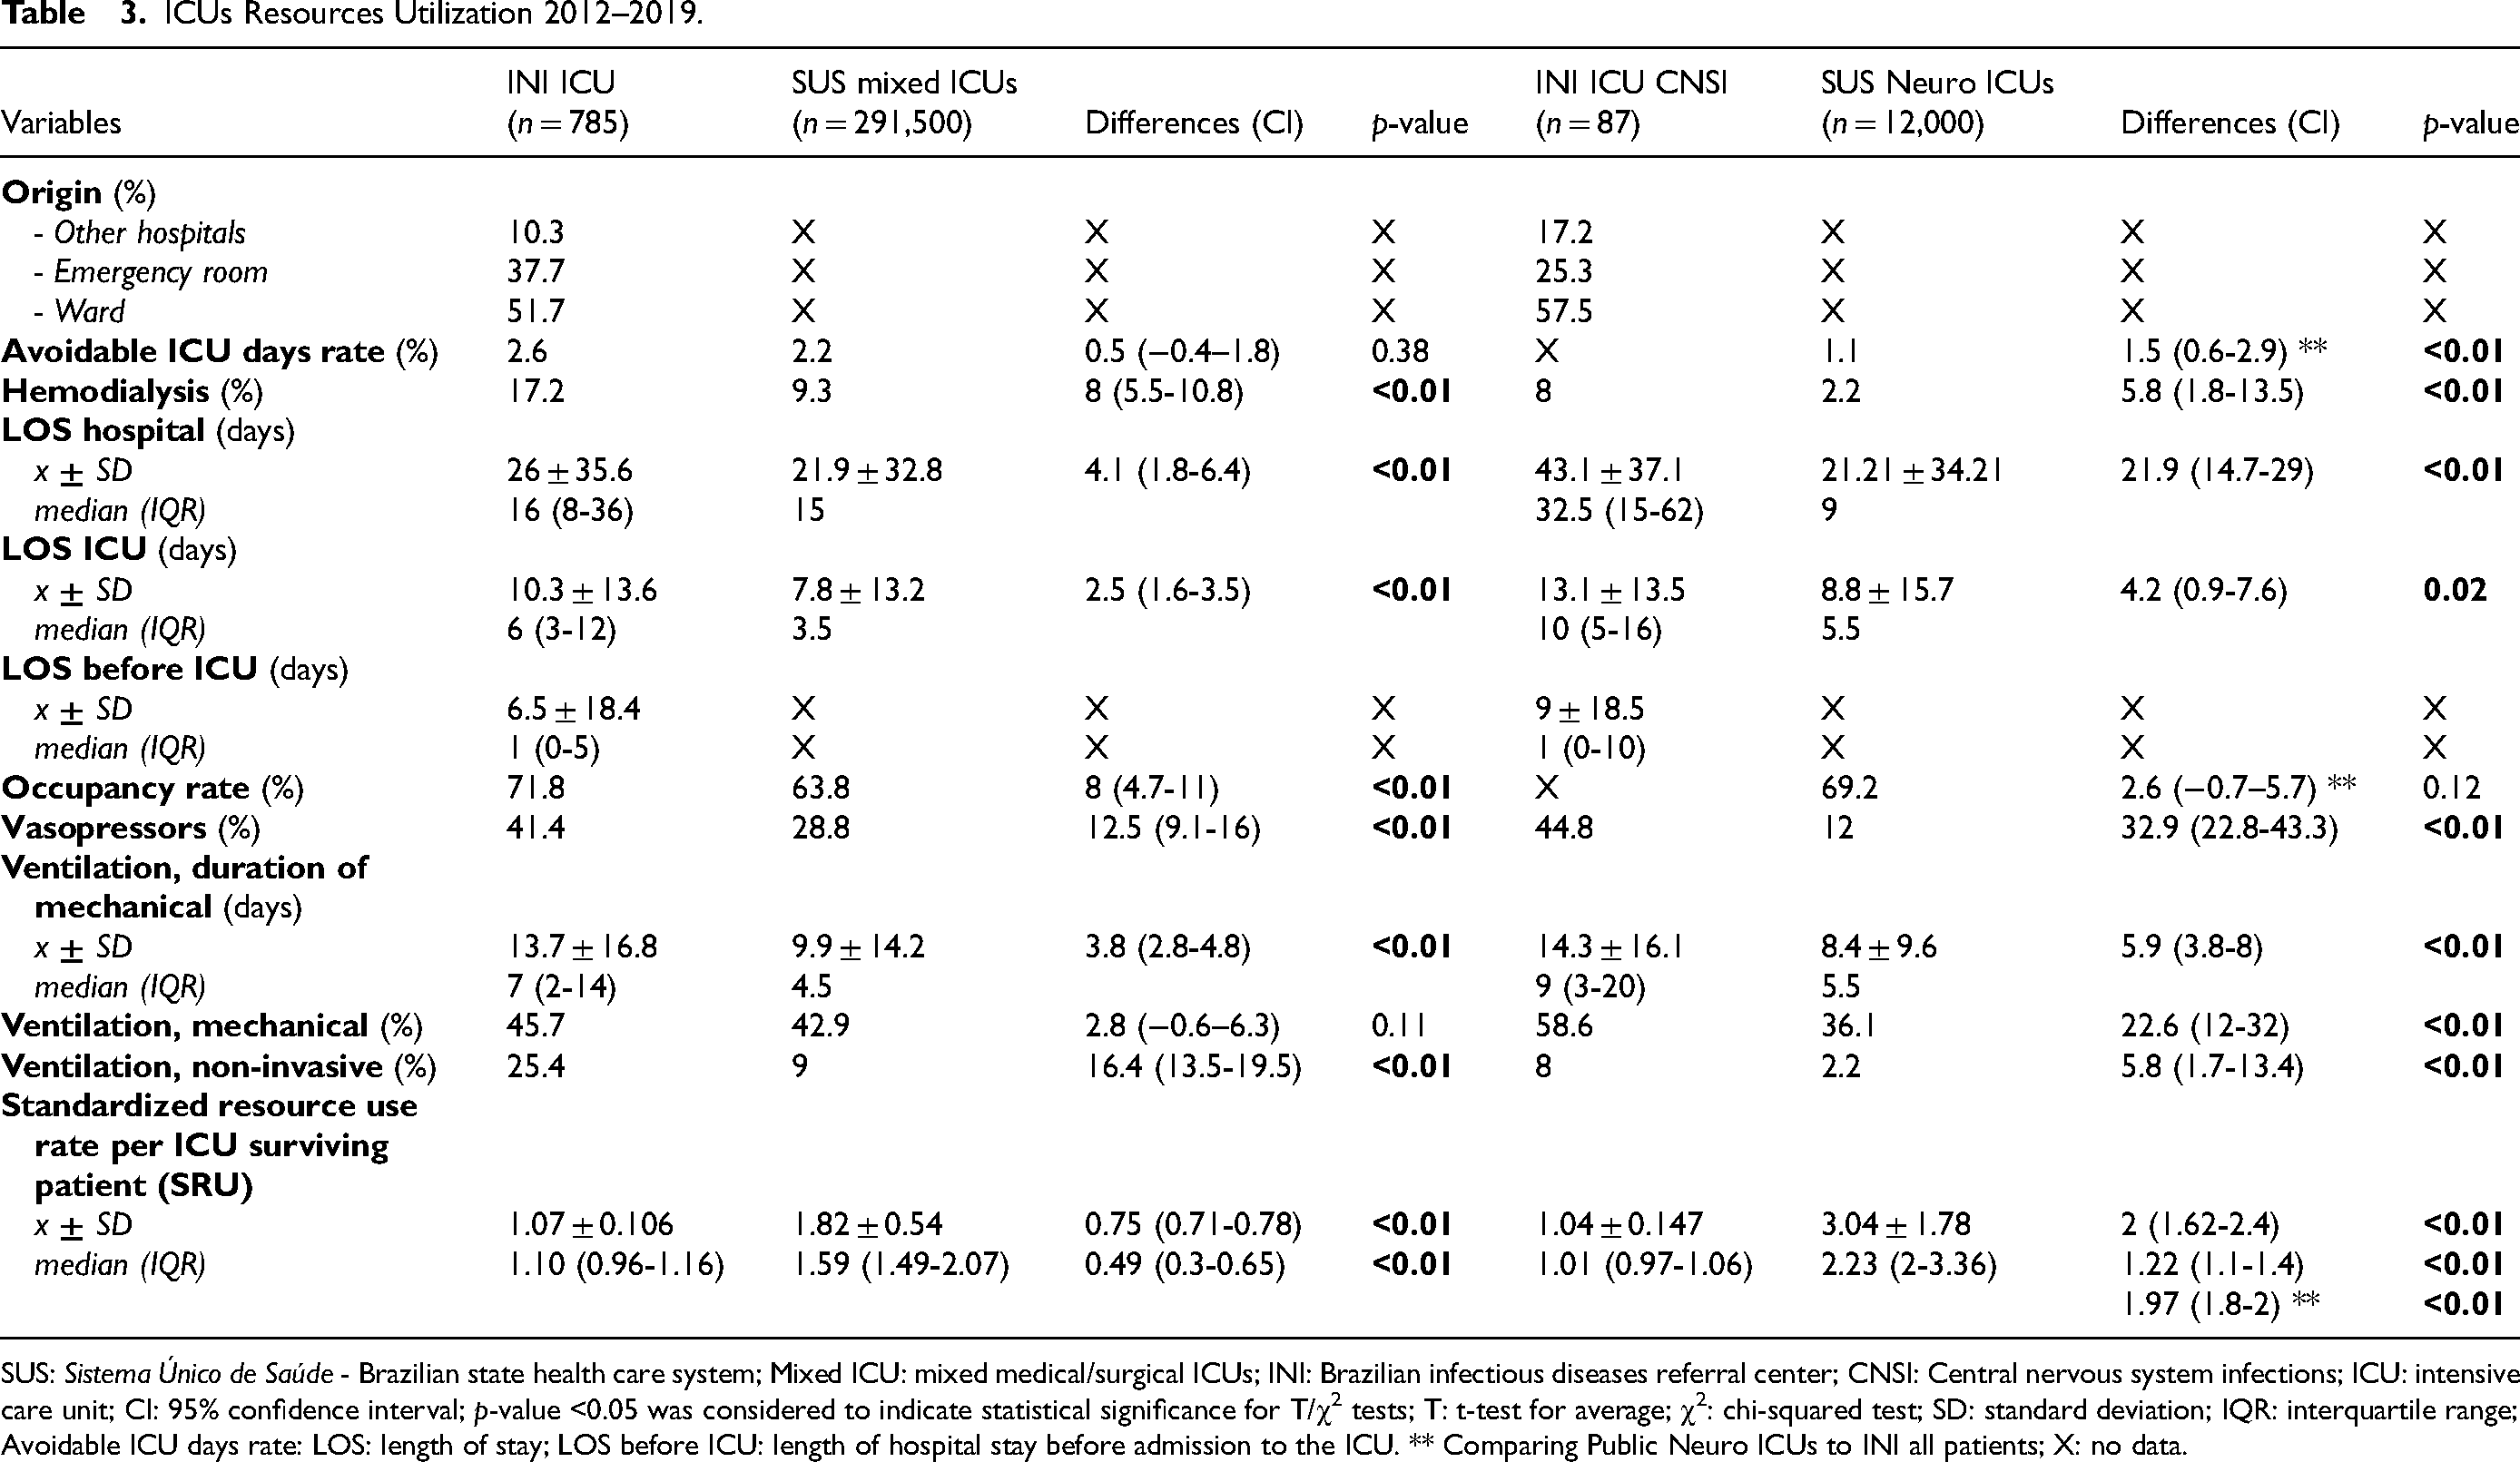
SUS: Sistema Único de Saúde - Brazilian state health care system; Mixed ICU: mixed medical/surgical ICUs; INI: Brazilian infectious diseases referral center; CNSI: Central nervous system infections; ICU: intensive care unit; CI: 95% confidence interval; p-value <0.05 was considered to indicate statistical significance for T/χ2 tests; T: t-test for average; χ2: chi-squared test; SD: standard deviation; IQR: interquartile range; Avoidable ICU days rate: LOS: length of stay; LOS before ICU: length of hospital stay before admission to the ICU. ** Comparing Public Neuro ICUs to INI all patients; X: no data.
Finally, Table 4 summarizes ICU complications and outcomes. In INI, there was no difference in hospital or ICU mortalities when comparing ICU non-CNSI versus ICU CNSI patients (38.3% vs 36.8 - P = 0.77, 26.5% vs 24.1% - P = 0.63), nor there was significant difference comparing INI ICU's mortality (26.3%) to SUS mixed ICUs’ (24.7%). About 14% of SUS Neuro ICU's patients died during intensive care. However, INI's hospital mortality was 6.8% higher than SUS mixed ICUs’ (38.3% vs 31.5, P < 0.01) and almost 20% more than SUS Neuro ICUs’ (17.7%).
ICUs Complications and Outcomes 2012–2019.
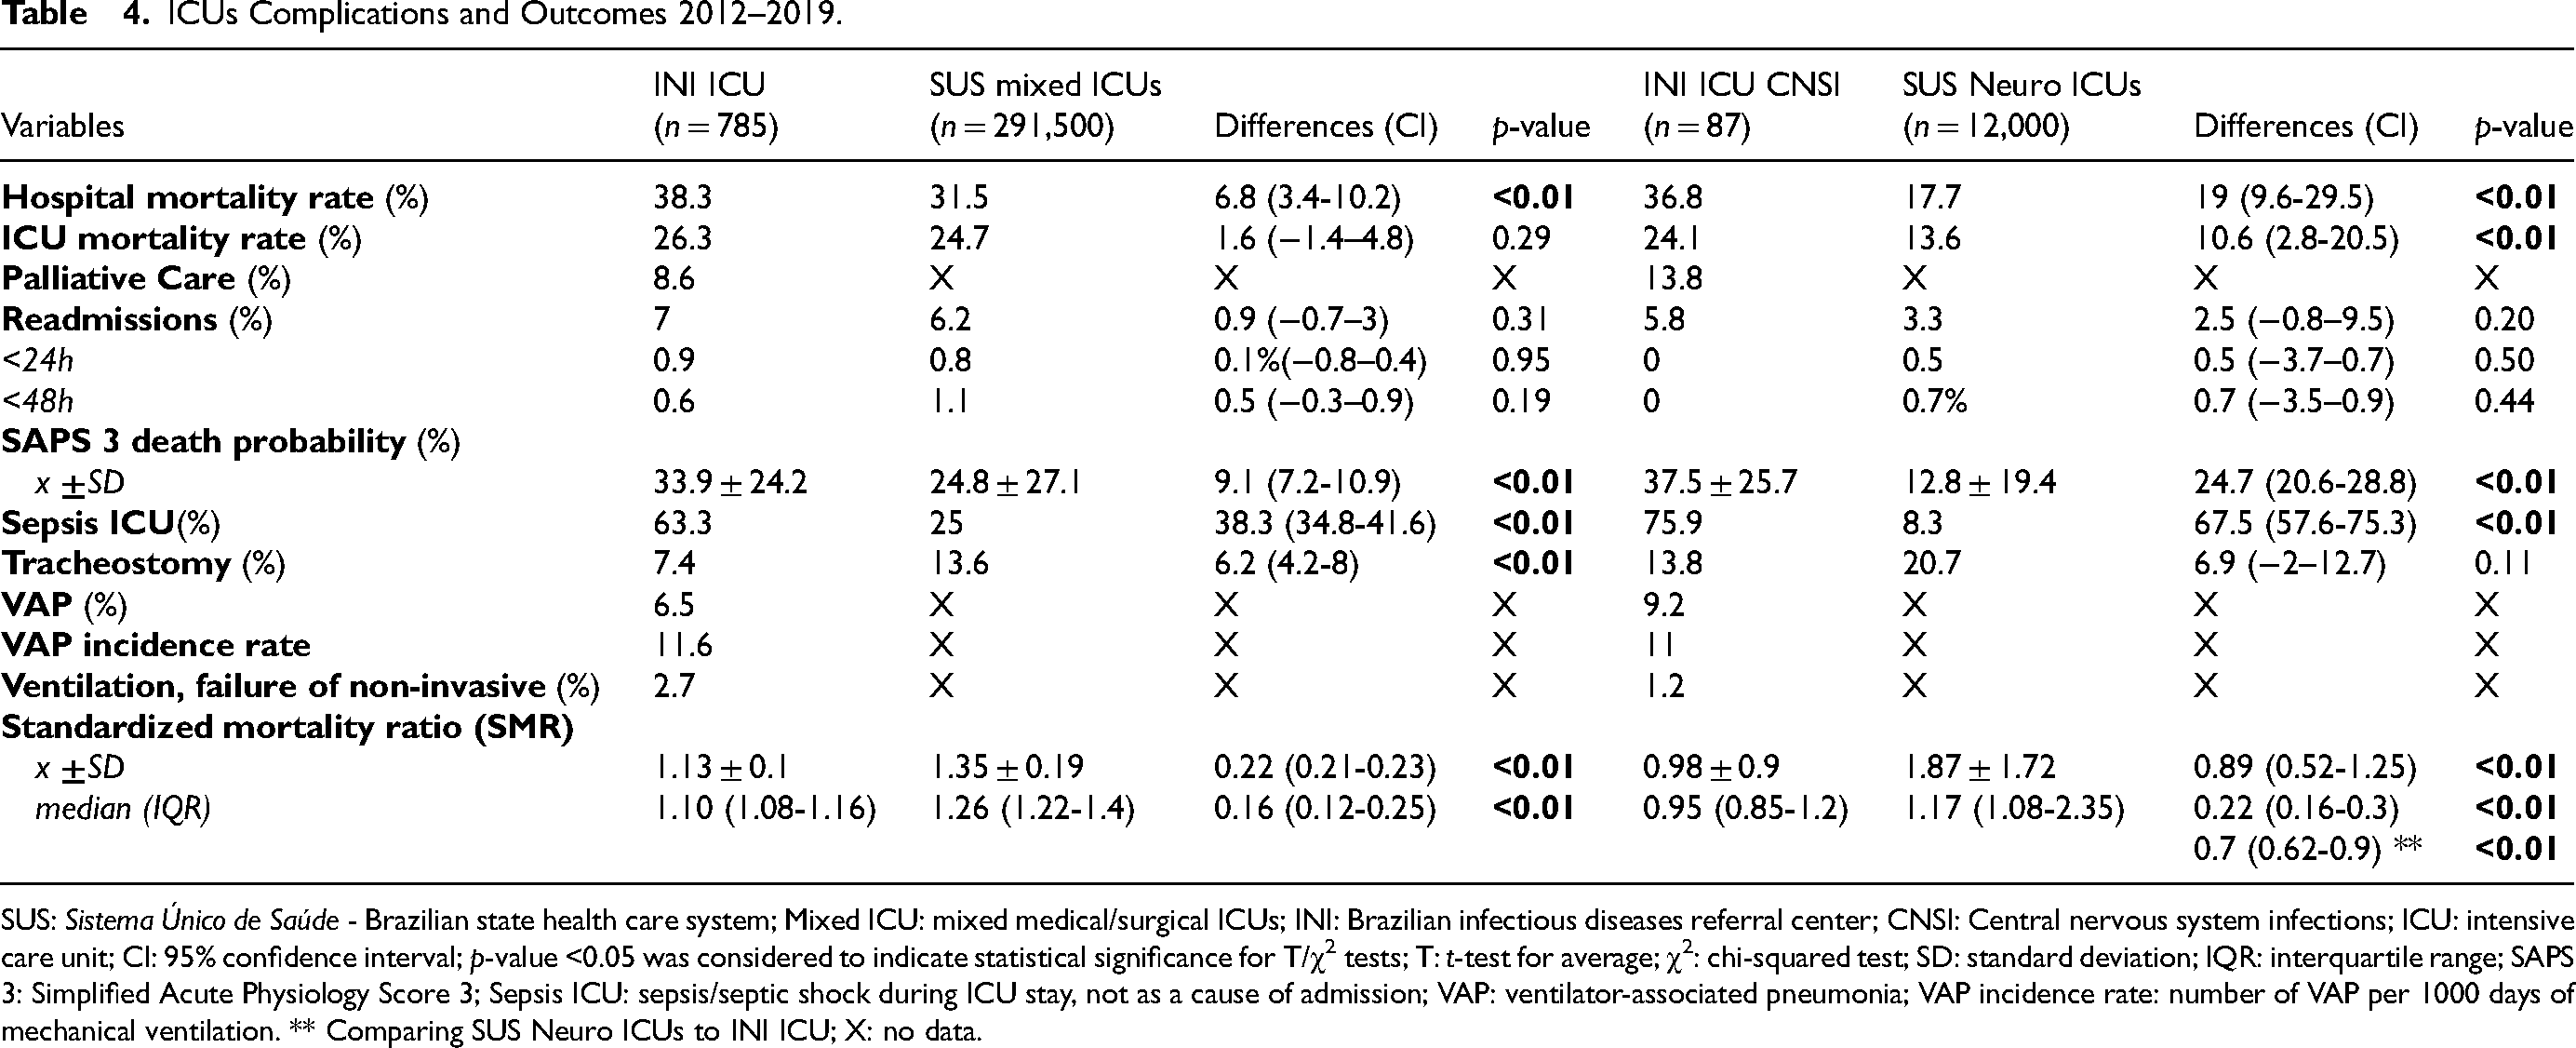
SUS: Sistema Único de Saúde - Brazilian state health care system; Mixed ICU: mixed medical/surgical ICUs; INI: Brazilian infectious diseases referral center; CNSI: Central nervous system infections; ICU: intensive care unit; CI: 95% confidence interval; p-value <0.05 was considered to indicate statistical significance for T/χ2 tests; T: t-test for average; χ2: chi-squared test; SD: standard deviation; IQR: interquartile range; SAPS 3: Simplified Acute Physiology Score 3; Sepsis ICU: sepsis/septic shock during ICU stay, not as a cause of admission; VAP: ventilator-associated pneumonia; VAP incidence rate: number of VAP per 1000 days of mechanical ventilation. ** Comparing SUS Neuro ICUs to INI ICU; X: no data.
Benchmarking
The EPIMED 3 shows that, from 2012 to 2019, the median SMR was 1.41 (1.35−1.525 IQR) for all SUS ICUs and 1.06 (0.98−1.12 IQR) for all Brazilian ICUs (private plus SUS ICUs). The median SRU was 1.76 (1.61−2.15 IQR) for all SUS ICUs and 1.24 (1.16−1.3 IQR) for all Brazilian ICUs. Private ICUs presented SMR of 0.95 (0.85−1.04 IQR) and SRU of 1.12 (0.98−1.14 IQR).
Figure 1 shows the resources utilization and suggests that, compared to all public ICUs, all private ICUs, and all Brazilian ICUs, the SUS mixed medical/surgical ICUs (SMR 1.26, SRU 1.59) were “most efficient”, “least efficient”, and “least efficient”, respectively. The SUS Neuro ICU (SMR 1.17, SRU 2.23) showed “overachieving”, “least efficient”, and “least efficient”. Finally, the INI ICU cohort (SMR 1.10, SRU 1.10) was “most efficient”, “underachieving” and “underachieving”, respectively. Despite the severity and complexity of their diseases, the INI ICU CNSI patients (SMR 0.95, SRU 1.01) were more efficiently treated when compared to all other ICU profiles. Lastly, the private ICUs were “most efficient” compared to Brazilian ICUs but not significantly “overachieving” (p > 0.05) compared to INI ICU.
Discussion
The median age group of SUS mixed ICUs is in line with what is expected in the literature: 65 years (48−76 IQR). 24 A more surgical profile makes the average age of Neuro ICU patients significantly lower (P < 0.01). However, the patients with neuroinfectious are younger (P < 0.01) than those admitted to SUS mixed ICU or SUS neuro ICU. We can also observe the greater prevalence of male patients in infectious diseases, as expected in a unit with a high prevalence of HIV/AIDS.22,25
Data from 1,235 patients in Brazil 24 showed that 32.2% came from the emergency room/pre-hospital care, 29.4% from the general ward, 22% from the operating/recovery room, and 12.6% from other hospitals.
The most remarkably distinctive features when comparing the various ICUs were the proportion of surgical patients and the prevalence of HIV/AIDS. At INI, the proportion of surgical cases is 10 to 20 times smaller, and of HIV infection prevalence, is twenty-five times greater. The higher proportion of surgical admissions in Neuro ICU affected the distribution of diagnostic categories reflected by the most frequent reasons for neuro ICU admission.
Except for HIV/AIDS, heart failure (HF), and hematologic malignancies, when comparing the profile of comorbidities between the SUS and the INI, there was a predominance of chronic diseases whose prevalence naturally increases with age. Even when excluding chronic Chagas Disease, the high prevalence of HF mirrored the impact that HIV can have on the health of the cardiovascular system: a combination of effects of the opportunistic infections affecting the heart, collateral effects of cART, and the treatment for the opportunistic infections. 26
The high frequency of HIV increases infections in general, opportunistic, or not, including nosocomial ones27–29. So, the expected high occurrence of sepsis leads to multiple organ failures, consequently increasing the severity of patients, as expressed by the SAPS 3 and SOFA scores differences.
The SAPS 3 contains neurological variables common to Venkatesan's criteria for encephalitis. They might be helpful as a tracking tool for cases involving the central nervous system in large databases. 30 Thus, in addition to its usefulness for diagnosis and benchmarking, SAPS 3 could help in the surveillance of neuroinfections.
Infection in the ICU is associated with high morbidity, mortality, and costs and represents about 20% (5%–50%) of the causes for admission. Respiratory, digestive, urinary tracts and primary bloodstream infections represent about 80% of all sites. 31 Also, it can commonly be complicated with sepsis (10%–70%), which is the leading cause of death in noncardiac ICUs32,33 and a significant determinant of outcome for critically ill HIV/AIDS patients. 34 Sepsis as a cause of admission affected 40% of patients in INI ICU. When analyzing sepsis as a complication of ICU-acquired infections, the prevalence reached as high as 60%. As expected, pneumonia was the leading infection for SUS mixed ICUs (10%) and INI ICU (15%).
The high severity influenced the use of resources by the ICU. The INI hospital LOS was on average four days greater than SUS mixed ICUs, but INI CNSI patients stayed on average three weeks more than SUS Neuro ICUs. The INI ICU LOS was also 2–3 days longer than SUS mixed ICUs’, while the INI ICU CNSI patients spent twice as much time as the SUS Neuro ICU's. This can be explained by the lengthy treatment of opportunistic infections of the central nervous system and a more extended period of physical rehabilitation.35,36
The use of all ICU resources in INI (hemodialysis, vasopressors, non-invasive mechanical ventilation, frequency, and duration of mechanical ventilation) was significantly greater (P < 0.01) than other SUS hospitals, except for the frequency of mechanical ventilation when compared to SUS mixed ICU (difference of 3%, P = 0.11). Due to the reduced level of consciousness (this is a relative contraindication), the use of non-invasive ventilation is much less frequent in neurological patients, both in the INI and in the SUS Neuro ICUs.
The difference in severity also influences patient outcomes. The ICU and hospital mortality rates for SUS mixed ICUs and INI were like the observed data in the Brazilian literature, which showed an expected ICU mortality of 35.1% (14%–83%) and hospital mortality of 39.8% (26.9%–68%).24,37 The ICU mortality was significantly lower for SUS Neuro ICUs (14%) when compared to all other ICUs. However, the INI in-hospital mortality (38.3%) was 6%–20% (P < 0.01) greater than SUS mixed ICUs and SUS Neuro ICUs. There was no difference in the number of readmissions to the ICU, ranging from 3% to 7%, less than 2% before 48 h.
There is limited literature comparing treatment outcomes for severe patients with CNSI in IDICUs compared to other ICUs. Specialized care is crucial for effectively treating severe community acquired CNSI. IDICUs offer several advantages, including a dedicated team of healthcare professionals with specialized training and expertise, strict adherence to infection control protocols, access to advanced diagnostic tools, and a multidisciplinary approach to patient care. Also, they contribute to research efforts and provide innovative treatment options. However, the availability of specialized ICUs can vary depending on the healthcare system, and decisions regarding their establishment should consider costs, specific resources and patient needs.
Limitations
The fact that the IDICU described here is a single center with high prevalence of HIV/AIDS are limitations of the study, but its objective is to raise a discussion about the best place to manage severe patients with CNSI. It is important to emphasize that EPIMED does not cover all Brazilian ICUs, but a large majority, and those with more resources.
Also, this benchmarking system has several criticisms. The current trend is to change the focus from the evaluation of short-term survival, as ICU and in-hospital mortalities, to assessing post-ICU medium- and long-term quality of life. 2 An SMR based on case-mix-adjusted mortality at a longer-term time-point after ICU admission may be a better-quality indicator. If SMR and SRU are to be used and benchmarked, they should not be considered alone, nor be solely based on their absolute values. Although SMR and SRU are imperfect, they will continue to be refined and used. In fact, benchmarking of ICU performance is a reality: its use and complexity will expand as the healthcare data reassessment proceeds.
Despite the limitations, we believe that we were able to raise a discussion about the best intensive care unit for the management of critically ill patients with central nervous system infections and disseminate data for the benchmarking of other IDICUs.
Conclusions
Severe patients with community-acquired central nervous system infections may be more efficiently and effectively treated in an ICU specialized in infectious diseases when compared to mixed medical/surgical and neurological ICUs from the public health system. Future studies should be carried out to prove that the best place for management is the unit specialized in infectious diseases. At the same time, we provided profiling and a case mix that can help and encourage benchmarking by other institutions and other countries.
Supplemental Material
sj-docx-1-jic-10.1177_08850666231188665 - Supplemental material for Profiling and Benchmarking Central Nervous System Infections in an Infectious Diseases Intensive Care Unit
Supplemental material, sj-docx-1-jic-10.1177_08850666231188665 for Profiling and Benchmarking Central Nervous System Infections in an Infectious Diseases Intensive Care Unit by Hugo Boechat Andrade, Ivan Rocha Ferreira da Silva, Rodolfo Espinoza, Mayara Secco Torres da Silva, Pedro Henrique Nascimento Theodoro, Marcel Treptow Ferreira, Jesus Soares, Ermias D. Belay, James J. Sejvar, Fernando Augusto Bozza, José Cerbino-Neto and André Miguel Japiassú in Journal of Intensive Care Medicine
Supplemental Material
sj-xlsx-2-jic-10.1177_08850666231188665 - Supplemental material for Profiling and Benchmarking Central Nervous System Infections in an Infectious Diseases Intensive Care Unit
Supplemental material, sj-xlsx-2-jic-10.1177_08850666231188665 for Profiling and Benchmarking Central Nervous System Infections in an Infectious Diseases Intensive Care Unit by Hugo Boechat Andrade, Ivan Rocha Ferreira da Silva, Rodolfo Espinoza, Mayara Secco Torres da Silva, Pedro Henrique Nascimento Theodoro, Marcel Treptow Ferreira, Jesus Soares, Ermias D. Belay, James J. Sejvar, Fernando Augusto Bozza, José Cerbino-Neto and André Miguel Japiassú in Journal of Intensive Care Medicine
Footnotes
Authors’ Contributions
HBA designed the study. HBA, IRFDS, RE, MSTDSM, and PHNT collected data. HBA interpreted the data, created figures, and wrote the manuscript. All authors read, revised, and approved the final manuscript.
Consent for Publication
Not applicable.
Availability of Data and Materials
Declaration of Conflicting Interests
The author(s) declared no potential conflicts of interest with respect to the research, authorship, and/or publication of this article.
Ethics Approval and Consent to Participate
This study was carried out with information from the scientific project called “Brazil ICU Encephalitis Surveillance” and was approved by the local Institutional Review Board (IRB 16876819.9.0000.5262), which waived the need for informed consent, as the data were analyzed retrospectively and anonymously, without interventions. This report's findings and conclusions are those of the authors and do not necessarily represent the official position of institutions or governments.
Funding
The author(s) disclosed receipt of the following financial support for the research, authorship, and/or publication of this article: This study was supported by the National Center for Emerging and Zoonotic Infectious Diseases of the United States’ Centers for Disease Control and Prevention (CDC) (no grant number). The funders were involved with the decision to publish, and preparation of the manuscript.
Supplemental Material
Supplemental material for this article is available online.
References
Supplementary Material
Please find the following supplemental material available below.
For Open Access articles published under a Creative Commons License, all supplemental material carries the same license as the article it is associated with.
For non-Open Access articles published, all supplemental material carries a non-exclusive license, and permission requests for re-use of supplemental material or any part of supplemental material shall be sent directly to the copyright owner as specified in the copyright notice associated with the article.