
Abstract
This study seeks to develop fine motor development growth curves for children with Down syndrome, specifically related to grasping and visual motor integration skills. A cross-sectional retrospective chart review was completed on a large cohort of children with Down syndrome from birth to 6 years of age who completed the Peabody Developmental Motor Scales–2nd Edition (PDMS-2). Although both fine motor and visual motor development were delayed in children with Down syndrome compared with typically developing peers, and a negative association between fine motor quotient and age was observed, grasping and visual motor integration raw scores increased with age. The Down syndrome–specific percentile curves developed here may enable providers to identify individuals requiring further investigation, and will be useful in future studies of factors that may influence fine motor development in Down syndrome. These data will also help parents better understand their children's development and interpret developmental test results.
Background
Down syndrome, caused by trisomy of chromosome 21, is the most common chromosomal cause of intellectual disability. Each year, 1 in every 691 babies born in the United States is born with Down syndrome. 1 Although developmental skills are often characterized as a series of milestones, children have nuanced and individually variable ways of acquiring language, motor, and social skills. Adolph and Hoch showed that environmental, social, and cultural influences shape motor behaviors. 2 Most families learn that comparing their child with a typically developing peer is not as important as understanding if their child is meeting their own potential. This understanding is vital when considering if a child has appropriate supports in place.
Research on the developmental profile of children with Down syndrome has attempted to understand the unique progression toward functional skill development to help prognosticate and guide intervention. Previous studies have indicated relative strengths in visuospatial and personal-social skills with disproportionately impaired verbal and motor functioning.3–6
It is well established that children with Down syndrome are at increased risk for challenges with motor development. Children with Down syndrome have qualitative differences in motor capabilities, resulting in a different course of development, not just delayed development. 7 Children with Down syndrome also move through the stages of early motor development more slowly, and with a larger within-group variability, than typically developing peers.8,9 Baumer et al 10 published a global review of developmental milestones that confirms that this large variability in observed range of skill acquisition among children with Down syndrome is seen in essentially all domains. When considering gross motor development, studies have shown that children with Down syndrome require more time to attain gross motor milestones as movement complexity increases and that the impairment severity affects the rate, but not the upper limit, of gross motor functioning. 11 In addition, some studies have suggested that fine motor functioning is dependent on gross motor functioning, with low levels of gross motor skill being associated with lower success in grasping. Infants with Down syndrome have been shown to exhibit stabilizing postures including abduction and external rotation while reaching, which, although providing stability, decreases their accuracy. 12 Needham et al 13 reviewed the literature on fine motor skill development in children with Down syndrome and provided further evidence that development of new fine motor skills depends on prior attainment of specific gross motor skills, and pointed to the importance of future studies of the relationship between gross and fine motor skill development, as well as an urgent need for additional research on fine motor development with larger sample sizes and longitudinal observations. The current study does not address the interrelationship of gross and fine motor skill development but does provide important preliminary data on fine motor development using a large clinic population, which we hope will, in the future, be able to be compared with our own and other centers’ gross motor development data in children with Down syndrome.
Frank et al 14 reported on the development of specific fine motor and self-care milestones for individuals with Down syndrome using a retrospective chart review. This study found that the age range for mastering specific fine motor and self-care skills broadens as children with Down syndrome get older. This study also reported that specific milestone skill development in children with Down syndrome is heterogeneous and occurs over a broad age range.
In our multidisciplinary clinic, each patient is routinely administered the Peabody Developmental Motor Scales–2nd Edition (PDMS-2). This presented the opportunity to retrospectively evaluate whether the same variability in fine motor skills seen broadly in previous studies would also be evident with this instrument. We also hoped this could provide both additional semiquantitative detail that may be useful to parents and care providers as they evaluate children with Down syndrome, and perhaps helpful predictive information regarding functional outcomes in future studies. To our knowledge, there have not been previous large-population studies for reporting performance in children with Down syndrome using the Peabody Developmental Motor Scales–2nd Edition.
Previous studies have indicated that there may be differences in fine motor development as measured by Peabody Developmental Motor Scales–2nd Edition and other tests, based on sex, ethnic background, or country of origin.15–17 Haga et al 18 used the Test of Motor Competence including 2 fine motor tasks to evaluate typically developing 7- to 8-year-old children from Greece, Italy, and Norway. They reported differences based on country of residence and concluded that “differences in terms of levels of basic fine and gross motor skills between children from the different countries may be a consequence of both different physical activity contexts and cultural policies, attitudes, and habits toward movement.” 18
Although it is not clear whether differences in scores on various fine motor tests (including the Peabody Developmental Motor Scales–2nd Edition) reflect true differences between these groups or test factors, because we have a fairly large Hispanic patient population in our clinic, we felt it would be important to determine if there are differences in fine motor test scores that might reflect cultural differences in use of utensils, different types of play, or on the relative importance placed on these skills by patients’ families. Any differences in scores would be important to be aware of in order to be able to develop comparison developmental “growth curves” for children seen in our clinic of either sex and of Hispanic or non-Hispanic ethnicity.
Patients and Methods
We administered The Peabody Developmental Motor Scales–2nd Edition, 19 an assessment tool frequently used by occupational therapists to evaluate motor development in children, with or without developmental disabilities, from birth up to age 6 years. It can be used to track fine motor progress, compare to typically developing same-age peers, and to help facilitate treatment goals. It contains 6 subtests, titled Stationary, Reflexes, Locomotion, Object Manipulation, Grasping and Visual Motor Integration. Occupational therapists often administer the Grasping and Visual Motor Integration sections, which can then yield a Fine Motor Quotient, a standardized score based on 100 with standard deviation of 15. Typical fine motor development would result in a fine motor quotient between 85 and 115. Age equivalents can also be generated for each of the 6 subtests, including Grasping and Visual Motor Integration. The Grasping subtest consists of 26 items that measure the progression of grasping of various objects, including cloth, rattles, blocks, pellets, and a crayon. Attention is paid to which fingers are used and how they are used together. The Visual Motor Integration subtest consists of 72 items measuring hand-eye coordination and visual perception. Examples of items include reaching for objects, stacking blocks and copying designs, cutting with scissors, drawing basic shapes, lacing a string through holes, and folding paper.
A cross-sectional retrospective chart review was completed on children with Down syndrome from birth to 6 years of age who were evaluated in our academic institution's multidisciplinary Down syndrome clinic between 2007 and 2019. A total of 559 children's charts were reviewed, and a total of 1001 visits were considered. Of these, 354 children at 793 separate visits successfully completed the Peabody Development and Motor Scales–2nd Edition, yielding both fine motor quotients and raw scores for the categories of grasping and visual motor integration. Among the study patients, 146 had 1 visit, 154 had 2 visits, 177 had 3 visits, 192 had 4 visits, 100 had 5 visits, and 24 had 6 visits. The mean and median number of visits per patient was 3. Age distribution for all visits was as follows: 0-12 months, n = 164; 12-24 months, n = 144; 24-36 months, n = 143; 36-48 months, n = 122; 48-60 months, n = 115; 60-72 months, n = 96. Age distribution for each subject's first visit was as follows: 0-12 months, n = 152; 12-24 months, n = 63; 24-36 months, n = 52; 36-48 months, n = 38; 48-60 months, n = 19; 60-72 months, n = 25. Patients’ parents self-identified ethnicity as non-Hispanic in 468 total visits, and Hispanic in 276. Males and females were about equally represented, with males accounting for 408 of the total visits and females 383.
We did not collect data on cognitive function or mental age. We also did not have in our database the subtypes of trisomy 21 but, consistent with population estimates, the vast majority in our clinic have full trisomy 21 (nonmosaic Down syndrome). If we included any subjects with translocation trisomy 21 or mosaic trisomy 21, the number would be very small (probably no more than 2% or so), and this would not allow for between-subtype comparisons.
Study data were collected and managed using REDCap (Research Electronic Data Capture) electronic tools hosted at our university. REDCap is a secure, web-based application that supports data capture for research studies, providing interfaces for validated data entry; audit trails for tracking data manipulation and export procedures; and automated export for data downloads. Approval for this study was obtained from our institutional review board.
A preliminary assessment was conducted by plotting subject-specific trajectories of the Fine Motor Quotient, as well as raw scores for the Grasping and Visual Motor Integration subtests, across age. Variable distributions were examined, and summary statistics were calculated by sex and ethnicity. Age was logarithmically transformed to better approximate a linear relationship with the dependent variables, which was confirmed through visual inspection of scatterplots. Sex and ethnicity were each categorized into 2 levels: male and female, and Hispanic and non-Hispanic, respectively. Group differences were preliminarily explored by color-coding subject-specific trajectories by sex and ethnicity. Because individual subjects were tested a variable number of times, their results from each test cannot be assumed to be entirely independent, and for this reason a mixed effects model that accounts for both fixed effects (eg, age and ethnicity) and random effects (eg, varied experience with this type of test or specific test, and varying individual experience with play at home) was employed. Thus, a simple linear regression or analysis of variance (multiple regression analysis of variance) approach would not be appropriate. Mixed effects methods also deal better with missing data points. To rigorously investigate changes in the outcomes over time, we implemented a linear quantile mixed effects model (LQMM), using log-transformed age as an independent variable and including a random intercept to account for subject-specific variability. 20
Incorporating random effects accounts for intrasubject correlation, acknowledging the nonindependence of repeated measurements within individuals. In our model, a random intercept was included for each subject to account for intrasubject correlation because of repeated measurements over time. This structure enables the model to capture both the overall trend in the population and individual-level variation. Unlike standard linear mixed effects models, which model only the mean of the outcome, quantile mixed models estimate effects across multiple points (quantiles) in the distribution, providing a more detailed understanding of how the outcome changes over time across different subgroups in the population. This modeling approach enables estimation of outcome changes at various quantiles (ie, percentiles) of the distribution, rather than focusing solely on the mean. As such, it provides a more comprehensive understanding of developmental curves across the full outcome spectrum. Slope coefficients and their 95% confidence intervals were estimated for several key quantiles (3rd, 10th, 25th, 50th, 75th, 90th, and 97th), allowing for assessment of how the rate of change in the outcomes varies across the distribution.
To facilitate interpretation and visualization, predicted values from the crude models were plotted across age using a locally weighted scatterplot smoothing (LOESS) line, with accompanying standard errors. These smoothed trajectories summarize both the central tendency and variability in the data over time. Group differences in Fine Motor Quotient, Grasping, and Visual Motor Integration scores over time by sex and ethnicity were further evaluated by including interaction terms between sex and log-transformed age, and ethnicity and log-transformed age, in separate LQMMs. In each model, the interaction term was tested against the null hypothesis that its slope coefficient equals zero. Predicted values from these adjusted models were also plotted with LOESS lines, stratified by sex and ethnicity, for each of the previously mentioned percentiles. All analyses were conducted with R, version 3.6.3, using the lqmm package. 21 For a more thorough review of mixed effects models and the use of the statistical program, R, for these models, we refer the reader to an excellent article by Brown. 22
Results
Summary table of statistical analyses is presented in Table 1, including coefficients, 95% confidence intervals, and P values for grasping raw score, visual motor integration raw score, and fine motor quotient based on the interactions of log-transformed age with sex and ethnicity across percentiles.
Coefficients, 95% Confidence Intervals, and P Values for Grasping Raw Score, Visual Motor Integration Raw Score, and Fine Motor Quotient based on the interactions of log-transformed age with sex and ethnicity across percentiles. (P Values less than .05 are highlighted in bold)
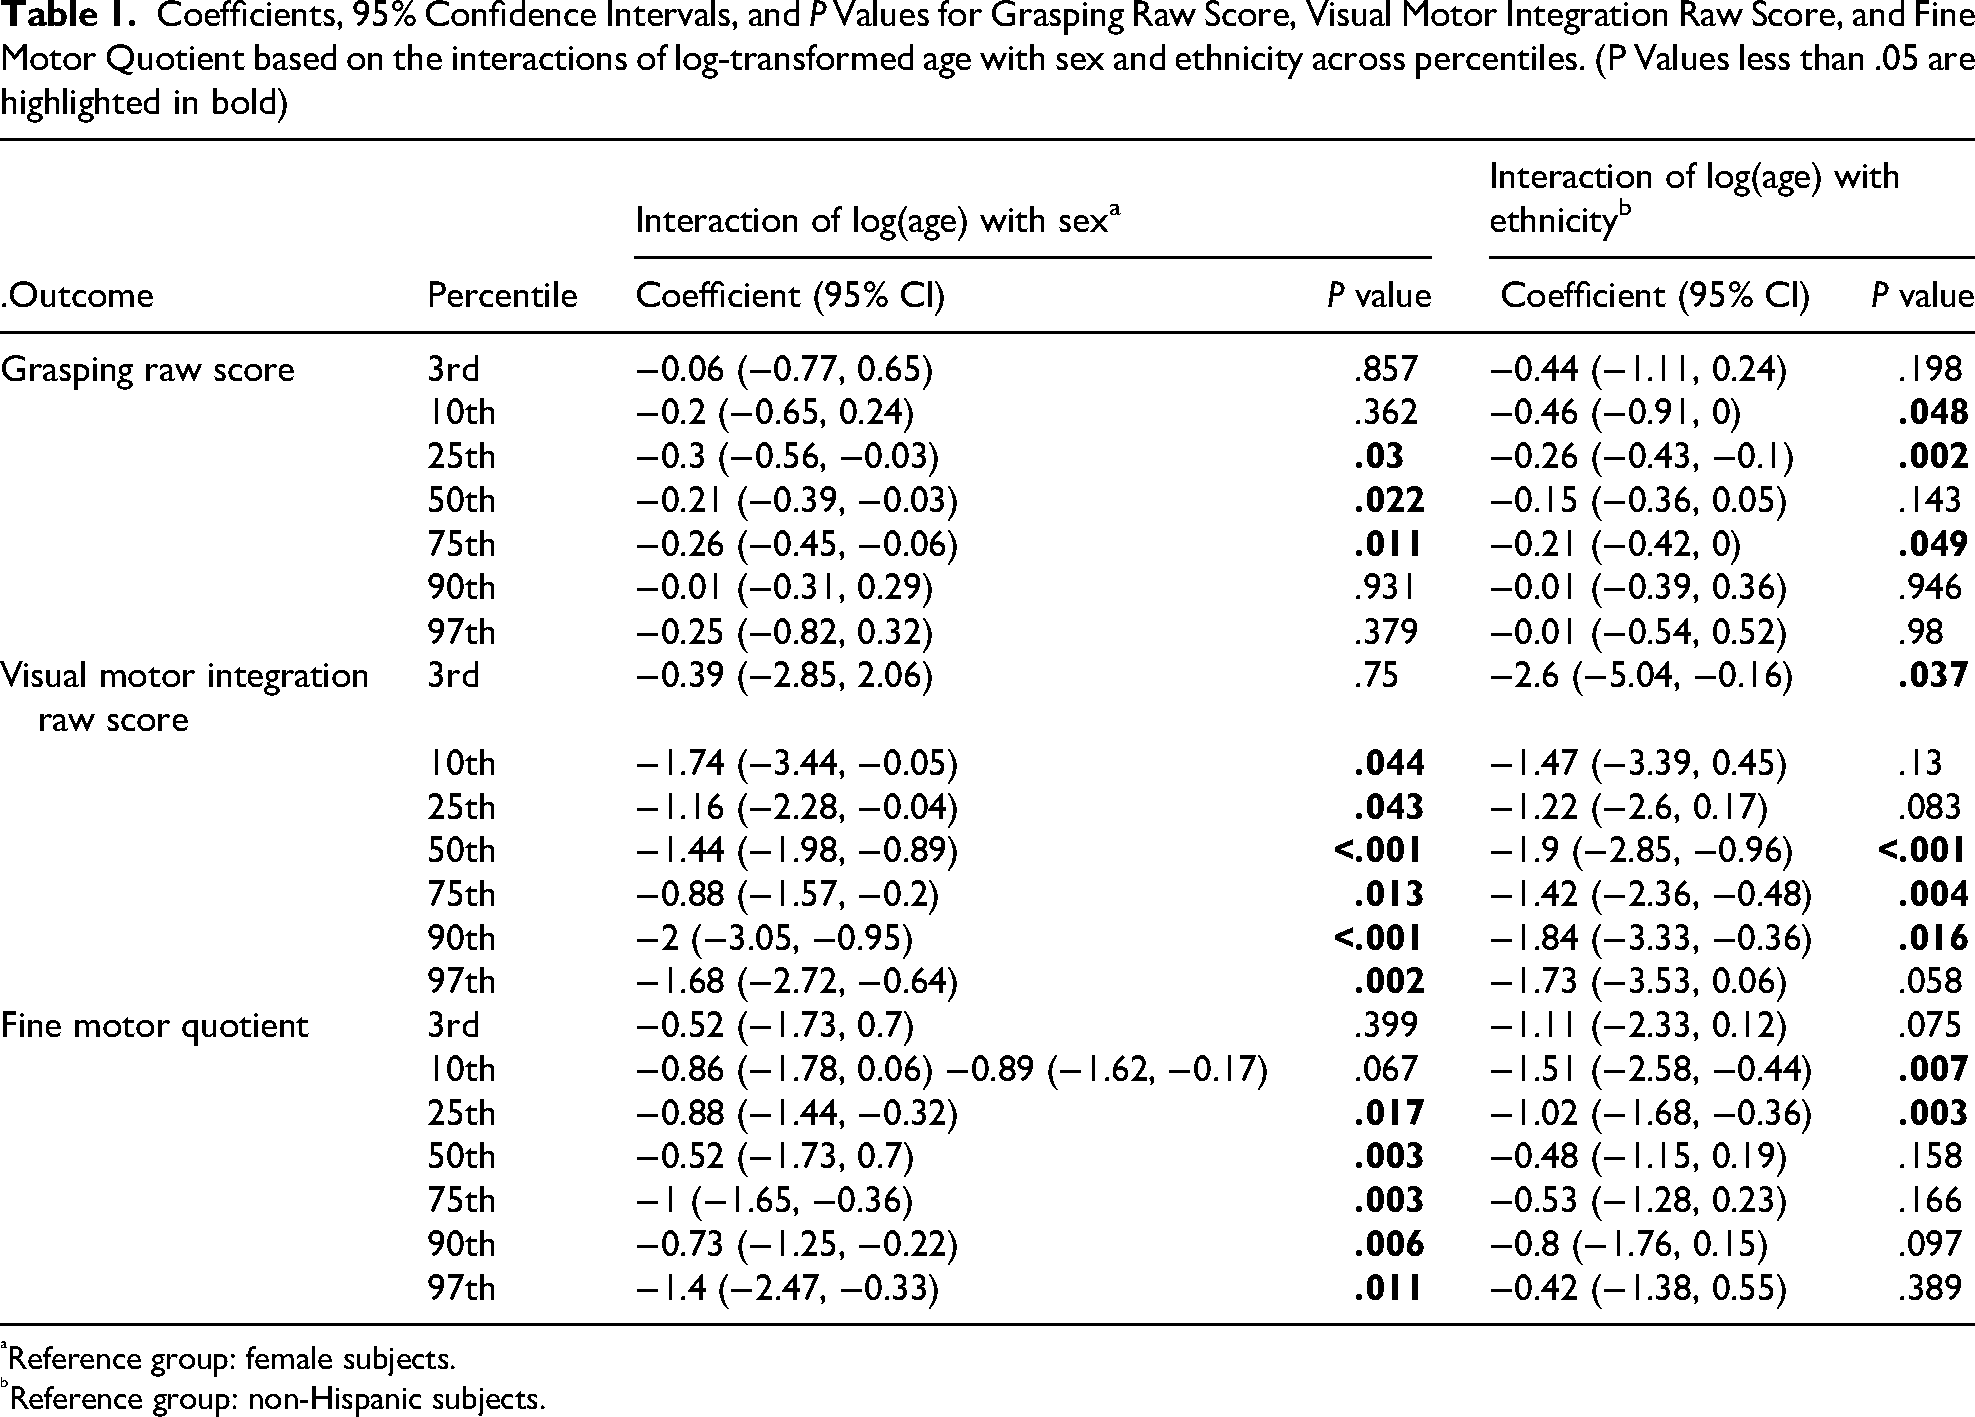
Reference group: female subjects.
Reference group: non-Hispanic subjects.
The coefficients, confidence intervals, and P values are derived from a linear quantile mixed regression with a subject-specific random intercept. A positive coefficient indicates that male/Hispanic subjects (the non-reference group) scored higher over time compared to female/non-Hispanic subjects (the reference group), while a negative coefficient indicates lower scores for male/Hispanic subjects (the non-reference group) over time compared to female/non-Hispanic subjects (the reference group). P values less than .05 are highlighted in bold.
The results are presented graphically below, first for raw scores for the Grasping subtest, then for the Visual Motor Integration subtest, and finally for the Fine Motor Quotient.
Grasping
Grasping raw scores significantly increased as participants grew older (Figure 1). Sex affected the magnitude of the increase—males scored lower than females—in the 25th, 50th, and 75th percentiles (Figure 2). The effect of ethnicity on grasping raw scores over time was inconsistent across the percentiles, with differences noted only in the 10th, 25th, and 75th percentiles (Figure 3).
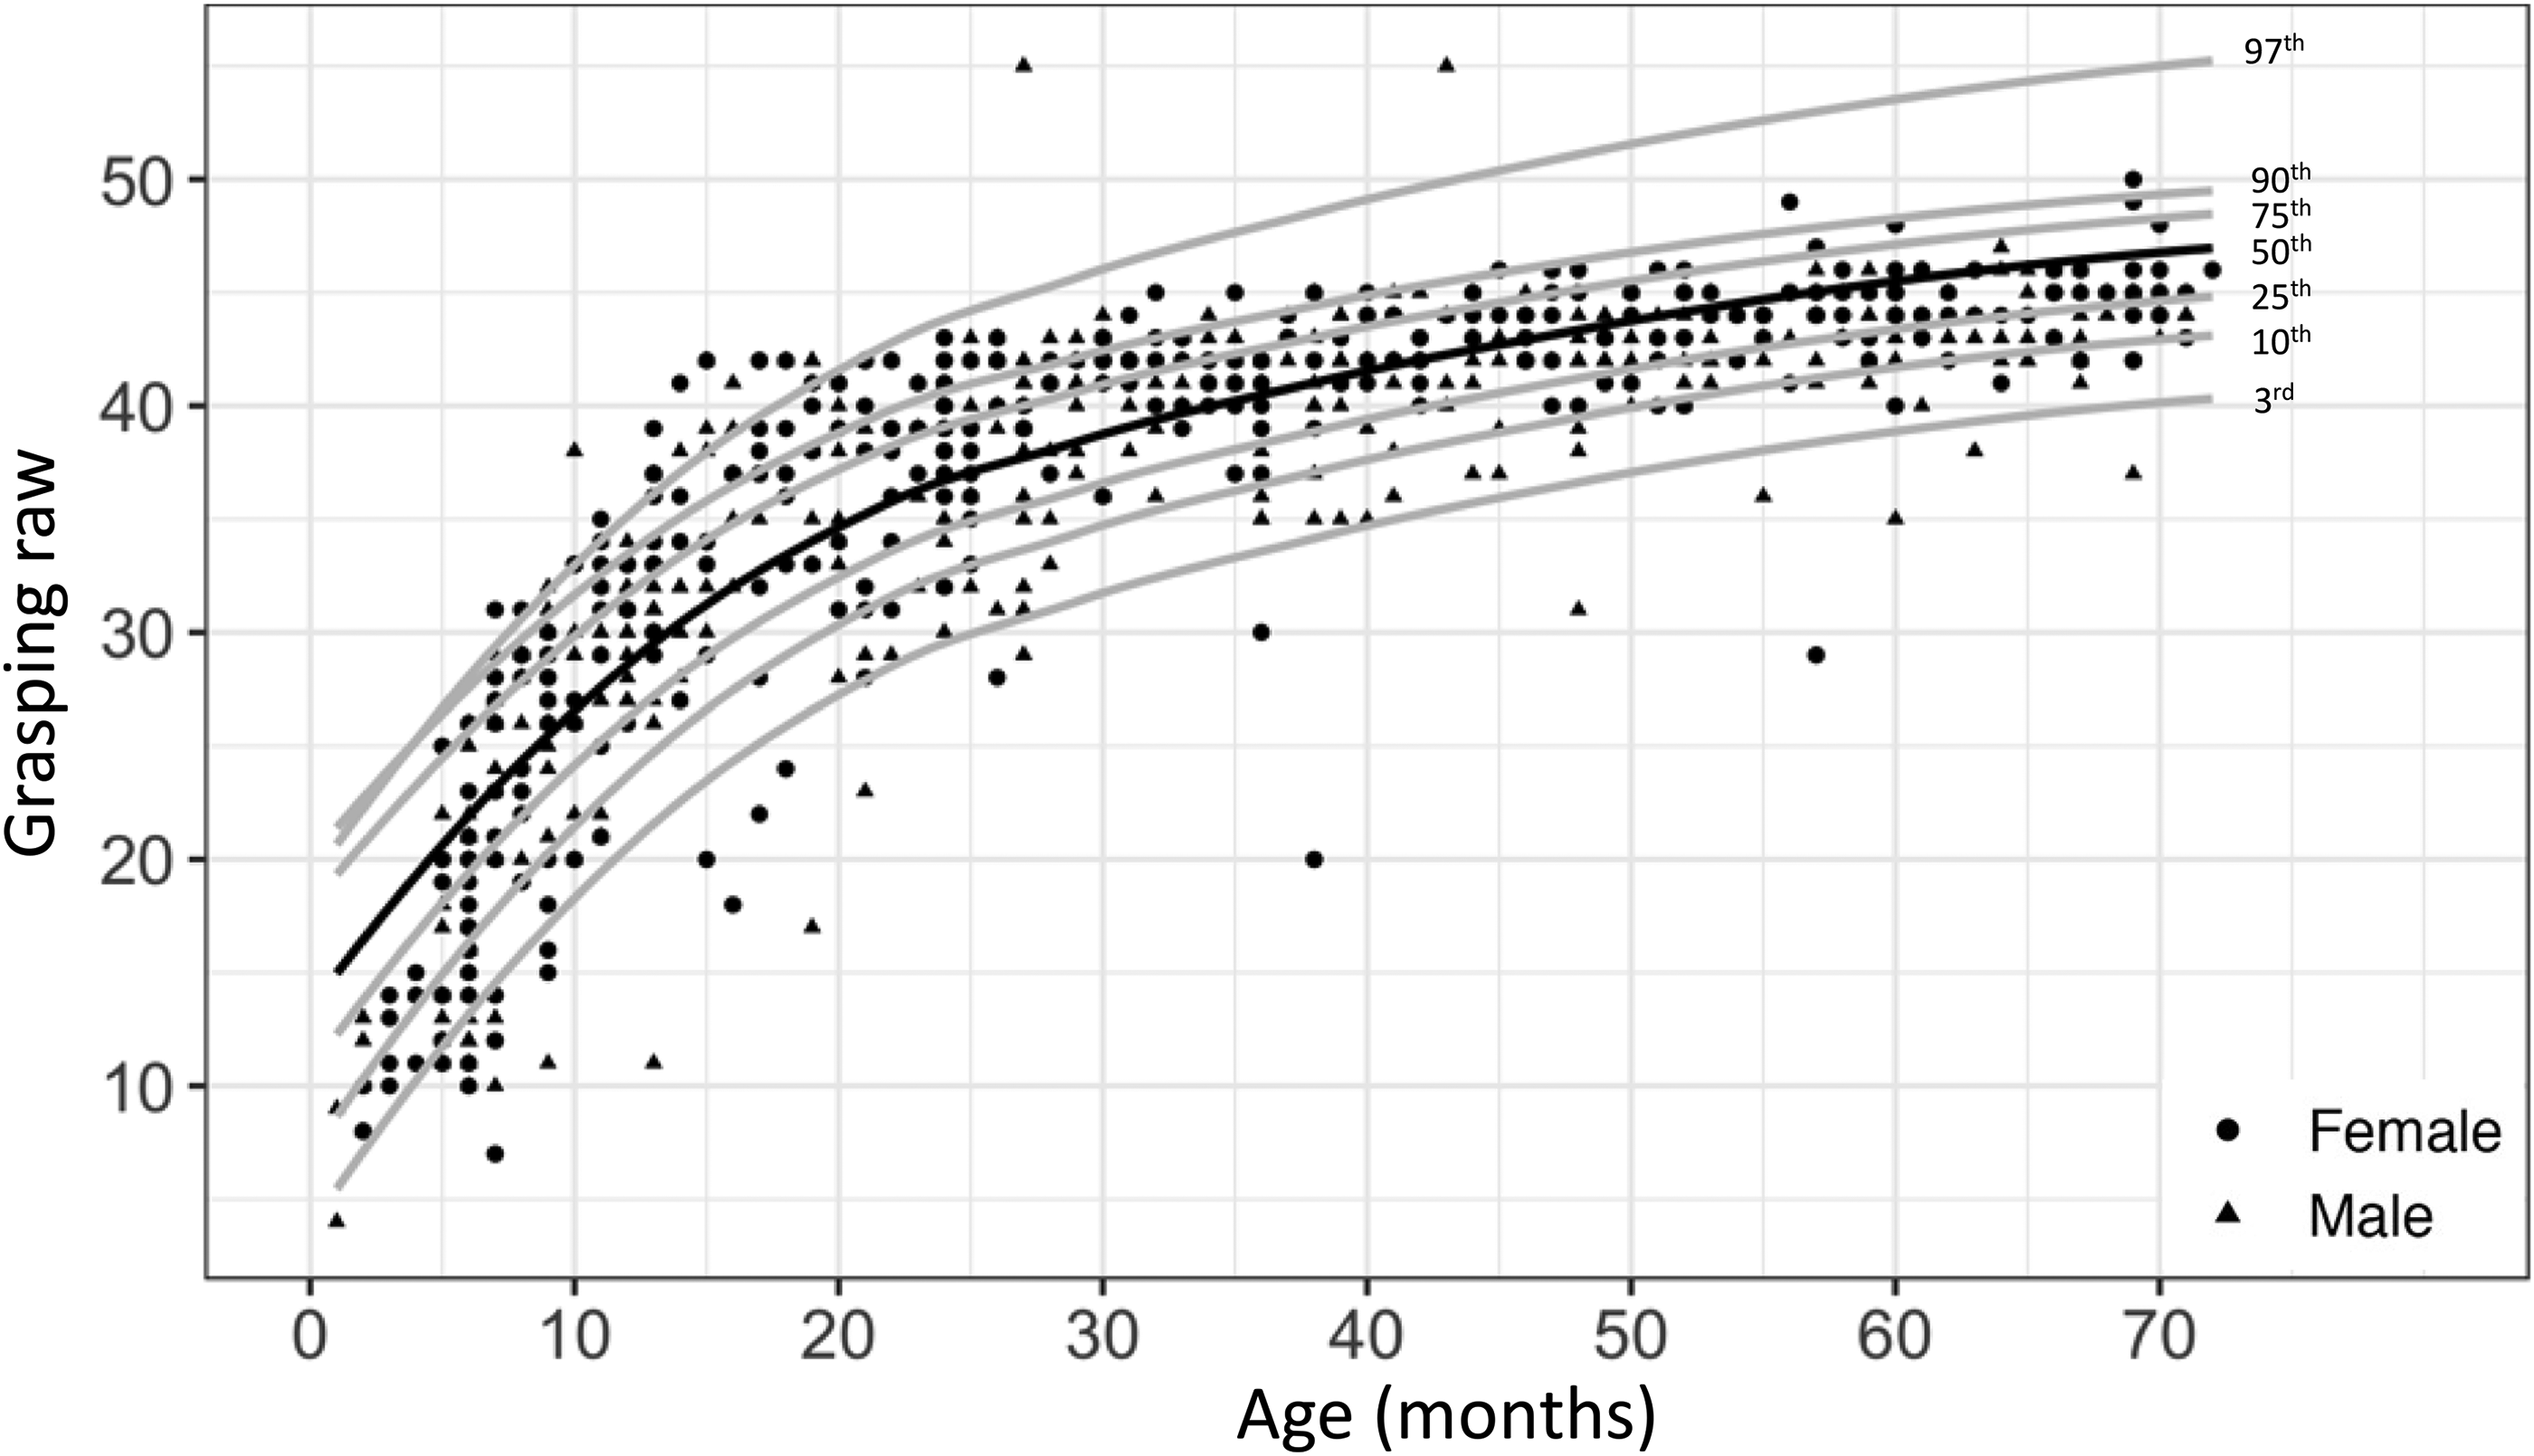
Observed Grasping raw score by age for males (solid black triangle, n = 399) and females (solid black circle, n = 381) with Down syndrome overlaid by the predicted percentiles.
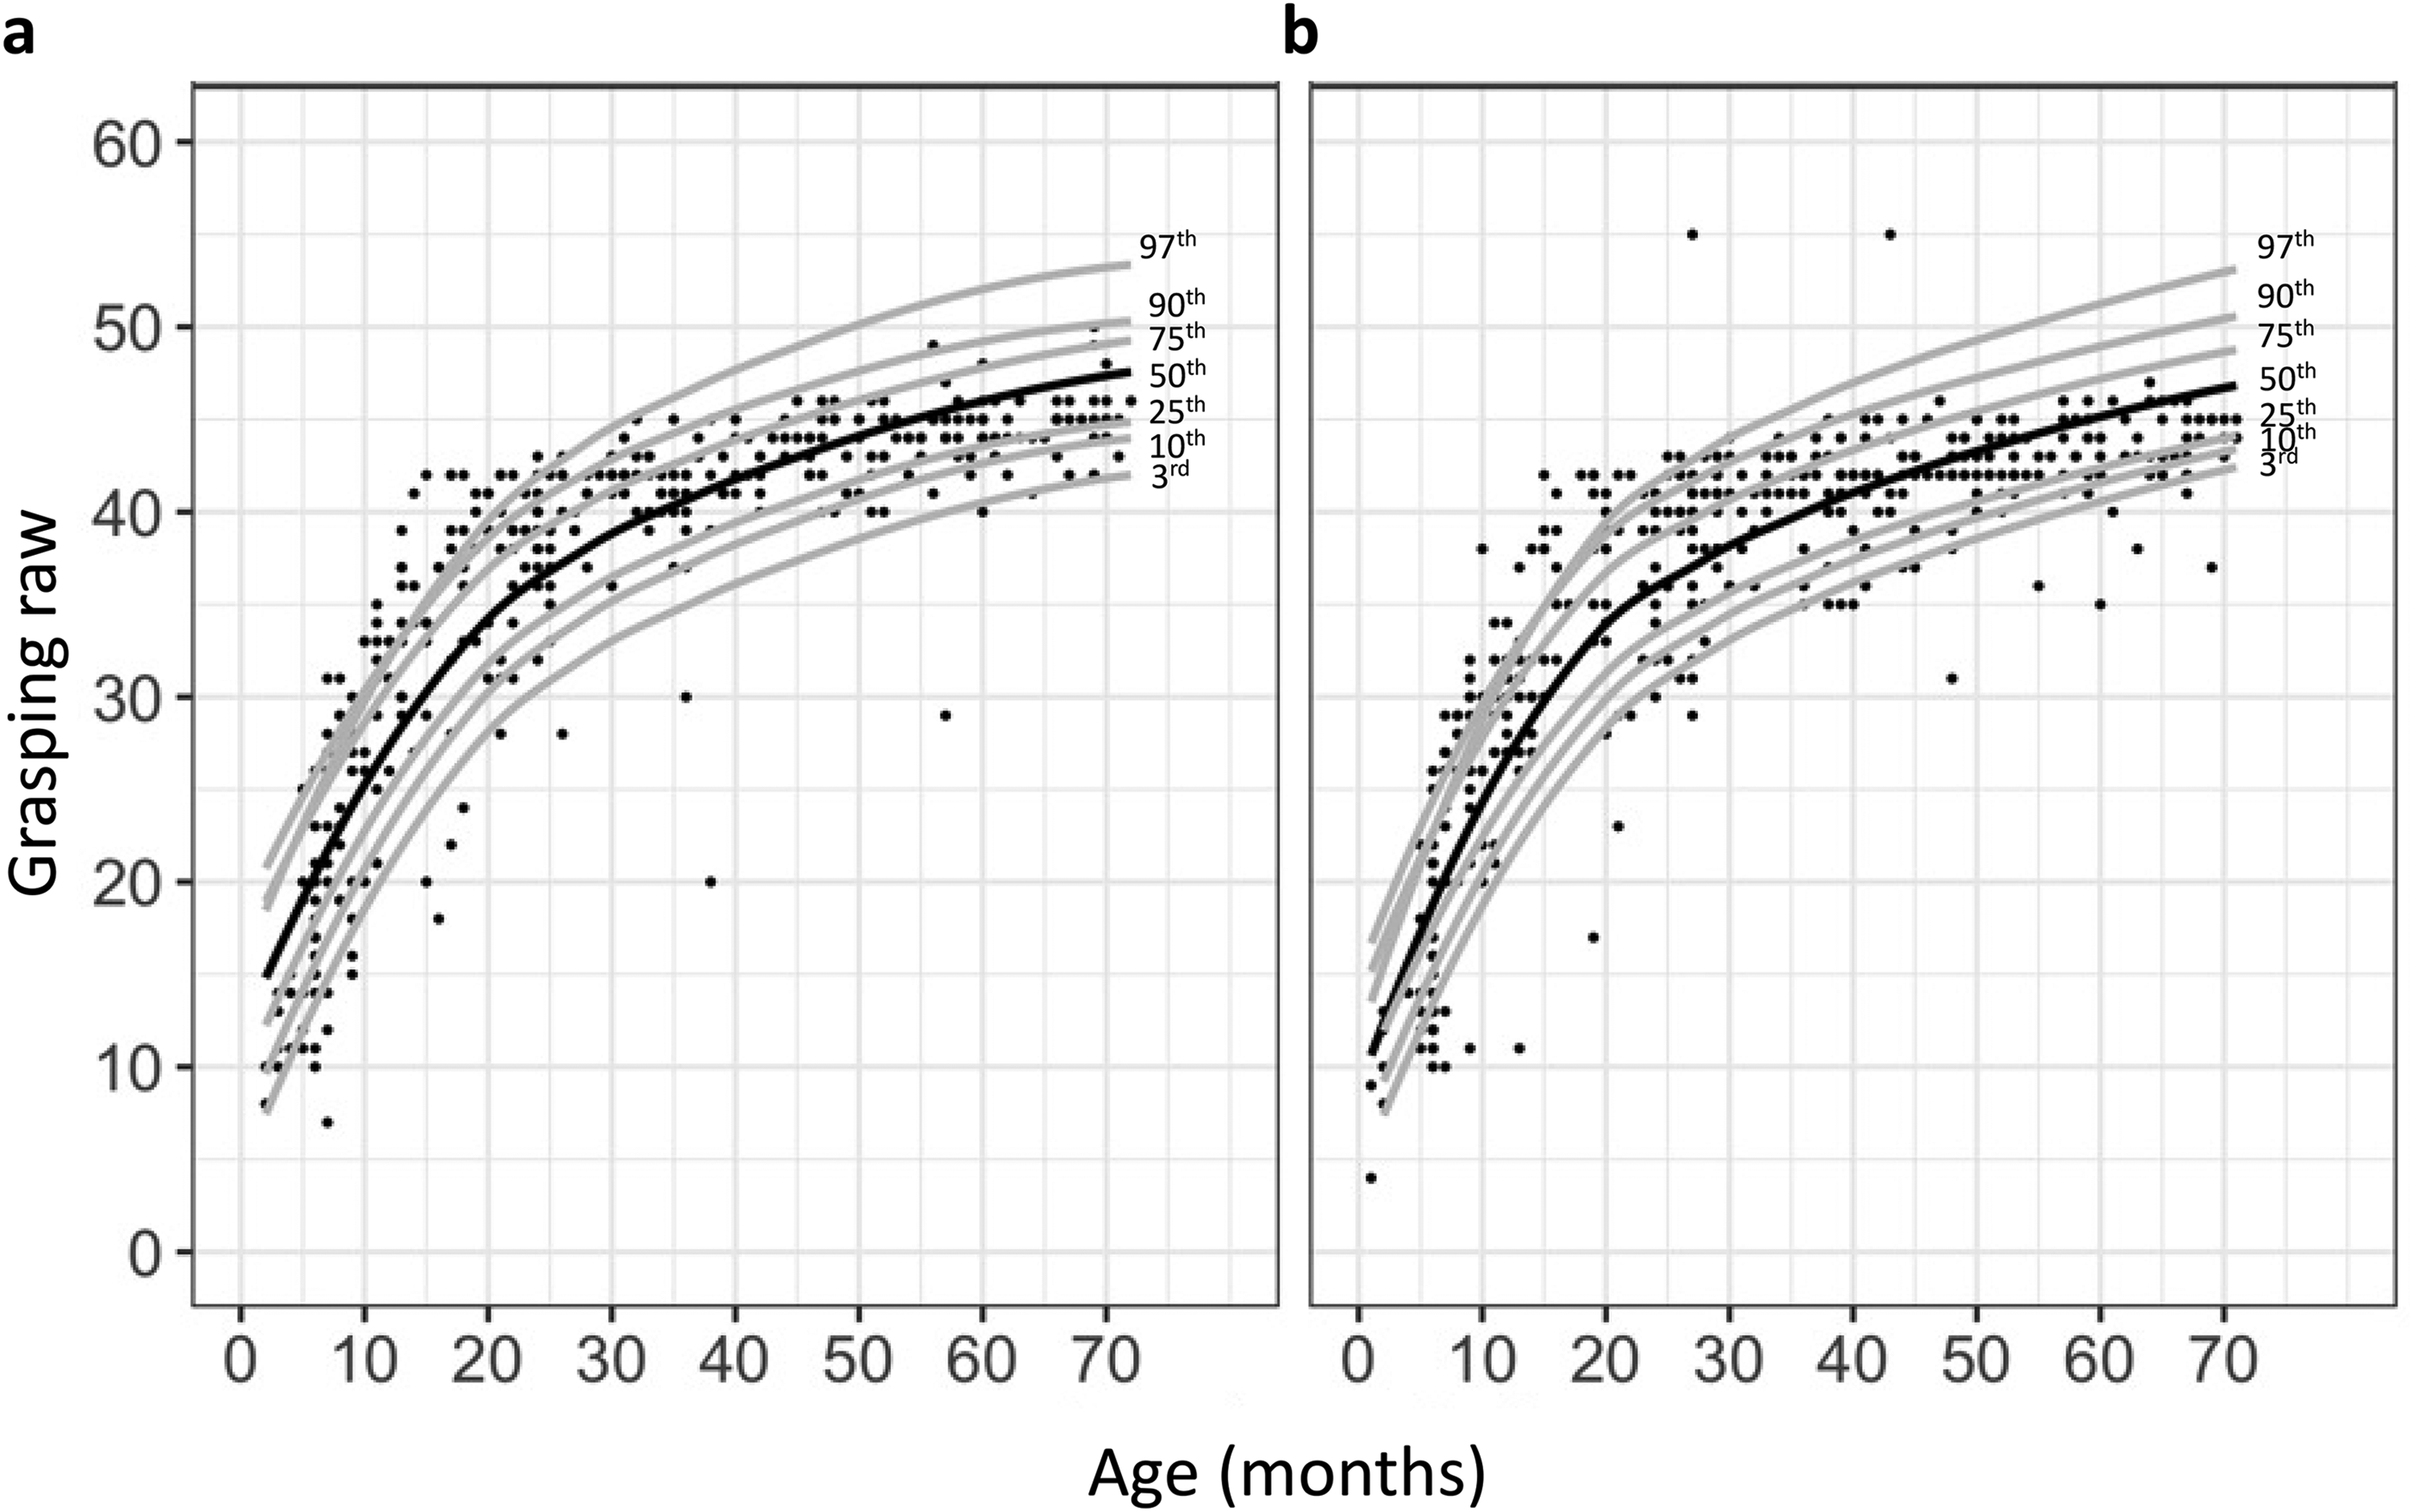
Observed Grasping raw score by age overlaid by the predicted percentiles stratified by sex in subjects with Down syndrome: females (n = 381) (left) and males (n = 399) (right).
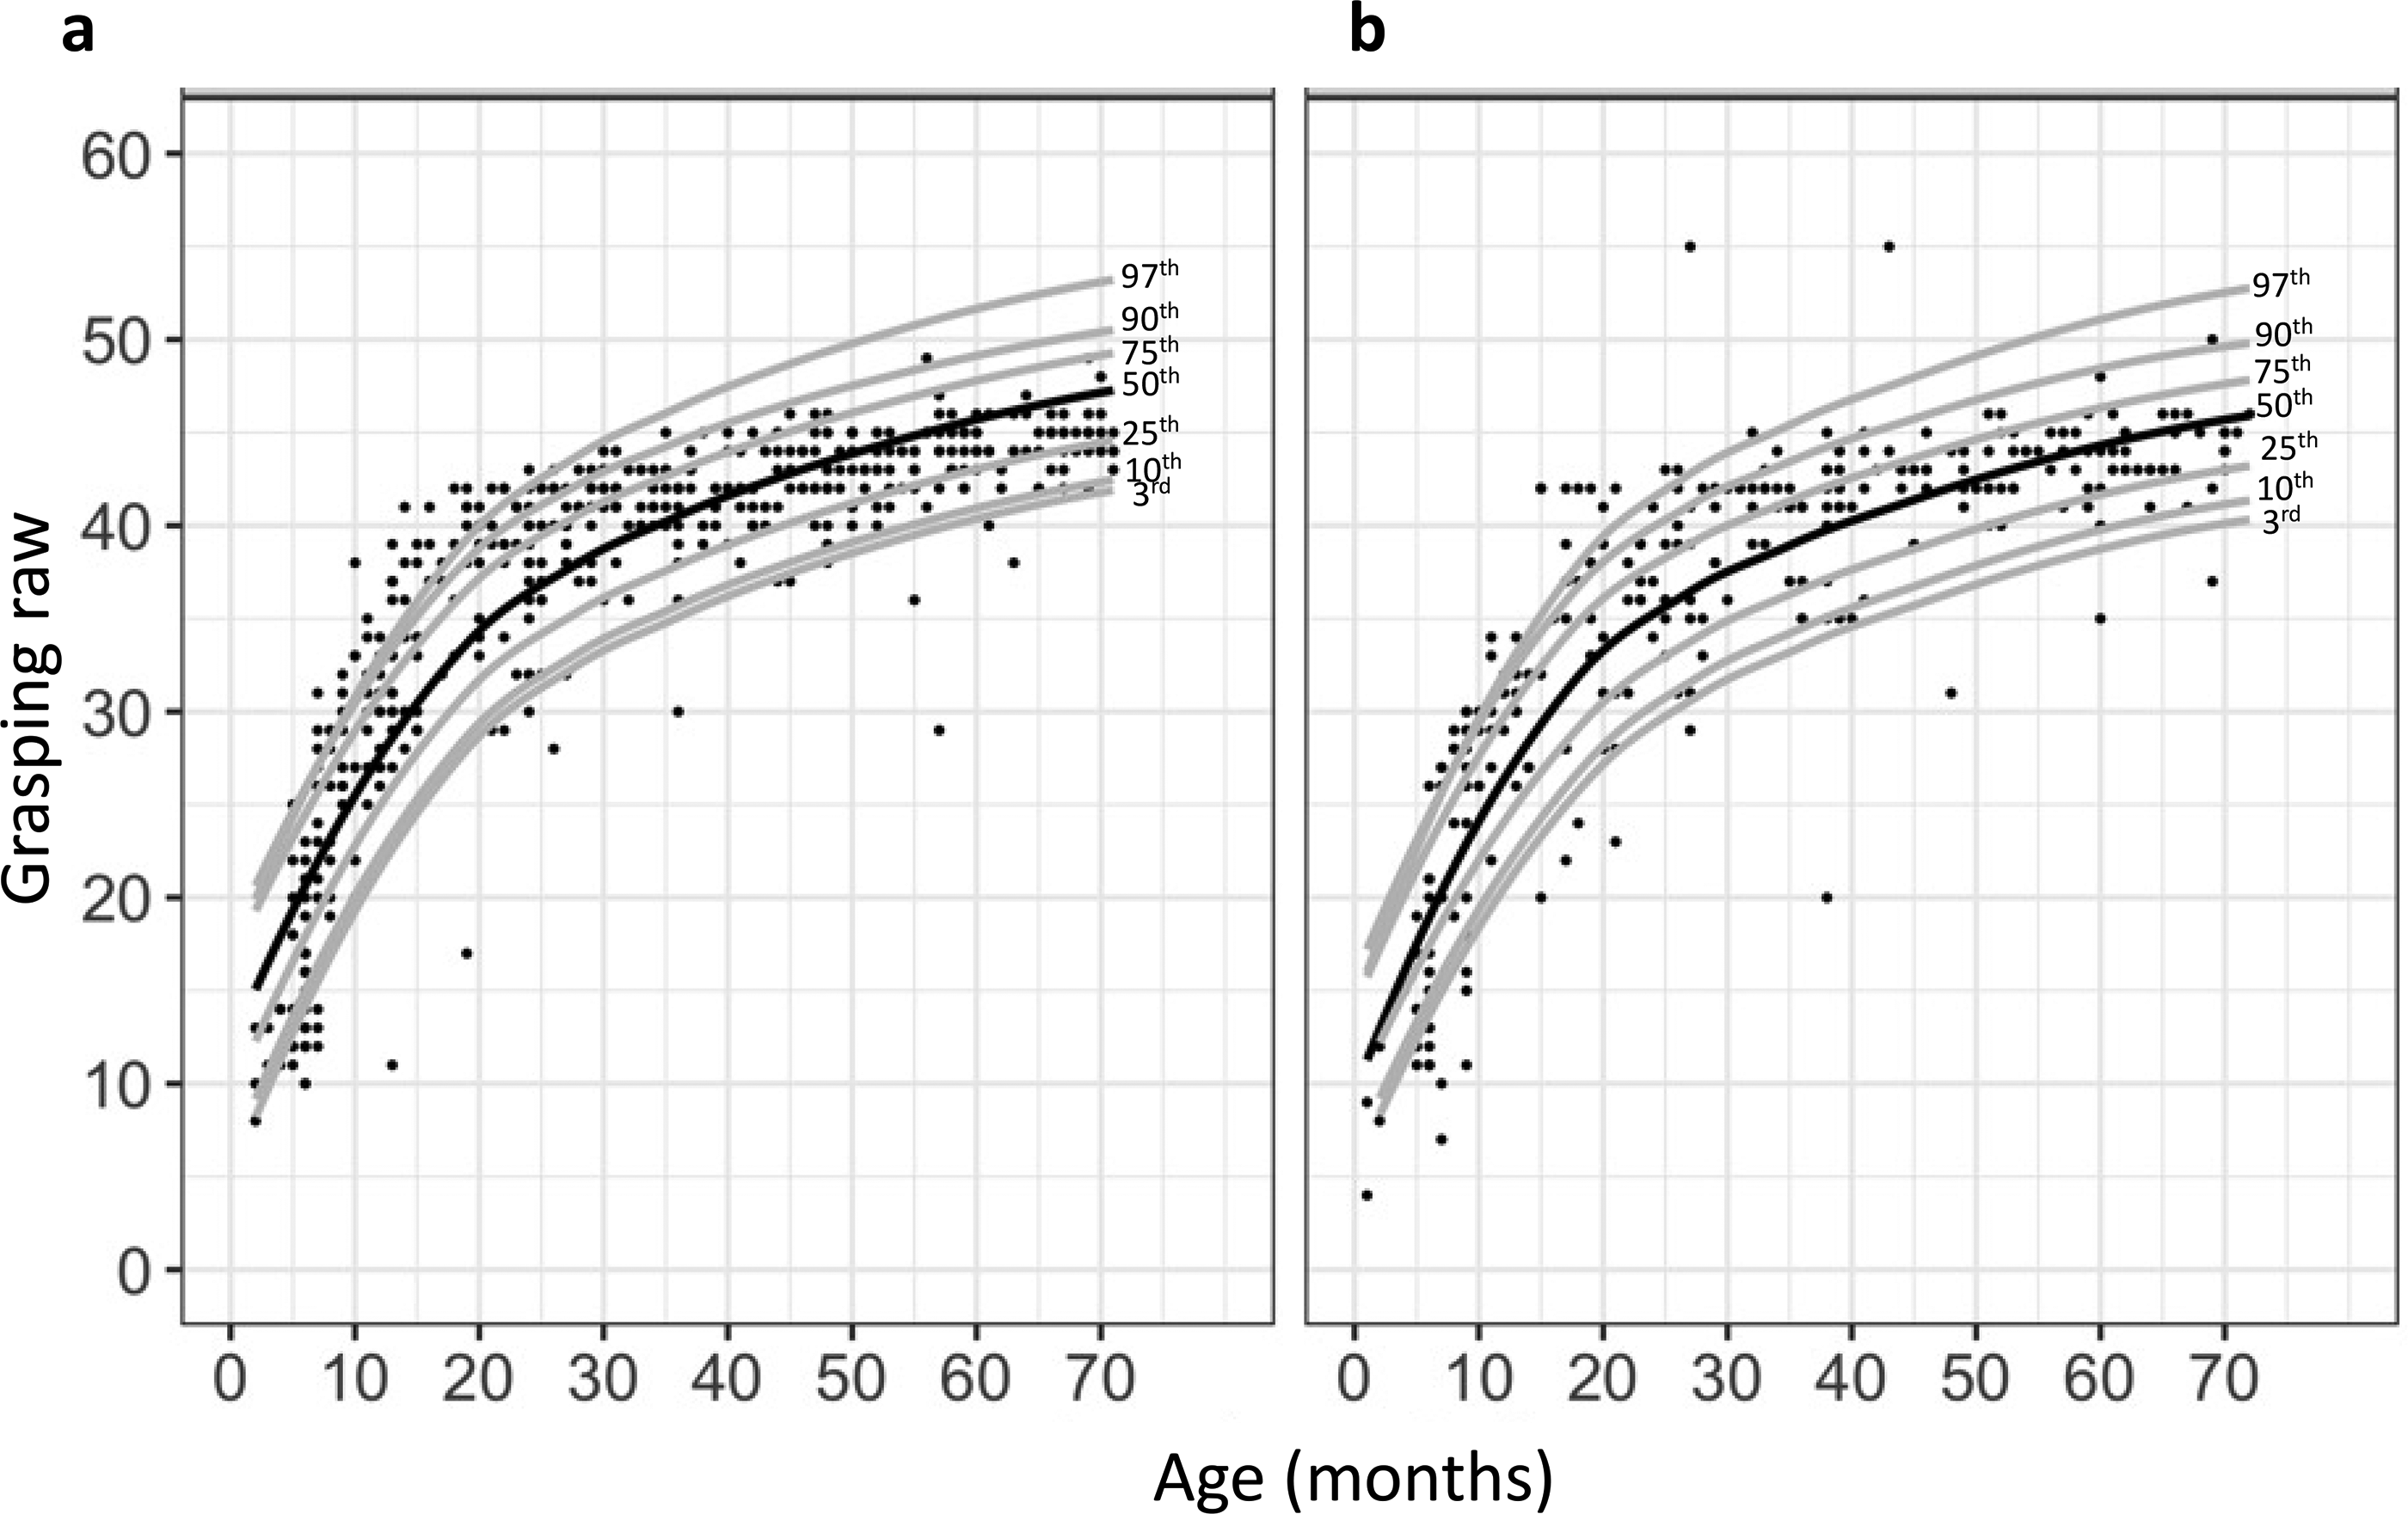
Observed Grasping raw score by age in subjects with Down syndrome overlaid by the predicted percentiles stratified by ethnicity: non-Hispanic (n = 467) (left) and Hispanic (n = 276) (right).
Visual Motor Integration
Age was positively associated with visual motor integration raw score (Figure 4). Males’ visual motor integration raw scores were lower than females’ scores in all percentiles except the 3rd percentile (Figure 5). A similar trend was observed in the 3rd percentile, but the large variation of scores in the 3rd percentile was attributed to a larger standard error. Visual motor integration raw score over time also differed by ethnicity in all percentiles except the 10th percentile (Figure 6).
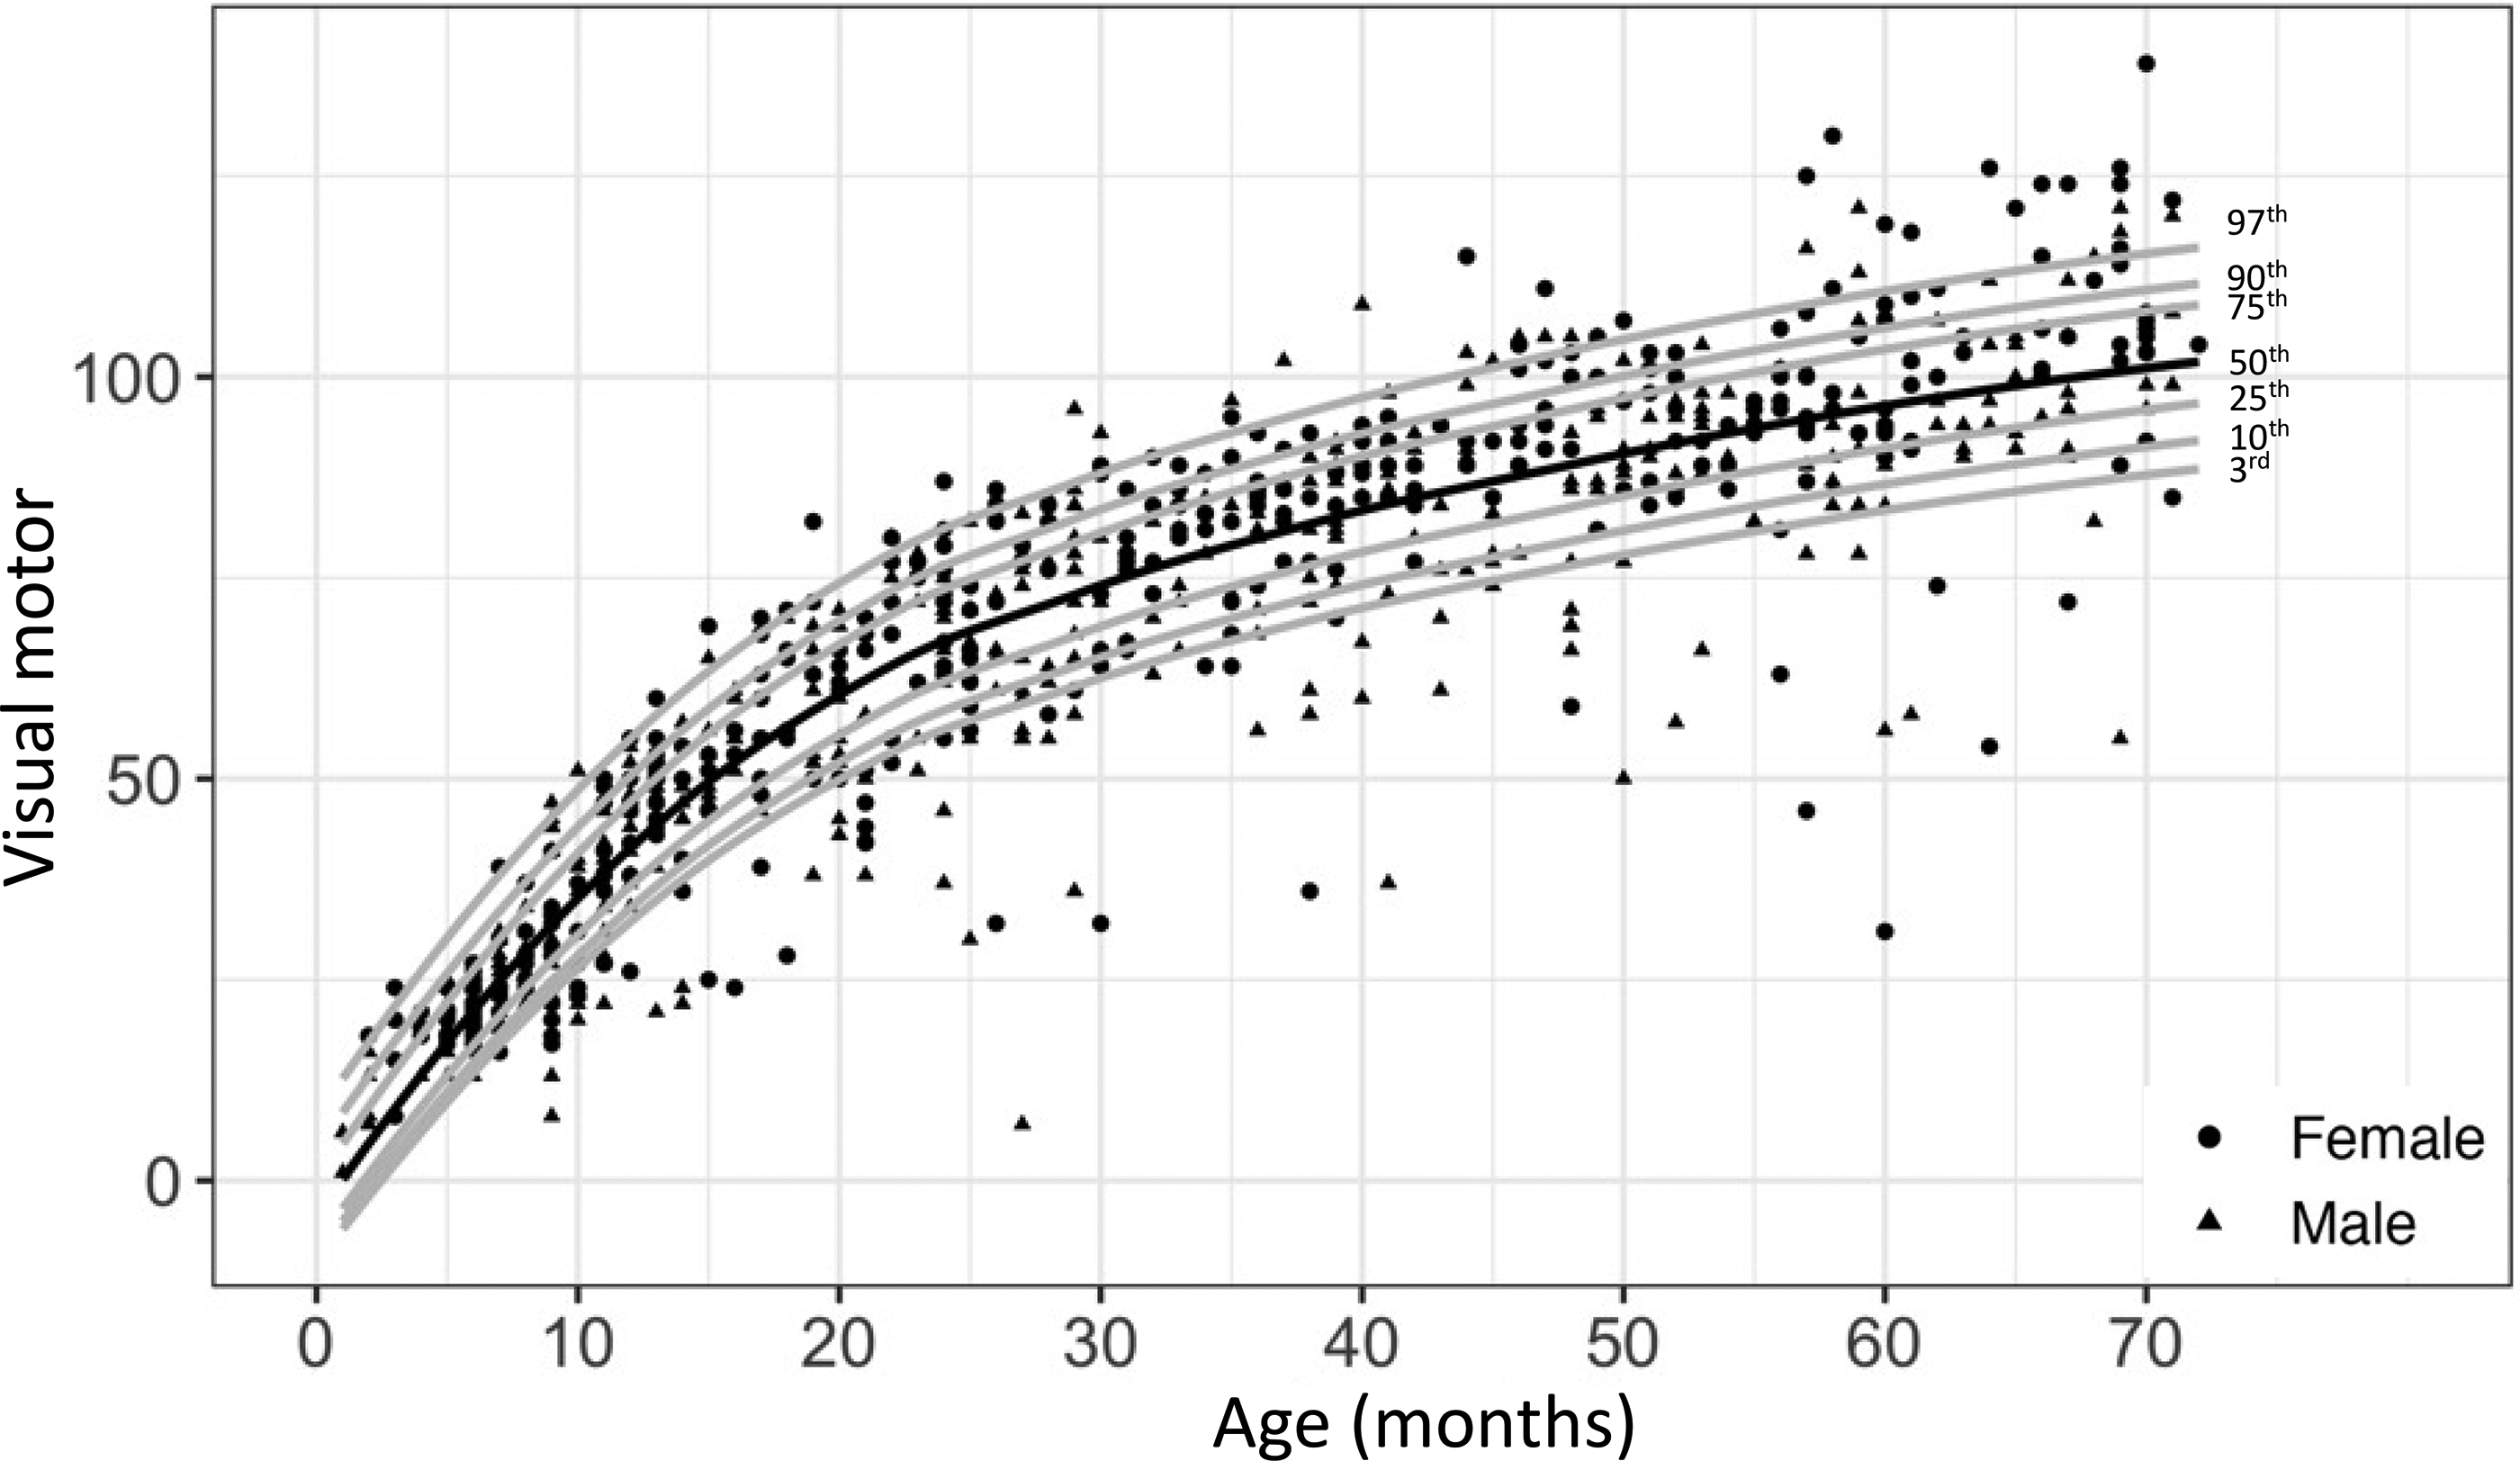
Observed visual motor integration raw score by age for males (solid black triangle, n = 399) and females (solid black circle, n = 381) with Down syndrome, overlaid by the predicted percentiles.
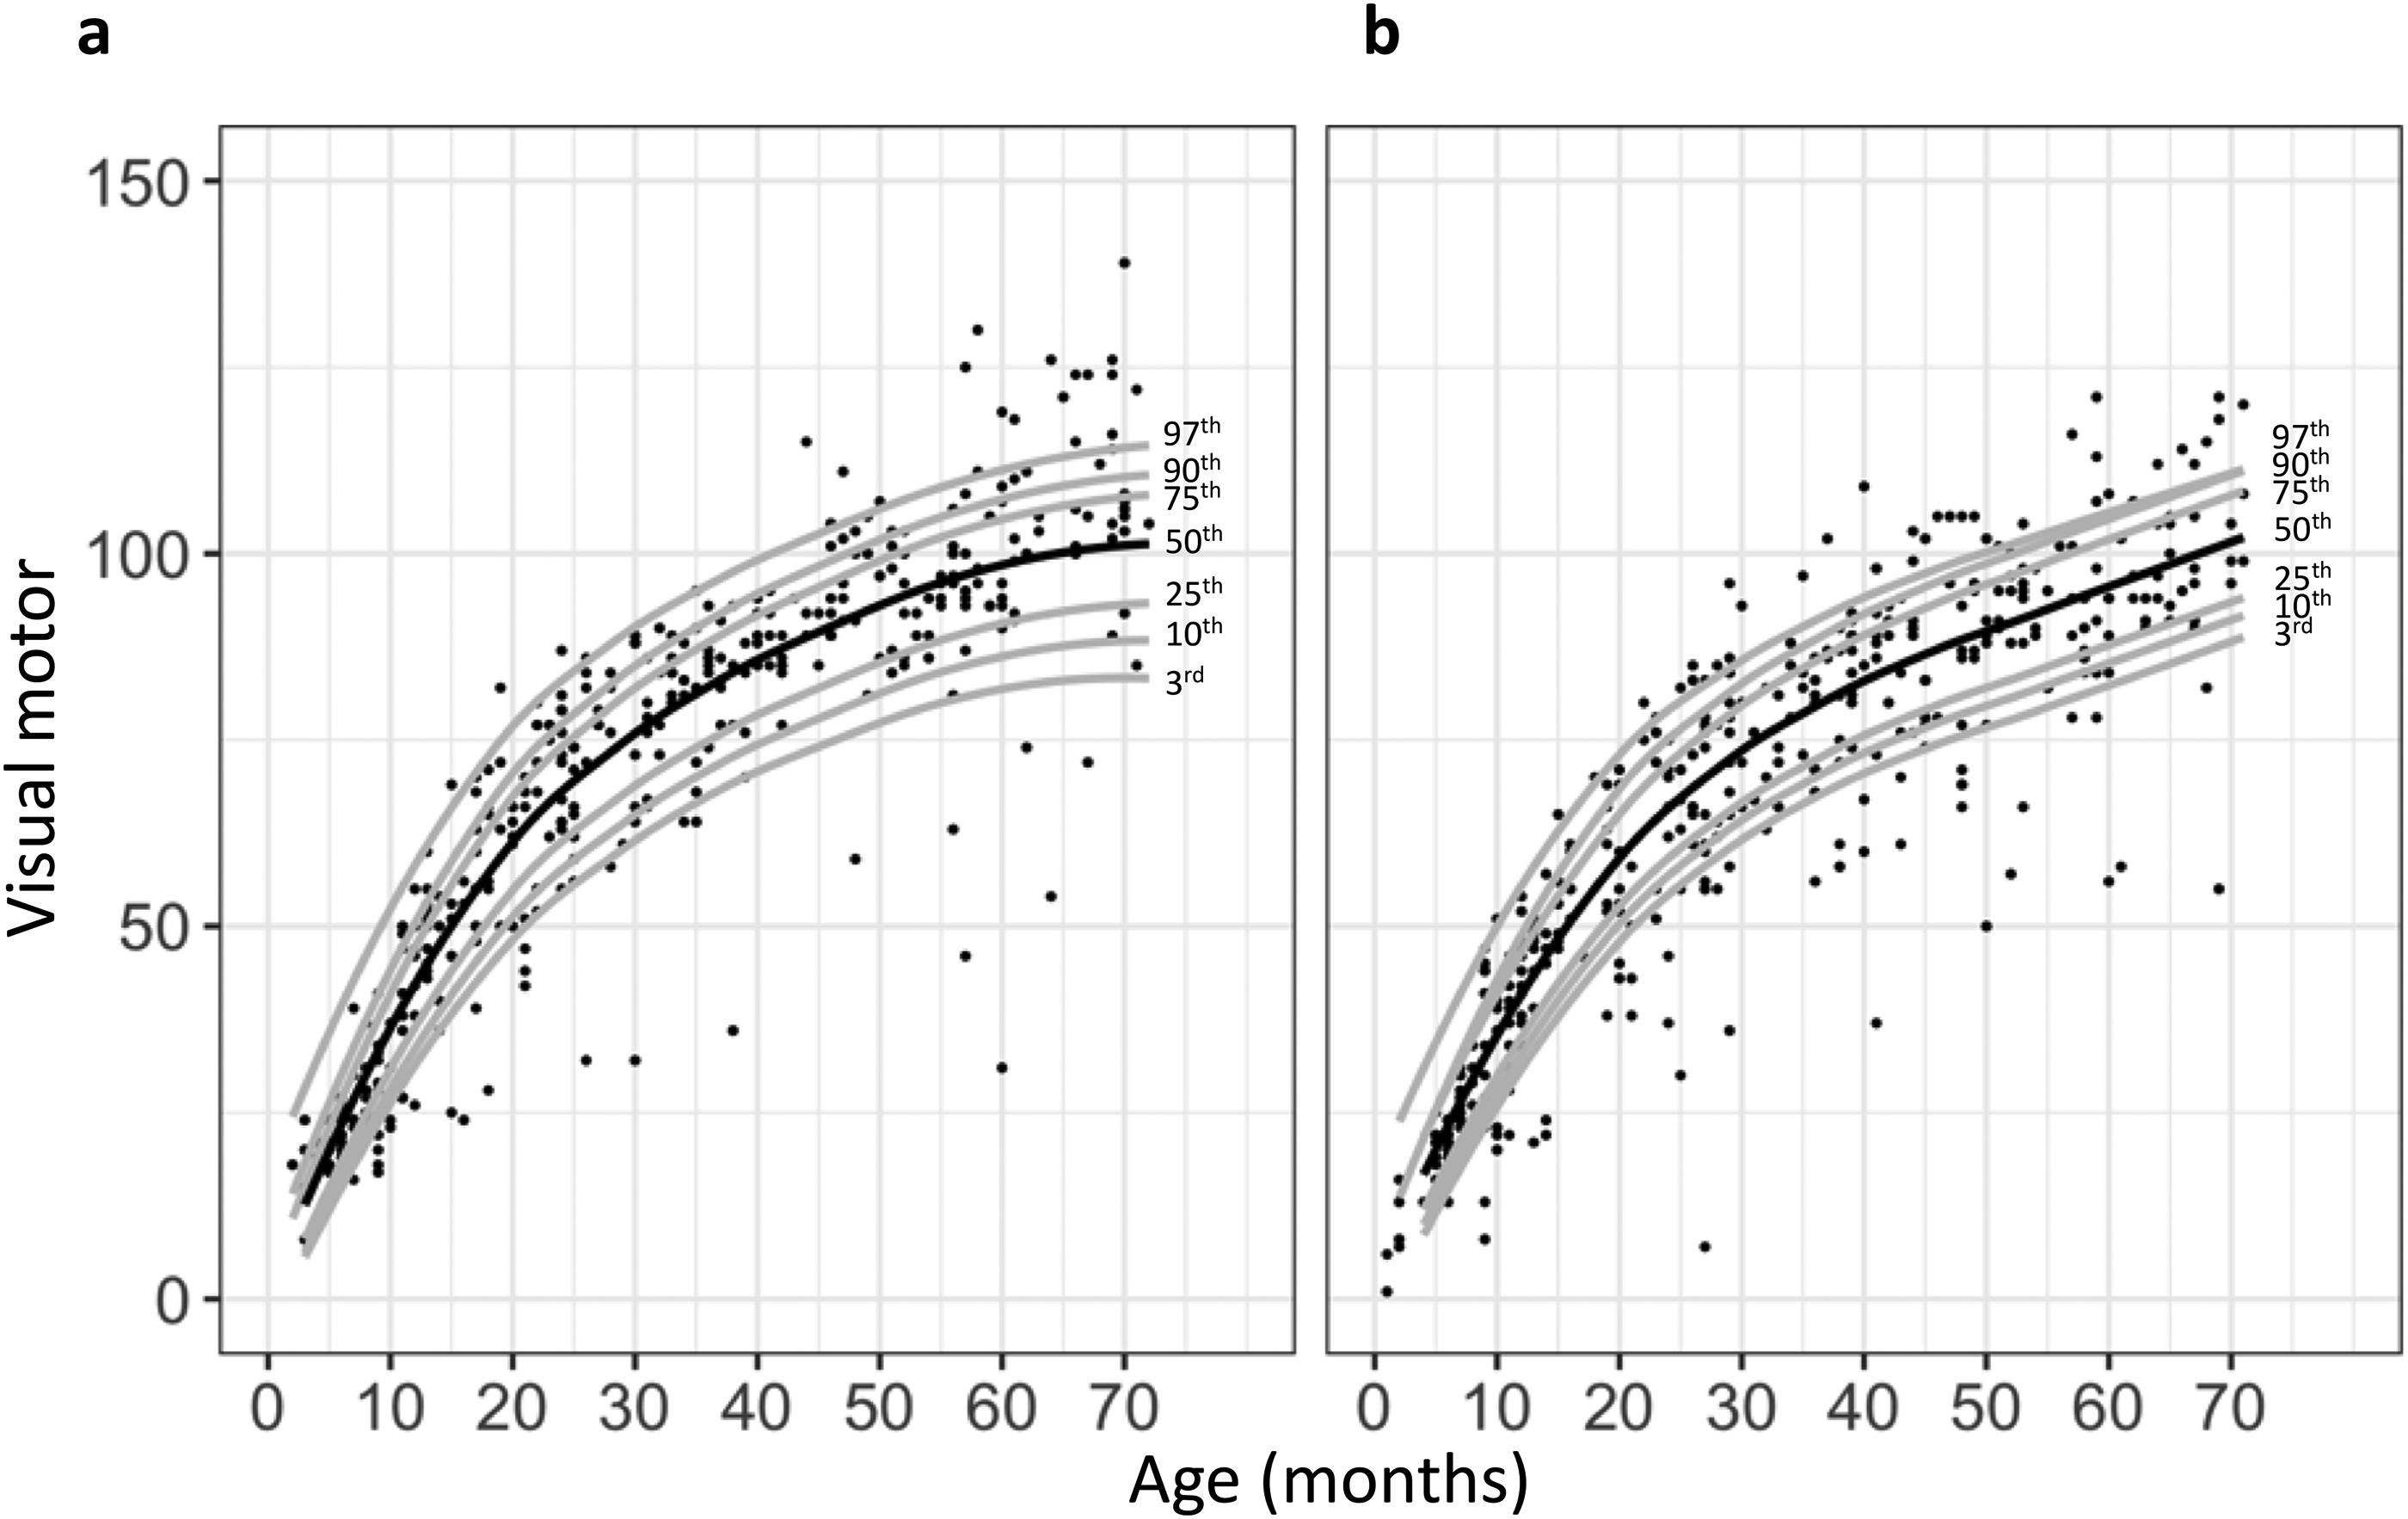
Observed visual motor integration raw score by age among subjects with Down syndrome overlaid by the predicted percentiles stratified by sex: females (n = 381) (left) and males (n = 399) (right).
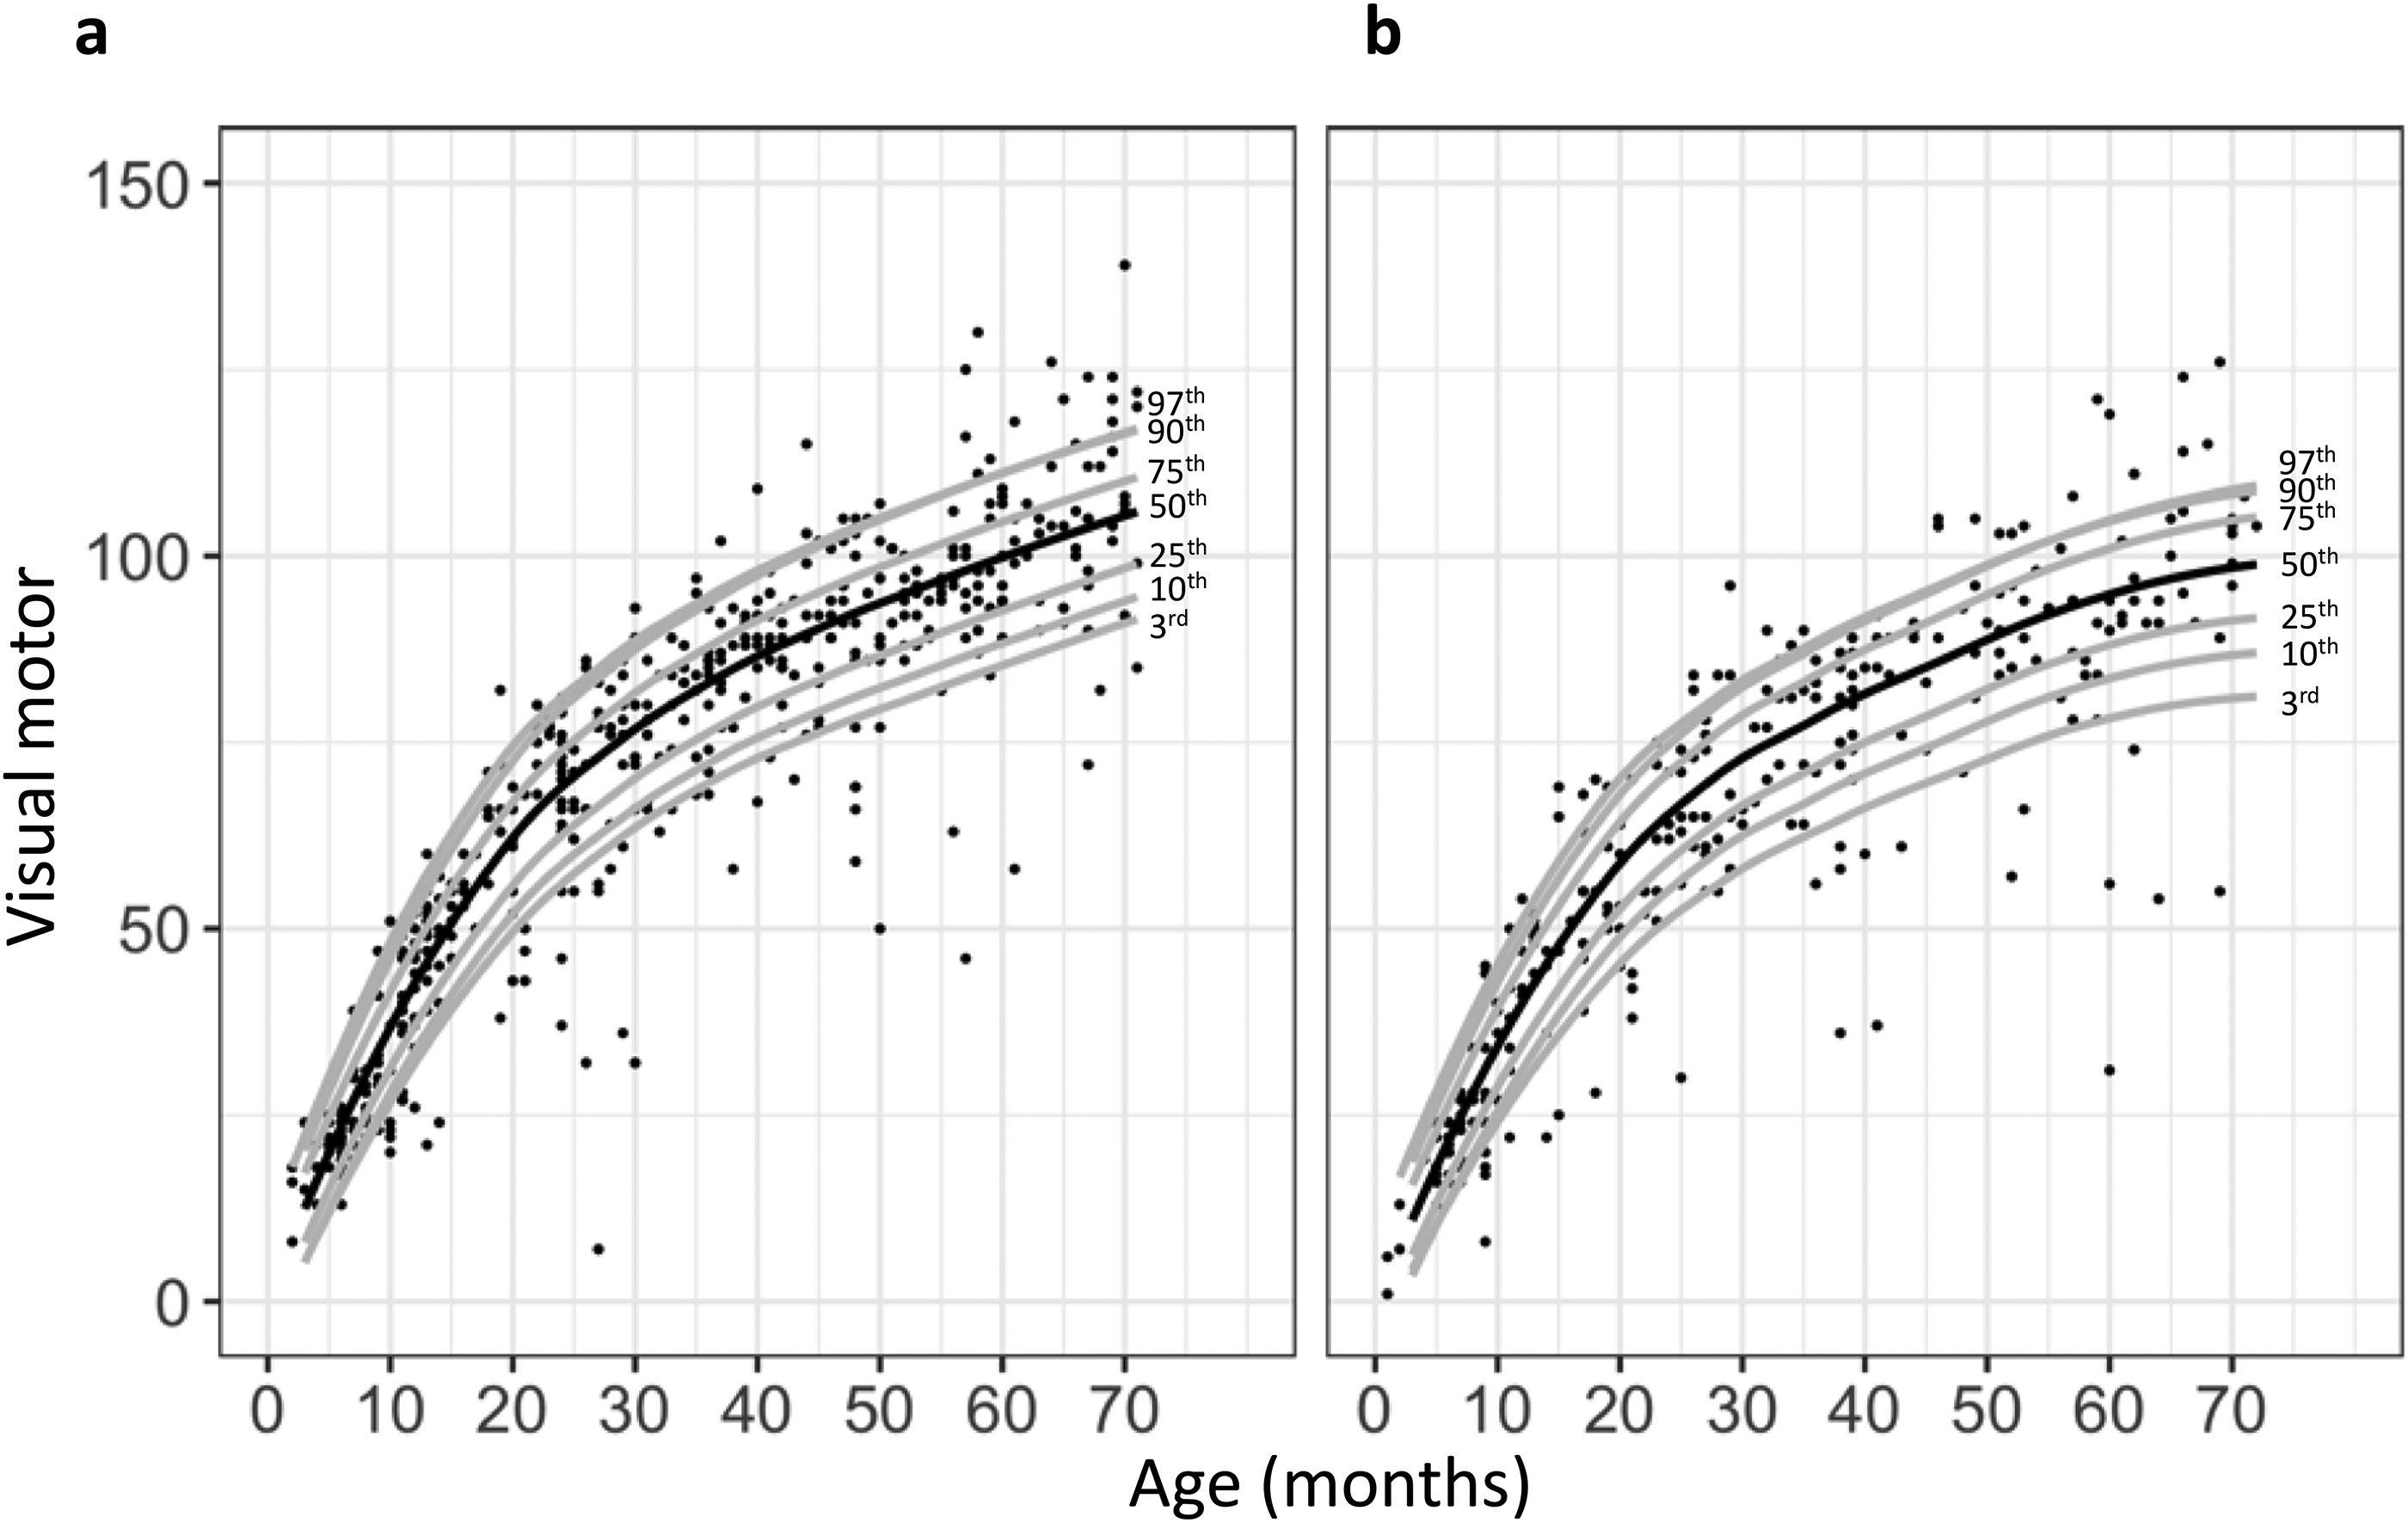
Observed visual motor integration raw scores by age overlaid by the predicted percentiles stratified by ethnicity: non-Hispanic (n = 467) (left) and Hispanic (n = 276) (right).
Fine Motor Quotient
There was a negative association between fine motor quotient and age, which became less negative for higher percentiles (Figure 7). In the 10th, 25th, 50th, 75th, 90th, and 97th percentiles, sex significantly affected the association between fine motor quotient and age. Specifically, males scored lower on fine motor quotient than females over time (Figure 8). Ethnicity also affected the association between fine motor quotient and age. Hispanic subjects scored significantly lower than non-Hispanic subjects on fine motor quotient in the 3rd, 10th, 25th, and 90th percentiles (Figures 9 and 10).
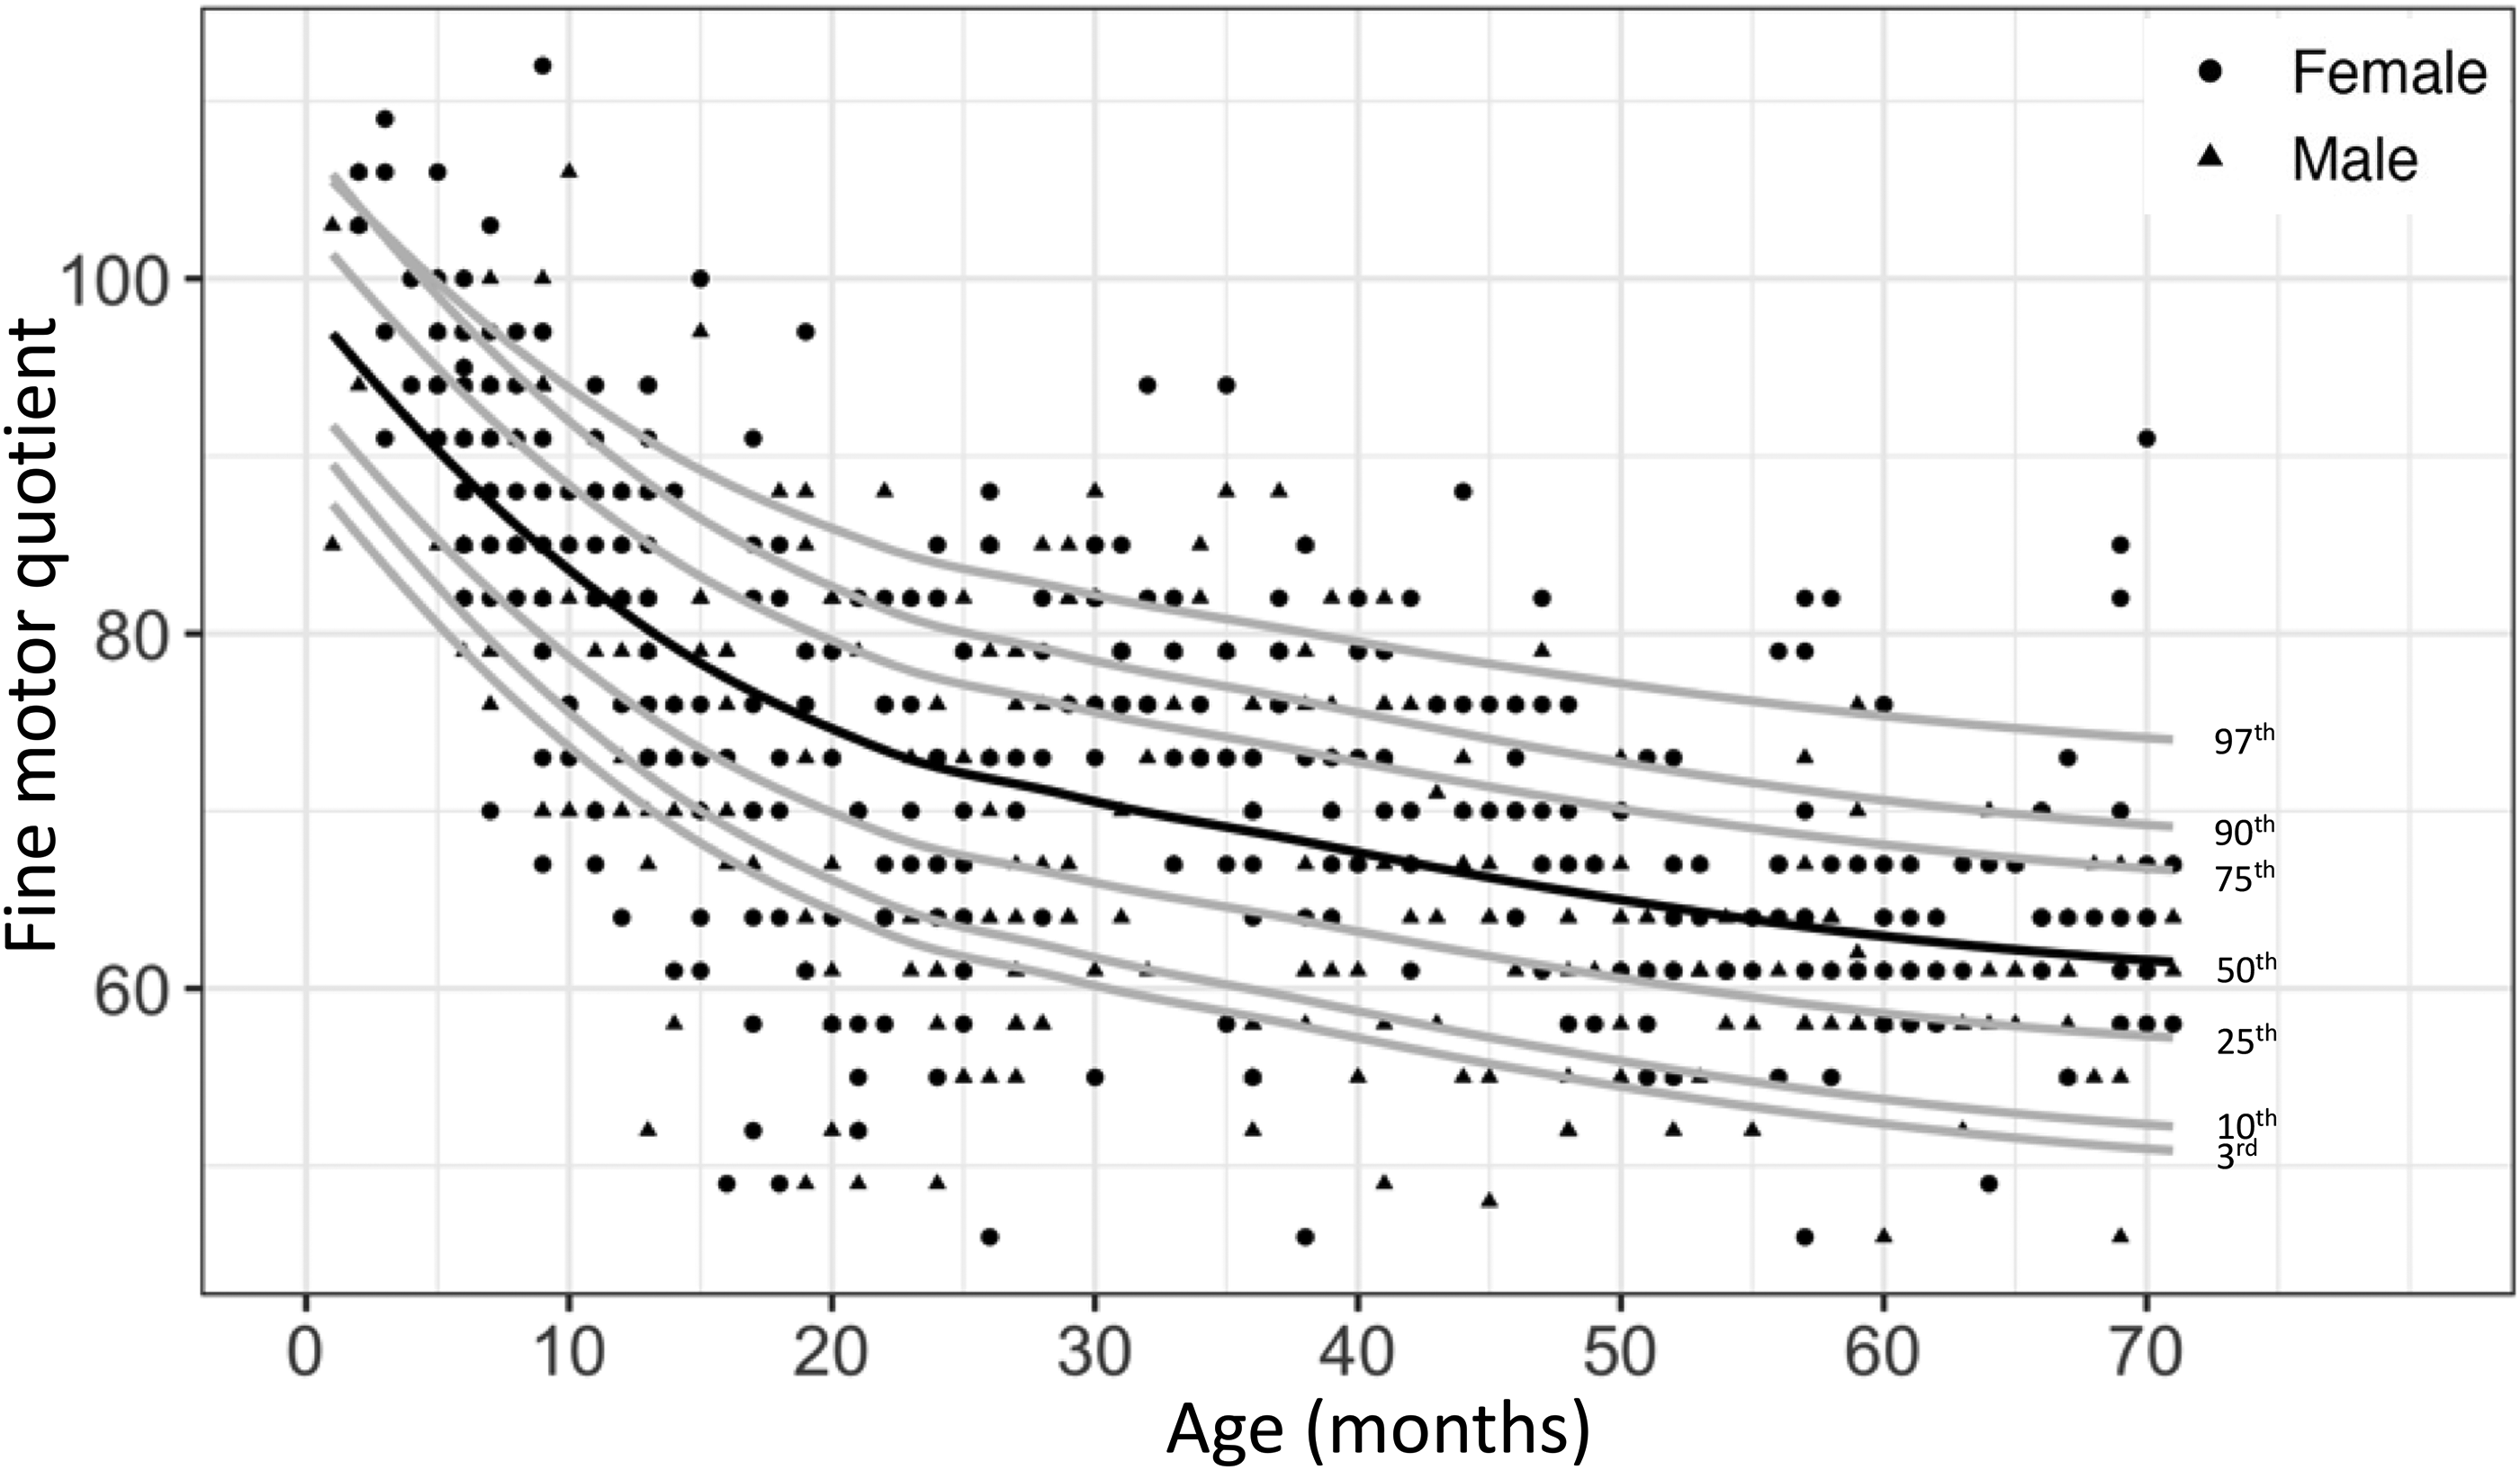
Observed fine motor quotient by age for males (solid black triangle, n = 400) and females (solid black circle, n = 381) with Down syndrome overlaid by the predicted percentiles.
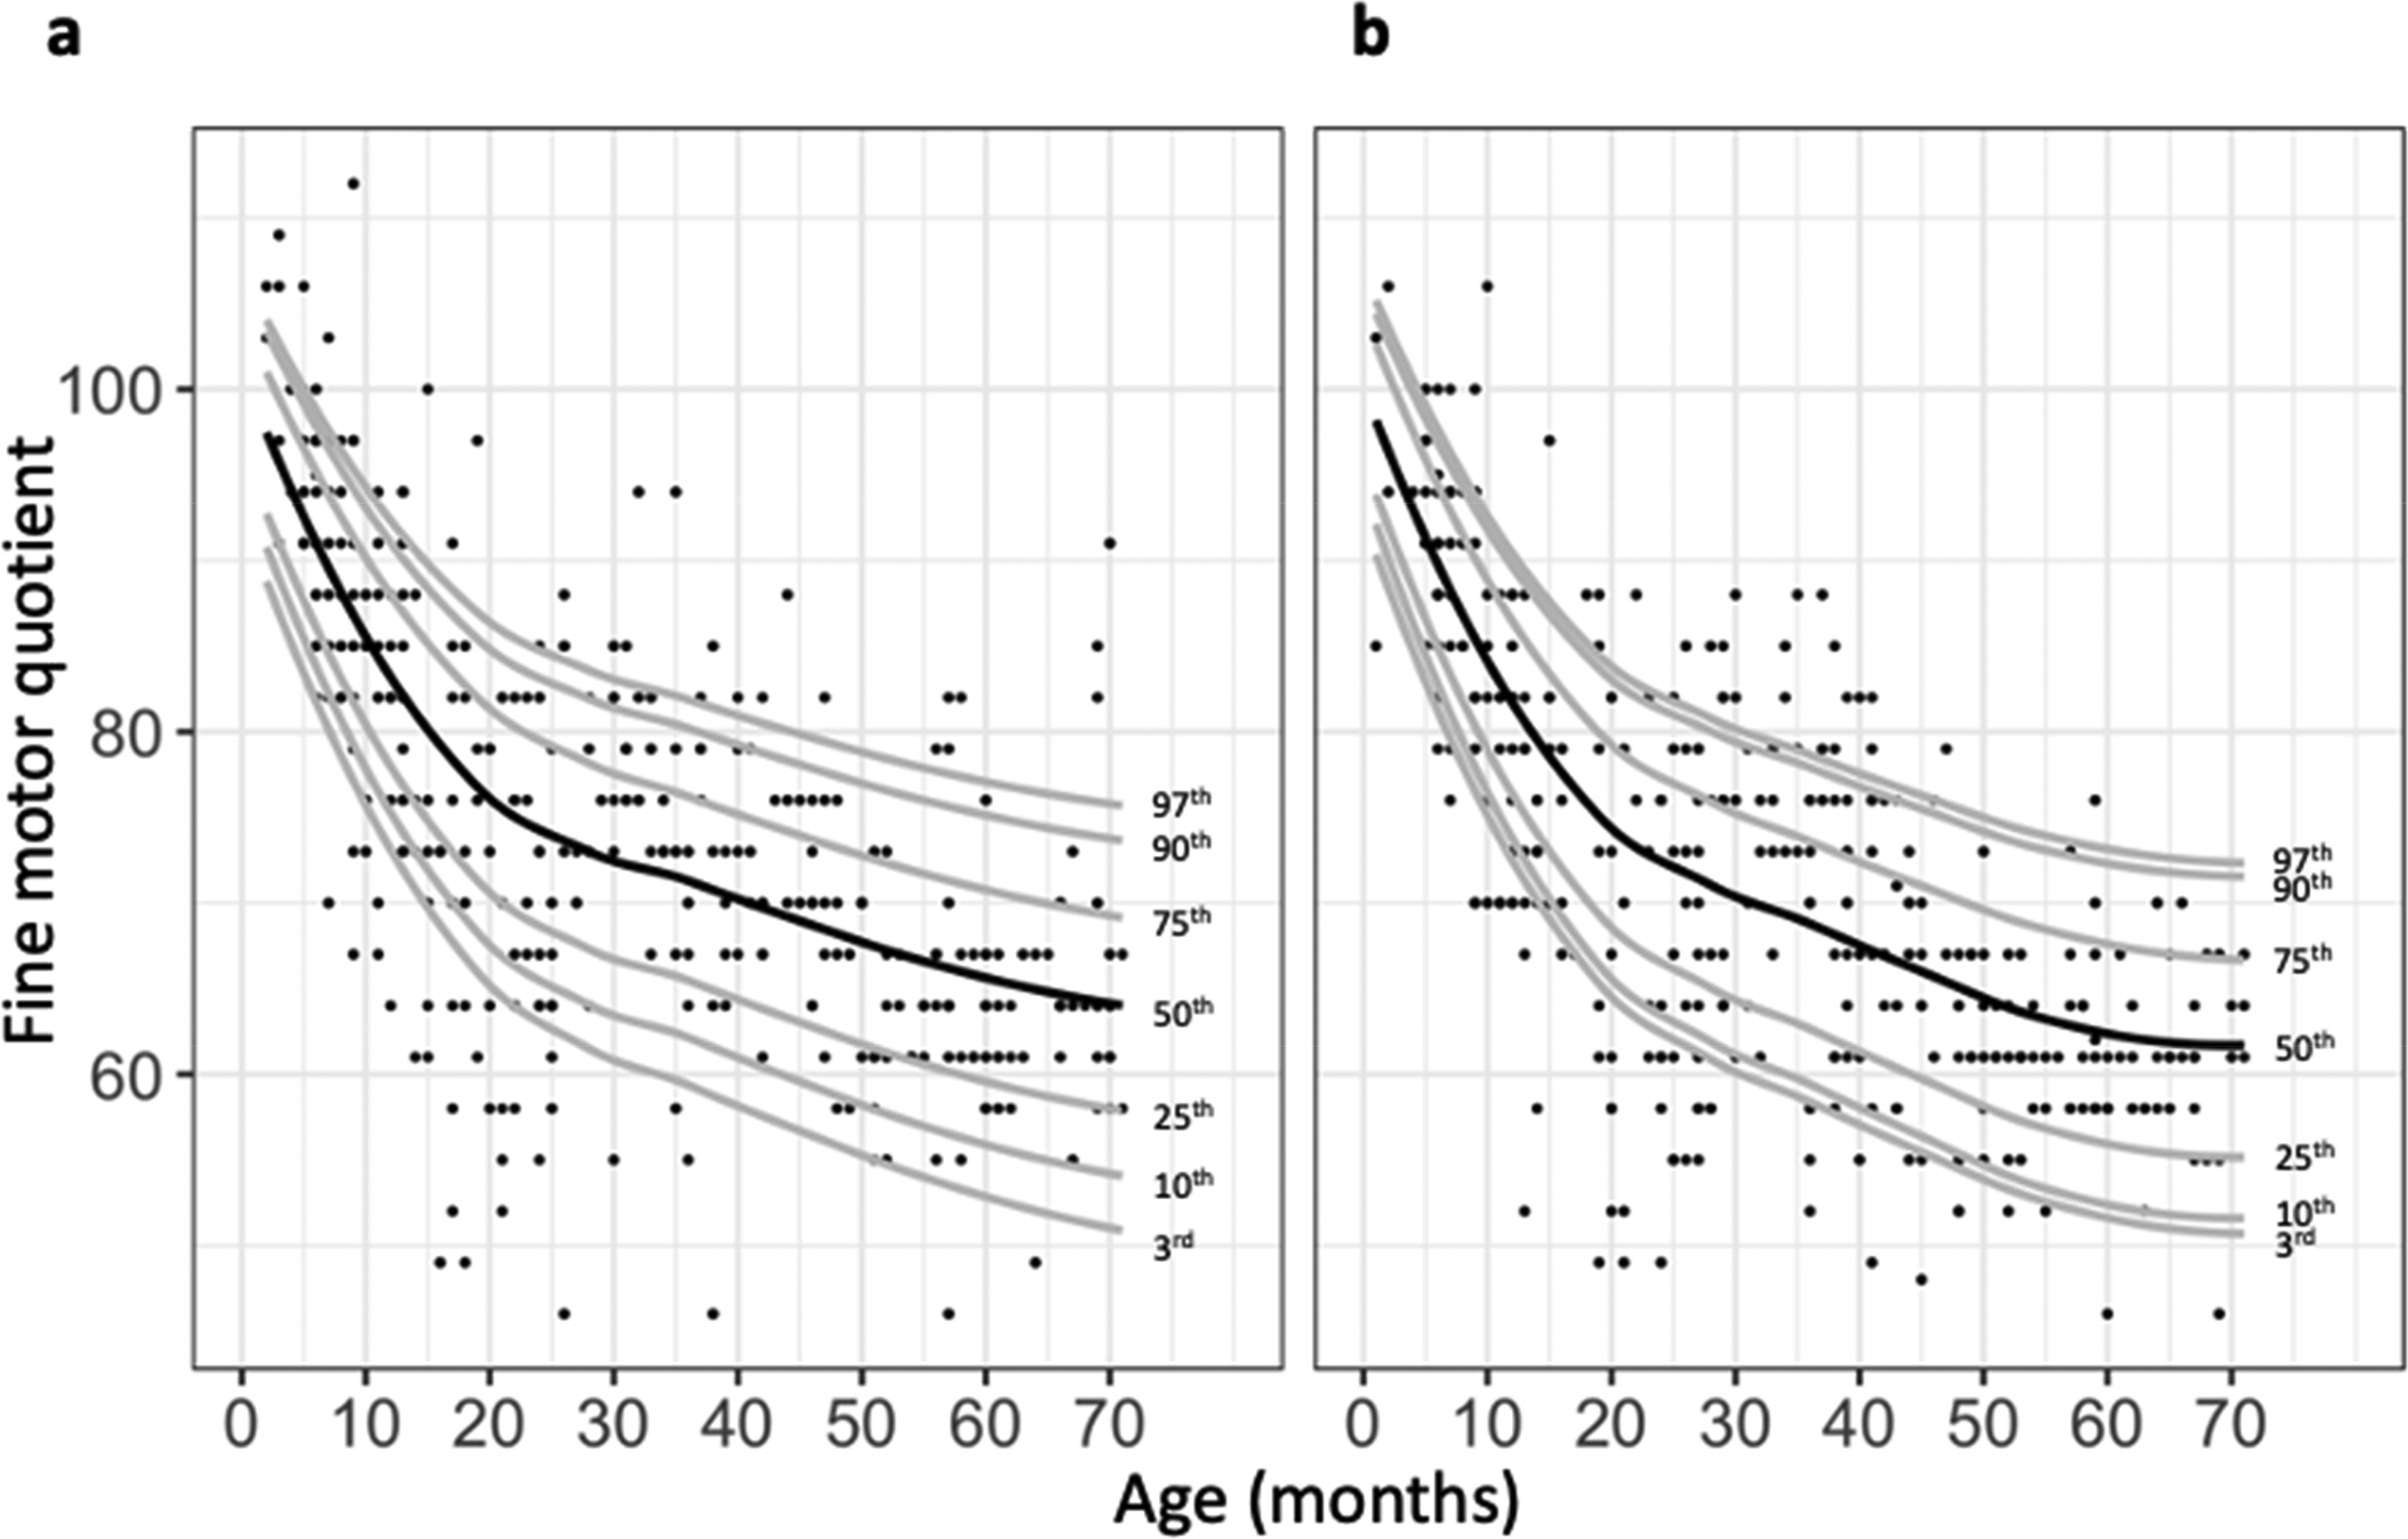
Observed fine motor quotient by age overlaid by the predicted percentiles stratified by sex among subjects with Down syndrome: females (n = 381) (left) and males (n = 400) (right).
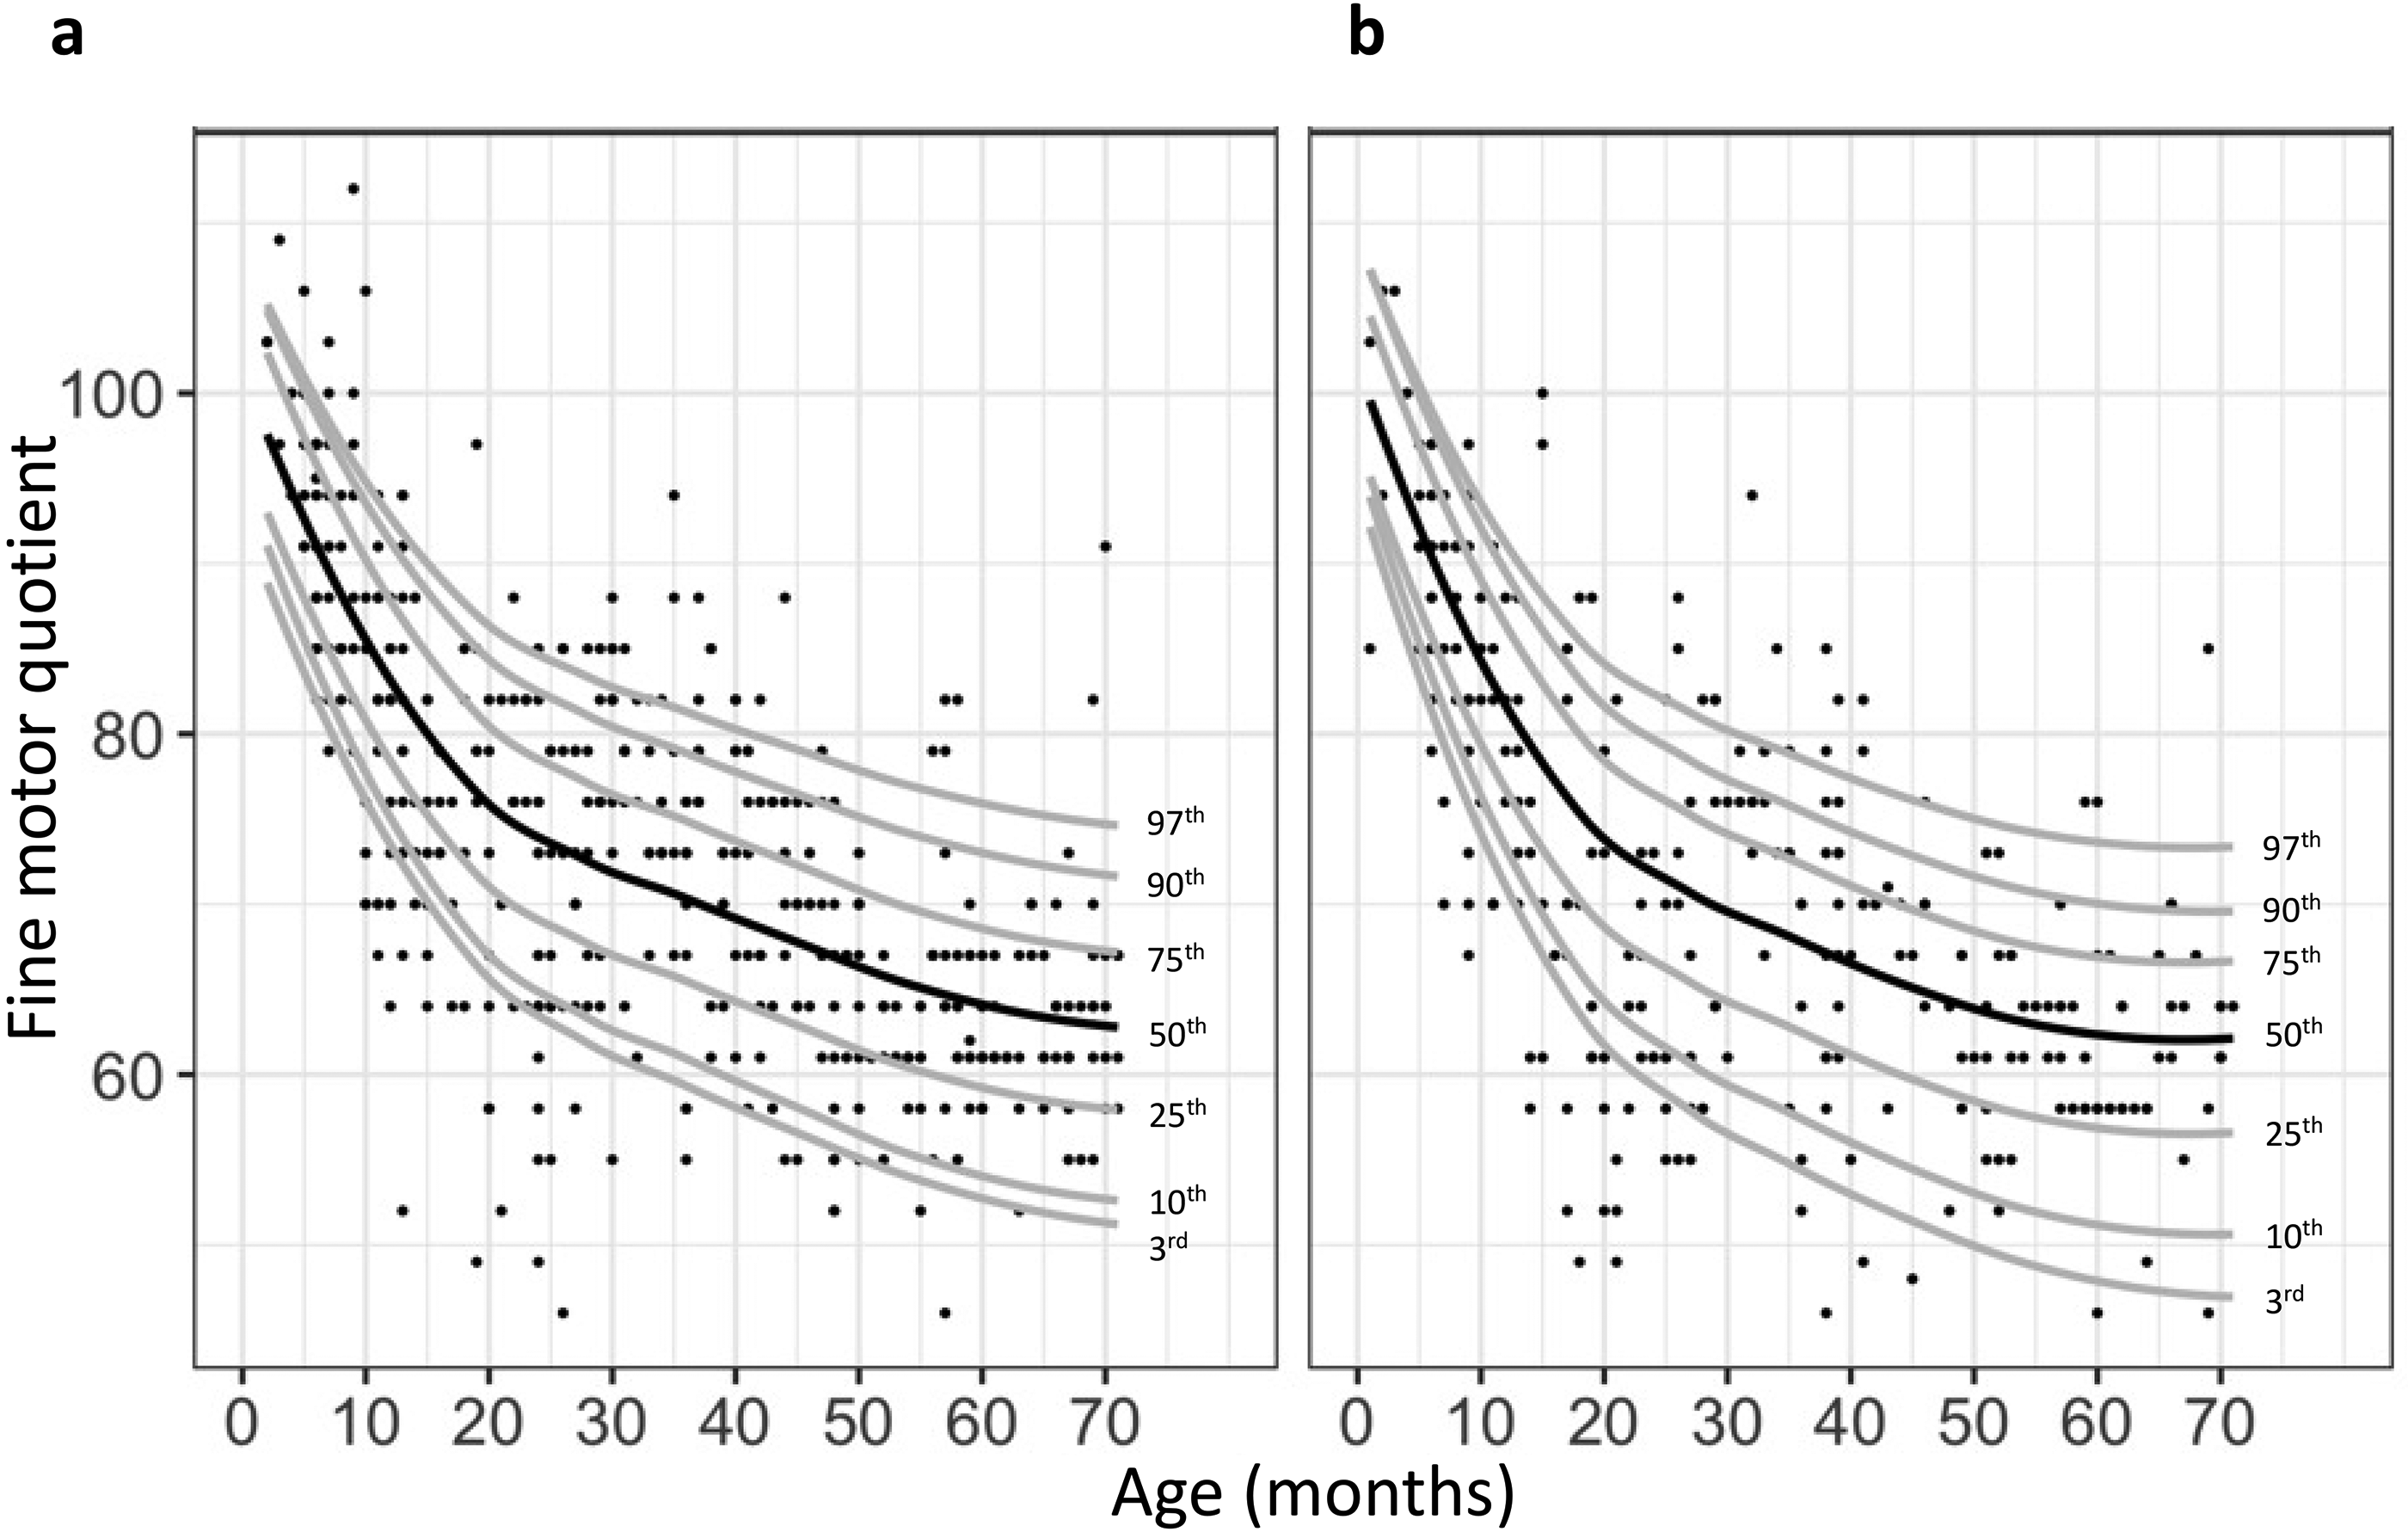
Observed fine motor quotient by age overlaid by the predicted percentiles stratified by ethnicity among children with Down syndrome: non-Hispanic (n = 468) (left) and Hispanic (n = 275) (right). That these curves were quite similar for the populations studied was well shown through graphs showing the 50th percentile for each, although some curves did reveal statistically significant differences as discussed elsewhere (Figure 10). Refer to the 50th percentile rows in Table 1 for coefficients and P values for statistical significance. Grasping raw score was significantly different over time between females and males (P value = .022), visual motor integration raw score was significantly different between females and males (P value < .001), and between Hispanic and non-Hispanic subjects (P value < .001). Fine motor quotient was significantly different over time between females and males (P value = .003).
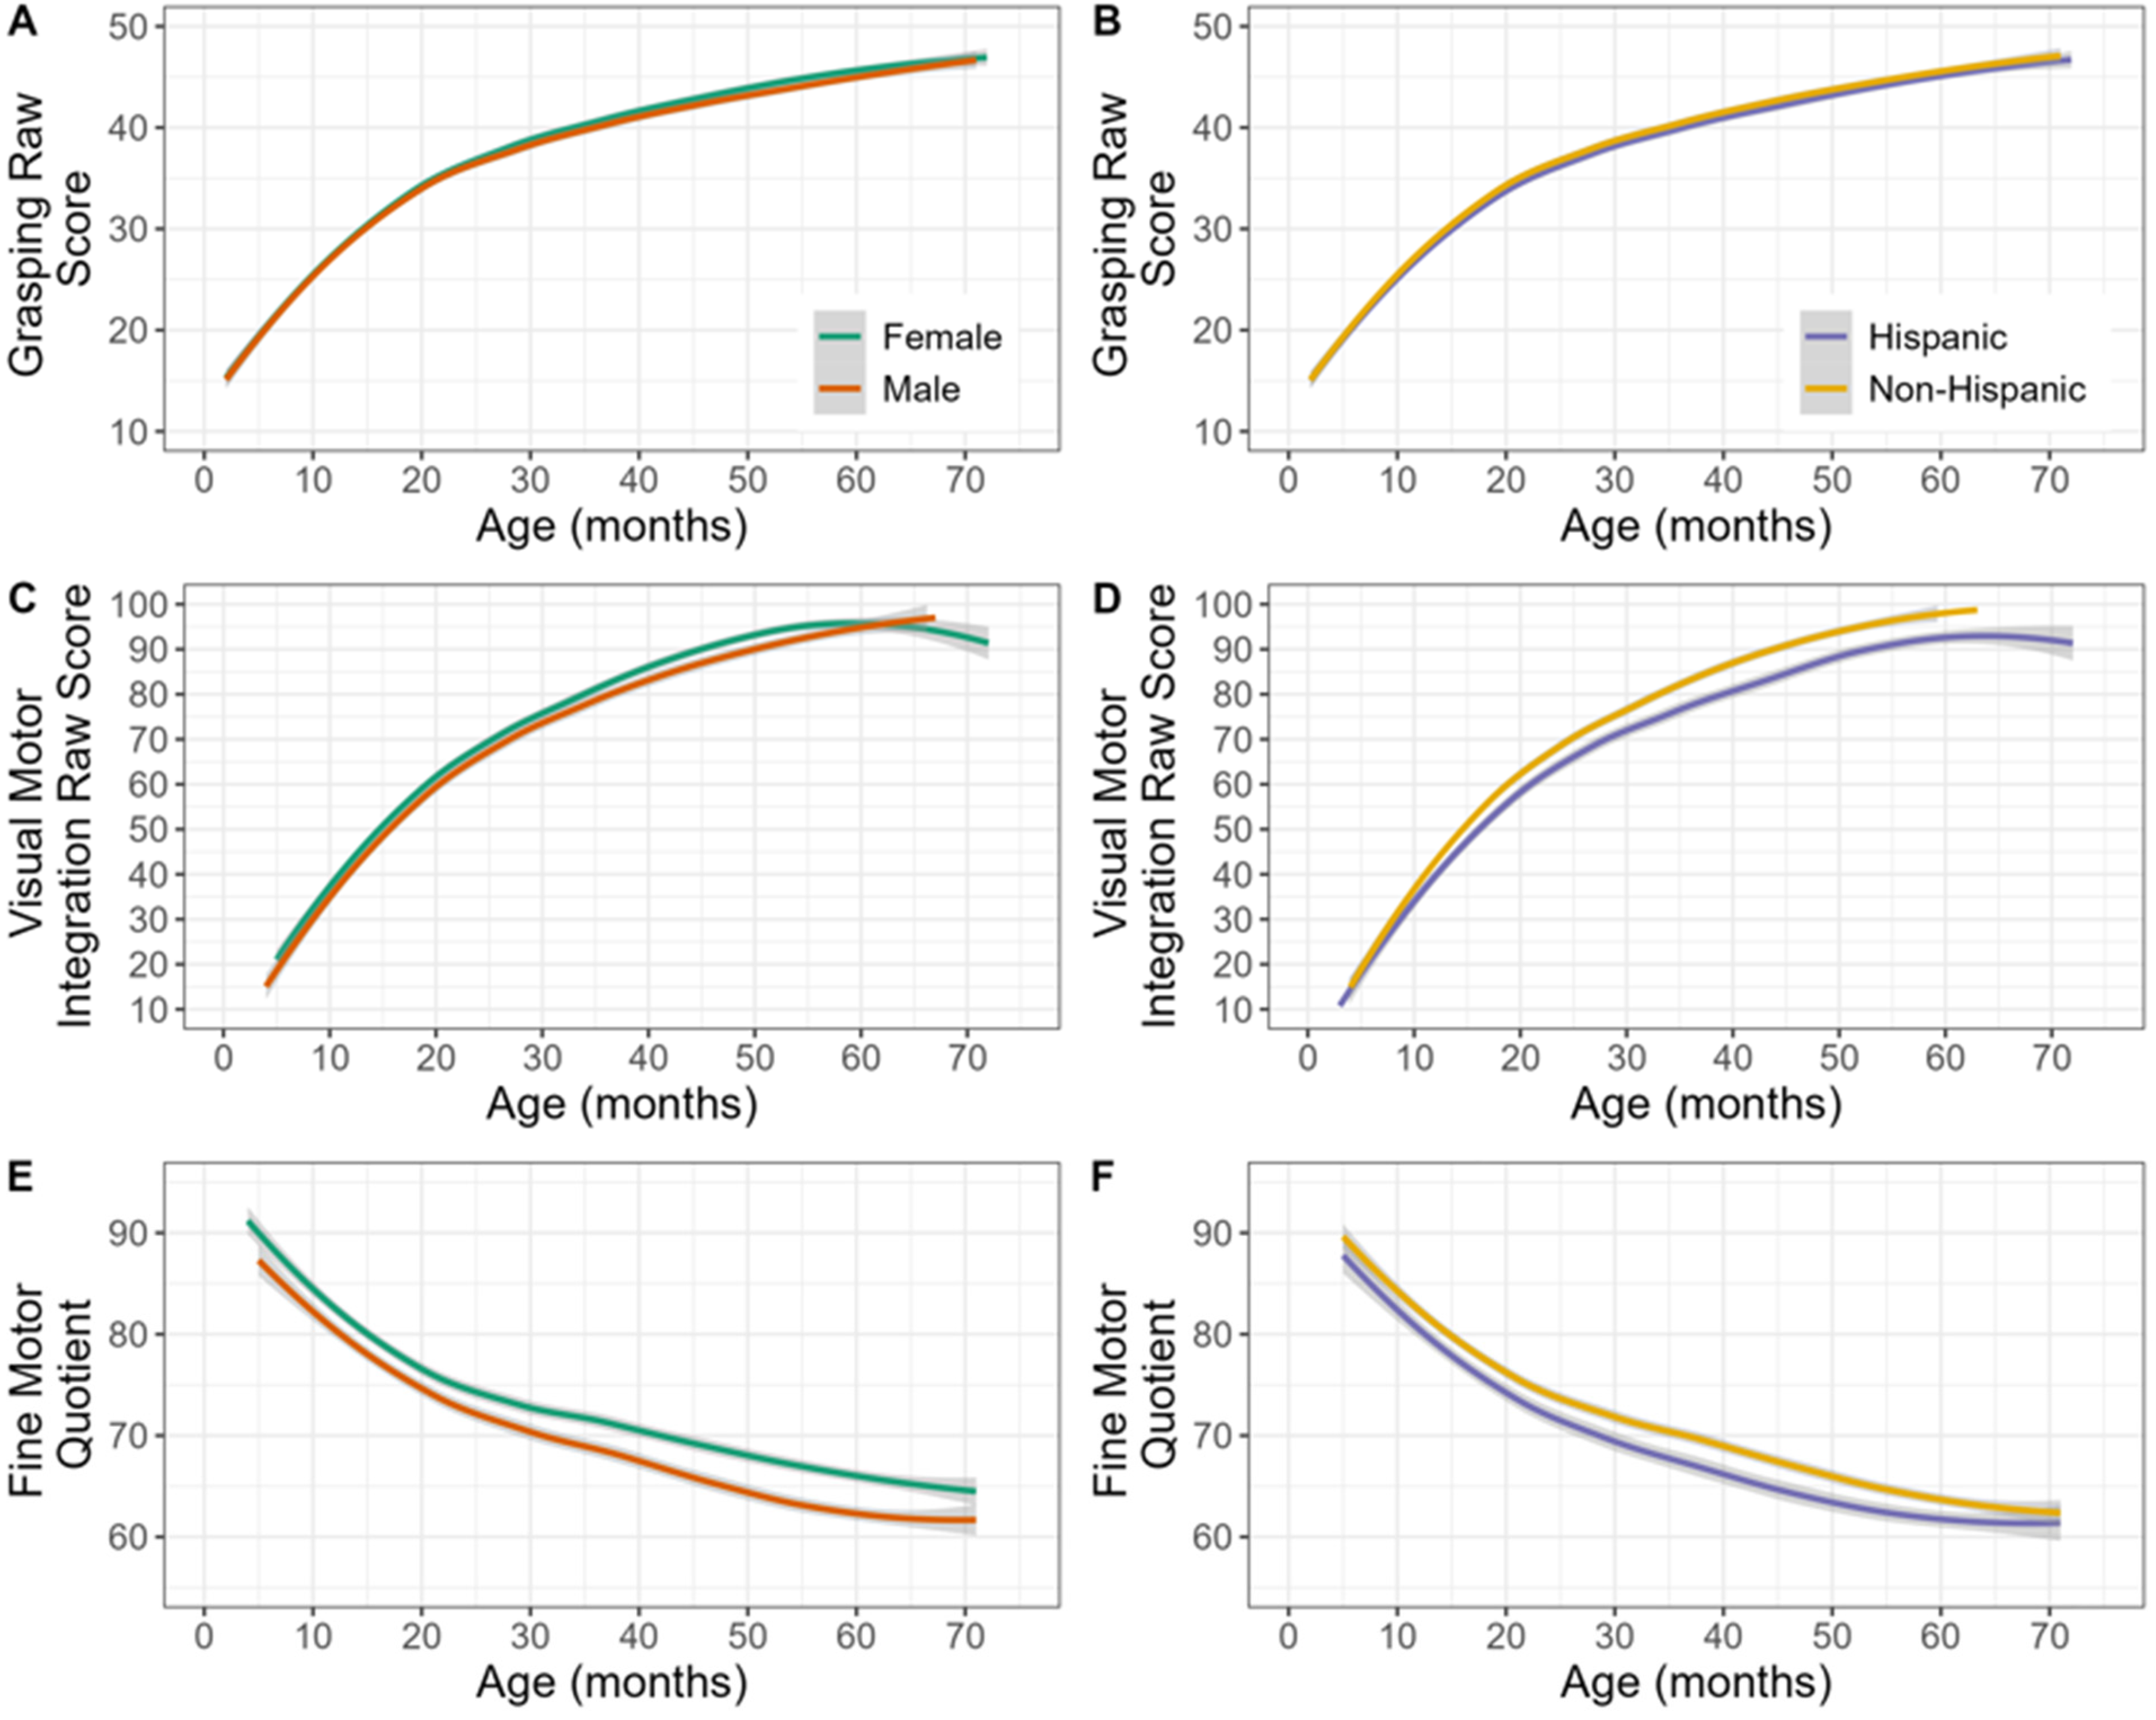
Curves comparing 50th percentile for Grasping, Visual Motor integration, and Fine Motor Quotient between female and male subjects (left panels: A, C, E) and between Hispanic and non-Hispanic subjects (right panels: B, D, F).
Discussion
In this study, we have analyzed the fine motor development of a large number of children with Down syndrome. Although previous studies have shown there to be a broad and highly variable age range for fine motor and self-care skill acquisition in children with Down syndrome, this study provides additional detail through developmental growth curves in a large Down syndrome referral clinic population. Although Palisano et al 11 developed gross motor developmental curves that are widely used in clinical practice, similar curves have not been available for the evaluation of fine motor skill development.
In our study, we use the Grasping and Visual Motor Integration subtests of the Peabody Development and Motor Scales–2nd Edition. One negative aspect of using this test is that it, like other developmental scales, reports primarily developmental quotients. Developmental quotients by nature vary further from typically developing children's performance with age. Thus, our experience in the clinic is that parents and at times health care professionals often have the mistaken impression that a decrease in a fine motor quotient indicates a loss of skills and this can be unnecessarily discouraging. We have attempted to address this by presenting raw scores in our graphs such that the expected developmental progress is readily apparent. We feel this gives a truer representation of fine motor and self-care skills than does the fine motor quotient. Our experience in the clinic has been that parents are encouraged by seeing that our study results are consistent with their usual observations that their children are making gains along their own developmental curves.
The developmental curves developed in this study will be useful to understand how a child's development compares specifically to other children with Down syndrome. Further, by providing percentiles it can be used to follow individual developmental trajectories. This type of analysis was also used by Palisano et al 11 for gross motor development using the Gross Motor Function Measure and has proven to be very useful in helping parents and physicians better understand development among children with Down syndrome. If a child's percentiles for the raw scores in the Grasping or Visual Motor Integration subtests fall from one administration to the next, it should prompt an investigation of possible co-occurring conditions that could negatively impact developmental outcomes. Examples of such conditions would include common conditions in children with Down syndrome such as autism, progressive visual or hearing impairment, cardiorespiratory decline related to congenital cardiac abnormalities, thyroid dysfunction, 23 obesity,24,25 obstructive sleep apnea, 26 and infantile spasms. 27 Changes in social and educational support should also be explored: Has the family discontinued or not started therapy services or early intervention services? Has the school program, including included therapy services, changed? Intervention for any of the above issues could be helpful and might improve subsequent developmental attainment.
In our study population we did note males tended to score lower on both Grasping and Visual Motor Integration subtests, which resulted in slightly lower Fine Motor Quotients as well. Chien and Bond reported similar sex differences on the Peabody Developmental Motor Scales–2nd Edition in a study of Taiwanese children, which they suggested warranted referring to sex-specific data. 15 They and others have suggested that some tasks in the Peabody Developmental Motor Scales–2nd Edition were easier for girls and others for boys. We feel that, although significant statistically, these differences are not so great that use of combined data would be a problem. In any case, the sex-specific charts can also be referred to if there are concerns.
Similarly, we found that Hispanic subjects tended to score lower than non-Hispanic subjects on these tests. Although additional studies would be helpful to determine the underlying factors for these differences, it is quite possible that language differences in test administration, such as requiring interpreter involvement in a large percentage of evaluations involving Hispanic subjects, could be largely responsible. It is also possible that cultural differences in play or other factors as suggested in some previous studies15–18 among Hispanic and non-Hispanic children could also result in differential performance. In spite of the small but significant differences in performance in our results, we feel that either the data from the global patient population or group-specific data will be useful when applied to multiple encounters.
Several limitations of our study are important to consider. First, this evaluation is abstract in the sense that it uses scores on tests to provide a measure of development, rather than reporting discrete milestones as has been done in smaller studies and has been more common in studies of gross motor skills. The primary reason for this approach is that fine motor milestones are, in our experience, not consistently recalled by parents or documented in primary care providers’ notes as are gross motor milestones like sitting independently, crawling or walking. This does unfortunately make the results difficult to apply to a child who has not been administered this particular test. Future studies comparing specific fine motor developmental skills with scores on the Peabody Developmental Motor Scales–2nd Edition could help make these results more useful in general. A second limitation is the potential bias of parents with more concerns about their children's development being more likely to bring them to clinic for evaluation and reevaluation. This may have led to overrepresentation of children with lower test scores. Parents who feel their children are doing well may choose not to request referral (or the primary care provider may feel referral is unnecessary) compared with those with more significant concerns.
Although we did analyze the results with relation to sex and ethnicity, we did not evaluate other potentially relevant factors such as socioeconomic status, including whether families were dealing with poverty, food insecurity, housing instability, or other family and social stressors. Although most patients in our clinic are enrolled in Early intervention services, we did not collect data on whether the children were enrolled in day care or preschool. Additional potentially important factors that future studies might consider include evaluation of the home and neighborhood environment, such as amount of screen time/television viewing, whether families have books and read to their children, and availability of age-appropriate toys and safe areas to play.
Finally, it should be noted that since this study was completed, a new version of the PDMS, the Peabody Developmental Motor Scales–3rd Edition (PDMS-3), has been published and is now available for use. 28 The PDMS-3 has more items with complex verbal instructions, and more timed items, both of which could be difficult for some children with Down syndrome, given receptive language delay and intellectual disability. In addition, the cost of purchasing the latest edition of this test could prove prohibitive in certain clinical settings. For these reasons, and given our new data, we believe it would be very reasonable to continue to use the Peabody Developmental Motor Scales–2nd Edition when assessing children with Down syndrome. In addition, although the Peabody Developmental Motor Scales–2nd Edition is only intended for use up to 6 years of age, we also feel that future studies extending its use in the Down syndrome population up to 10 years of age may be helpful because most children with Down syndrome have not approached ceiling performance. If this type of analysis is extended further to older children, it could be helpful to identify children who may be at risk as adolescents or young adults for Down syndrome regression disorder, and possibly help select patients for specific treatments. 29
Future questions that we hope to address among our clinic population include whether there is a significant effect based on the timing of initiation and the frequency and composition of early intervention and other therapy services. This may require a broader, multicenter approach, possibly even international, as in our clinic enrollment in early intervention from infancy is nearly universal.
We also believe further study of our data to specifically analyze those patients eventually diagnosed with autism will be instructive and may provide early clues to this diagnosis and could provide an opportunity to intervene with increased and more specific therapy services directed at social interaction skills. For patients with autism or other co-occurring health conditions, true skill level may be underestimated by standardized testing such that we may learn to identify which specific domains are selectively impaired as clues to the co-occurring conditions as well as opportunities to focus occupational therapy to address specific areas of weakness.
Footnotes
Ethical Approval
This study was approved by the Oregon Health & Science University Institutional Review Board (IRB00008058). A waiver of consent was granted for the collection of de-identified patient data obtained as part of routine medical care through the Down Syndrome Clinic at the associated children’s hospital.
Author Contributions
MWJ and JP conceptualized and designed the study, drafted the initial manuscript, contributed to data analysis and interpretation, and critically reviewed and revised the manuscript. MW, IK, MWJ and JP contributed to data collection. AF and TN provided statistical analysis of data, contributed to data analysis and interpretation, and critically reviewed and revised the manuscript. All authors approved the final manuscript as submitted and agree to be accountable for all aspects of the work.
Author note
Joseph D. Pinter is currently affiliated with Pediatric Neurology, Providence St. Vincent Medical Center, Portland, OR, USA.
Funding
The author(s) received no financial support for the research, authorship, and/or publication of this article.
Conflict of Interest
The authors declared no potential conflicts of interest with respect to the research, authorship, and/or publication of this article.