
Abstract
Objectives:
Local tumor progression (LTP) after percutaneous ablation of small renal cell carcinoma (RCC) is suspected when new enhancing or enlarging soft tissue appears within the ablation zone. Benign post-treatment changes can mimic this finding. This study compares the incidence and imaging characteristics of non-malignant changes (NMC) versus LTP after renal ablation.
Materials and Methods:
In this single-center, retrospective study, all patients with RCC treated with radiofrequency ablation (RFA) from February 2004 to May 2016 were identified. Post-ablation imaging reports from through May 2017 were reviewed to detect findings suspicious for LTP. Patients with suspicious findings underwent clinical, imaging, and histopathologic follow-up through May 2025 to determine the reference diagnosis. Imaging features were categorized by morphology, location within the ablation zone, and enhancement pattern.
Results:
Among 256 patients (mean age 65.6 years ± 10.8, 193 men) with 268 treated tumors, 18 tumors (6.7%) developed suspicious imaging findings. Eight tumors (3.0%) were classified as NMC and 10 tumors (3.7%) as LTP. NMC had significantly lower CT enhancement than LTP (31 vs 152 HU, P < .001). Lesions along the renal parenchymal margin were exclusively associated with LTP (9/9), whereas abnormalities at the extrarenal margin or centrally within the ablation zone were predominantly NMC (8/9). Enhancement with washout was seen only in LTP.
Conclusion:
Non-malignant post-ablation changes can mimic LTP and occur with similar frequency. Imaging features can help differentiate benign changes from local tumor progression and reduce unnecessary re-interventions.
Introduction
Percutaneous ablation is an accepted treatment for small renal cell carcinoma (RCC), particularly in older or comorbid patients who are poor surgical candidates.1,2 Ablation is effective for T1a RCC (≤4.0 cm) with 5-year disease-free survival around 95% and low rates of recurrences.3,4 Post-ablation surveillance relies on contrast-enhanced imaging to confirm complete tumor treatment and to detect either residual unablated tumor on the first post-treatment scan or local tumor progression (LTP) on subsequent exams. 5 LTP is defined as new viable tumor appearing within or along the ablation zone after at least one prior imaging study has demonstrated an absence of enhancement.6-8
LTP is suspected on imaging when new or enlarging soft tissue is identified within or around the ablative zone of coagulation with or without new associated enhancement. 9 However, benign post-treatment processes – including inflammation, fat necrosis, and granulomatous reaction – may also produce new enhancing tissue that mimics recurrent RCC.10-13 The few published reports of such mimics describe small numbers of patients and suggest that these non-malignant changes (NMC) may develop months to years after technically successful ablation and may resolve spontaneously over time. Because these findings can closely resemble LTP on imaging, misinterpretation may lead to unnecessary biopsy, repeat ablation, or surgery.
Despite the clinical importance of distinguishing benign post-treatment changes from true tumor recurrence, little is known about their relative incidence, typical imaging appearance, or distinguishing features. Existing literature is limited to case reports and small series, and no study has systematically compared NMC with true LTP in a larger cohort.
This study aims to evaluate all cases of suspected LTP after radiofrequency ablation (RFA) of RCC, determine the incidence of non-malignant mimics relative to true LTP, and identify imaging features that may help differentiate NMC from LTP.
Methods and Materials
Institutional research ethics board approval was obtained. This single-center, retrospective study included all patients who underwent percutaneous ablation of a renal mass from February 2004 to May 2016 at a large multisite academic center. This historical cohort was selected for review to ensure adequate follow-up duration for patients with presumed benign findings on imaging, since RCC is known for being indolent with late-recurrence of RCC 5 to 10 years after definitive surgery reported to be between 5% and 9%.14,15 Inclusion criteria were: biopsy-confirmed renal cell carcinoma or oncocytic neoplasm suspicious for RCC, minimum clinical follow-up of at least 12 months, and at least 2 post-ablation contrast-enhanced imaging studies (CT, MRI, or contrast-enhanced US). A minimum follow-up of 12 months was chosen to allow adequate time to both confirm successful ablation – defined as no enhancement within the ablation zone on follow-up contrast-enhanced imaging – and permit detection of any subsequent new suspicious findings. Exclusion criteria included: unknown tumor pathology, non-RCC malignancy, or benign renal disease (eg, angiomyolipoma or oncocytoma); familial/genetic RCC syndrome (eg, Von-Hippel Lindau [VHL]); ablation of RCC disease outside of kidney.
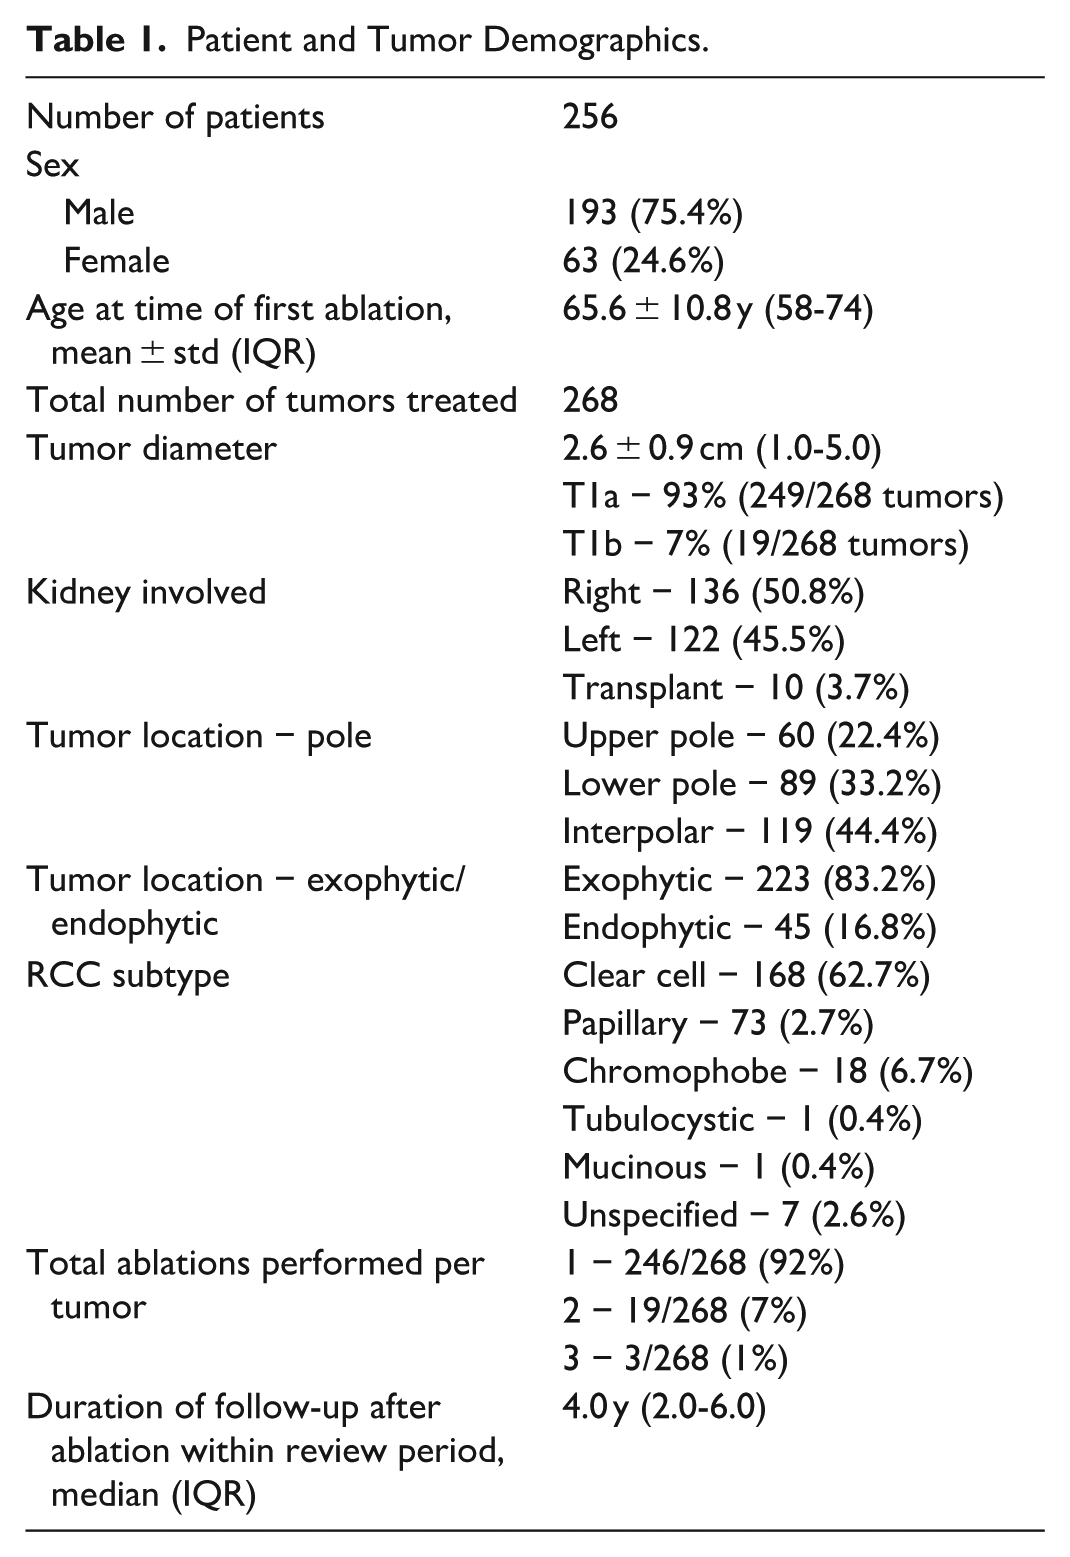
A total of 256 patients (mean age 65.6 ± 10.8 years) with 268 treated RCC tumors met study inclusion criteria (Figure 1). Table 1 outlines patient and tumor characteristics. All imaging reports were reviewed until May 2017 to identify any findings prospectively interpreted as suspicious for local tumor progression (defined below). This end date ensured a minimum of 8 years of potential subsequent follow-up for cases flagged as suspicious. This extended window was chosen because long-term series of RFA demonstrate that, although most local recurrences occur within 3 to 5 years, a proportion present later, with reported median time to recurrence of approximately 4 to 5 years and an upper interquartile range of about 70 months (~6 years).16,17 The 8-year follow up period was chosen to reduce the risk of misclassifying slowly progressive RCC as non-malignant change. For all patients with imaging findings suspicious for LTP, clinical records and all subsequent imaging studies were reviewed through May 2025 to determine long-term outcomes and establish a reference standard diagnosis.
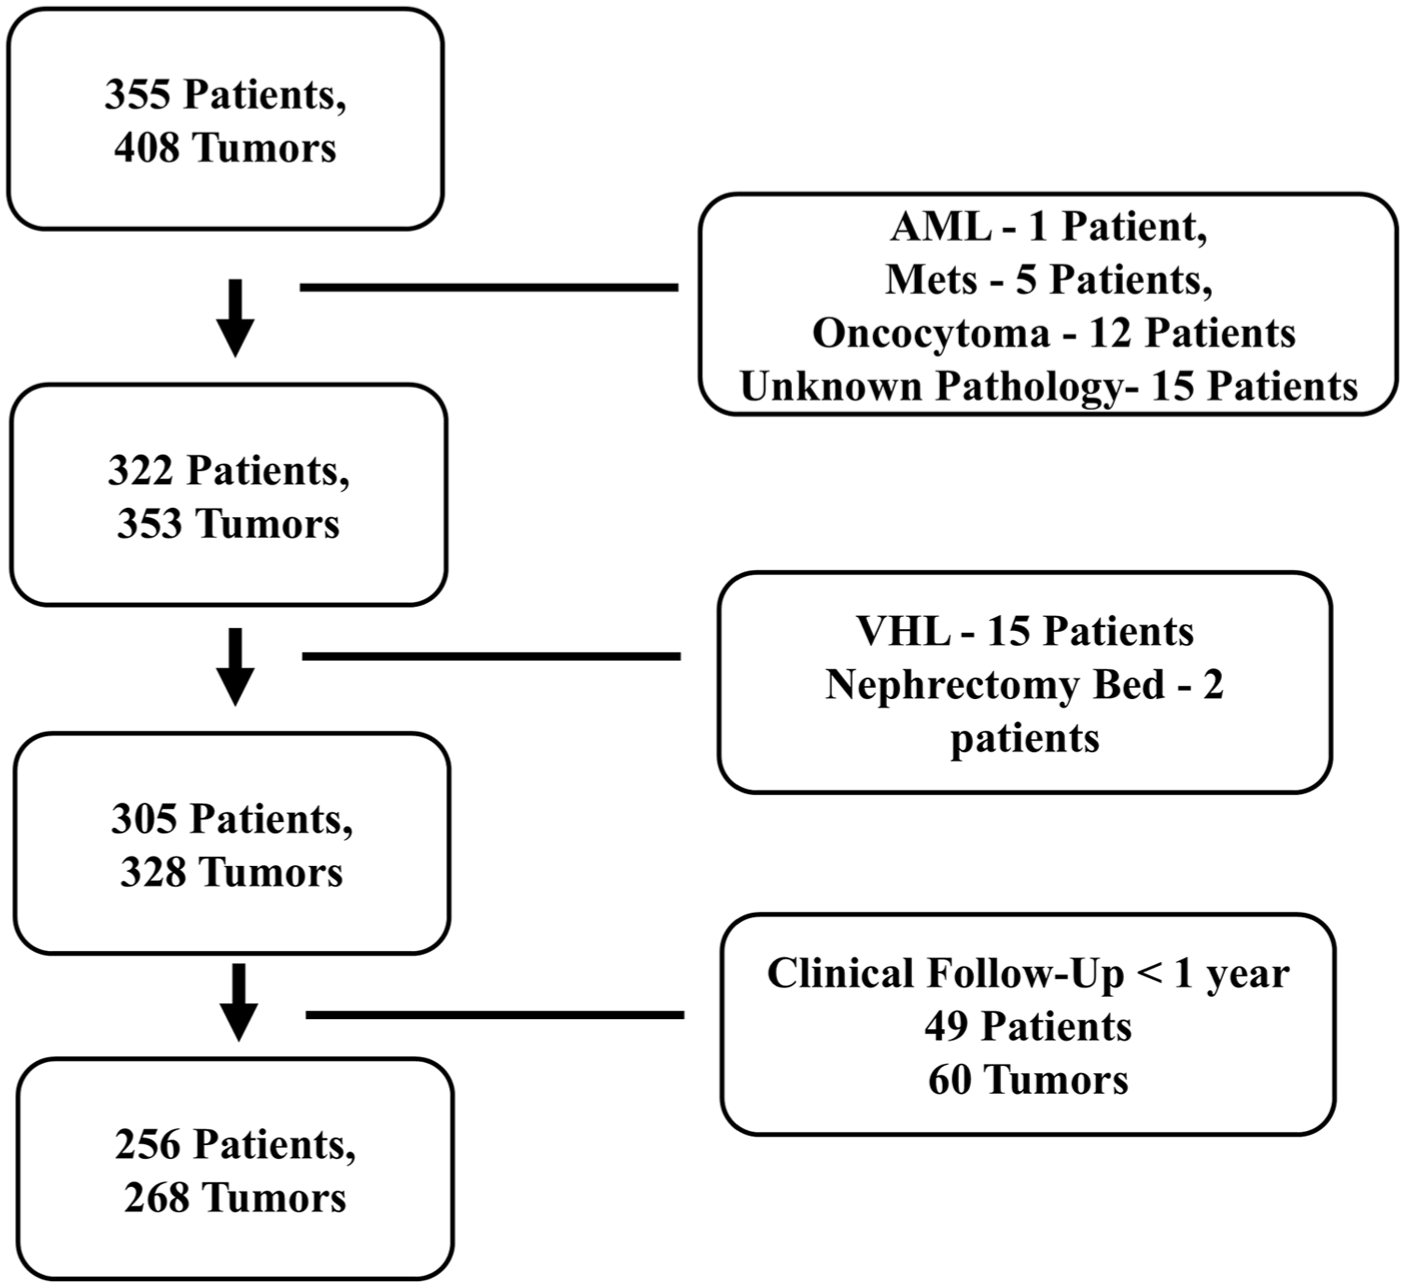
Flowchart diagram.
Patient and Tumor Demographics.
Radiofrequency Ablation Procedure
All ablation procedures were performed with percutaneous radiofrequency ablation by a single interventional radiologist with RFA experience since 1999 (JK). Ultrasound and CT guidance was used for all procedures. A multi-tined RF electrode system (LeVeen, Boston Scientific) was used for all procedures, with ablation performed to impedance-based endpoints according to the manufacturer’s protocol. Thermal protection techniques (eg, hydrodissection or pyeloperfusion) were performed as needed. No patients received concurrent or combination therapies as part of RCC management.
Post-Ablation Imaging
Post-ablation surveillance imaging was typically performed at 2, 6, and 12 months post-ablation and then annually thereafter for up to 10 years. All imaging studies had originally been evaluated by one of 13 subspecialty-trained abdominal radiologists (experience range, 3-37 years). Follow-up for all patients included multiphase contrast-enhanced imaging with one or a combination of renal mass protocol CT, MRI, or contrast-enhanced ultrasound (CEUS). CT was the preferred modality for cancer surveillance during the entire study period. MRI and CEUS were typically used if the patient had CT contrast allergy or chronic kidney disease with glomerular filtration rate <30 mL/min/1.73 m2, respectively. Follow-up exams were performed on a variety of equipment over the study period. All CT scans were performed with renal triphasic protocol composed of non-contrast, corticomedullary, and nephrographic phases (Toshiba Aquilion and Siemens SOMATOM). CT equipment ranged from 32 to 128 detector row and 0.6 to 1.0 mm slice thickness over the time period of the study. The exact acquisition timing of the triphasic protocol could not be verified retrospectively, however, the protocol specified 45- and 90-second delays for the corticomedullary and nephrographic phases, respectively, across most, if not all, study years. If iodinated contrast was contraindicated, MRI with and without IV gadolinium (Gadobutrol, Gadovist, Bayer) or contrast-enhanced ultrasound was performed. MRI was performed on 1.5 T and 3 T scanners using a standard protocol include an axial single-shot fast spin-echo sequence, an axial in-phase and out-of-phase spoiled gradient-echo sequence, a respiration-triggered fast spin-echo T2-weighted sequence, diffusion-weighted sequence, and dynamic fat-suppressed 3D fast spoiled gradient-echo images before and after contrast. Contrast-enhanced ultrasound (CEUS) exams were performed using a Phillips Affiniti ultrasound system (Phillips, USA) and Perfluten lipid microspheres (Definity, Lantheus Medical Imaging, Massachusetts). Suspicious CEUS findings were confirmed by biopsy or cross-sectional imaging. Median post-ablation follow-up time for all 256 patients within the imaging review window was 48 months (IQR 24-72).
Suspected Local Tumor Progression
LTP was defined as an enhancing or enlarging soft tissue within or immediately adjacent to the ablation region, appearing after at least one contrast-enhanced follow up study had documented satisfactory ablation. 6 All examinations initially interpreted as suspicious for LTP were reviewed by a subspecialty-trained abdominal radiologist with 13 years of experience (S.K.), who was blinded to the final clinical outcome. This reviewer characterized the imaging findings to standardize the descriptions of the suspected LTP. The reviewer did not confirm or refute the interpretation made by the original interpreting radiologist. For patients with suspected LTP who were monitored with serial imaging, the subsequent contrast-enhanced studies were also reviewed until the suspicious imaging findings resolved.
Reference standard for LTP was subsequent histologic confirmation of tumor (on biopsy or nephrectomy) or non-resolution with enlarging soft tissue. Reference standard for NMC was complete resolution on follow up imaging or absence of viable tumor on nephrectomy. New renal lesions that were clearly separate from the treated tumor and zone of ablation were not considered LTP.
Categorizing Imaging Features
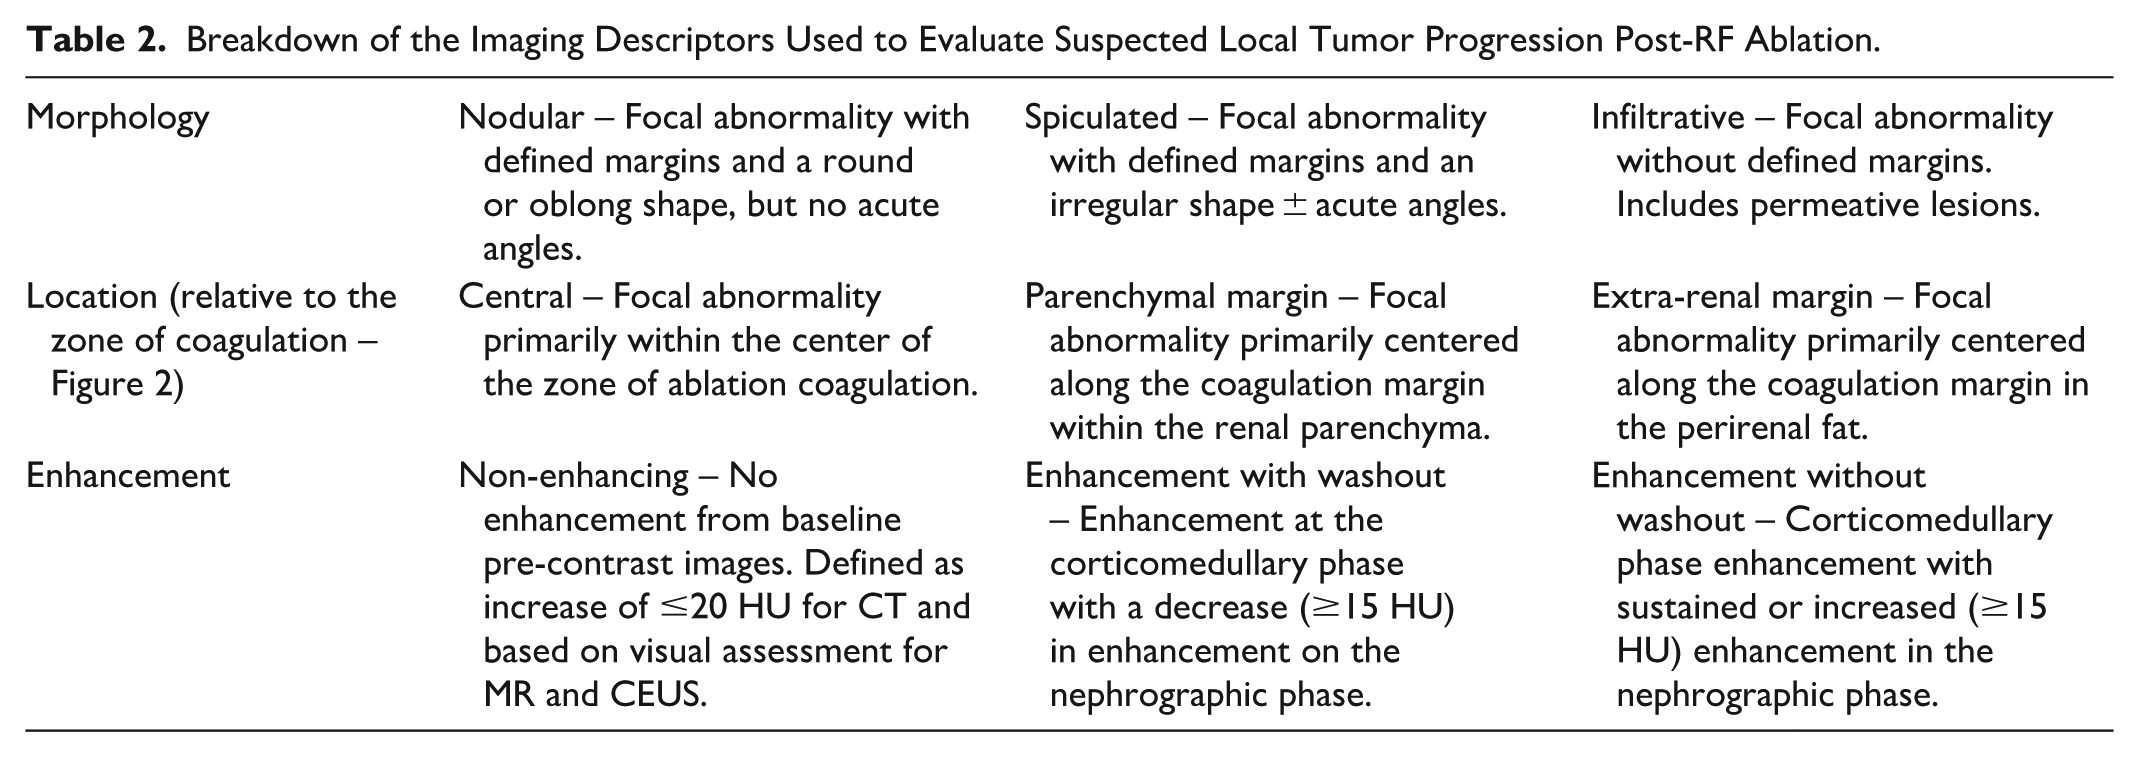
Imaging features of suspected local tumor progression were categorized according to: (1) Morphology (nodular, spiculated, infiltrative), (2) Location relative to the zone of ablative coagulation (central, extra-renal margin, parenchymal margin-Figure 2), (3) Enhancement (non-enhancing, enhancement with washout, enhancement without washout). Table 2 outlines the definitions for each category and provides examples. A focal abnormality was considered enhancing on CT if there was a ≥20 HU increase between pre-contrast and post-contrast images. For MRI and CEUS, enhancement was assessed visually.
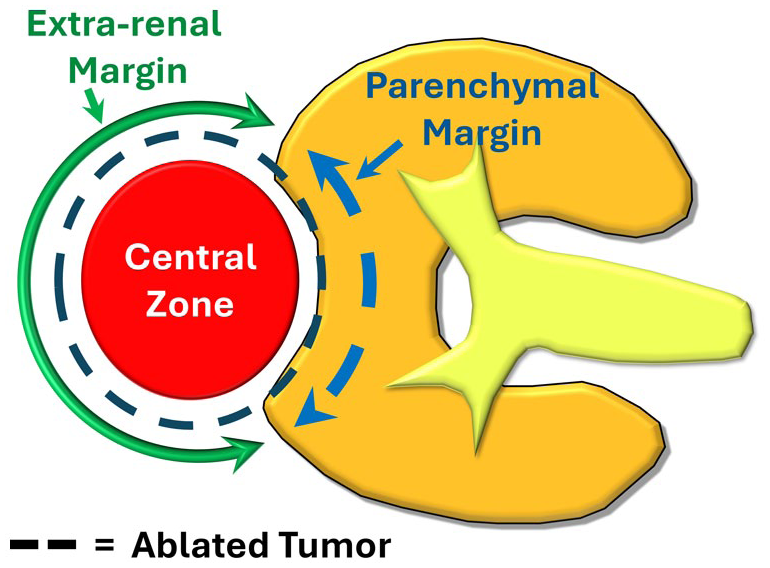
Illustration of the defined locations of possible RCC local tumor progression relative to the zone of ablation (black dashed circle). The 3 locations are: Central (red circle), Parenchymal margin (blue dashed arrow), Non-renal margin (green solid arrow).
Breakdown of the Imaging Descriptors Used to Evaluate Suspected Local Tumor Progression Post-RF Ablation.
Statistical Analysis
Demographic information between the 2 samples (eg, age, tumor diameter, ablation time, etc.) was compared between NMC and LTP groups using Fisher’s exact test for categorical variables and Mann–Whitney U tests for continuous variables. Values are reported in median and interquartile ranges (IQR).
Independent statistical review was obtained. Logistic regression was planned to identify predictors of malignant versus non-malignant outcome; however, model fitting was precluded by complete separation of key variables and a low event number. All statistical analysis was performed using SAS Studio (Cary, NC).
Results
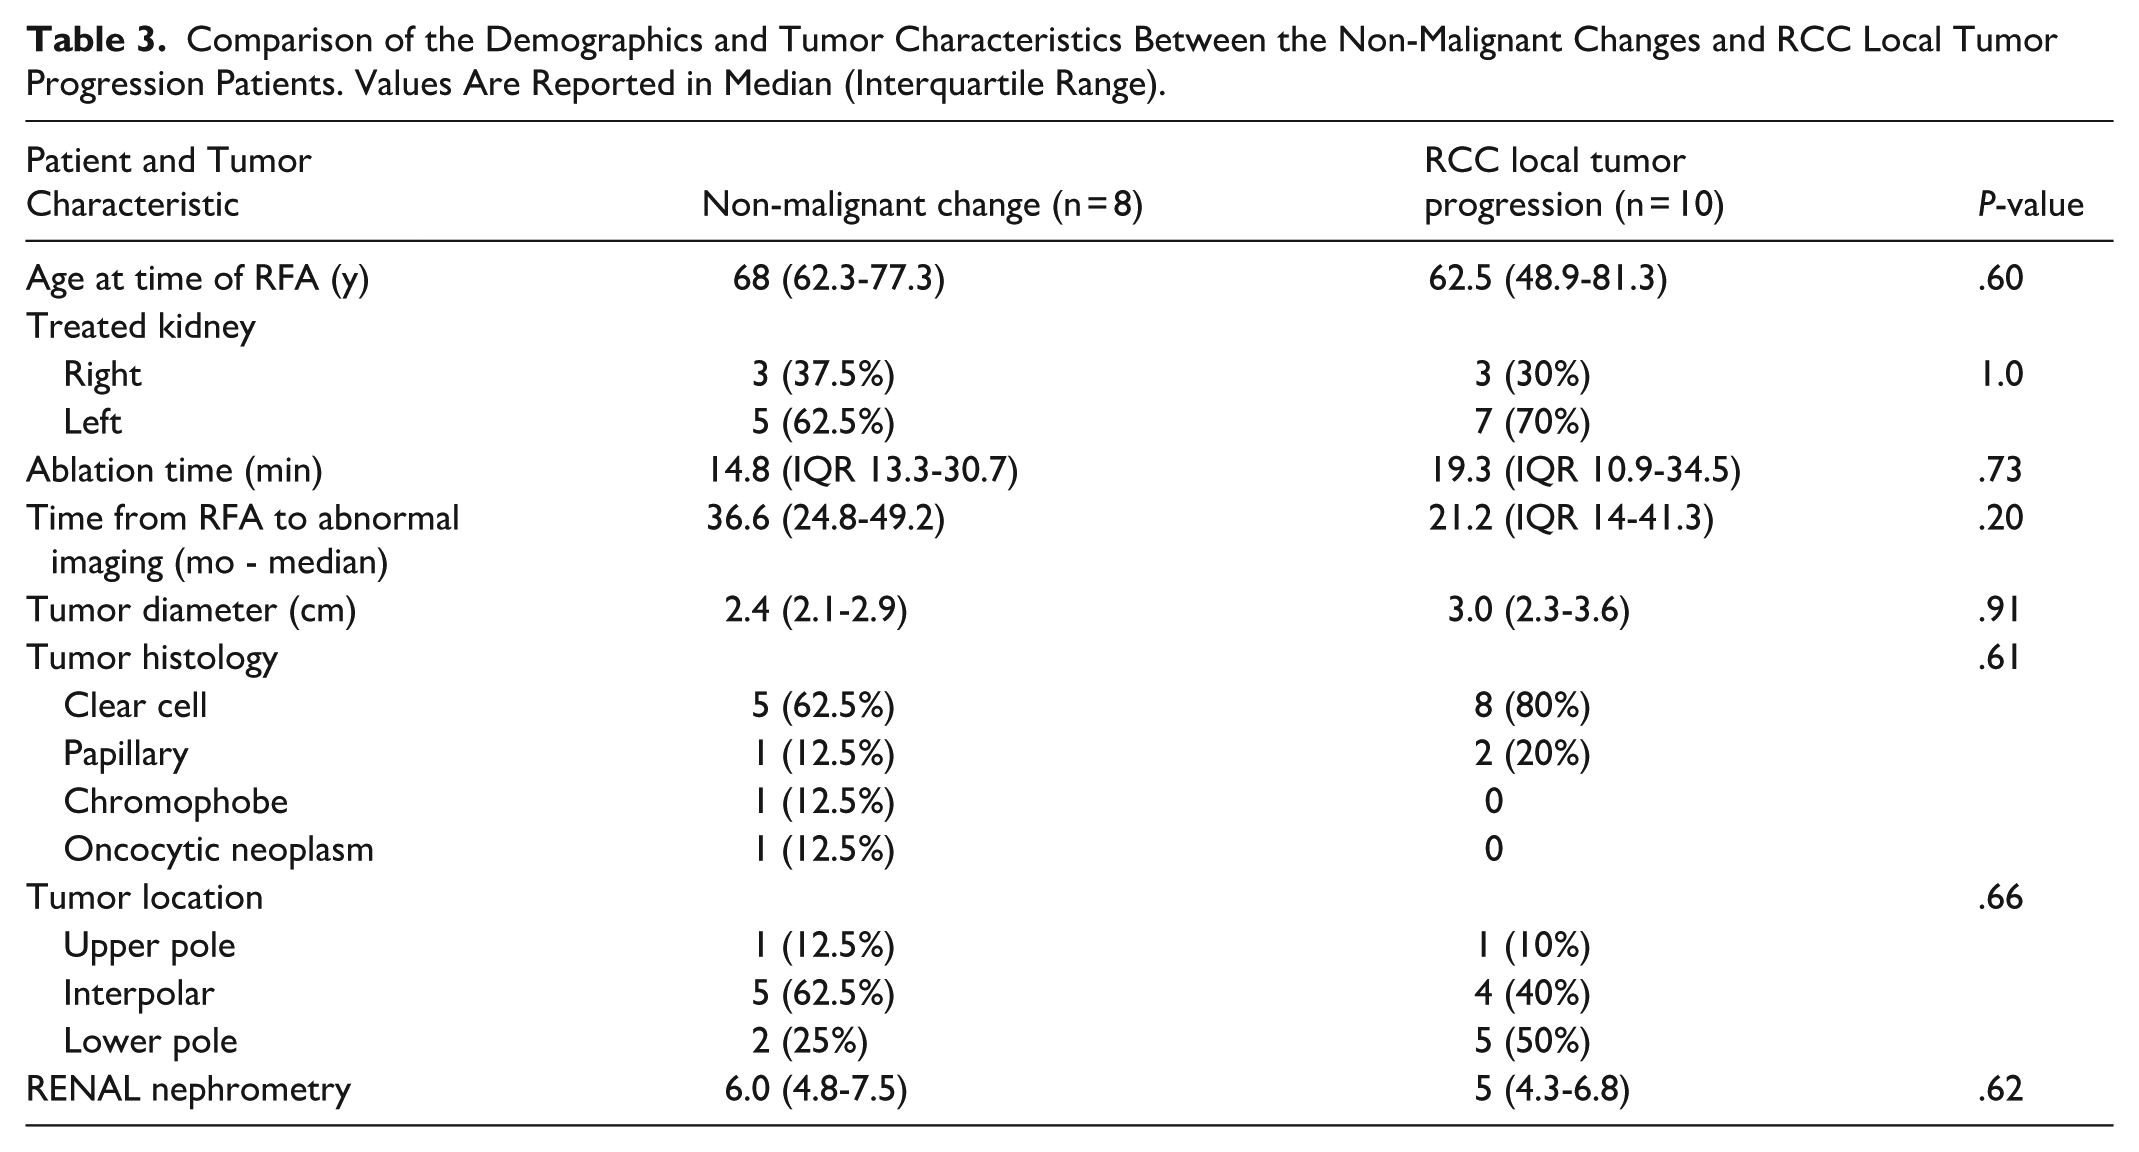
The 256 included patients (median age 65.6 ± 10.8 years, 193 men) had 268 ablated tumors (Table 1). Overall, suspicious findings were detected in 6.7% (18/268) of treated renal tumors, occurring in 17 patients and 17 unique tumors. Based on the reference standard, 3.0% (8/268 tumors) were categorized as NMC and 3.7% (10/268 tumors) were categorized as LTP (P = .20). One patient had LTP occur twice for the same tumor during the review period. The first suspicious finding occurred 16.2 months after the ablation and was treated with repeat RFA. The second LTP was found 35.3 months after the repeat RFA. For all patients, the mean follow-up time after the initial detection of a suspicious abnormality was 10.4 years (IQR 6.2-13.3). There was no significant difference in the median time from ablation to first detection of an imaging abnormality between NMC and LTP (NMC: 36.6 months, IQR 24.8-49.2; LTP: 21.2 months, IQR 14.0-41.3; P = .20). There was also no difference between the 2 groups for age at time of RF ablation, tumor size, ablation time, or RENAL nephrometry score (Table 3). For the 10 tumors with LTP, diagnosis was based on biopsy and histopathology of the renal mass in 9 tumors and on biopsy-proven RCC in new infiltrative renal soft tissue mass with adenopathy in 1 tumor. For the 8 tumors with NMC, diagnosis was based on resolution of the abnormality on follow-up imaging in 7 tumors and on nephrectomy showing no viable tumor in 1 tumor.
Comparison of the Demographics and Tumor Characteristics Between the Non-Malignant Changes and RCC Local Tumor Progression Patients. Values Are Reported in Median (Interquartile Range).
Biopsy was performed for 4 of the 8 NMC lesions. Histological evaluation of the NMC showed fibroadipose tissue (n = 1), fibroadipose tissue with necrotizing granulomatous reaction, acute and chronic inflammation (n = 1), fibroadipose tissue, florid histiocytic reaction, and fat necrosis (n = 1), and fibrosis with extensive giant cell reaction (n = 1). Among the seven patients managed conservatively, imaging abnormalities resolved between 4.5 and 23.6 months after initial identification (median 10.2 months, IQR 5.8-19.0). The eighth patient underwent partial nephrectomy for a separate RCC within the same kidney 2 months after the discovery of the non-malignant changes. Resection included the ablation zone and confirmed there was no viable tumor. Patients with NMC had a median clinical follow-up of 12.4 years (IQR 8.4-16.6) after the suspicious findings were first identified on CT or MRI. One patient developed biopsy-negative NMC at the extra-renal margin which resolved after 18 months. This patient developed biopsy-confirmed LTP 10 years later, separate from the previous site of NMC (Supplemental Figure 1).
Imaging Characteristics
Imaging characteristics for the 18 suspicious lesions are outlined in Table 4. Eleven of 18 lesions had nodular morphology (LTP − 9; NMC − 2), 6 had infiltrative morphology (LTP − 1; NMC − 5; eg, Figure 3 and Supplemental Figure 2), and 1 had spiculated morphology (NMC − 1). Nodular morphology was significantly associated with LTP (9/10 LTP vs 2/8 NMC (P = .01).
Original Tumor Pathology and Imaging Characteristics for Each Case of Suspected Local Tumor Progression on Post-RF Ablation Follow-Up.
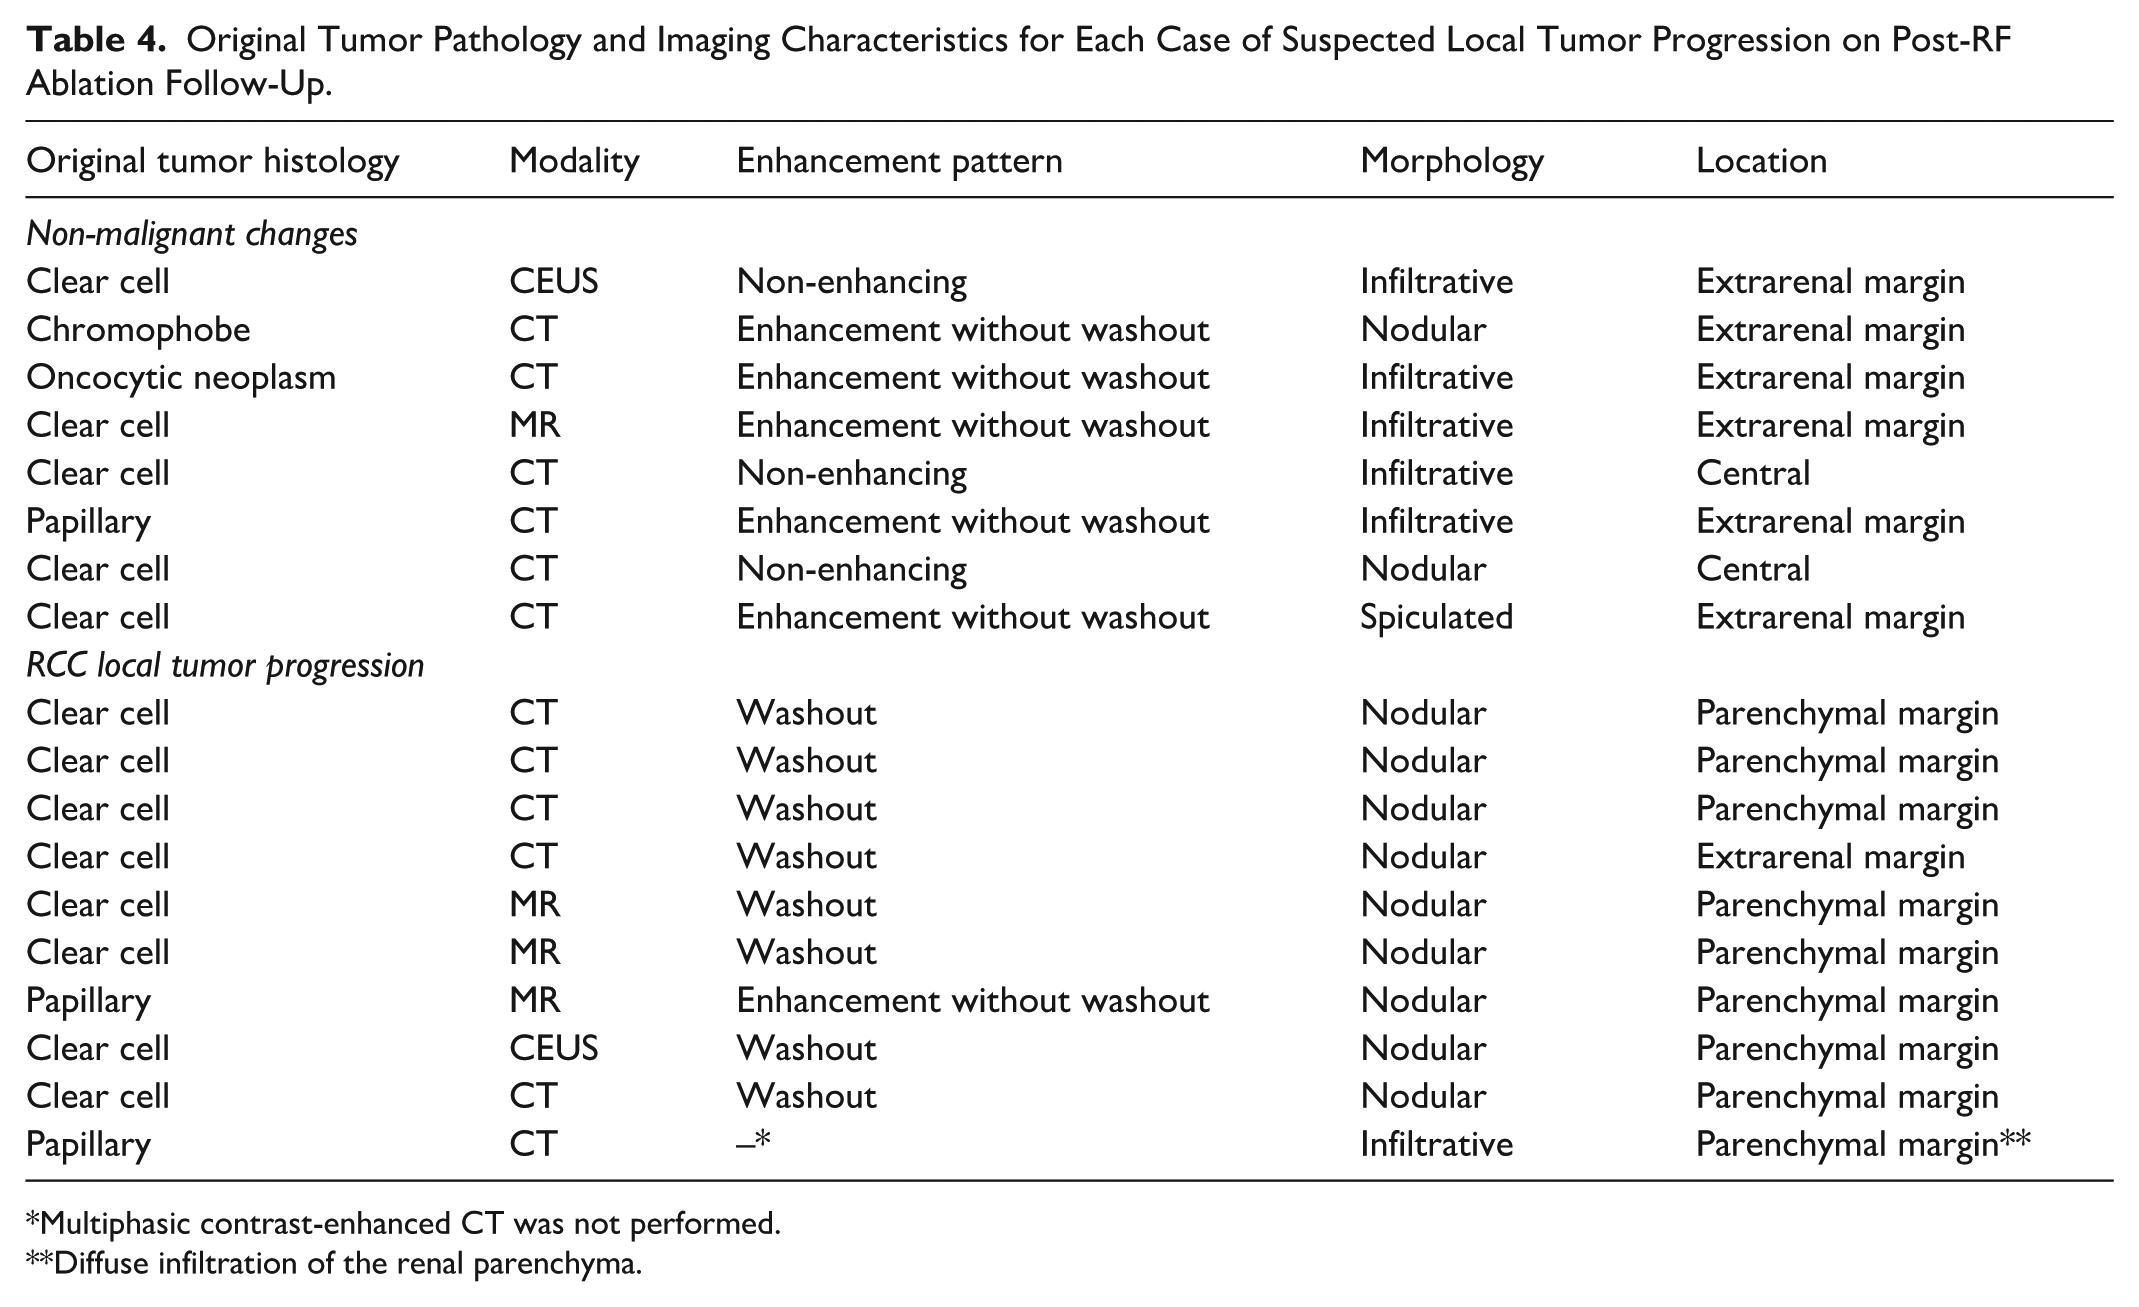
Multiphasic contrast-enhanced CT was not performed.
Diffuse infiltration of the renal parenchyma.
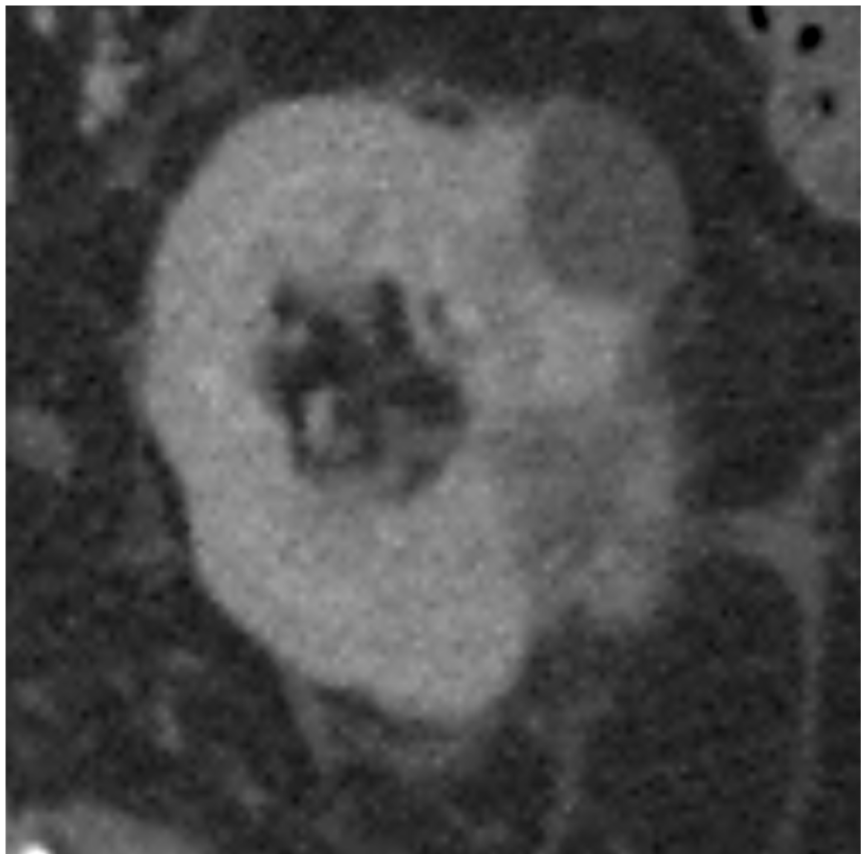
Seventy-five-year-old male 22 months post-ablation of a papillary renal cell carcinoma shows an infiltrative mass at the extrarenal margin which enhances without washout. Biopsy demonstrated fibrosis with extensive giant cell reaction without features of renal cell carcinoma.
Nine of 18 lesions were located at the renal parenchymal margin (each with confirmed LTP), 7/18 were located at the extrarenal margin (LTP − 1, NMC − 6 – Figure 4 and Supplemental Figure 1), and 2/18 were located centrally within the ablation zone (both NMC). Parenchymal margin location was significantly associated with LTP (9/9 vs 0/8; P = .01). Abnormalities at the extrarenal margin or centrally were predominantly NMC (8/9).
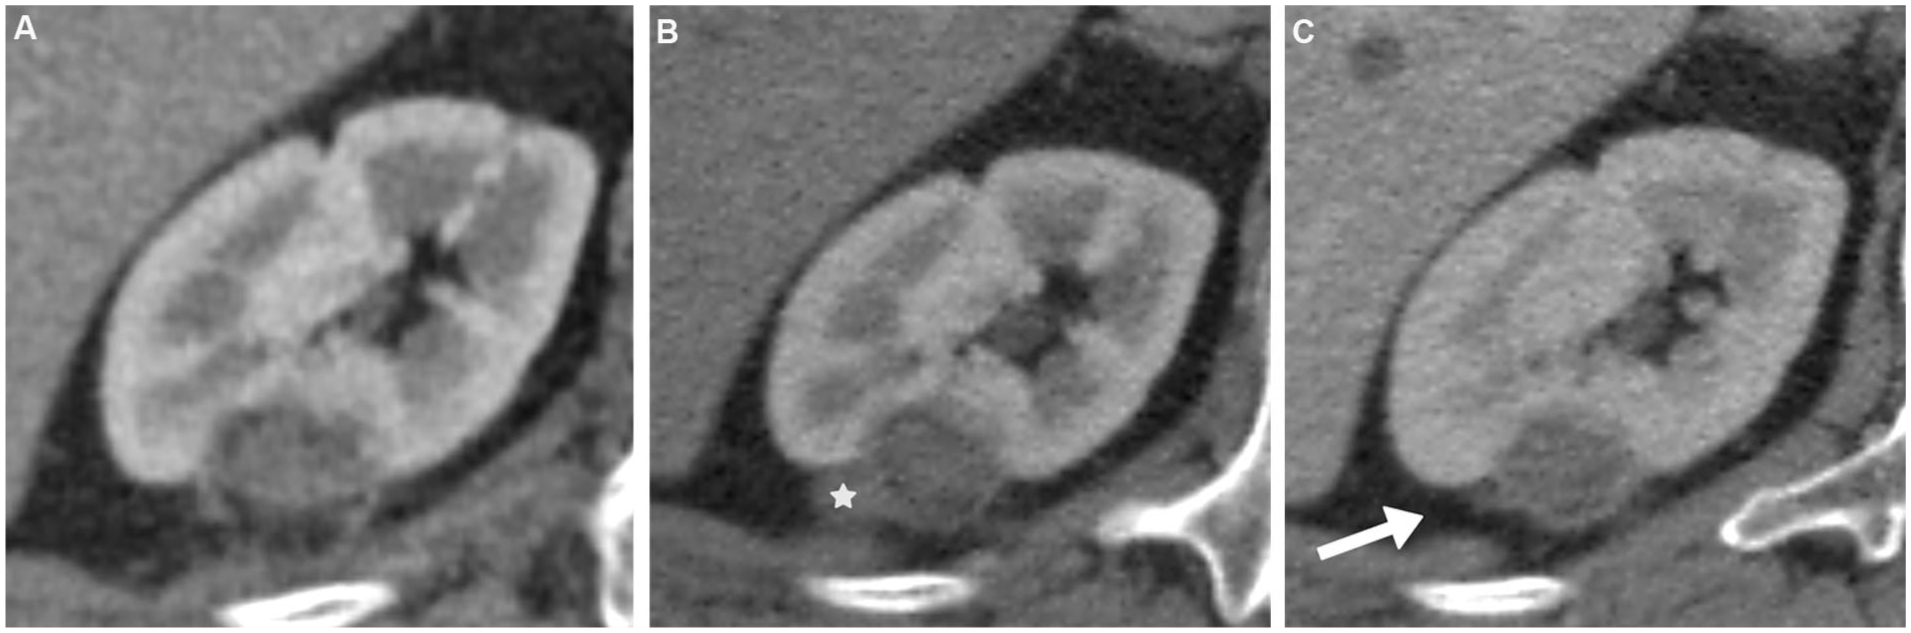
Fifty-six-year-old male underwent RFA of a chromophobe renal cell carcinoma. (A) CT 1-year post-RFA (corticomedullary phase) showed complete response. (B) 32-months post-RFA CT showed a new nodular mass at the extrarenal margin that mildly enhanced without washout and was labeled as possible RCC recurrence (white star). Surveillance was planned and (C) a CT 6 months later showed spontaneous resolution of the mass (white arrow).
One patient with confirmed LTP lacked multiphasic contrast-enhanced CT for evaluation. Unenhanced CT showed diffuse infiltration of the kidney parenchyma. Of the remaining 17 lesions with multiphasic imaging, 14/17 had enhancement (LTP − 9/9; NMC − 5/8). Two NMC patients showed new soft tissue without measurable enhancement. Washout enhancement pattern was only seen with LTP and not NMC (8/9 vs 0/8). Enhancement without washout was significantly associated with NMC (5/8 NMC vs 1/9 LTP; P = .049).
Peak CT enhancement above precontrast baseline was significantly higher in LTP than NMC (median 152 HU, IQR 102-198 vs 31 HU, IQR 18-35; P < .001).
Discussion
Imaging plays an essential role in evaluating disease response following percutaneous ablation of renal masses. Our study demonstrated that, despite complete tumor response on first post-ablation imaging after successful percutaneous ablation, later imaging may reveal new benign post-treatment changes that resemble LTP. These non-malignant changes (NMC) were not rare, occurring in 3.0% of all ablated tumors – a frequency similar to that of true LTP (3.7%). Recognition of these benign mimics is clinically important, as misclassification can lead to unnecessary biopsy, repeat ablation, or surgery.
The pathology of NMC in our cohort was found to be a combination of fat necrosis, chronic fibroadipose inflammation, and granulomatous/giant cell reaction, consistent with prior case reports on the subject.10-12 There was no significant difference in time since renal ablation between NMC and LTP patients. NMC found on imaging occurred a median of 36.6 months post-ablation (IQR 24.8-49.2), which is similar to the median of 24 months (range 10-37) reported in 7 cases of NMC from Xu et al, Durack et al, and Javadi et al.10-12 LTP occurred a median of 21.2 months post-ablation (IQR 14-41.3), which is comparable to the median time to LTP detection of 11 months (range 1-68) in Eiken et al. 18 Original tumor size and RENAL nephrometry scores were not significantly different between both groups in the current study.
The imaging appearance may help to differentiate NMC from local tumor progression. Nodular appearance of the suspicious findings was significantly associated with LTP. The location of the suspected LTP tended to favor one diagnosis over the other. In this series, all lesions along the parenchymal margin proved to be LTP, whereas central or extrarenal lesions were almost always benign NMC. These results are concordant with prior work showing that most true recurrences seem to develop along the deep or parenchymal margin. 18 The pattern of enhancement seemed to offer another discriminatory feature as washout enhancement was only seen in LTP. Contrast enhancement without washout was more typical of NMC, including in cases where the original RCC was hyperenhancing. Both features were statistically significant in comparison between groups. The maximal contrast enhancement above pre-contrast baseline for NMC was significantly lower compared to LTP (31 HU vs 152 HU; P < .001). This finding aligns with the hypervascular nature of clear cell RCC, the predominant subtype among our LTP cases. The degree of CT enhancement was only reported for 4 NMC patients in Xu et al 12 and Durack et al, 11 with a similarly low degree of enhancement demonstrated (38 HU, IQR 35-42). It is reasonable to assume that LTP might have similar enhancement patterns to the original tumor. As such, the degree of enhancement may not be as useful in differentiating NMC from LTP if the original tumor was relatively hypoenhancing, as is common for the papillary RCC subtype.
This study found that surveillance of NMC resulted in eventual resolution; typically 4.5 to 23.6 months (median 10.2 months) later. Xu et al similarly found complete resolution of the NMC imaging features 6, 8, and 18 months after initial identification. Given the indolent nature of small RCC 2 and the expected eventual imaging resolution of NMC found in these studies, if there is reasonable suspicion of NMC based on imaging features then a period of surveillance could be offered to patients instead of proceeding immediately to biopsy or repeat intervention.
This study should be interpreted in the context of its limitations, which include the retrospective design and single center experience. Given the indolent nature of most small RCC, the 3% recurrence rate may be underestimated in this study, which had a median follow-up of 4 years but required a minimum follow-up of 1 year. Furthermore, potential cases of LTP or NMC were only identified by reviewing the original radiology reports instead of reviewing the imaging from each of the >1500 post-ablation cancer follow-up studies. This may have underestimated the true frequency – particularly for NMC that seem to resolve with time. Despite being the largest reported series of NMC, the sample size of LTP and NMC was relatively small, owing to the low ~3% frequency of occurrence. Therefore, definitive characterization to separate the 2 entities on imaging cannot be made. Additionally, although all patients underwent the same multiphase renal imaging protocols post-ablation, the timing of each acquired phase and contrast volume administered may have changed during the May 2004 to May 2017 review period, which could limit the accuracy of CT enhancement characteristics quantification. Furthermore, the imaging characteristics of the possible LTP for each patient was evaluated by only one subspecialty abdominal radiologist, which did not allow for quantification of interobserver agreement. Most NMC cases were defined by imaging resolution rather than histopathology; however, the prolonged follow-up (median 11 years) reduces the risk of misclassifying indolent RCC as benign change. Finally, all percutaneous ablations were performed with radiofrequency ablation and therefore the findings may not apply to other ablation modalities, such as cryoablation; although prior reports suggest similar benign inflammatory responses may occur,11,13,19
In summary, NMC that resemble local tumor progression were observed in approximately 3% of successfully ablated renal tumors, a rate similar to that of true LTP. NMC appears to be related to chronic granulomatous inflammation and/or fat necrosis, and the suspicious imaging changes typically resolve with observation. Imaging features may help to suggest NMC over local tumor progression to avoid unnecessary interventions.
Supplemental Material
sj-jpeg-2-caj-10.1177_08465371261418513 – Supplemental material for Non-Malignant Imaging Changes Mimicking Local Tumor Progression of Renal Cell Carcinoma Following Percutaneous Ablation
Supplemental material, sj-jpeg-2-caj-10.1177_08465371261418513 for Non-Malignant Imaging Changes Mimicking Local Tumor Progression of Renal Cell Carcinoma Following Percutaneous Ablation by Derek W. Cool, Cathal N. O’Leary, Satheesh Krishna and John R. Kachura in Canadian Association of Radiologists Journal
Supplemental Material
sj-jpeg-3-caj-10.1177_08465371261418513 – Supplemental material for Non-Malignant Imaging Changes Mimicking Local Tumor Progression of Renal Cell Carcinoma Following Percutaneous Ablation
Supplemental material, sj-jpeg-3-caj-10.1177_08465371261418513 for Non-Malignant Imaging Changes Mimicking Local Tumor Progression of Renal Cell Carcinoma Following Percutaneous Ablation by Derek W. Cool, Cathal N. O’Leary, Satheesh Krishna and John R. Kachura in Canadian Association of Radiologists Journal
Supplemental Material
sj-jpeg-5-caj-10.1177_08465371261418513 – Supplemental material for Non-Malignant Imaging Changes Mimicking Local Tumor Progression of Renal Cell Carcinoma Following Percutaneous Ablation
Supplemental material, sj-jpeg-5-caj-10.1177_08465371261418513 for Non-Malignant Imaging Changes Mimicking Local Tumor Progression of Renal Cell Carcinoma Following Percutaneous Ablation by Derek W. Cool, Cathal N. O’Leary, Satheesh Krishna and John R. Kachura in Canadian Association of Radiologists Journal
Supplemental Material
sj-png-1-caj-10.1177_08465371261418513 – Supplemental material for Non-Malignant Imaging Changes Mimicking Local Tumor Progression of Renal Cell Carcinoma Following Percutaneous Ablation
Supplemental material, sj-png-1-caj-10.1177_08465371261418513 for Non-Malignant Imaging Changes Mimicking Local Tumor Progression of Renal Cell Carcinoma Following Percutaneous Ablation by Derek W. Cool, Cathal N. O’Leary, Satheesh Krishna and John R. Kachura in Canadian Association of Radiologists Journal
Supplemental Material
sj-png-4-caj-10.1177_08465371261418513 – Supplemental material for Non-Malignant Imaging Changes Mimicking Local Tumor Progression of Renal Cell Carcinoma Following Percutaneous Ablation
Supplemental material, sj-png-4-caj-10.1177_08465371261418513 for Non-Malignant Imaging Changes Mimicking Local Tumor Progression of Renal Cell Carcinoma Following Percutaneous Ablation by Derek W. Cool, Cathal N. O’Leary, Satheesh Krishna and John R. Kachura in Canadian Association of Radiologists Journal
Supplemental Material
sj-png-6-caj-10.1177_08465371261418513 – Supplemental material for Non-Malignant Imaging Changes Mimicking Local Tumor Progression of Renal Cell Carcinoma Following Percutaneous Ablation
Supplemental material, sj-png-6-caj-10.1177_08465371261418513 for Non-Malignant Imaging Changes Mimicking Local Tumor Progression of Renal Cell Carcinoma Following Percutaneous Ablation by Derek W. Cool, Cathal N. O’Leary, Satheesh Krishna and John R. Kachura in Canadian Association of Radiologists Journal
Supplemental Material
sj-png-7-caj-10.1177_08465371261418513 – Supplemental material for Non-Malignant Imaging Changes Mimicking Local Tumor Progression of Renal Cell Carcinoma Following Percutaneous Ablation
Supplemental material, sj-png-7-caj-10.1177_08465371261418513 for Non-Malignant Imaging Changes Mimicking Local Tumor Progression of Renal Cell Carcinoma Following Percutaneous Ablation by Derek W. Cool, Cathal N. O’Leary, Satheesh Krishna and John R. Kachura in Canadian Association of Radiologists Journal
Footnotes
Author Note
Institution of Reference: Toronto General Hospital, 200 Elizabeth Street, Ontario M5G 2C4.
Funding
The authors received no financial support for the research, authorship, and/or publication of this article.
Declaration of Conflicting Interests
The authors declared the following potential conflicts of interest with respect to the research, authorship, and/or publication of this article: Dr. Derek Cool - Consulting fees and research grant funding from Boston Scientific for renal cryoablation and Y-90 radioembolization; Patent license agreement with Eigen Medical for MRI-TRUS fusion prostate biopsy system (Artemis). Remaining authors do not report any conflicts of interest.
Data Availability Statement
Data generated or analyzed during the study are available from the corresponding author by request.
Supplemental Material
Supplemental material for this article is available online.