
Abstract
Introduction
Brain tumours are the most common solid cancer among children, with pediatric Low-Grade Glioma (pLGG) being the most frequent.1 -3 The advent of targeted therapies such as BRAF proto-oncogene, serine/threonine kinase (BRAF) inhibitors4,5 has improved therapeutic outcomes of pLGG, but successful treatment planning for pLGG is governed by identifying tumour type and molecular subtype.6,7 Currently, the standard of care for molecular subtype identification of pLGG is tissue diagnosis through biopsy or surgery, which carries inherent risks, and sometimes is not feasible due to a tumour’s location.8 -11
While MRI visualizes the tumour in its entirety and could represent a non-invasive alternative to biopsy for tumour classification, determining the molecular subtype of a tumour based on MRI remains a challenging task. 12 The feasibility of Machine Learning (ML) algorithms to identify genetic markers of pLGG has been demonstrated, 13 but there remain important gaps and opportunities warranting further improvement. The performance of MRI-based pLGG subtype identification pipelines in the literature is currently suboptimal and tumour location has been shown to be a significant predictor.14,15
We, therefore, aimed to establish a tumour-location—and a Convolutional Neural Network (CNN) based pipeline and a merged CNN pipeline with tumour location probability maps, and to evaluate their respective performance to identify molecular subtypes of pLGG based on MRI. The motivation for the proposed tumour-location-guided CNN algorithm was using regions outside the manual segmentation to improve the classification performance.
Materials and Methods
Dataset
The local institutional research ethics board approved this retrospective study waiving the need for informed consent. The internal dataset from The Hospital for Sick Children (Toronto, Ontario, Canada) included MR images of patients with the 2 most common molecular subtypes of pLGG, BRAF fusion and BRAF p.V600E mutation. Patients were identified using the electronic health record (EHR) database of the hospital from January 2000 to December 2018. Inclusion criteria were an age of 0 to 18 years, histopathological/molecular confirmation of BRAF gene status, and a diagnosis of BRAF fusion or BRAF p.V600E mutation. Exclusion criteria were imaging artifacts precluding assessment, absence of an axial FLAIR sequence, and a molecular diagnosis other than BRAF fusion or BRAF p.V600E mutation.
All patients underwent MRI of the brain at field strengths of 1.5 T or 3 T, using MRI scanners from various vendors (Signa, GE Healthcare; Achieva, Philips Healthcare; Magnetom Skyra, Siemens Healthineers). We only used the axial FLAIR sequence (3-5 mm slice thickness; 0-2 mm gap) in order to maximize the sample size. Segmentation of volumes of interest (VOIs) was performed by a neuroradiology fellow using a semi-automated approach on FLAIR images with the Level-Tracing-Effect tool in the 3D Slicer library (Version 4.10.2, https://www.slicer.org/). In terms of reproducibility and robustness, the semi-automatic process has been confirmed to surpass multi-user manual delineation. 16 The final VOIs were confirmed by a pediatric neuroradiology fellowship-trained and board-certified radiologist with 7 years of neuroradiology research experience.
The preprocessing pipeline included labelling, resampling, normalization, skull stripping, bias correction, and registration to the SRI24 17 atlas for each image volume. SRI24 is an MRI atlas based on normal adult human brain anatomy, which is a well-known option for preprocessing brain MRI. 18 It should be highlighted that registration is a key step in the preprocessing pipeline. Without proper registration, tumour location may become imprecise, and thus, not useful for the pLGG molecular diagnosis.
Location-Based Analysis
The proposed location-based pipeline only uses the manual segmentation mask of pLGG tumours, ignoring the rest of the images. In contrast to previous work where tumour location was used as a binary variable,13,19 we used tumour location probability density functions (PDF) to achieve voxel-level granularity. Tumour location PDFs of BRAF p.V600E mutation and BRAF fusion were defined through summing and normalizing the 3D binary (manual) segmentation masks in FLAIR images for each class in the development dataset (ie, the union of training and validation datasets). In the test cohort, the probabilities of belonging to each class
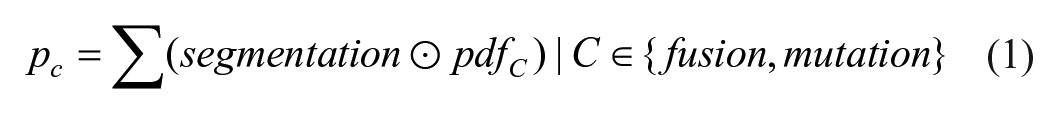
To facilitate Receiver Operating Characteristic Curve (ROC) analysis and address the issue where the sum of probabilities for fusion and mutation classes does not equal one, equation (2) was utilized to calculate predicted probabilities for each patient.
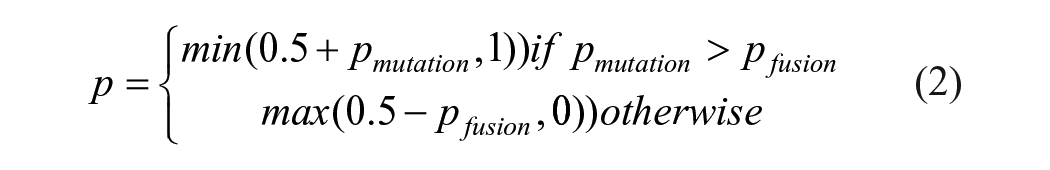
Figure 1 illustrates the projections of the PDFs in axial, coronal, and sagittal planes. We repeated the data split (80/20 for validation and test) 100 times and calculated the Area Under the ROC (AUROC) for each run.
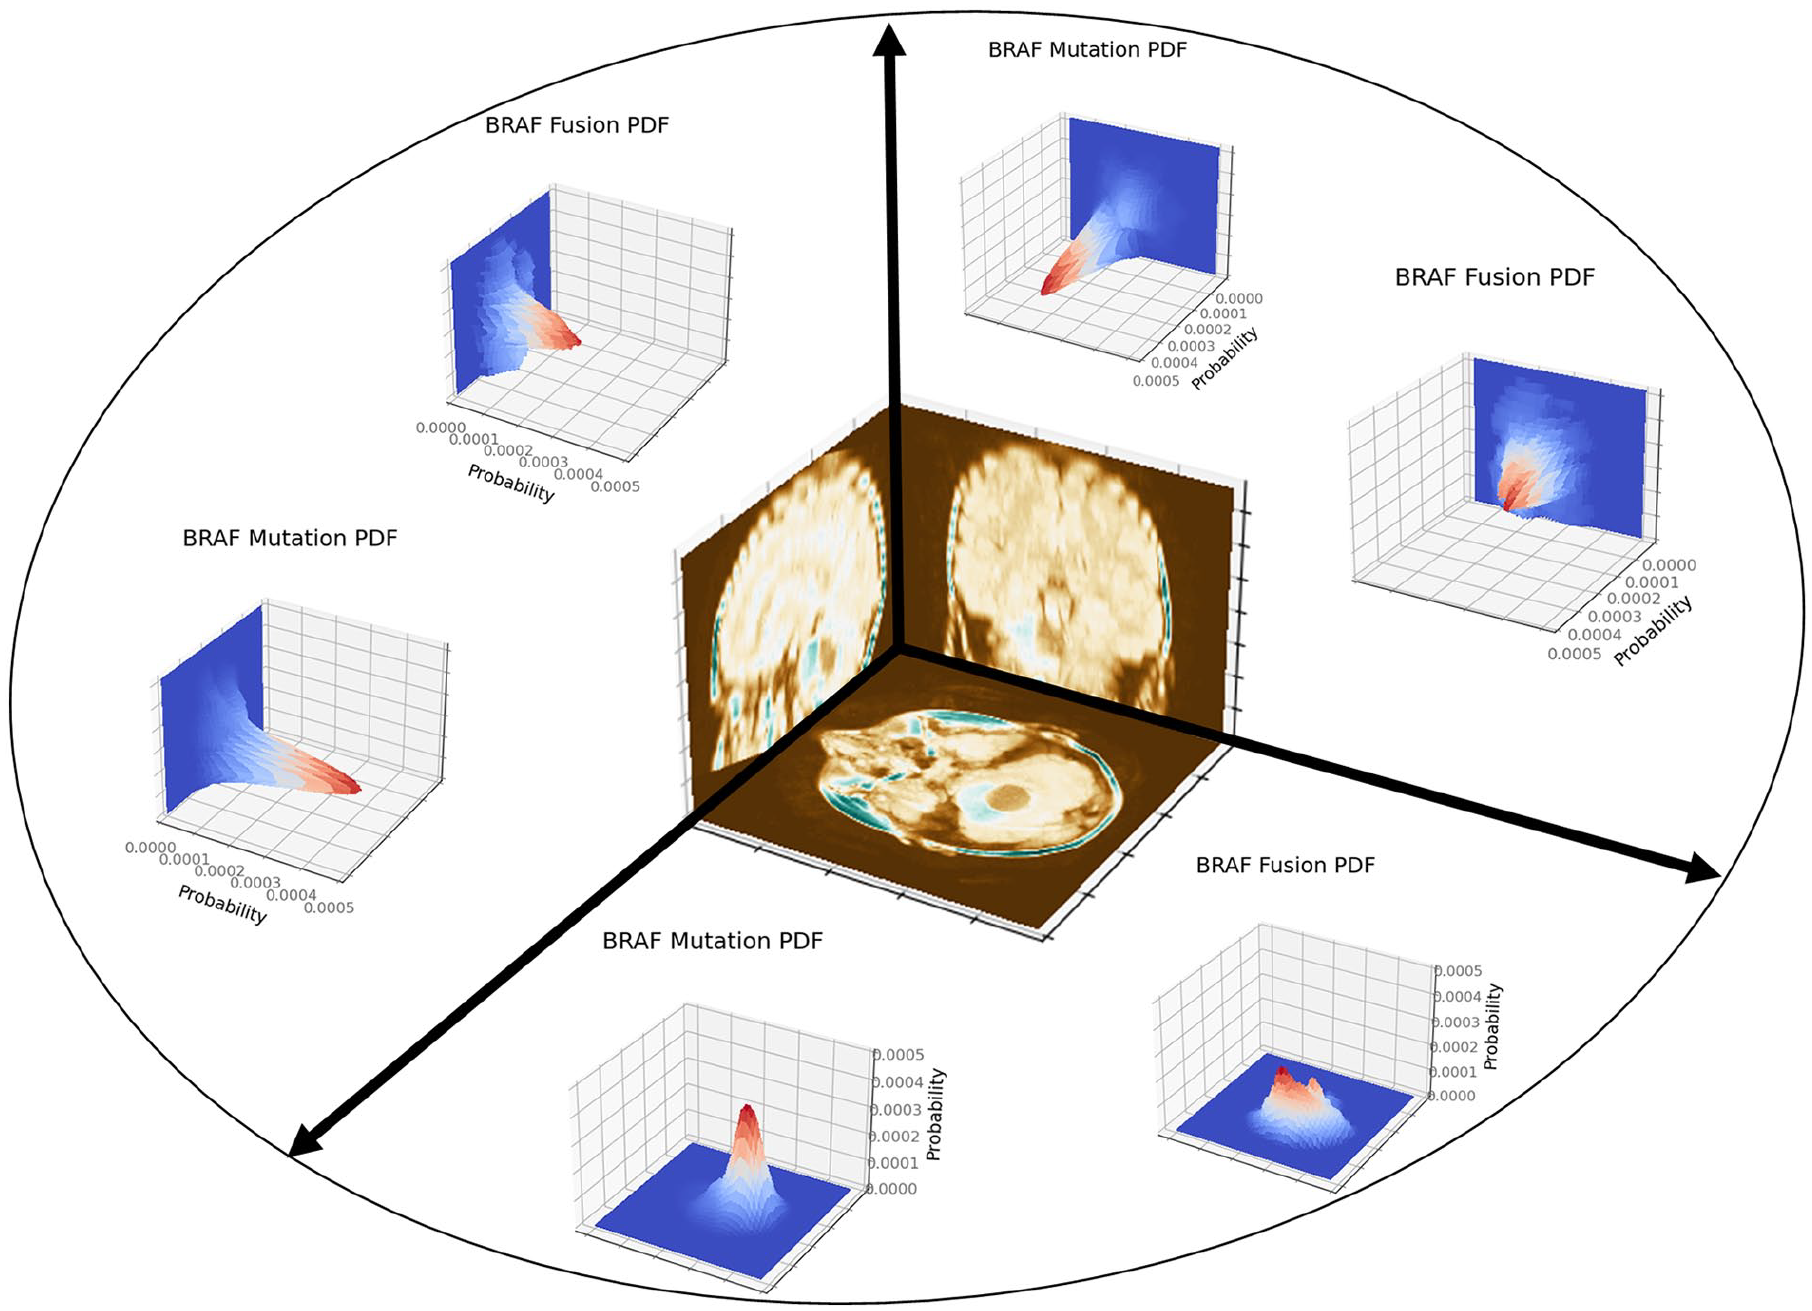
Projections of the tumour location PDFs in axial, coronal, and sagittal planes.
CNN-Based Analysis
We used off-the-shelf CNN models such as 3D ResNet, 20 as well as an in-house developed shallow CNN architecture described in Appendix A. The codes for defining the models, deriving PDFs and conducting location-based classification are publicly available (https://github.com/IMICSLab/TumorLocationPDF). The input to the CNNs were VOIs formed through element-wise multiplication of the manual segmentations and images. To train the models, we chose a batch size of 8, maximum number of epochs of 10, learning rate of 0.1, Cross Entropy (CE) as the loss function, and stochastic gradient descent (SGD) 21 as the optimizer. The models were implemented using PyTorch 1.10.2, in a Python 3.9.7 environment with cuda 11.3. We utilized 2 GeForce RTX 3090 Ti GPUs on a Lambda Vector GPU workstation.
Tumour-Location-Guided CNN Analysis
The motivation behind the proposed CNN algorithm, guided by tumour location, was to enhance classification accuracy by utilizing areas beyond the manually segmented regions. In contrast to the CNN-based pipeline where VOIs were created through element-wise multiplication of manual segmentations and images, 2 revisions were applied to design the tumour-location-guided CNN: (a) when multiplied by the image, an offset scalar was added to the binary segmentation mask to avoid eliminating the image areas where the mask elements are zero, (b) the 2 PDFs were weighted based on their probability for a given image (
In the tumour-location-guided CNN algorithm, the location PDFs are applied to each image according to equation (3), where offset is a scalar to help retain regions outside of the segmentation.
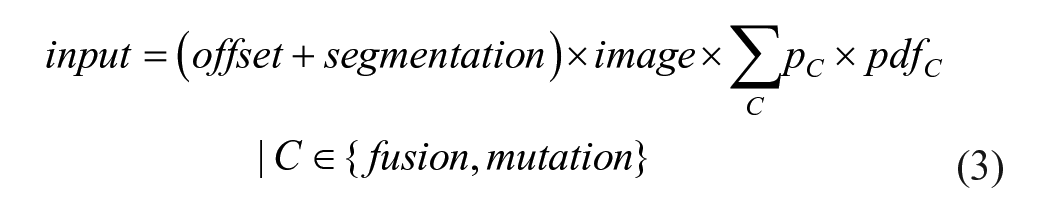
The setting for the tumour-location-guided CNN analysis was identical to how the CNN pipeline was developed except for the maximum number of epochs which was increased to 20 based on observations on the first 5 experiments. Figure 2 illustrates the 3 approaches we used to identify pLGG molecular subtype. A Monte Carlo random data splitting approach was used to evaluate the pipeline over 100 experiments, similar to the OpenRadiomics protocol. 22 In each experiment, the dataset was randomly split into development/test sets with an 80/20 ratio. The development set was further split into train/validation sets using a 75/25 ratio, randomly.
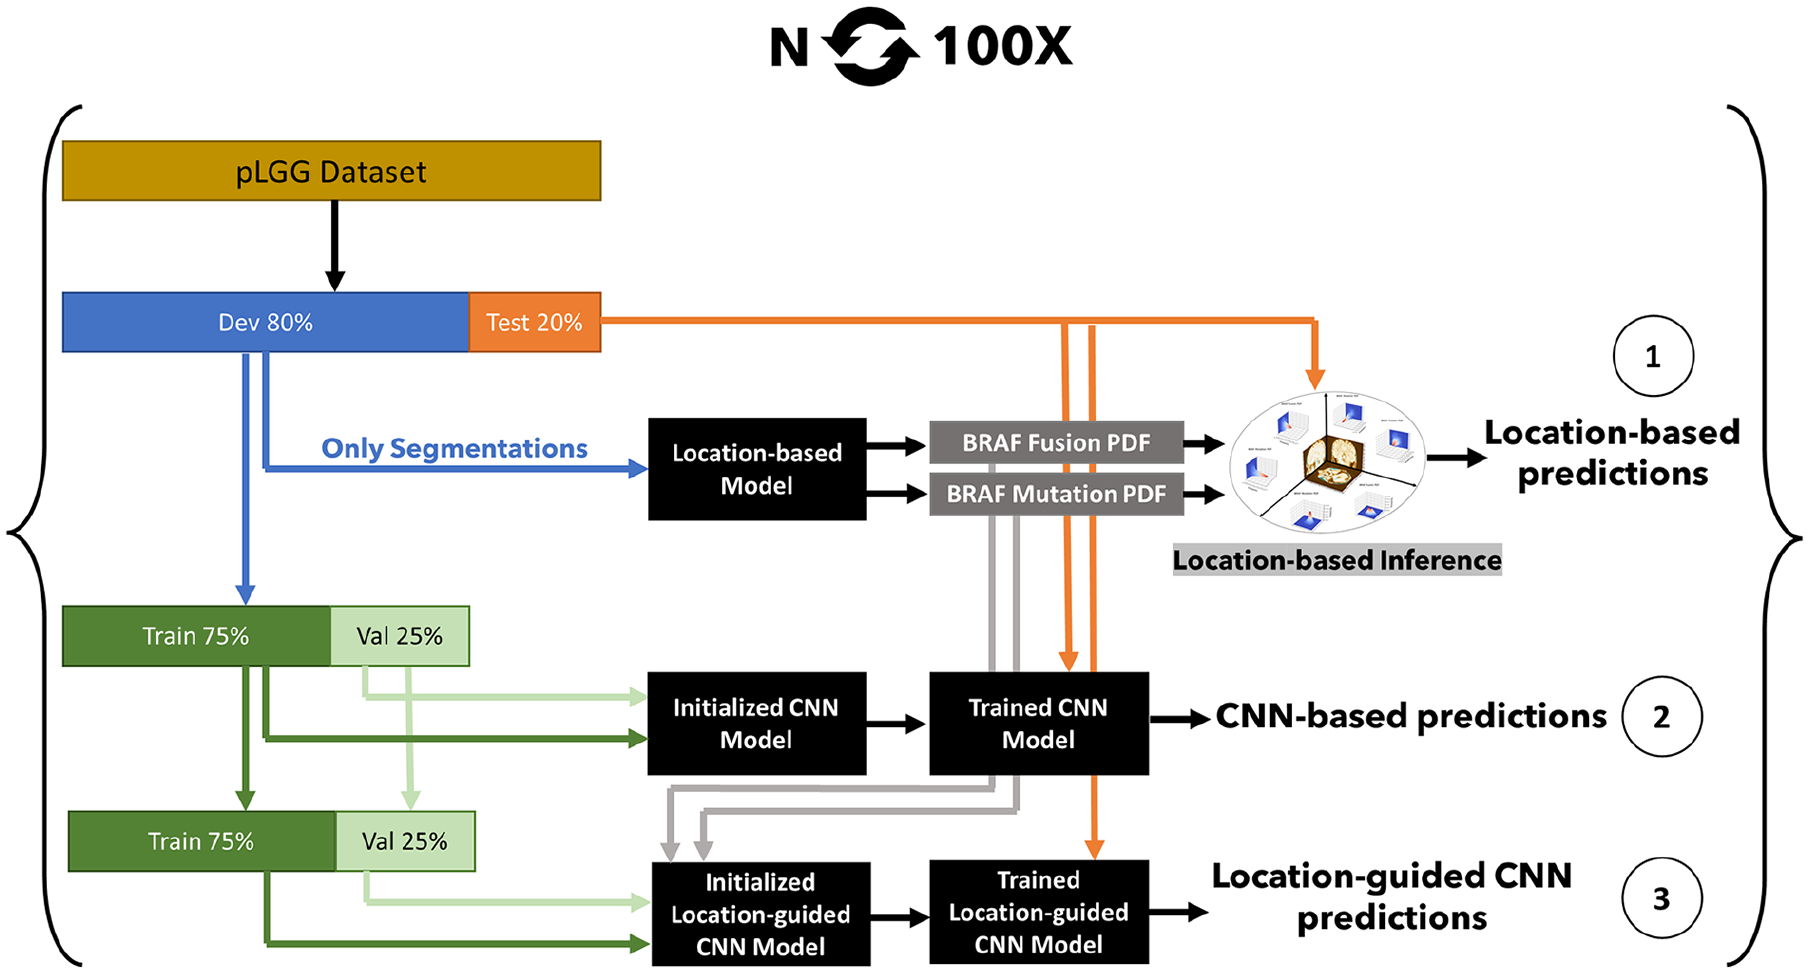
Location-based pLGG molecular biomarker identification pipelines: (1) location-only, (2) CNN-only, (3) location-augmented CNN.
Statistical Analysis
The Monte Carlo method for data splitting and model initialization (repetitive train/validation/test splits with different model initializations) enabled the acquisition of 100 test AUROC results across 3 models: location-only, CNN-only, and location-guided CNN. To assess the significance of performance enhancements among these models, we applied the Student’s t-test. This rigorous statistical approach provided a framework for evaluating the efficacy of incorporating location information into CNN models, thereby allowing for a detailed comparison of their predictive capabilities.
Results
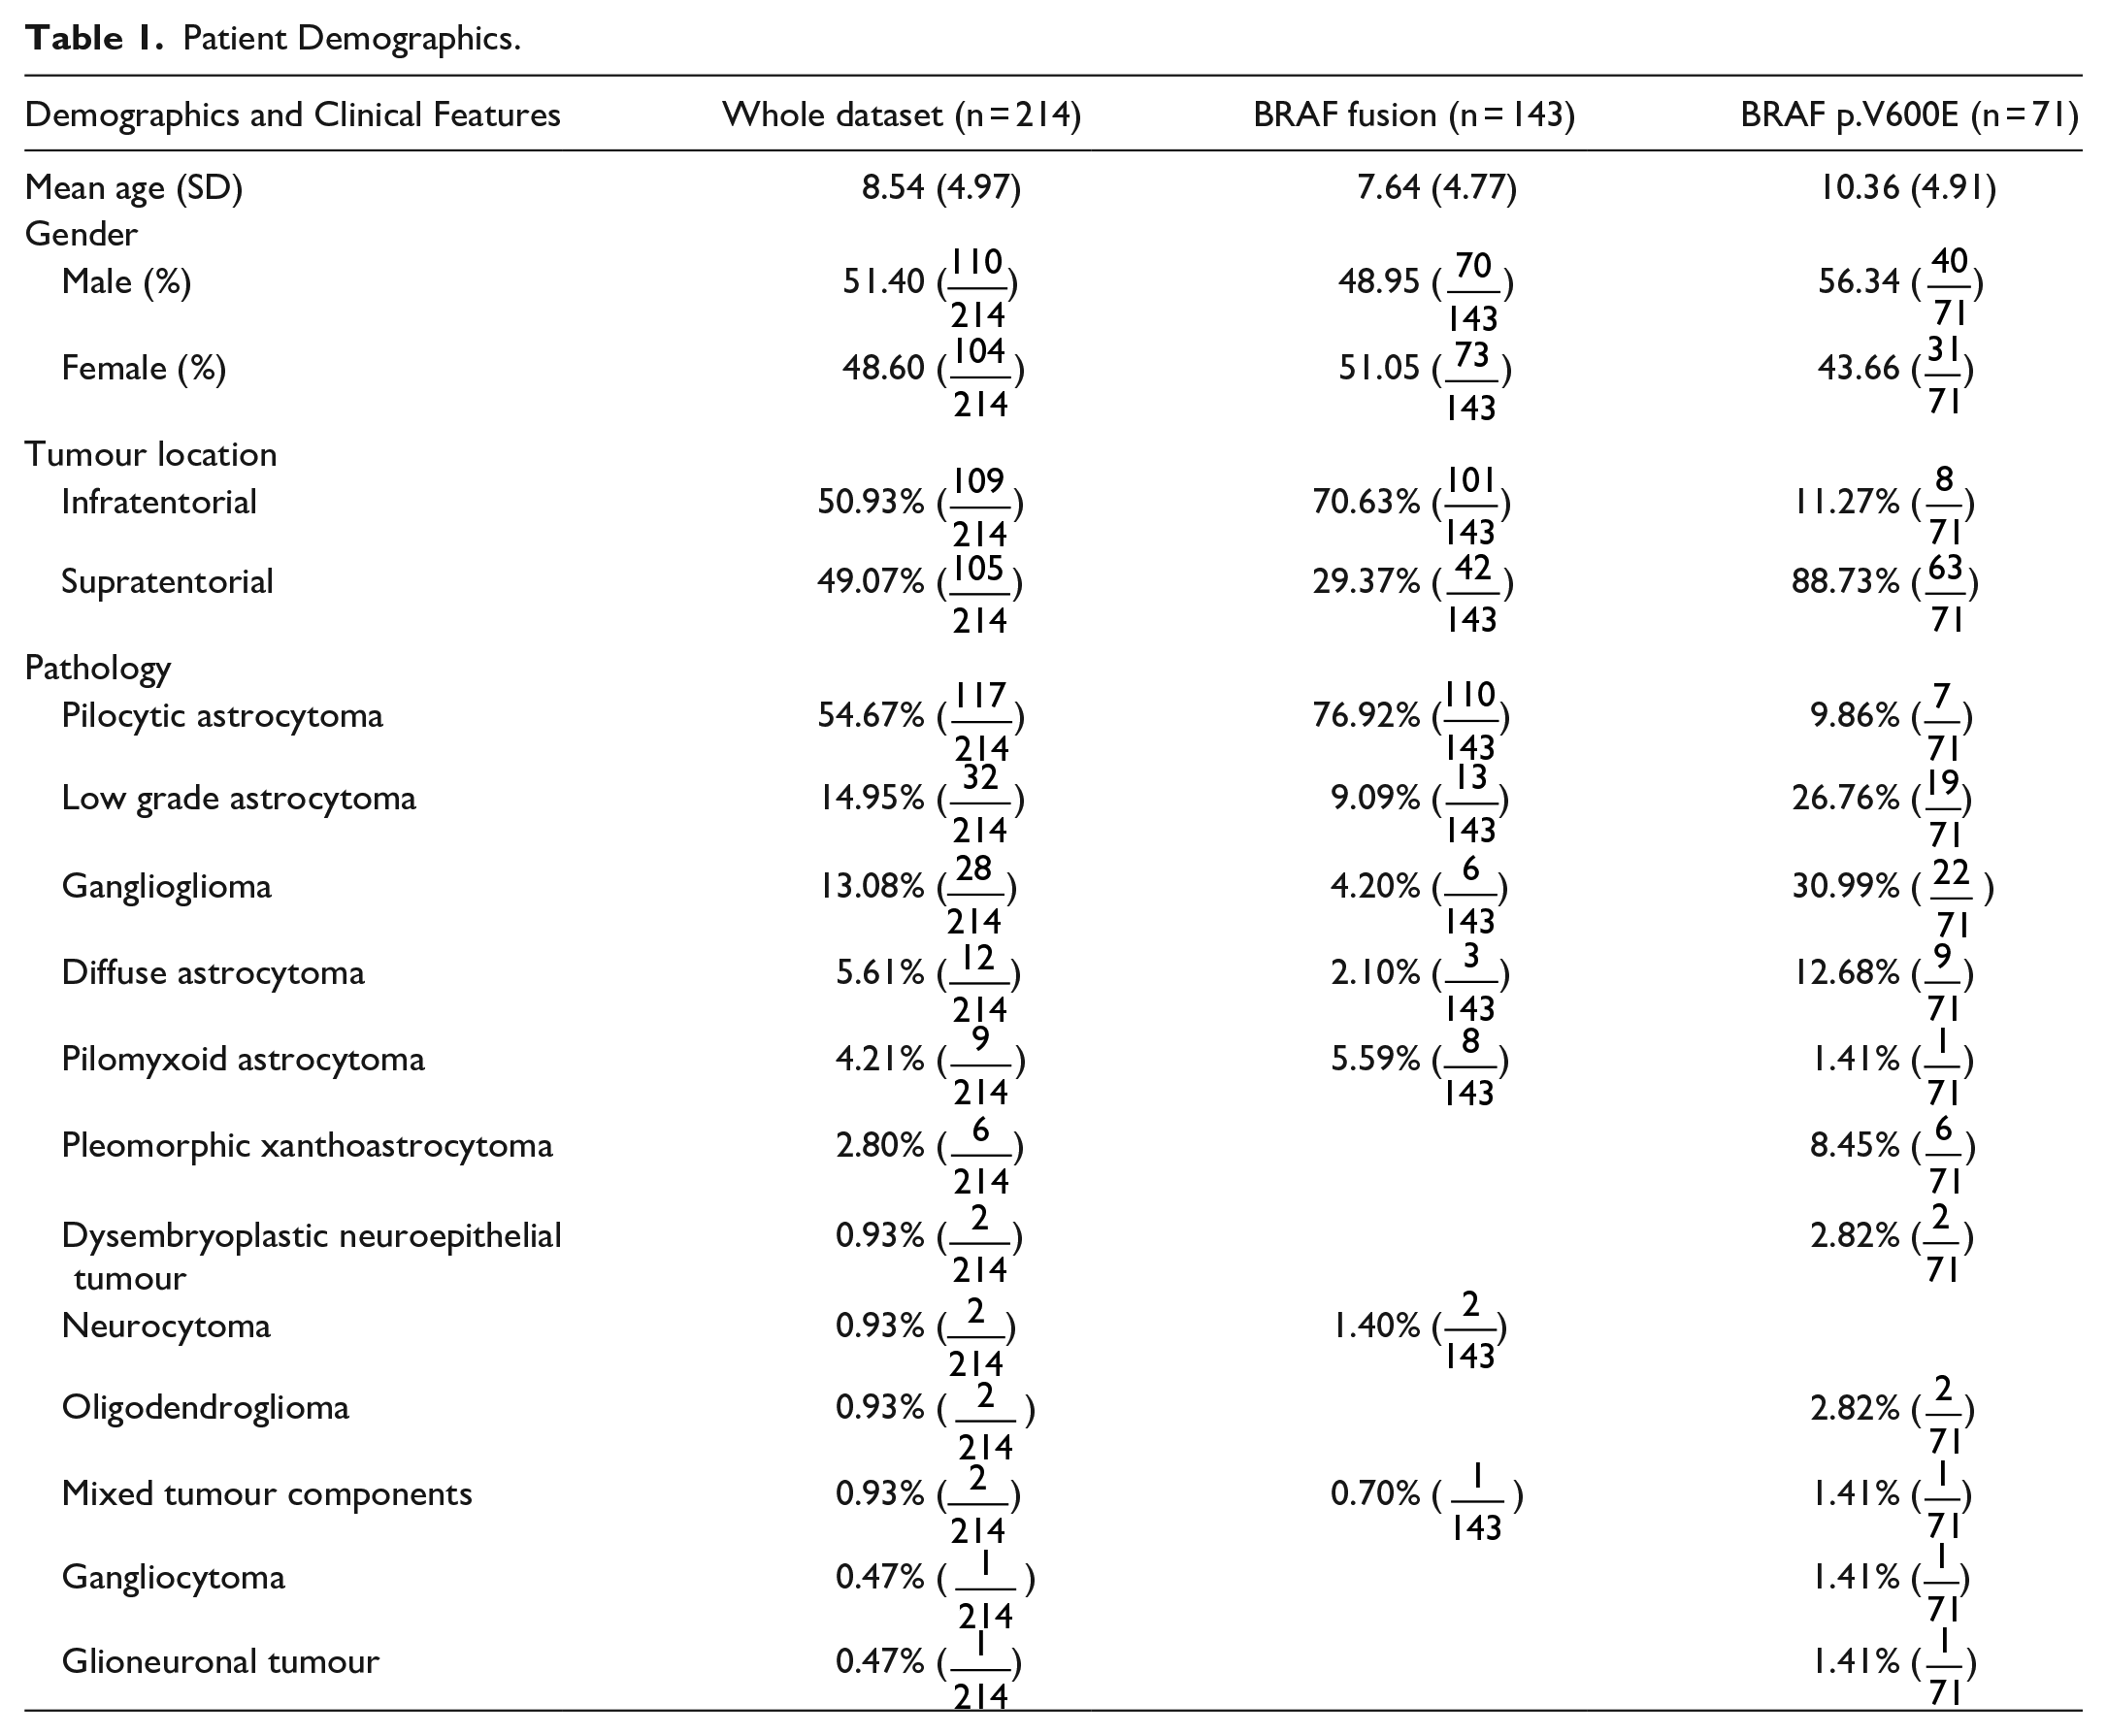
After initial screening, 397 patients were identified for the study. Absence of FLAIR and non-NRAF fusion or p.V600E mutation subtype resulted in exclusion of 168 patients. Additionally, 15 patients were excluded due to motion-degraded FLAIR images, as illustrated in Figure 3. The internal dataset, described in Table 1, included MR images from 214 patients with the 2 predominant molecular subtypes of pLGG: 143 with BRAF fusion (mean age 7.64 years, 70 male patients) and 71 with BRAF p.V600E mutation (mean age 10.36 years, 40 male patients).
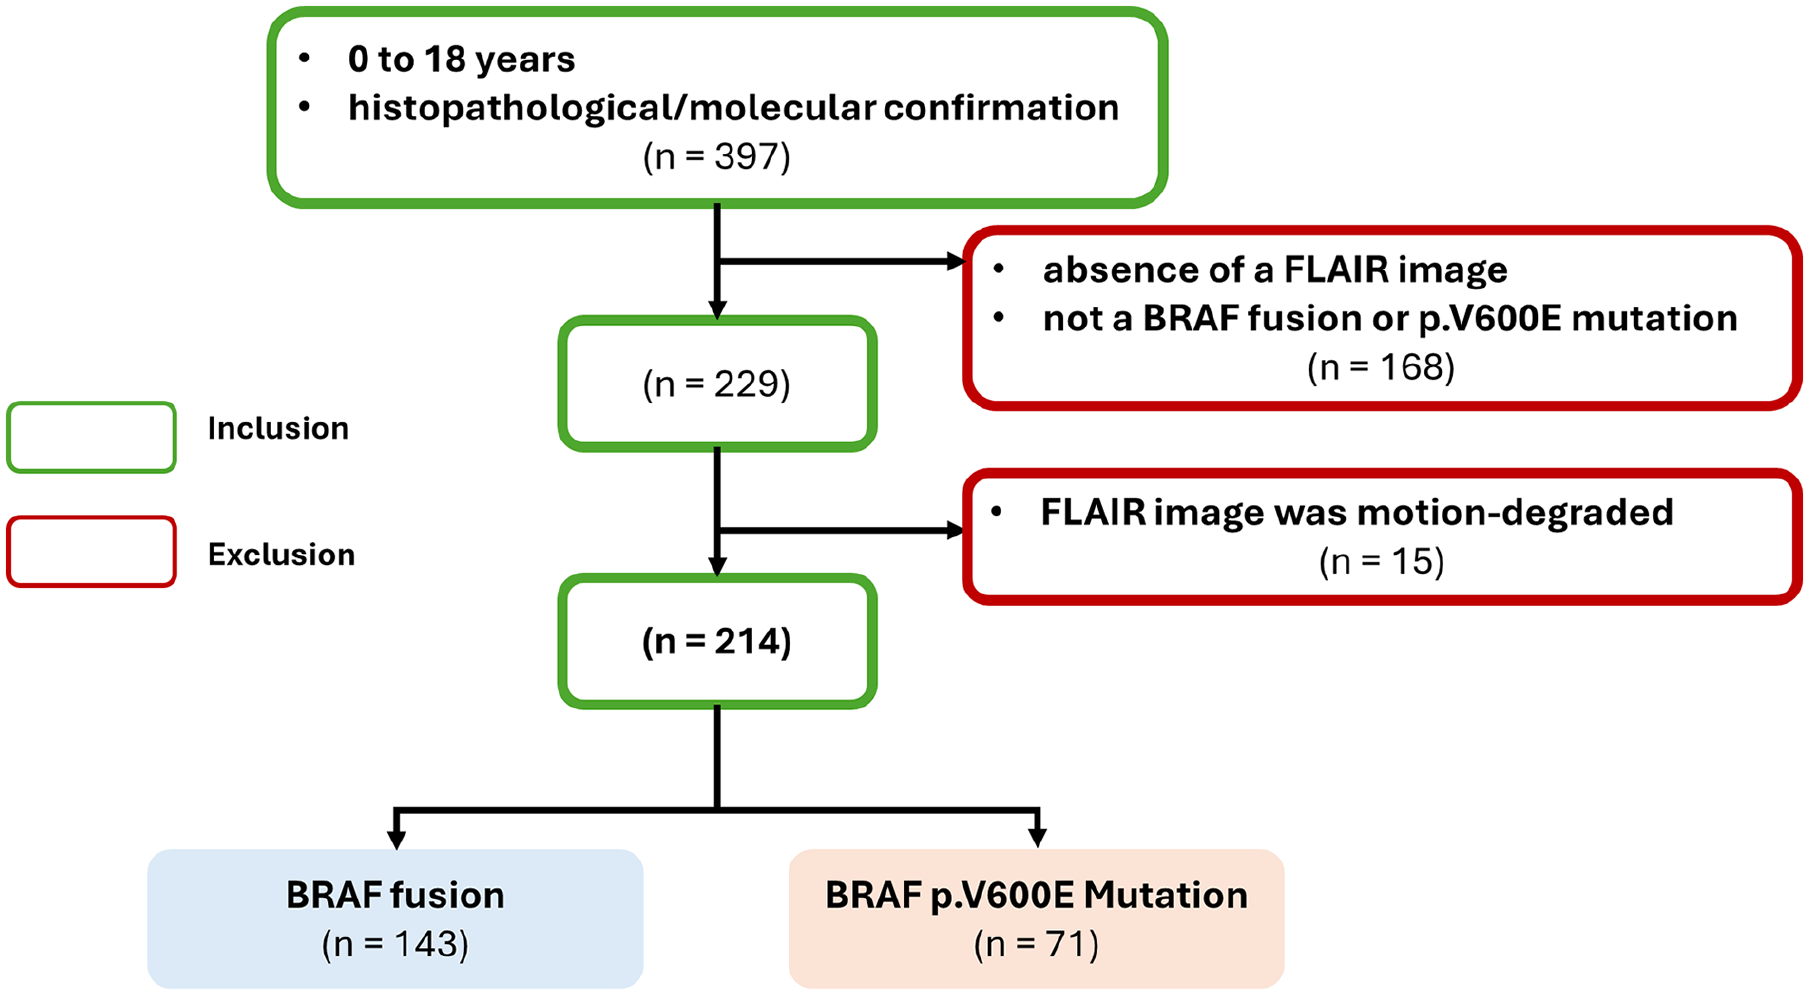
Inclusion/exclusion flowchart for the dataset.
Patient Demographics.
In our initial experiments, the shallow CNN was faster (58.5 vs 12.2 minutes run time), while marginally outperforming 3D ResNet 20 (mean AUROC of 86.0 vs 85.3 on 5 runs), and thus we used the shallow architecture throughout the remainder of the study (Table 2). Additionally, we used 3D ResNet models pre-trained on Kinetics 400 dataset, 23 which did not surpass the shallow model (mean AUROC 85.4 on 5 runs).
Comparing 3D ResNet and the In-House Shallow 3D CNN.

We repeated the experiments 100 times and unified the data splits for the 3 pipelines (ie, the same patients were dedicated to training, validation, and test cohorts across the pipelines). The location-based classifiers achieved an AUROC of 77.9, 95% CI (76.7, 79.0). CNN-based classifiers resulted in AUROC of 86.1, 95% CI (85.0, 87.3), and the tumour-location-guided CNNs surpassed the other 2 models with an average AUROC of 88.6, 95% CI (87.6, 89.7). Figure 4 shows the results for the 3 pLGG subtype identification methods.
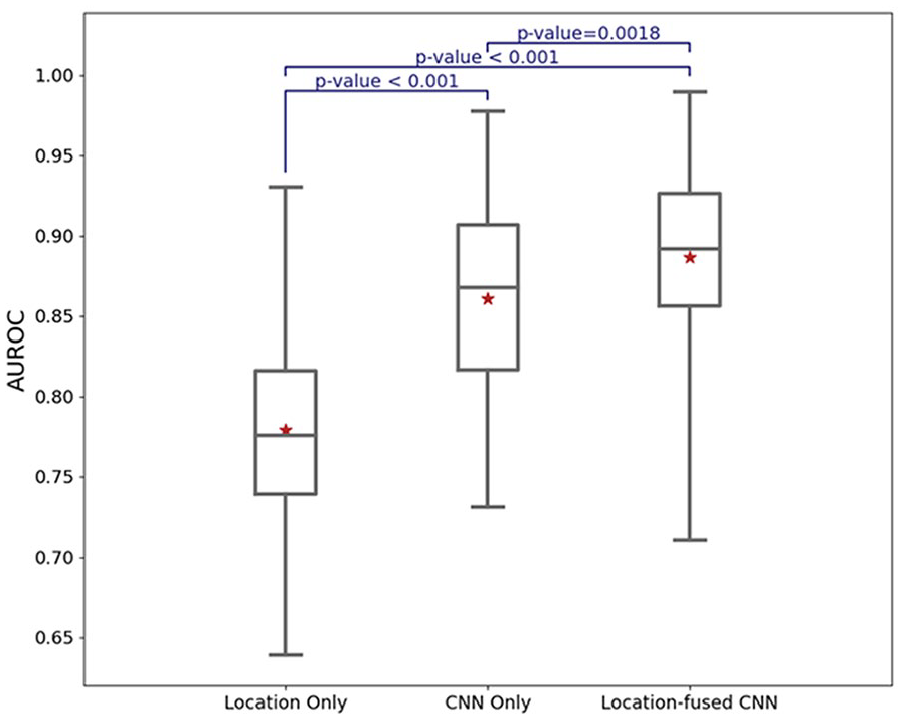
AUROC performance of the classification algorithms on test cohorts.
We varied the offset parameter as delineated in equation (3), monitoring its impact on the validation performance. Although the performance was not sensitive to the offset value, we determined an optimal value to be 0.2.
Figure 5 highlights 2 examples of how the 3D tumour-location PDFs allow the CNN to investigate regions beyond the manual segmentations. The top and bottom rows depict MR images in the axial plane for a patient with a BRAF fusion and a BRAF mutation, respectively. The BRAF fusion slice is at z = 36 (infratentorial) and the BRAF mutation slice is at z = 56 (supratentorial). The preprocessed MRI scans in the axial plane have 155 slices. In each row, the first column displays the MR image, the second column shows the manual segmentation of the tumour, and the third column illustrates the corresponding tumour location PDF. It is important to note that the third column does not represent the model’s attention map, and rather, the probability of tumour location based on the training dataset. Thus, the PDF and the manual segmentation are not expected to align perfectly. The tumour location PDF modifies the input, enabling the CNN to consider brain regions that extend beyond but are adjacent to the boundaries of the segmentation mask.
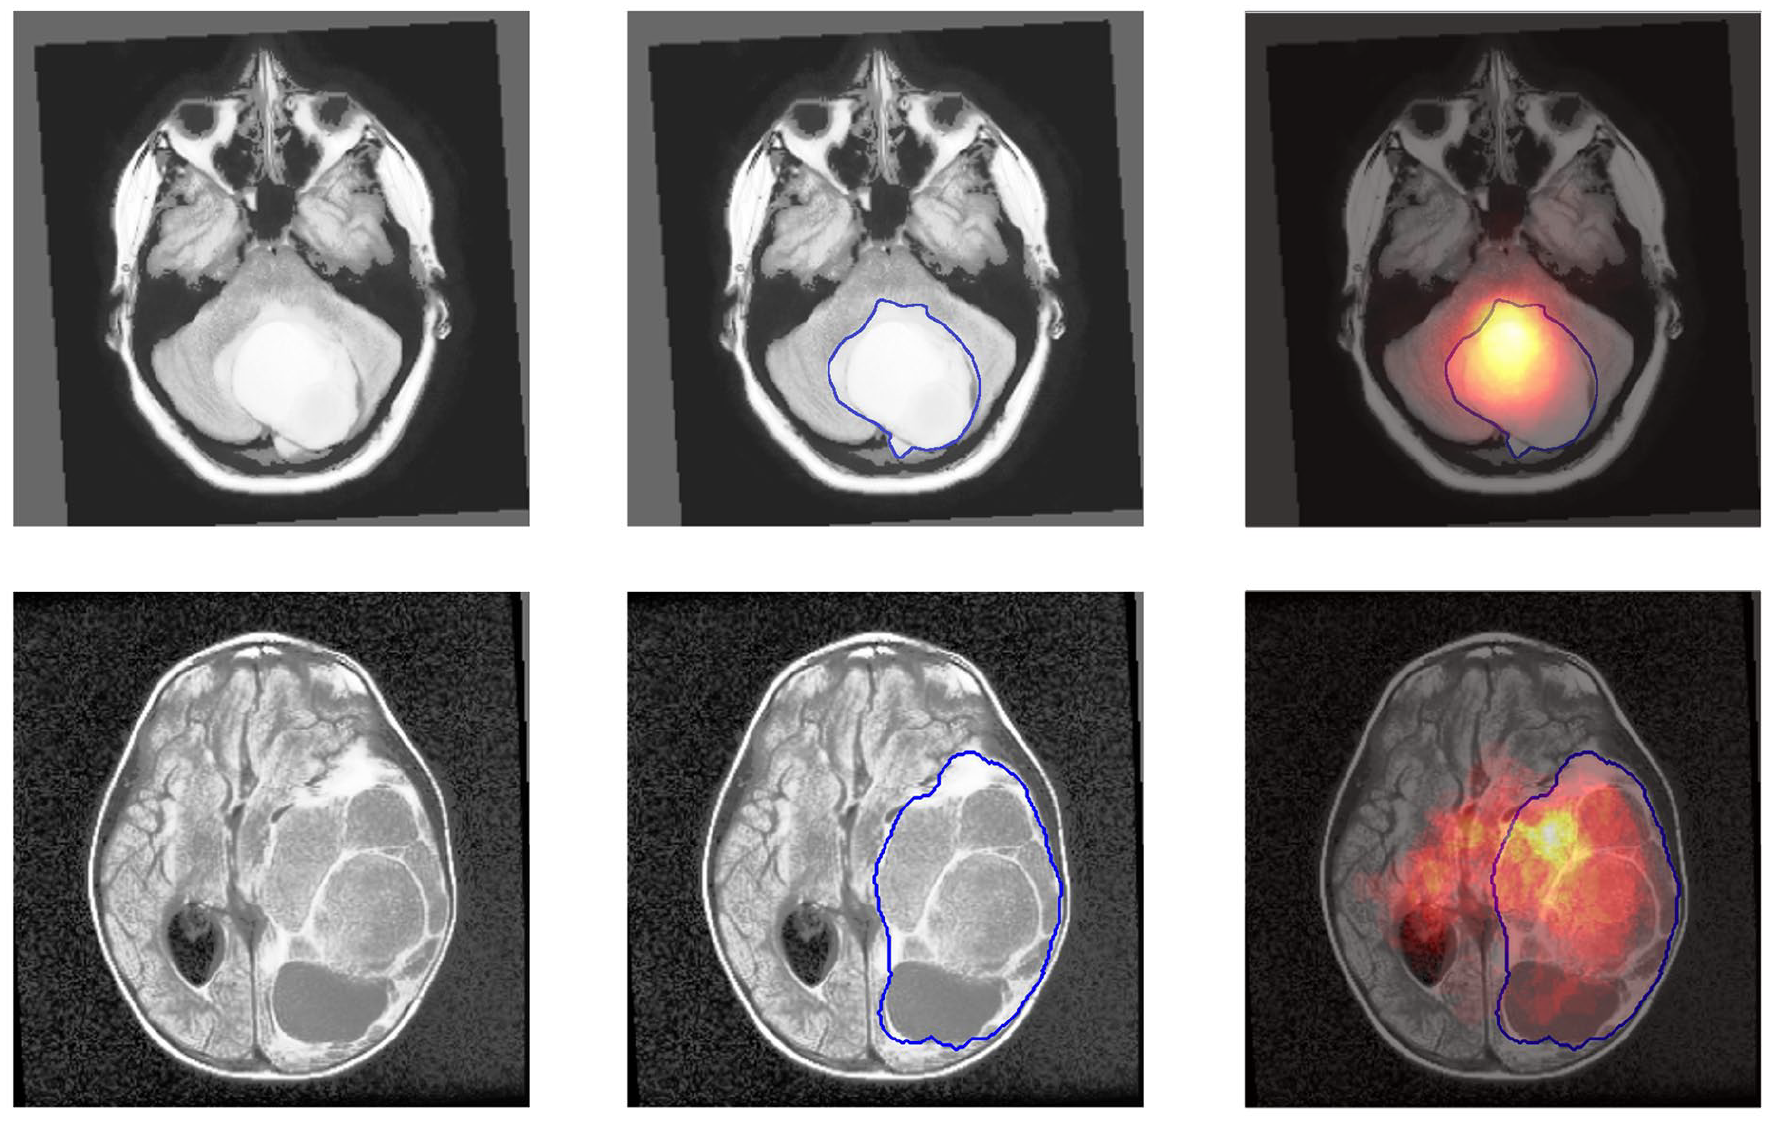
Axial plane slices showing the application of 3D tumour-location PDFs. Top row: BRAF fusion patient slice at z = 36 (infratentorial). Bottom row: BRAF mutation patient slice at z = 56 (supratentorial). Columns represent (left) MR image, (middle) manual segmentation, and (right) corresponding tumour location PDF. The PDFs, distinct from the model’s attention map, modify model’s input and allow considering regions beyond the manual segmentation boundaries.
In terms of utilizing tumour location in the CNN pipeline, we tried different approaches for incorporating tumour location information into the CNNs. The architectures that were tried are included in the code repository (https://github.com/IMICSLab/TumorLocationPDF). Injecting location-based probabilities into different layers of the CNN architecture, and ensemble of the CNN and location-based models were among the methods that were tested. However, we achieve marginal or no improvement in terms of average AUROC compared with the proposed pipeline. Using a binary variable (supra-/infratentorial tumour location) instead of the location-based probabilities did not improve the average AUROC.
Using Yuden’s J point, 24 we evaluated the models in terms of sensitivity, specificity, and accuracy. As shown in Table 3, the proposed tumour-location-guided model achieved a sensitivity, specificity, and accuracy of 0.851 (95% CI [0.817, 0.885]), 0.847 (95% CI [0.812, 0.883]), 0.850 (95% CI [0.826, 0.873]), respectively.
Sensitivity, Specificity, and Accuracy of the Proposed Tumour-Location-Guided Model.

Discussion
In this study, we developed multiple ML-based non-invasive pipelines to identify molecular subtypes of pLGG tumours using MR images. First, a tumour-location-only pipeline based on the 3D PDFs of BRAF fusion and BRAF p.V600E tumours was implemented and achieved a mean AUROC of 77.9. Traditionally, tumour location has been used as a binary variable to improve the molecular subtype classification of pLGG.13,19 To test the hypothesis that a tumour-location-only pipeline based on the 3D PDFs is superior to the traditional approach, we used a Random Forest (RF)-based pipeline with the same settings (ie, random training/test splits with 80/20 ratio and 100 repeats) to compare tumour location as a binary variable (supra- vs infratentorial) with the 3D PDFs that resulted in a mean AUROC of 75.8, 95% CI (74.8, 76.7), which was significantly lower than the proposed 3D PDFs (P-value = .0089). The hyperparameters and grid search setting for the experiment was similar to that proposed in a previous work. 25 Second, a 3D CNN-based pipeline was trained and evaluated to classify FLAIR VOIs and significantly improved the performance to 86.1 (P-value <.001). Lastly, the CNN-based pipeline was augmented by applying the 3D tumour location PDFs to the MR images and achieved a mean AUROC of 88.6, which showed a significant improvement (P-value .0018). We observed wider CI ranges for mean test sensitivity, specificity, and accuracy. This highlights the higher variance (ie, significantly low or high values across the experiments) of these metrics compared with AUROC. Thus, more advanced calibration of the models (ie, beyond using Yuden’s J point) and ensemble methods should be investigated in future research to improve the parametric performance metrics of the models (eg, sensitivity and specificity). Our contributions include (a) using tumour location as an independent modality, as opposed to the conventional approach of using tumour location as a categorical variable, (b) improving performance and explainability of CNN pipelines through the utilization of tumour location, and (c) utilizing Monte Carlo data splitting and a repetitive evaluation approach to measure randomness of CNN pipelines for pLGG molecular diagnosis.
In equation (3), offset introduces an additional hyperparameter to the pipeline, which can be optimized using grid search. After evaluating offset values of 0.1, 0.2, 0.3, 0.4, and 0.5, no significant difference in validation AUROC was observed, and an offset of 0.2 was selected for the experiments. The value of offset is not a decisive hyperparameter because it is added to the segmentation mask rather than multiplied. Any value of offset allows the CNN to explore the entire image according to equation (3), with the summation of the PDFs acting as the primary mechanism to restrict unrelated regions. However, larger offset values increase the voxel intensity in the model’s input. Given that CNN inputs are typically normalized with a bounded norm, 26 smaller offset values are generally preferable to maintain consistency with standard normalization practices.
Segmentation-free pLGG subtype identification using MR images is a challenging task that has not yet been addressed in the literature. We initially conducted experiments without segmentation masks, but the CNNs failed to converge. It should be highlighted that the offset is not an indicator of reliance on manual segmentation, and no value of offset can result in a truly segmentation-free approach since the offset is summed with the segmentation mask. Even assuming that a large offset does not significantly impact the norm of the CNN’s input and can be processed by the network, zeros in the PDFs will continue to exclude irrelevant areas of the image. Given that the PDFs are derived from the segmentation masks, the process would not be considered segmentation-free. Additionally, CNNs are sensitive to patterns rather than absolute values. Thus, adding a large offset to the segmentation still preserves the underlying tumour boundary patterns. Similarly, small offset values would still reflect the segmentation patterns. A special case occurs when the offset is set to zero. Although this scenario emphasizes the segmentation mask, the results are different from the CNN-based analysis due to the influence of the PDFs. We conducted an experiment with an offset of zero and achieved a mean AUROC of 86.0, 95% CI (85.0, 87.2), which was not significantly different from the CNN-based analysis.
Radiomics and CNNs form the 2 established branches of ML, applicable to pLGG molecular subtype identification. 27 Unlike radiomics, CNNs learn to extract the features and are not limited to predefined formulas for pattern recognition. Thus, CNNs have the potential to outperform radiomics-based models 28 which motivates why we focused on CNNs in this study. In conventional CNNs, feature extraction is done by sequential convolution layers, and fully connected (FC) layers classify the features. Deep learning (DL) uses CNNs with a high number of convolutional layers, and deep models are state-of-the-art on multiple large-scale datasets. 29 However, on small datasets where no pre-trained model is available, deeper models may not improve performance. 30 In our experiments, the shallow CNN outperformed 3D ResNet and enabled us to lower the computational load and increase the data split repetitions.
The importance of tumour location for MRI-based pLGG molecular subtype identification has been highlighted in several studies. Bag et al identified 5 genetic profiles, location, age at presentation, and histology as the decisive features for pLGG phenotype risk assessment and emphasized the differences in tumour location between BRAF fusion and BRAF V600E mutation. 31 In their study, 75% of tumours with BRAF fusion were located in the cerebellum, while 56% of tumours with BRAF V600E mutation were found in the cerebral hemispheres. Wagner et al used radiomics to differentiate BRAF-mutated and BRAF-fused tumours based on pre-therapeutic FLAIR images. 13 In their bi-institutional retrospective study of 115 pediatric patients, they achieved an average AUROC of 0.75 on the internal cohort and 0.85 on the external cohort. Location (supratentorial vs infratentorial) and age were significant clinical predictors of BRAF status and the average AUROC increased to 0.77 on their internal cohort when age and location were added to the radiomics features. Haldar et al retrospectively studied a dataset of 157 patients with pLGG from the Children’s Hospital of Philadelphia using a conventional unsupervised ML algorithm. 32 They employed Principal Component Analysis (PCA) followed by a K-means algorithm to assign patient images into 3 subgroups; a subsequent Kruskal-Wallis test demonstrated the distribution of tumour histology and location to be different between the 3 imaging clusters. Xu et al analyzed a dataset of 113 patients with pLGG (43 with BRAF V600E mutations vs 70 with other subtypes) using radiomics features to identify BRAF mutations. 33 Tumour location (supratentorial vs infratentorial) was a significant predictor of BRAF mutation and when combined with radiomics, improved the average training AUROC to 0.754 and the test AUROC to 0.934. Laterality of tumour location (left vs right) was not a significant predictor of BRAF mutation.
Dataset size is another crucial factor for reliability of any ML model. In a study on a larger bi-institutional dataset of 251 patients with pLGGs, Wagner et al conducted a dataset size sensitivity analysis.
25
They showed that data splits and model initialization impose randomness on the performance of the ML classifiers which impacts the results in 2 aspects: average AUROC and variance of the AUROCs. The study confirmed that the dataset size was sufficient to train robust pipelines, as evidenced by acceptable mean performance with bounded variance. However, it was observed that an individual global model could exhibit bias, indicated by a performance drop on the external dataset and an increase in variance. With only 60% (
There are multiple sources of variability impacting generalizability and reproducibility of ML pipelines. 34 Classifiers are sensitive to any form of change in input, including differences in imaging protocols, sequences parameters, models and manufacturers of MRI scanners, tumour segmentations, and image normalization. We employ the repetitive approach proposed in OpenRadiomics 22 for reproducible ML research on relatively small datasets. With a limited sample size, outliers might impact the fairness of data splits. 35 Hence, creating a single reproducible model becomes infeasible and the focus should be on training repeatable pipelines.
A limitation of our study is that the predictive significance of tumour location PDFs may diminish as additional pLGG subtypes are incorporated into the dataset. However, recent work by Tak et al has demonstrated that a sequential classification approach among different classes can be effective. 36 In such a scenario, location PDFs can enhance the differentiation between BRAF Fusion and p.V600E mutation subtypes. While the utility of location PDFs may vary with the complexity of the dataset, they can still provide valuable insights in specific classification tasks.
While the experiments showed that a rough supra-/infratentorial tumour segmentation was not helpful, using rough tumour segmentation needs to be tested in future work to eliminate the need for tedious manual segmentations. Bounding boxes of the tumours can be used as alternatives to the manual segmentation.
In our experiments, the shallow architecture marginally outperformed the randomly initialized and pre-trained 3D ResNet. We believe the higher number of learnable parameters results in overfitting with the 3D ResNet. However, transfer learning is shown to be promising in medical image classification 35 and needs to be investigated in more detail. Pre-training on a brain MRI dataset instead of Kinetics 400, which includes human videos, would have a higher potential for improving the results and should be explored in future research. Nevertheless, shallower architectures remain computationally favourable.
Heterogeneity of the dataset remains a major concern that might induce bias to the model. We employed a comprehensive preprocessing pipeline including resampling, bias correction, and registration. However, the model and the dataset should be evaluated to ensure resolution, scanner vendor, and settings are not confounding. This requires additional pieces of information from the MR images which should be curated for future studies.
Conclusion
Incorporating tumour location probability maps into CNN models led to statistically significant improvements for molecular subtype identification of pLGG. These results suggest that conventional CNNs using manual segmentations may not be optimal as location information is lost.
Footnotes
Appendix A
The CNN architecture is visualized in Figure A1, which is generated using the PyTorchViz Python library (https://github.com/szagoruyko/pytorchviz). The model has three 3D CNN blocks, followed by 2 FC layers to map the 486 extracted features into binary labels. Each 3D CNN block includes a 3D CNN layer with kernel size of 3, ReLU activation function, and MaxPooling with kernel size of 2.
Declaration of Conflicting Interests
The author(s) declared no potential conflicts of interest with respect to the research, authorship, and/or publication of this article.
Funding
The author(s) disclosed receipt of the following financial support for the research, authorship, and/or publication of this article: This research has been made possible with the financial support of the Canadian Institutes of Health Research (CIHR; Funding Reference Number: 184015).