
Abstract
This is a visual representation of the abstract.
Introduction
Pancreatic cancer has the third highest yearly mortality of all cancers in Canada, despite having the 12th highest incidence, with pancreatic ductal adenocarcinoma (PDAC) as the most common subtype.1,2 The most commonly prescribed curative treatment for PDAC is the pancreaticoduodenectomy or Whipple procedure, in which patients who undergo the procedure have a 5-year survival rate of 25%. 3 The complex nature of the procedure and proximity to other organs can lead to life-threatening complications such as anastomotic leaks and strictures or life-altering conditions such as bowel dysmotility and diabetes among others.4,5 A key factor in determining whether patients are surgical candidates is the extent of local vascular tumour involvement, since involvement increases the likelihood of a positive tumour margin left after surgery. 6 Patients with a positive tumour margin have significantly shorter median survival times than patients with a negative tumour margin after surgery (16.3-31.3 months, P < .001). 7
Computed tomography (CT) is the primary modality for local tumour staging, as it has the best performance for predicting surgical success compared to MRI and ultrasound.8,9 Using CT, there are specific guidelines for radiologists to categorize lesions as resectable, non-resectable, or borderline resectable, depending on the degree of tumour contact with major blood vessels. 8 Contouring the tumour margin is a major challenge faced by interpreting radiologists, as normal and affected pancreas have similar density and very subtle differences in contrast on CT. 9 This makes it challenging to accurately determine the extent of the tumour. 9 Inaccurate contouring may lead to discordance between the presurgical assessment of vessel involvement and the intraoperative findings. 10 Discordance has a high cost to patients and hospital budgets, as it results in unnecessary morbidity, occasional mortality, and the expenditure of hospital resources. Increasing observer experience has been found to improve the agreement of radiologists for detecting vessel involvement, however, even for expert radiologists, agreement is only moderate. 11
The motivation of our study was to determine whether a visualization tool may help radiology residents improve their ability to detect local tumour involvement of the superior mesenteric artery (SMA). To this end, we propose 3 separate hypotheses. First, we hypothesize that perivascular voxel density differences from the mean fat density can predict tumour-vessel involvement as indicated by expert radiologists; this is henceforth referred to as the density difference map. Second, we propose that a visual aid based on this map can improve the interpretations by radiology residents, specifically sensitivity, specificity, and balanced accuracy compared to expert radiologists’ tumour annotations and surgical pathology. Finally, we propose that a visual aid tool can improve the accuracy of radiology resident annotation size and positioning around the SMA, as compared to annotations made by expert radiologists.
Methods
Materials
This study was approved by the research ethics board at a large Canadian University. A 94-patient data set was used, consisting of non–interpolated, bitmap, contrast enhanced CT scans in arterial or portal venous phase for each patient. Patients between 2009 and 2017 were selected retrospectively based on having histopathologically confirmed PDAC, pre-operatively classified as resectable or borderline resectable, and receiving surgery with curative intent. No patient had neoadjuvant treatment. Scanner type, kernel, field of view, noise, and slice thickness were not constant (Supplemental Materials S1). This variation can be attributed to all patients not having the same CT protocol followed at scan acquisition time (pancreatic or abdomen-pelvis CT protocol). Scan coverage included the origin of the SMA to the inferior margin of the kidneys. The SMA was segmented in each case by a radiology resident or an undergraduate student trained on this task, and then reviewed by an abdominal radiologist, by annotating the SMA on the segmenting software ITK-SNAP using the bitmap images. 12
Certified abdominal radiologists of 15, 6, and 3 years evaluated the dataset to establish a gold standard. Experts used a 3D Slicer extension (Image Quizzer) built in our lab to annotate their perceived area(s) of tumour contact with the SMA. 13 While study participants may have had previous experience with 3D Slicer, none had experience using the Image Quizzer extension.
The Visual Aid
Our tool focused on the SMA, as it is one of the most common vessels with vascular involvement. 8 The SMA is considered free of involvement if there is a ring of fat density surrounding the vessel.8,14 If there is vascular invasion, the extent of circumferential contact affects the classification. 8 This includes abutment (ie, less than 180° of contact), which results in a borderline-resectable classification, and encasement (ie, greater than 180° of contact), which typically results in an unresectable classification. 8 Therefore, our tool was built to detect any non-fat density voxels in the perivascular region. Since the density of fat voxels varies slightly between patients, we calculated mean fat density on a per-patient basis.
For each patient, a 4-voxel thick region was automatically identified in the subcutaneous fat located 5 voxels below the skin surface. This was done by using a threshold of −150 Hounsfield Units (HU) to separate the skin surface from the background. Morphological erosion of the boundary was then used to obtain the region of interest (ROI). All voxels that were denser than fat (over −50 HU) were removed using thresholding. The mean fat density was calculated in each patient using the same automatically segmented ROI on the CT (Figure 1).
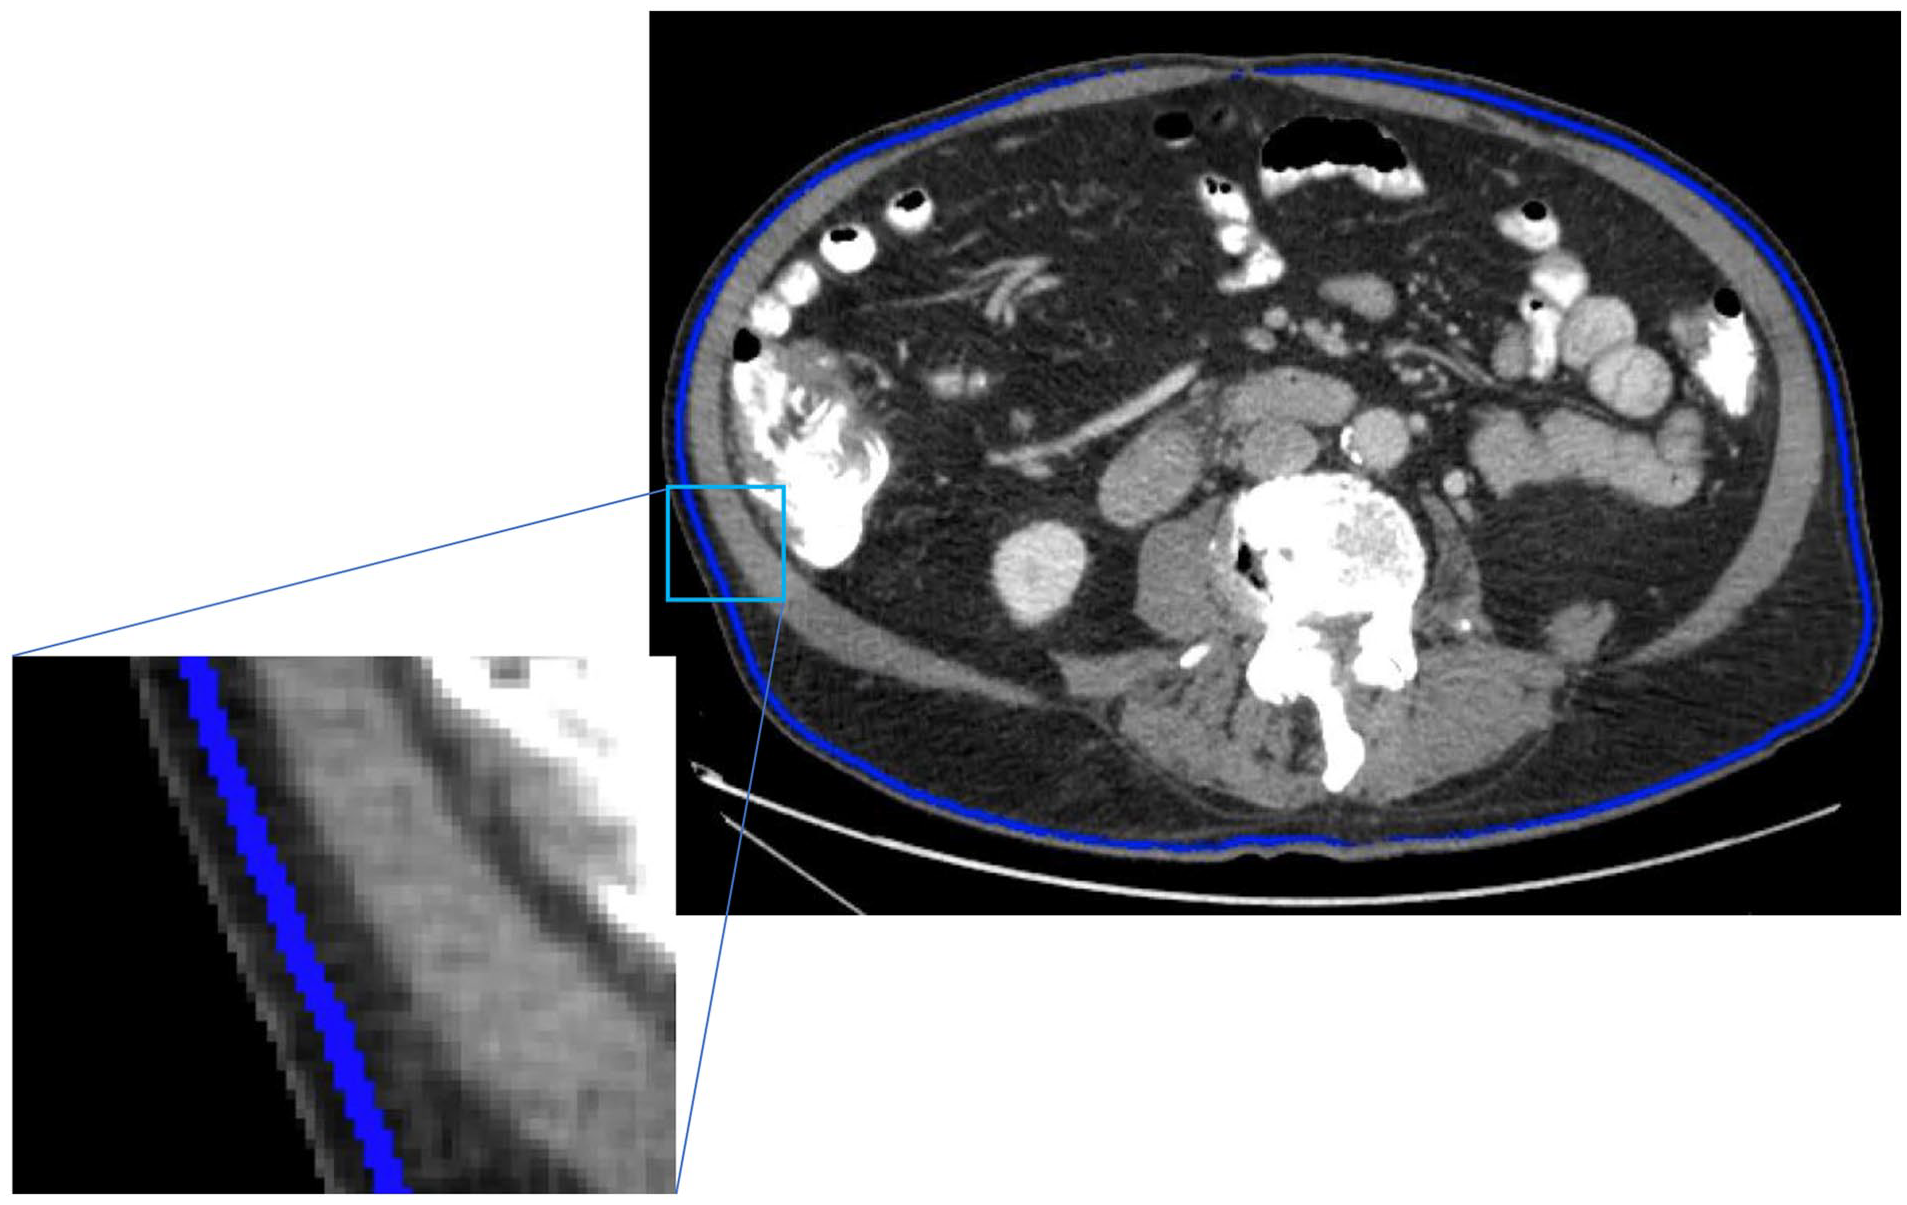
An example of the ROI used to calculate the mean fat density. The ROI, located in the subcutaneous fat, is indicated by the blue voxels on this patient’s CT.
Mean fat density was used to calculate a difference in density, and eventually a density difference map, for each voxel in a one-voxel thick region surrounding the SMA on the axial CT slices, as follows:
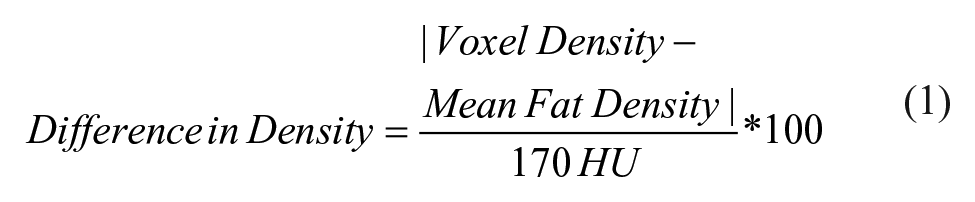
The denominator of 170 HU was empirically chosen after visually examining various denominators between 100 and 250 in 10 patients. Based on visual inspection, the threshold of 170 HU provided the best contrast between fat and non-fat densities. Any difference greater than 100 was set to be equal to 100 to facilitate visualization of regions that were closer to the density of fat.
The above calculation results in a density difference map which serves as a stand-alone prediction tool. It also acts as the basis of the visual aid, as the difference map (displayed in colour) is overlaid onto the CT images. This was projected to cover the vessel wall/lumen to make the aid more visible and to ensure that the perivascular region is not obscured by the aid (Figure 2, Supplemental Materials S2).
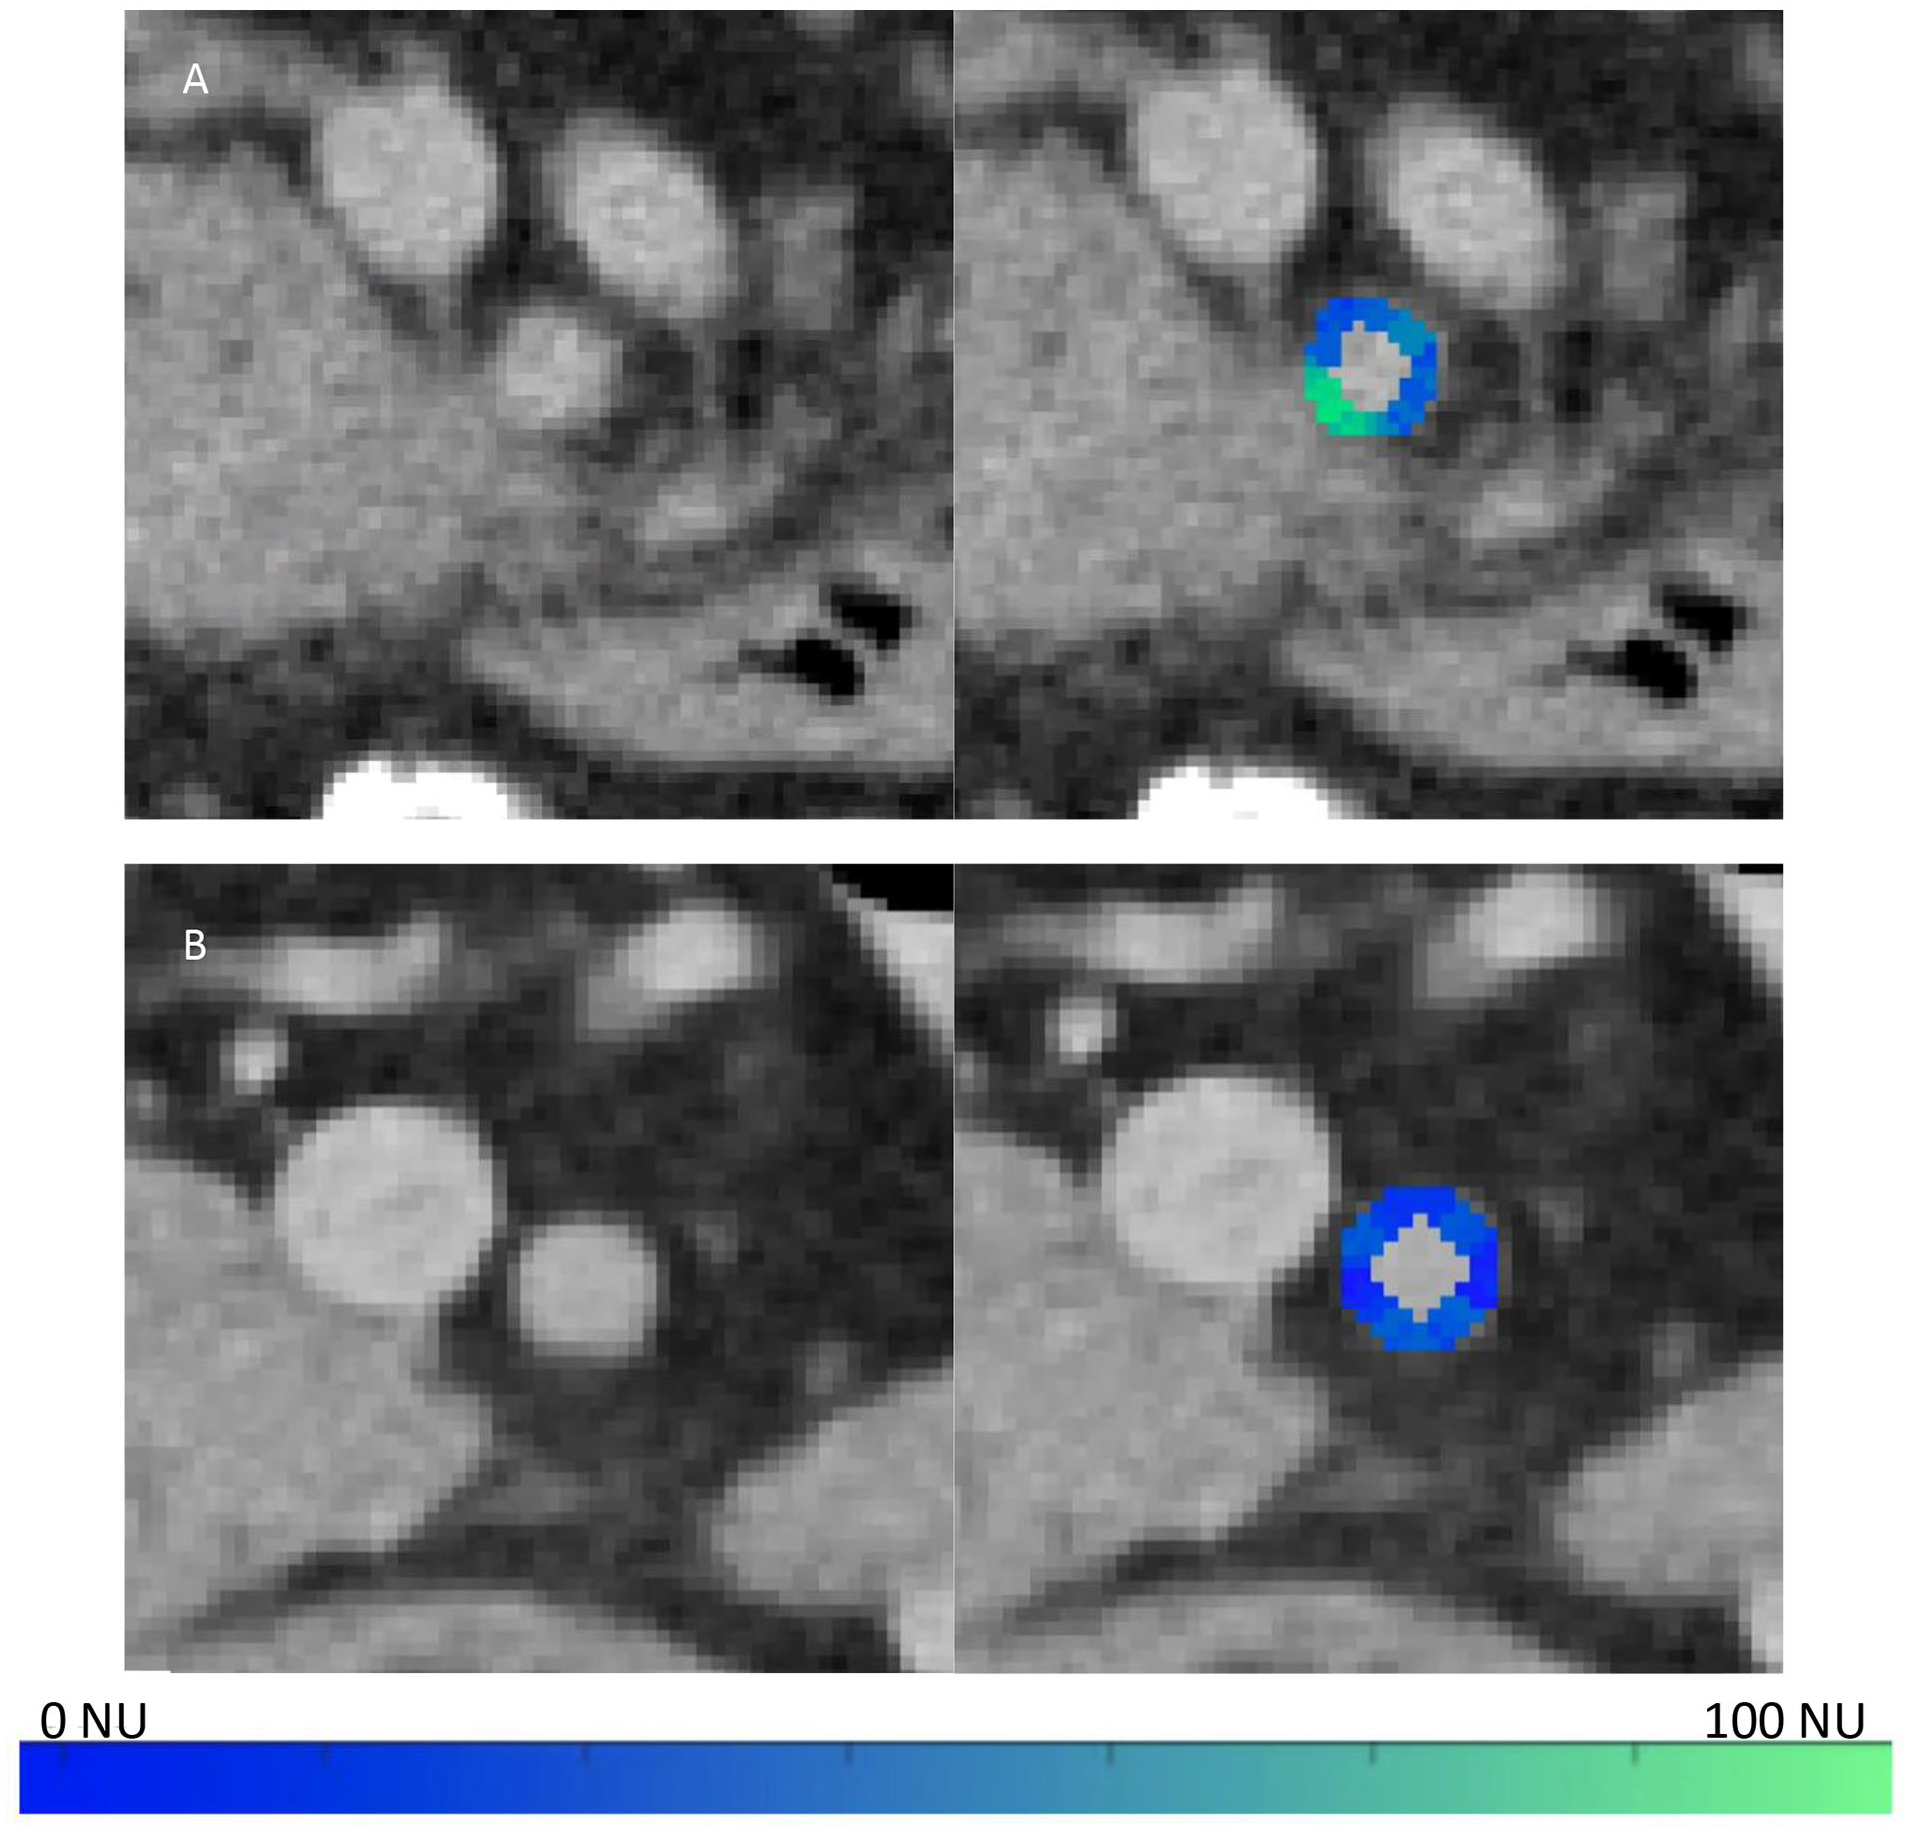
Depiction of the visual aid tool overlaid on 2 different CT slices. The aid is displayed within the lumen of the SMA to avoid obscuring the perivascular area. (A) Tumour contacts the SMA from 6 to 9 o’clock without (left image) and with (right image) the aid. (B) There is no tumour contacting the SMA as seen without (left image) and with (right image) the aid. The colourmap scale is indicated in NU based on the voxel densities’ differences from the mean fat density.
Density Difference Map as a Prediction Tool
A receiver operating characteristic curve (ROC) was used to gauge the ability of the density difference map to predict vascular involvement relative to the expert annotations. ROCs were created by analyzing each voxel around the SMA. First, the expert annotations were projected to be one voxel thick around the SMA to ensure that (1) all annotations were equal in thickness, and (2) that the annotations only reflected the area of contact around the SMA. Annotated voxels were labeled positive for tumour while any unmarked voxels were labeled negative. Second, the percent density difference was measured as described in equation (1). We then varied the density threshold between 0 and 100, where any value above the threshold was predicted positive, and any below predicted negative, to build the ROC. This was done for each of the expert abdominal radiologists’ annotations. The area under the ROC curve (AUC) was then calculated for each ROC to measure the ability of the density difference map to predict regions of tumour and non-tumour.
Resident Performance
Four radiology residents, post graduate year (PGY) 2 to 5, reviewed the data set in a randomized order with the visual aid overlaid on alternate patient scans (n = 47 with and without the aid). Similar to the expert radiologists, the residents used the Image Quizzer tool to annotate the location(s) of tumour contact with the SMA on each image. Participants were then shown their annotations next to the 3 expert abdominal radiologists’ annotations as a comparison.
To assess the overall performance of the residents, we calculated sensitivity, specificity, and balanced accuracy, using each expert’s annotations or the surgical pathology as ground truth, and then calculated the mean of these metrics across the experts. Balanced accuracy was calculated by adding the sensitivity and the specificity and dividing by two. 15 Balanced accuracy was chosen due to the imbalance of labels in our data. In an unbalanced dataset, accuracy would more strongly reflect the performance of the more prevalent class, rather than giving a balanced overview of performance. In our case, accuracy would highly favour the negative class, and would result in values very similar to specificity.
Annotation Analysis
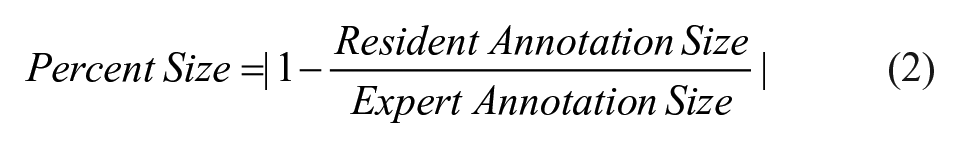
Percentage shift and size differences between the resident and expert annotations were calculated to obtain a more granular understanding of the resident performance. These metrics used each expert’s annotations as ground truth, then the mean was calculated across experts. Shift was calculated as a percentage of the rotation of the centre of the resident’s annotation around the vessel, relative to the centre of the expert’s annotation (Figure 3A). The maximal shift percentage is 50% since the direction of the shift was not considered. The percent size difference is calculated as follows (Figure 3B):
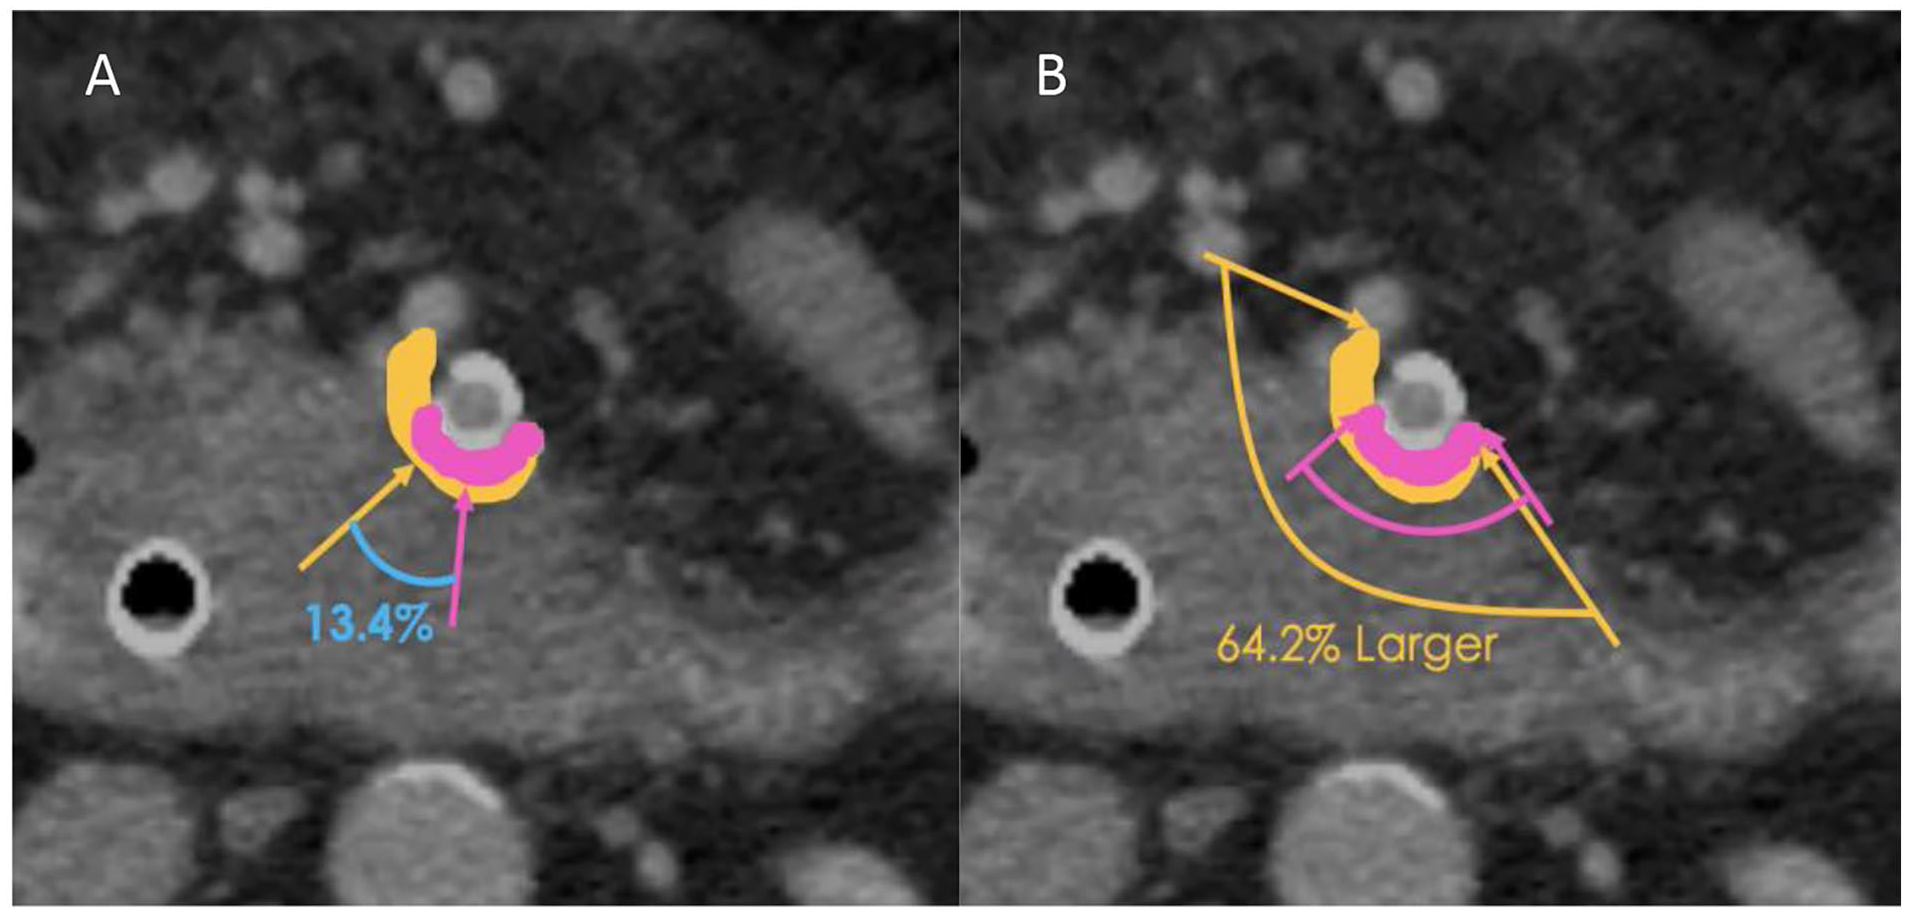
Calculation of shift and size metrics (expert radiologist annotation in pink, radiology resident annotation in orange). (A) Shift percentage is based on the relative difference of the annotation’s midpoints (location of the arrows). (B) Size percentage calculation. The degree of vessel encasement is based on the involved distance between the 2 arrows of the same colour.
Resident and expert annotation size were calculated as the number of voxels the user’s annotation covered in a one-voxel thick region surrounding the SMA. Shift and size metrics were only calculated on CT slices where both the resident and expert annotated vascular invasion.
Results
Density Difference Map as a Prediction Tool
The density difference map had a mean AUC of 0.80 (0.84, 0.77, 0.79) for predicting expert abdominal radiologists’ annotations around the SMA (Figure 4). This indicates that the map, on its own, has a better than chance performance for detecting areas of vascular involvement.
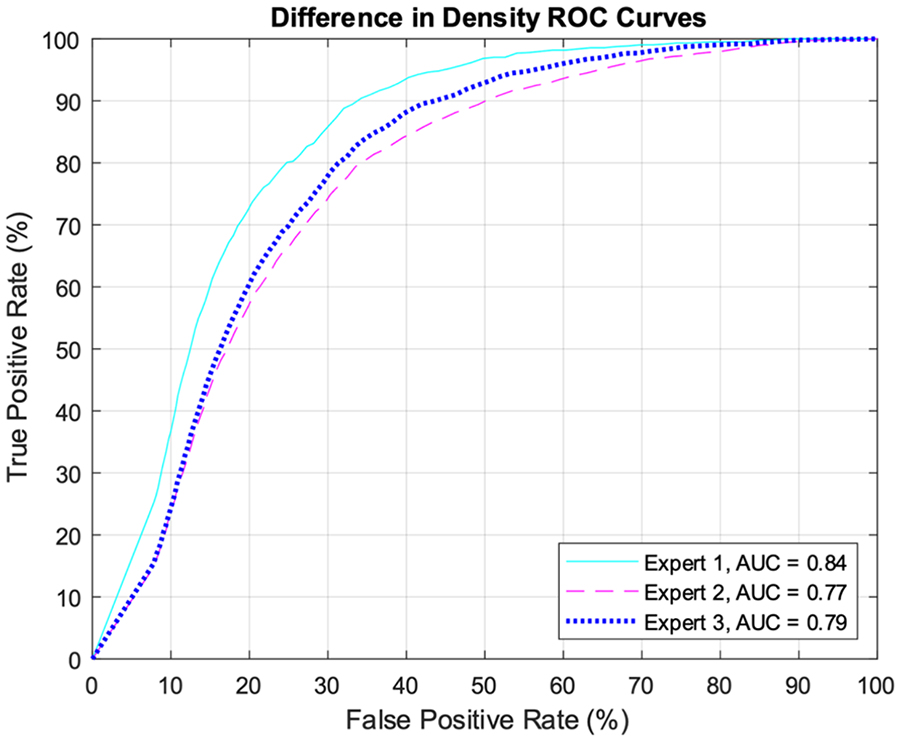
ROC curves comparing the expert abdominal radiologist’s vascular invasion annotations to the difference map, where voxels differ from the mean fat density.
Resident Performance
Following surgery, 24 patients within the 94-patient data set were found to have a positive SMA margin, while the 3 expert radiologists denoted 28, 30, and 23 patients respectively with SMA involvement. When compared to experts, all 4 residents had an increase in sensitivity and balanced accuracy when using the visual aid on a per-patient basis (Table 1) and for the extent of circumferential contact (Table 2). The expert radiologist annotations were found to be similar to the surgical pathology as they had a mean sensitivity, specificity, and balanced accuracy of 84%/90%/87%. When compared to the surgical pathology, 3 residents showed an increase in sensitivity with the aid, and 2 showed an increase in balanced accuracy, while one showed no change (Table 3). These residents performed worse on average than the expert radiologists in comparison to the surgical pathology. The resident performance compared to the experts on a per-slice basis can be seen in Supplemental Materials S3 and the performance of the experts in comparison to the surgical pathology can be seen in Supplemental Materials S4.
Comparison of Resident Users to Expert User Annotations of SMA Involvement on a Per Patient Basis, With and Without the Visual Aid.
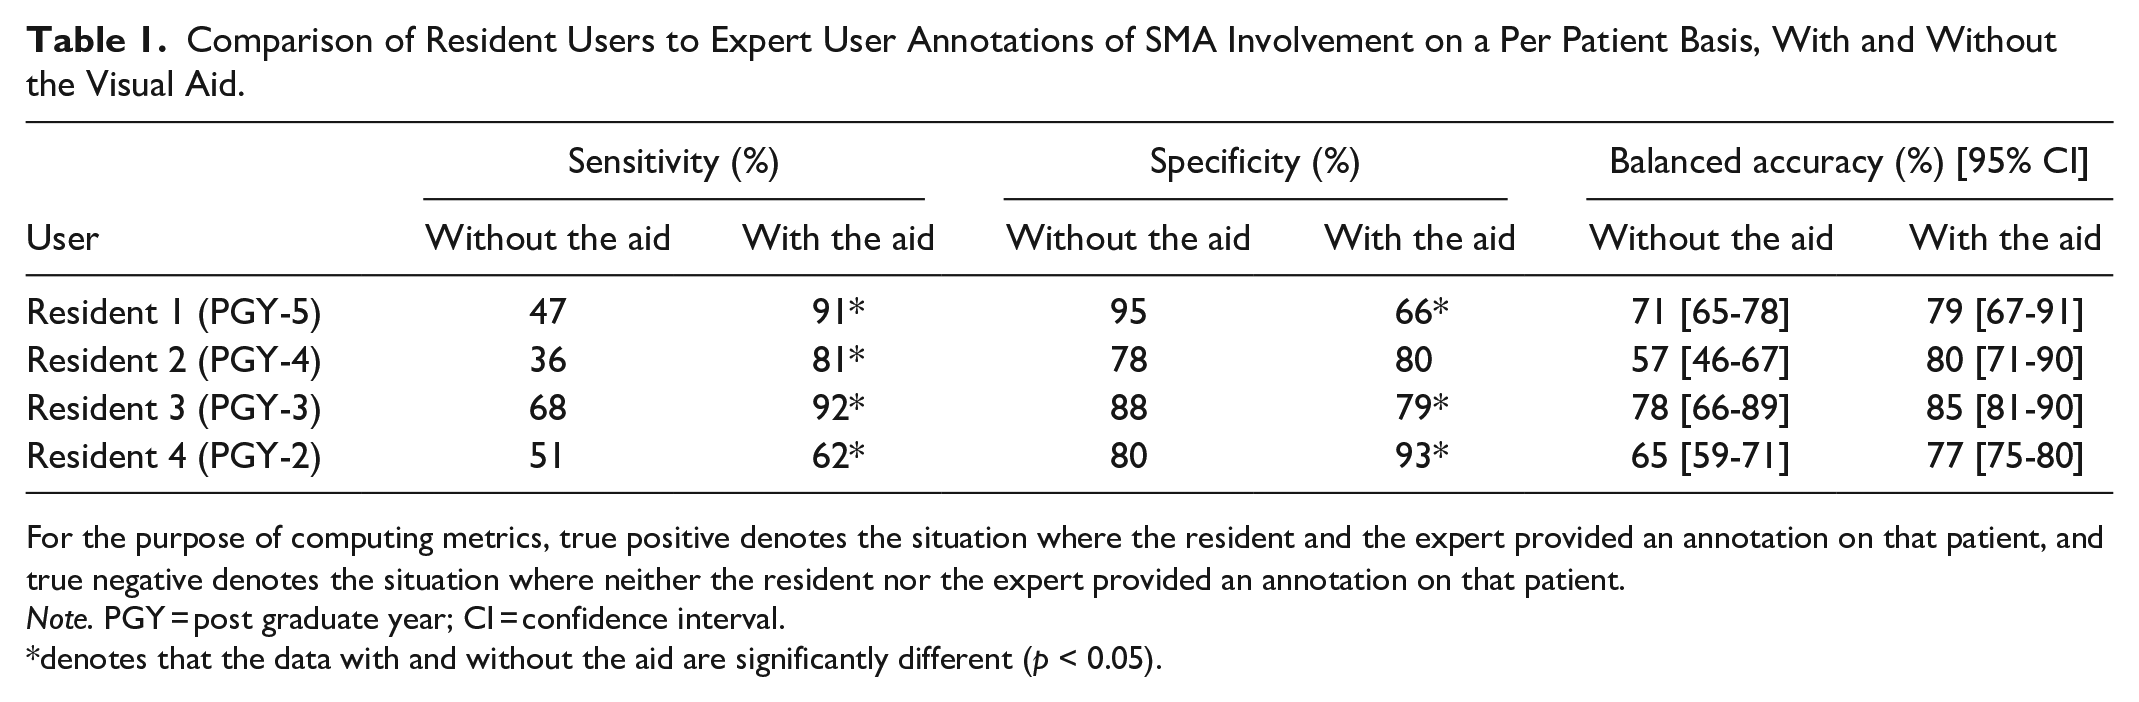
For the purpose of computing metrics, true positive denotes the situation where the resident and the expert provided an annotation on that patient, and true negative denotes the situation where neither the resident nor the expert provided an annotation on that patient.
Note. PGY = post graduate year; CI = confidence interval.
denotes that the data with and without the aid are significantly different (p < 0.05).
Comparison of Resident Users to Expert User Annotations of SMA Involvement With Emphasis on Extent of Circumferential Contact, With and Without the Visual Aid.
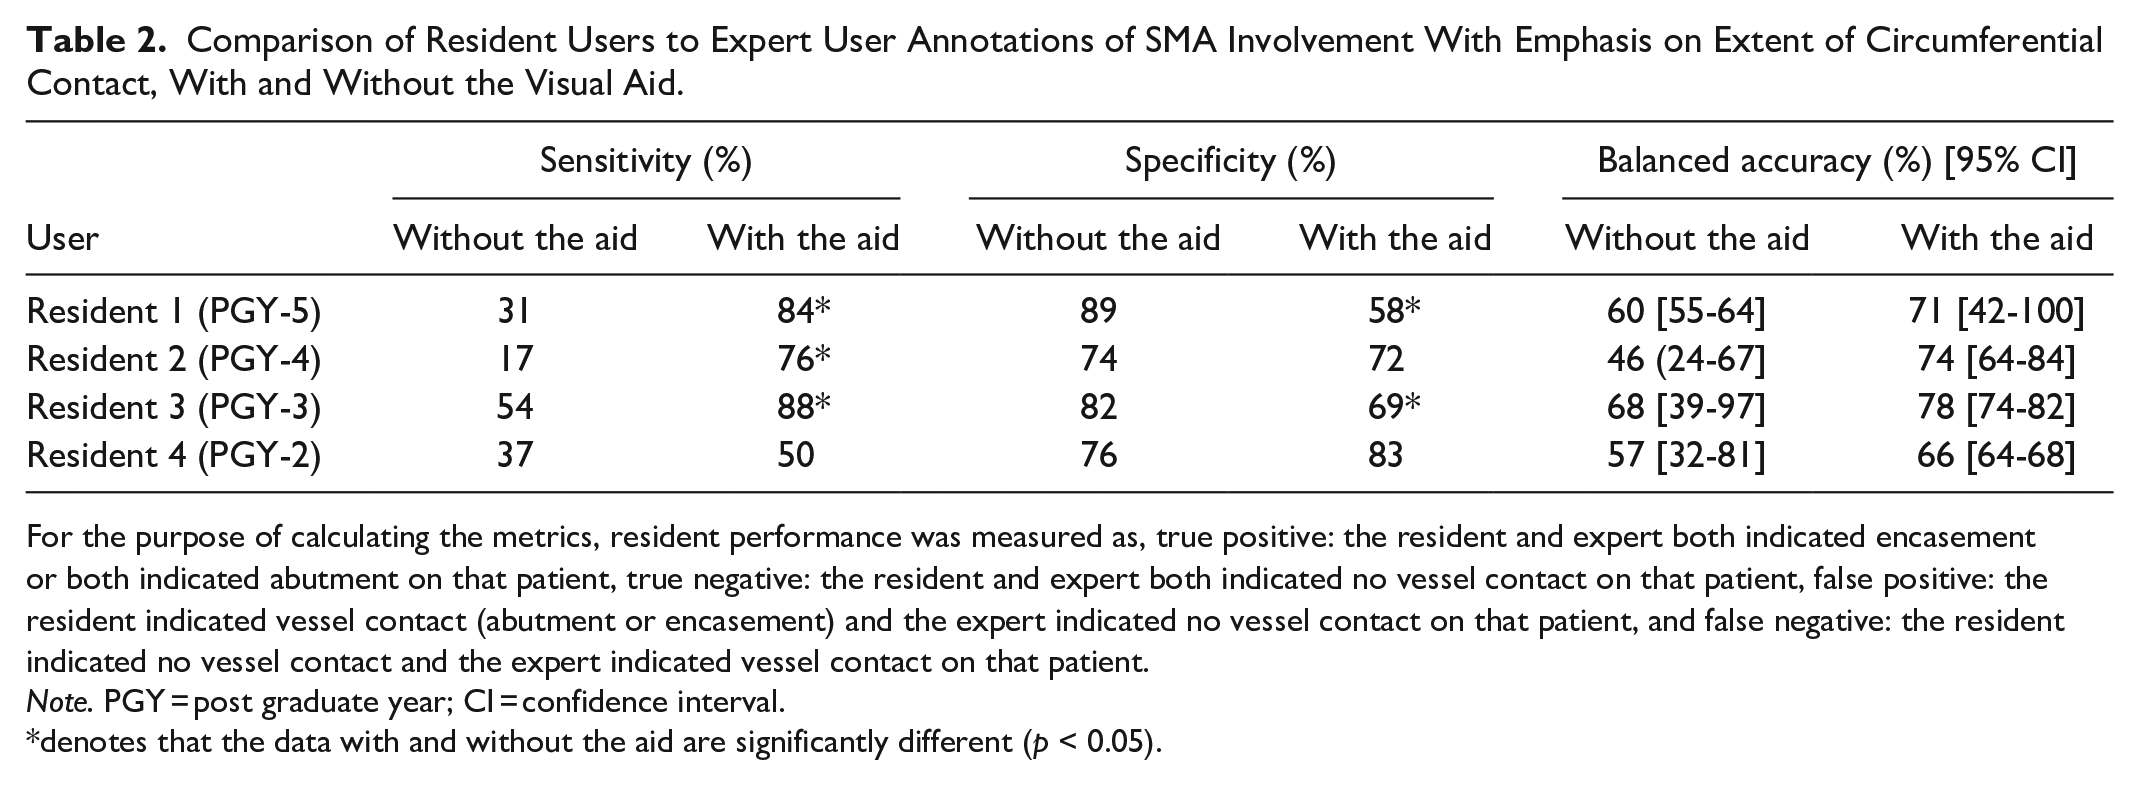
For the purpose of calculating the metrics, resident performance was measured as, true positive: the resident and expert both indicated encasement or both indicated abutment on that patient, true negative: the resident and expert both indicated no vessel contact on that patient, false positive: the resident indicated vessel contact (abutment or encasement) and the expert indicated no vessel contact on that patient, and false negative: the resident indicated no vessel contact and the expert indicated vessel contact on that patient.
Note. PGY = post graduate year; CI = confidence interval.
denotes that the data with and without the aid are significantly different (p < 0.05).
Comparison of Resident Users to the Surgical Pathology Found Around the SMA, With and Without the Visual Aid.
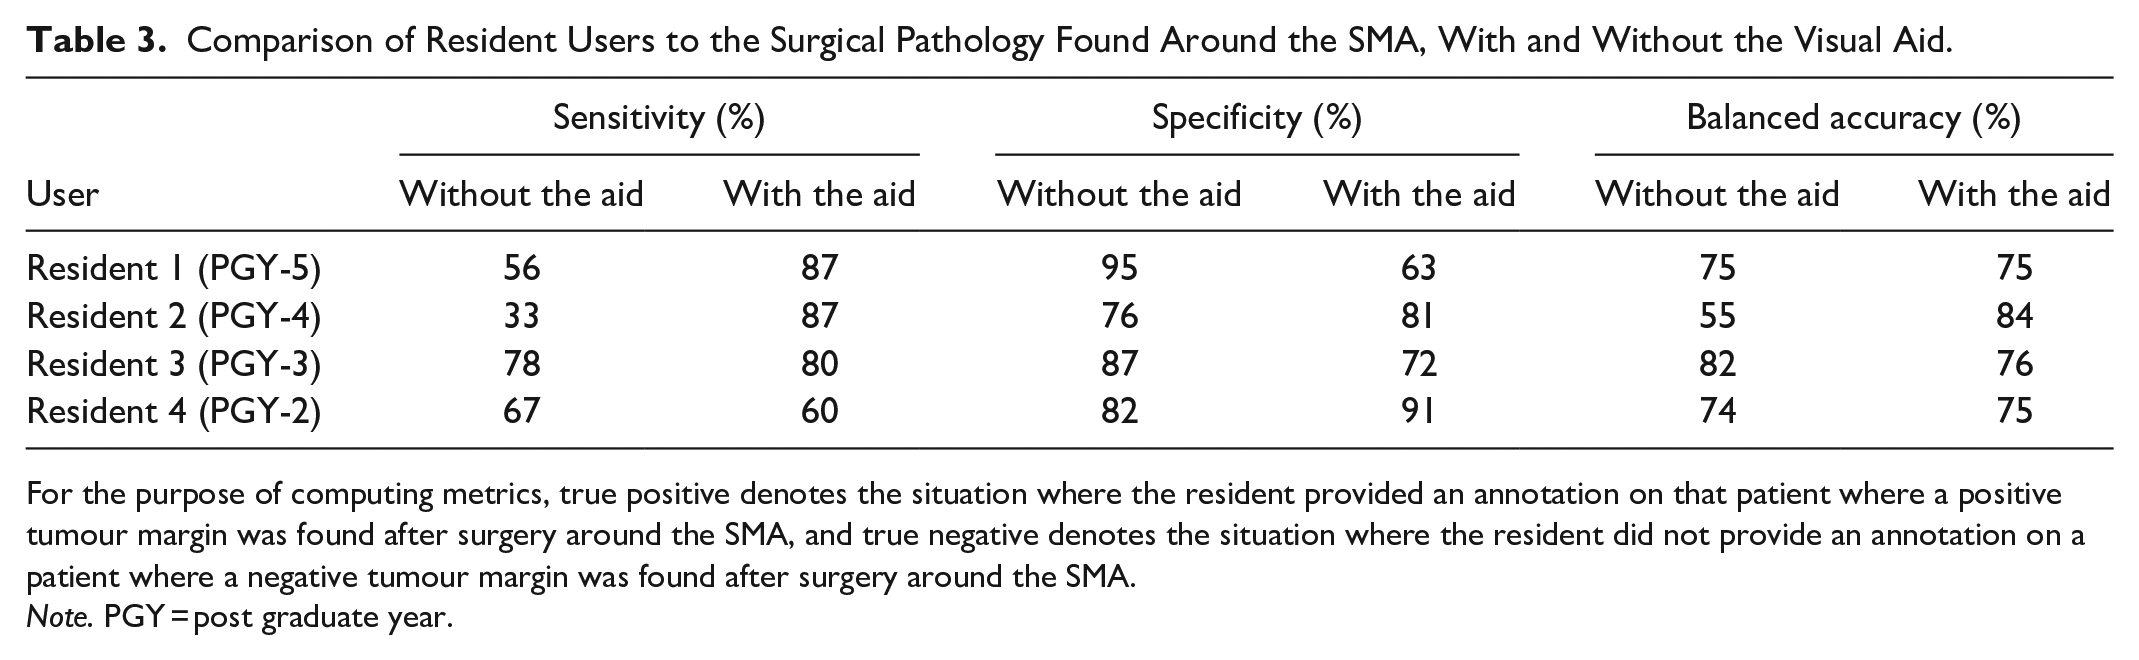
For the purpose of computing metrics, true positive denotes the situation where the resident provided an annotation on that patient where a positive tumour margin was found after surgery around the SMA, and true negative denotes the situation where the resident did not provide an annotation on a patient where a negative tumour margin was found after surgery around the SMA.
Note. PGY = post graduate year.
Annotation Analysis
We found that the median shift of the resident annotations was slightly closer to the expert annotations when using the aid, but not by a substantial amount (mean of 5% with the aid compared to 5.4% without the aid, Table 4). We also found that on average, the resident median annotation size did not change whether the aid was used (mean of 33.2% with and without the aid, Table 4).
Comparison of Resident Users to Expert User Annotations of SMA With Emphasis on Annotation Shift and Size, With and Without the Visual Aid.
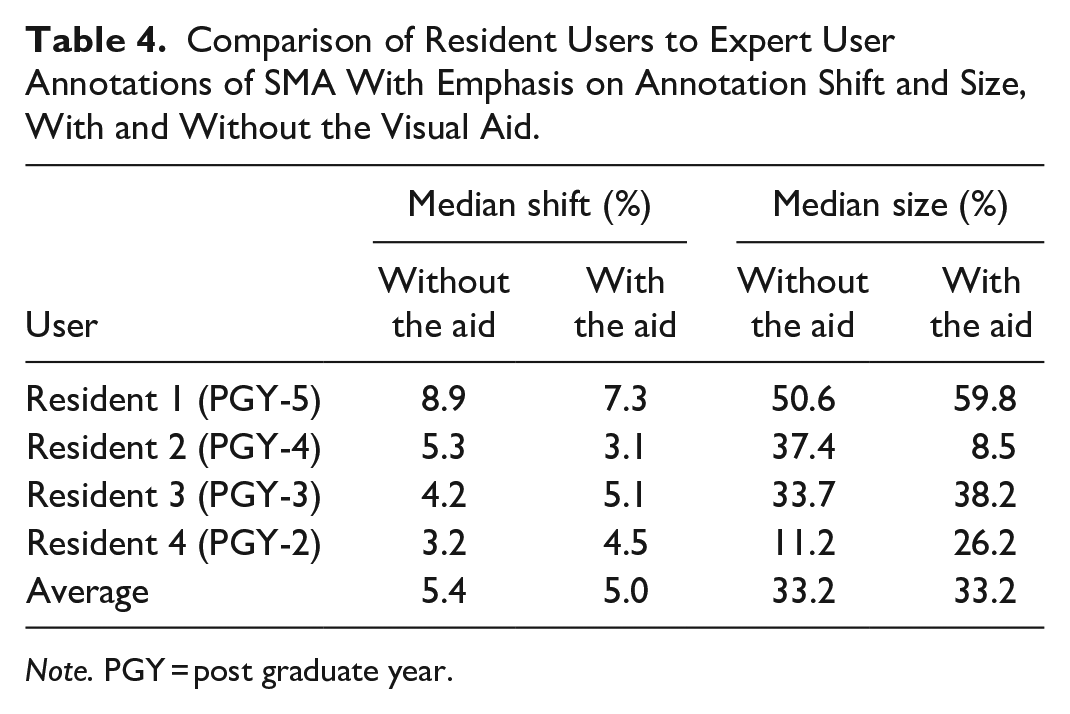
Note. PGY = post graduate year.
Discussion
Presently, our study stands as the sole endeavour assessing the performance of radiology residents in this particular task, and we introduced a visual aid with the intention of enhancing the skills of trainees. Our findings indicate that the density map utilized in this research can effectively identify regions of vascular invasion as marked by expert radiologists, surpassing random chance in performance. Moreover, our results reveal that, on average, the inclusion of the aid leads to heightened sensitivity and balanced accuracy among the residents. Furthermore, the aid’s introduction does not substantially impact the mean shift and size of the residents’ annotations.
Our investigation revealed that the density difference map effectively highlights areas of interest when staging PDAC, including potential vascular involvement adjacent to the SMA. This observation is mirrored in the research conducted by Oikonomou et al, 16 which showcased the efficacy of a visual tool in identifying areas with potential cardiac-related mortality risk. These identified areas of interest encircling vessels for PDAC could be critical in increasing the current 9% survival rate in Canada. 2
While Vasilescu et al 17 explored disparities between resectable and unresectable tumours, our study showcased the applicability of our difference map in distinguishing between these categories, specifically around the SMA. Additionally, Rigiroli et al’s 18 study utilized radiomic features to predict SMA involvement with an AUC of 0.71, where minimal tumour distance from the SMA and the extent of tumour-SMA contact were features of importance, reaffirming their significance in predicting the success of surgical interventions. 8 While both studies are promising approaches that could help circumvent interobserver variability in assessing vascular invasion, they also require a tumour and vascular segmentation. Despite advancements in technology, this assessment of tumour still poses a challenge to radiologists. 10 The challenge with contouring tumour introduces another source of variability which has been shown to affect radiomic features in pancreatic cancer. 19 In our study we only used vascular segmentation, which is a more straightforward task, and aimed to keep the radiologist’s expertise at the centre of determining vascular margins by using a visualization tool. Our approach also achieved a higher AUC of 0.80 for precisely locating expert tumour annotations.
The results of our study show that the aid led to enhanced accuracy among residents in identifying patients with SMA involvement, primarily due to an increase in sensitivity. Furthermore, the rise in balanced accuracy signifies improved overall performance among residents when using the tool. This sensitivity trend is consistently noticeable compared to the surgical pathology for all residents, apart from the PGY-2 resident. This increase in sensitivity was greater for the more experienced residents (PGY 4/5) than the less experienced ones (PGY 2/3), likely based on different amounts of practice with these scans. Moreover, the balanced accuracy also only demonstrated a decrease with the aid for one resident (PGY-3), and this could also be due to their inexperience. The increase in sensitivity and balanced accuracy for the residents when using the aid indicates the tool’s capability to identify soft tissue areas of concern around the vessel on a defined and potentially reproducible scale.
Our findings demonstrate mixed results with regards to specificity. Notably, with the aid, only certain residents displayed improved capacity to identify non-tumour tissue accurately. It is important to recognize that for residents, detecting tumour involvement poses a significant challenge, as evidenced by the low sensitivity and high specificity in the baseline measurements (ie, without the aid). Therefore, heightened sensitivity holds greater importance than improved specificity. Furthermore, the recognition of non-tumour soft tissue abutting a vessel is likely an “easier” concept to learn as a trainee, as opposed to being able to recognize areas of tumour contact. The latter task demands heightened specialization and experience.
Finally, our examination of shift and size patterns demonstrates that, on average, the residents are not generating annotations that significantly deviate in distance or size from the expert annotations. Nonetheless, variations in both size and shift are observable at the individual resident level. This suggests that the impact of the tool on residents’ annotations is not uniform; rather, it is influencing them in diverse ways that are neither universally advantageous or detrimental.
While our findings offer promising implications for the tool’s potential as a learning aid, it’s important to acknowledge some limitations. Firstly, the study’s reliance on data from a single centre and the involvement of only 4 resident participants might constrain the generalizability of the results to other institutions. Also, while limiting the variation in CT acquisition properties could have allowed for a more controlled comparison, we do not expect this variation to affect radiologist performance as it produced real-world examples of CT scans that allowed us to provide a more realistic test condition.
We also recognize that our tool uses subcutaneous fat to calculate the mean fat density per patient, and that this can differ from the mesenteric fat density around the vessel, especially in patients with obstructed lymphatics. 20 While our study did not contain these patients, this may be encountered in the clinic, and therefore we aim to modify the tool to use mesenteric fat to remove this potential bias in future work.
Another constraint lies in the fact that the visual aid tool does not exclusively identify tumours or their specific locations. Rather, it accentuates regions deviating from the mean fat density, potentially encompassing neighbouring vessels or other structures around the SMA. For example, a patient with pancreatitis would have an increase in density on the CT in the perivascular fat because of inflammation of the pancreas, leading to low specificity for our tool. 21 Although this does extend the review time for residents, it also widens the scope for potential areas flagged by the tool, which in turn addresses the observed lower sensitivity performance among residents. In subsequent endeavours, a strategy to enhance specificity could involve the utilization of an automatic segmentation tool to identify non-tumour tissues, thus allowing the aid to exclusively highlight tumour-like regions and limit the use of manual segmentations that we currently use. Additionally, the application of the tool to dark blood CT scans is of interest, as they effectively delineate vessel walls, potentially enhancing automatic segmentation and refining the detection of vascular invasion. 14
Lastly, our team aims to extend the tool’s applicability to other pertinent vessels prone to vascular invasion in pancreatic cancer, or other types of cancer marked by vascular involvement.
Conclusion
In summary, the visual aid tool improves resident performance in the identification of pancreatic cancer-related vascular invasion around the SMA. This is shown by increased sensitivity and balanced accuracy measurements compared to the pathology, on a per-patient basis, and when evaluating the extent of circumferential involvement. As this tool progresses through additional refinement and validation stages, it holds promise as a valuable resource for less experienced radiologists when interpreting staging CT of pancreatic adenocarcinoma.
Supplemental Material
sj-pdf-1-caj-10.1177_08465371231217155 – Supplemental material for A Visual Aid Tool for Detection of Pancreatic Tumour-Vessel Contact on Staging CT: A Retrospective Cohort Study
Supplemental material, sj-pdf-1-caj-10.1177_08465371231217155 for A Visual Aid Tool for Detection of Pancreatic Tumour-Vessel Contact on Staging CT: A Retrospective Cohort Study by Robert Policelli, Salma Dammak, Aaron D. Ward, Zahra Kassam, Carol Johnson, Darryl Ramsewak, Zafir Syed, Lubna Siddiqi, Naman Siddique, Dongkeun Kim and Harry Marshall in Canadian Association of Radiologists Journal
Footnotes
Acknowledgements
We thank the patients who contributed their data to this work; without them, this research would not be possible.
Declaration of Conflicting Interests
The author(s) declared no potential conflicts of interest with respect to the research, authorship, and/or publication of this article.
Funding
The author(s) disclosed receipt of the following financial support for the research, authorship, and/or publication of this article: SD’s graduate student funding was provided by the Government of Ontario and Western University.
Supplemental Material
Supplemental material for this article is available online.
References
Supplementary Material
Please find the following supplemental material available below.
For Open Access articles published under a Creative Commons License, all supplemental material carries the same license as the article it is associated with.
For non-Open Access articles published, all supplemental material carries a non-exclusive license, and permission requests for re-use of supplemental material or any part of supplemental material shall be sent directly to the copyright owner as specified in the copyright notice associated with the article.