
Abstract
Objective:
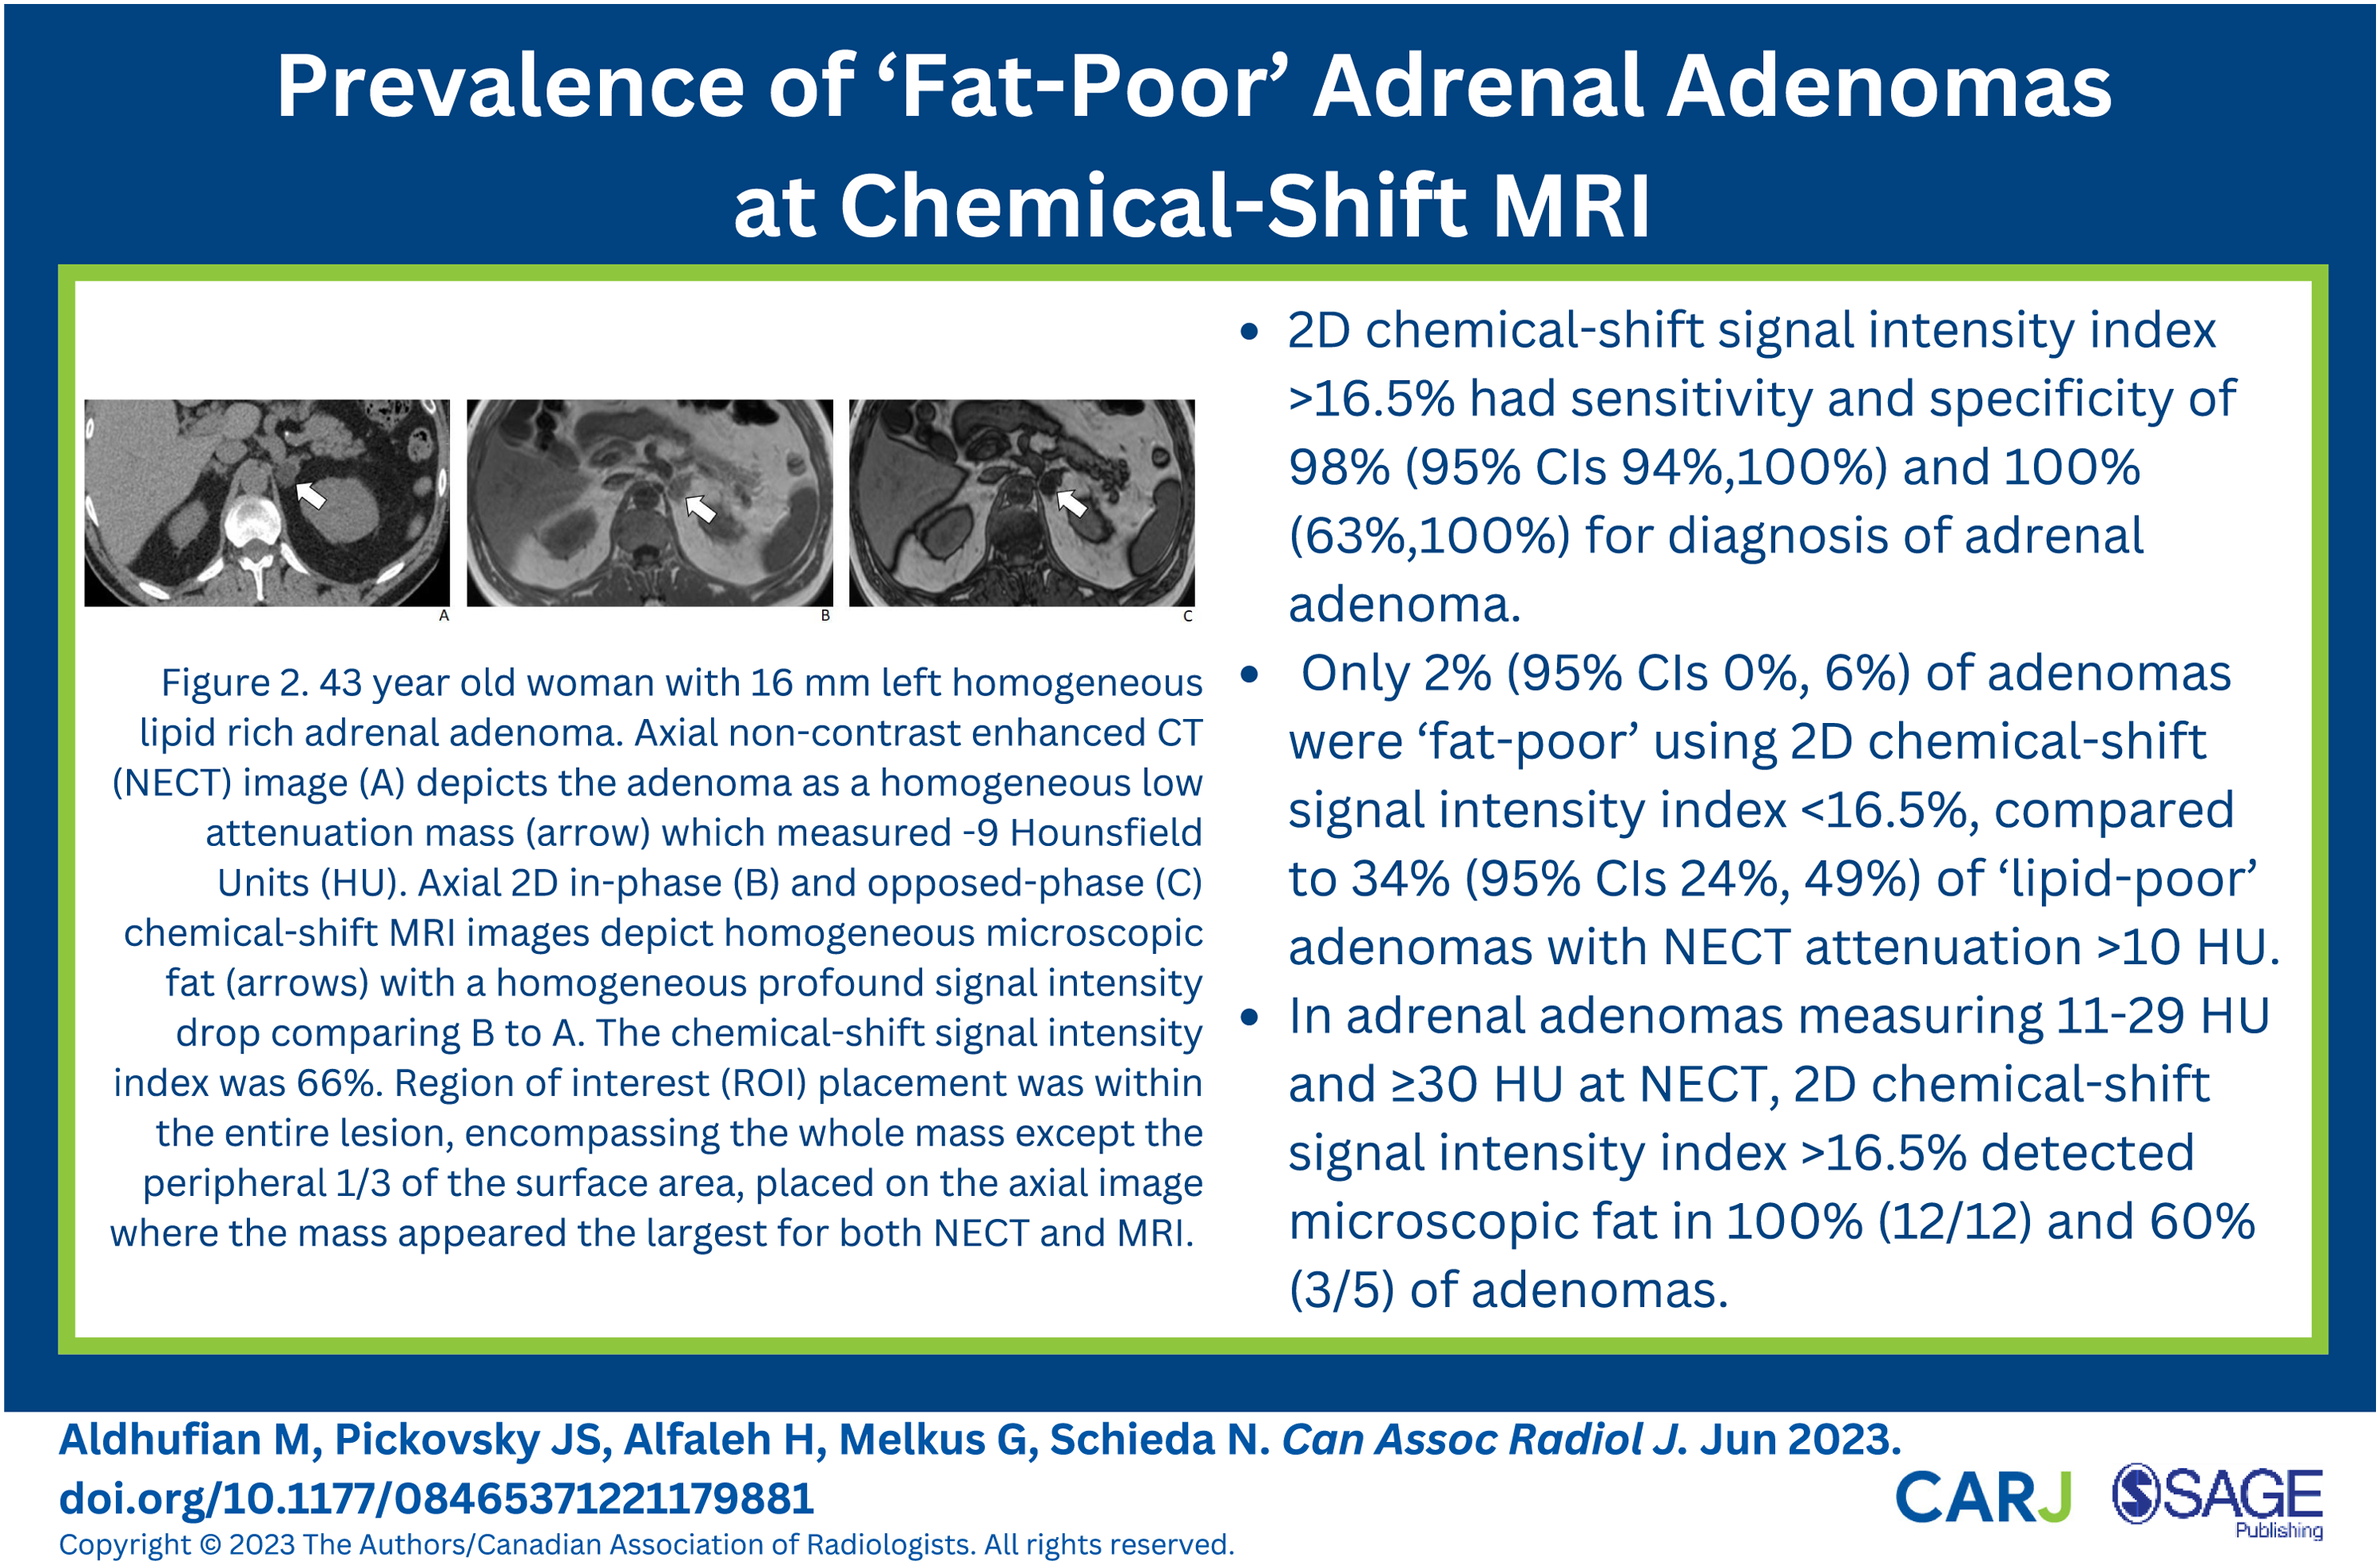
To determine the prevalence of ‘fat-poor’ adrenal adenomas at chemical-shift-MRI.
Materials and Methods:
This prospective IRB approved study identified 104 consecutive patients with 127 indeterminate adrenal masses that underwent 1.5-T chemical-shift-MRI between 2021-2023. Two blinded radiologists independently measured: 1) 2-Dimensionsal (2D) chemical-shift signal intensity (SI)-index on 2D Chemical-shift-MRI (SI-index >16.5% diagnosed presence of microscopic fat), 2) unenhanced CT attenuation (in cases where unenhanced CT was available).
Results:
From 127 adrenal masses, there were 94% (119/127) adenomas and 6% (8/127) other masses (2 pheochromocytoma, 5 metastases, 1 lymphoma). 98% (117/119) adenomas had SI-Index >16.5%, only 2% (2/119) adenomas were ‘fat-poor’ by MRI. SI-Index >16.5% was 100% specific for adenoma, all other masses had SI-Index <16.5%. Unenhanced CT was available in 43% (55/127) lesions (50 adenomas, 5 other masses). 34% (17/50) adenomas were lipid-poor (>10 HU). Percentage of adenomas with SI-Index >16.5% were: 1) ≤10 HU, 100% (33/33), 2) 11-29 HU, 100% (12/12), 3) ≥30 HU, 60% (3/5). No other masses had attenuation ≤10 HU (0/5).
Conclusion:
Fat-poor adrenal adenomas are uncommon using 2D chemical-shift signal intensity index >16.5% at 1.5-T, occurring in approximately 2% of adenomas in this large prospective series.
Introduction
Diagnosis of benign adrenal adenomas on imaging is based predominantly on the ability to detect microscopic fat. Adrenal mass guidelines vary; however, all published guidelines recommend non-contrast enhanced CT (NECT) as the initial imaging test of choice for characterization of indeterminate adrenal masses. 1 An NECT attenuation ≤10 Hounsfield Units (HU) is essentially diagnostic of microscopic fat and highly specific for adrenal adenoma. 2 At unenhanced CT, approximately 30% of adenomas have insufficient microscopic fat (i.e. unenhanced CT attenuation is > 10 HU) and these adenomas are referred to as ‘lipid-poor’. 3 With MRI, microscopic fat is diagnosed either subjectively by noting a visual signal intensity (SI) loss or quantitatively by applying a chemical shift SI index using dual-echo chemical-shift MRI. 4 Previous studies have shown that chemical-shift MRI is more sensitive than NECT for detection of microscopic fat in adrenal adenomas, particularly those that measure <30 HU. 5,6 The yield of chemical-shift MRI is historically considered low in adenomas measuring ≥30 HU. 7
The ability to detect microscopic fat in adrenal adenomas with chemical-shift MRI is highly dependent on technical parameters. Adrenal chemical-shift MRI was first described using 2-Dimensional (2D) spoiled gradient recalled echo (GRE) 8 and, later, with 3D techniques as these were incorporated into clinical practice and adopted for adrenal imaging. 4 2D chemical-shift MRI depicts more microscopic fat compared to 3D imaging. 9,10 The proportion of adrenal adenomas that are ‘fat-poor’ (defined herein as not demonstrating microscopic fat) on chemical-shift MRI is largely unknown. Based upon available data, this number is estimated to represent approximately 10%; 5,6 however, the studies published to date are limited by small sample sizes and biased, non-consecutive cohorts. Moreover, the technical parameters used for chemical-shift MRI are, in some cases, unreported or suboptimal. The purpose of the present study was therefore to determine the proportion of adrenal adenomas which are ‘lipid-poor’ at 2D chemical-shift MRI from a large prospective consecutive sample of indeterminate adrenal masses.
Materials and Methods
Patients
This prospective study was approved by the local research ethics board who waived the need for informed consent. Beginning June 2021, all patients referred for imaging evaluation of an indeterminate adrenal mass at our institution were automatically scheduled by an advanced directive to our booking office with unenhanced MRI. This policy was instituted to address a disproportionate wait-time for CT examinations relative to unenhanced MRI at our institution and an anticipated equipoise MRI for characterization of indeterminate adrenal masses.
11
Patients were included if they had a suitable reference standard for diagnosis (described below) and were imaged using 2D chemical shift MRI at 1.5 T. We excluded patients if: masses had no suitable reference standard (N = 12), masses were <10 mm in size (N = 2), mass contained macroscopic fat (presumed myelolipoma or lipomatous degeneration of adenoma, N = 2) and mass was a presumed adrenal cyst/lymphangioma without histological verification (N = 1). A summary of patient inclusion and exclusion criteria are presented in Figure 1. The database was created and managed by a radiologist with 16 years of experience in abdominal MRI who applied reference standard for diagnosis (see below), measured the short-axis size of each nodule in mm and determined presence of macroscopic fat (NS). STARD flow diagram of patient inclusion and exclusion criteria used in the present study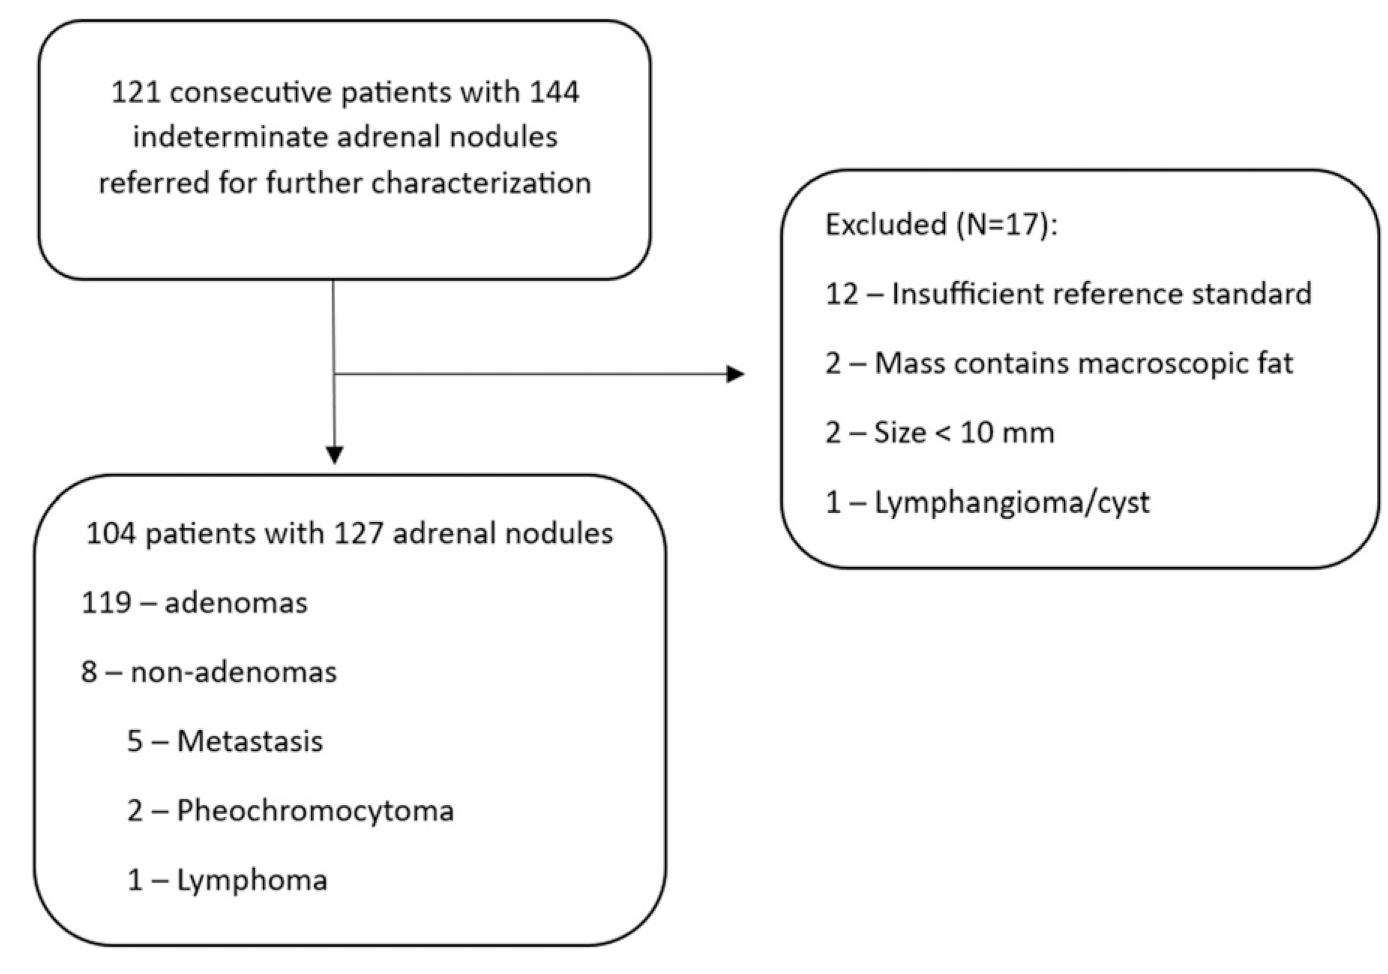
The reference standard for adrenal adenoma was established by: by minimum of 1 year interval stability in size with absence of biochemical evidence of pheochromocytoma 12 (N = 54), by 5 year clinical follow up with no sign or symptom related to adrenal disorder 13 (N = 32) or by presence of microscopic fat (unenhanced CT attenuation <10 Hounsfield Units) 2,12,14 and absence of biochemical evidence of pheochromocytoma (N = 33). There were 8 other masses in this study: metastases (N = 5), pheochromocytoma (N = 2), lymphoma (N = 1). Histopathology (N = 3) was used to diagnose one of the metastases, one of the pheochromocytomas and lymphoma. Biochemical testing with positive iodine-123 meta-iodobenzylguanidine (MIBG) scan was used as the reference standard to diagnose the other pheochromocytoma. The four remaining metastases were diagnosed through positive PET-CT or absolute adrenal washout CT <60% with history of malignancy and >20% growth on follow-up imaging performed within 6 months.
MRI Technique
All MRI were performed using 1.5 T clinical MRI systems (Symphony TIM or Aera, Siemens Healthcare). A summary of the 2D chemical-shift MRI sequence has been published previously(10). In-phase (IP) and opposed-phase (OP) images were acquired together using patient breath-hold for all examinations.
2D Chemical-Shift MRI Assessment
A blinded radiologist with 6 years of experience in abdominal MRI (MA), blinded to all clinical information and the reference standard diagnoses, provided only with location of the adrenal mass, independently evaluated each mass on 2D chemical-shift MRI using institutional PACS (Carestream PACS, Carestream Health Solutions). The radiologist first subjectively evaluated each mass for the presence of microscopic fat, which was defined as non-linear non-curvilinear focal or diffuse SI loss comparing OP to IP chemical-shift images.
15
The radiologist rated the type of microscopic fat as either homogeneous (defined as >80% of the mass showing loss of SI on OP) or heterogeneous (defined as <80% of the mass showing loss of SI on OP) as defined previously.
16
After subjective evaluation, the radiologist placed region of interest (ROI) measurements in the nodule avoiding the edges of the lesion to not include areas of chemical shift artifact of the second kind in the measurement.
17
For nodules that were homogeneous on OP images, the ROI was placed on the axial image where the nodule appeared the largest using an ROI that encompassed 2/3 of the area of the nodule and then copy-pasted onto the IP image at the same level, Figure 2. For nodules that were heterogeneous on OP images, an ROI was placed within the area subjectively showing signal intensity loss on OP images (measuring at least 5 mm in size) and copy-pasted onto the IP image at the same level, Figure 3. The chemical shift SI index (SI index) was calculated for each nodule as follows: ([SI nodule IP - SI nodule OP]/SI nodule IP*100).
18
–20
43 year old woman with 16 mm left homogeneous lipid rich adrenal adenoma. Axial non-contrast enhanced CT (NECT) image (A) depicts the adenoma as a homogeneous low attenuation mass (arrow) which measured −9 Hounsfield Units (HU). Axial 2D in-phase (B) and opposed-phase (C) chemical-shift MRI images depict homogeneous microscopic fat (arrows) with a homogeneous profound signal intensity drop comparing B to A. The chemical-shift signal intensity index was 66%. Region of interest (ROI) placement was within the entire lesion, encompassing the whole mass except the peripheral 1/3 of the surface area, placed on the axial image where the mass appeared the largest for both NECT and MRI. 57 year old man with history of pancreatic cancer and 26 mm left adrenal mass. Axial NECT image (A) depicts the mass as homogeneous and hyper-attenuating. The mass measured 27 HU. Axial 2D in-phase (B) and opposed-phase (C) chemical-shift MRI images depict heterogeneous microscopic fat (thin arrows) within the anterior portion of the mass noting a signal intensity drop comparing B to A. ROI was placed within the anterior portion of the mass on MRI, encompassing as much of the area showing signal intensity drop as possible while avoiding the periphery. The chemical-shift signal intensity index was 64%. 2 year interval stability and negative PET-scan confirmed diagnosis of benign adenoma.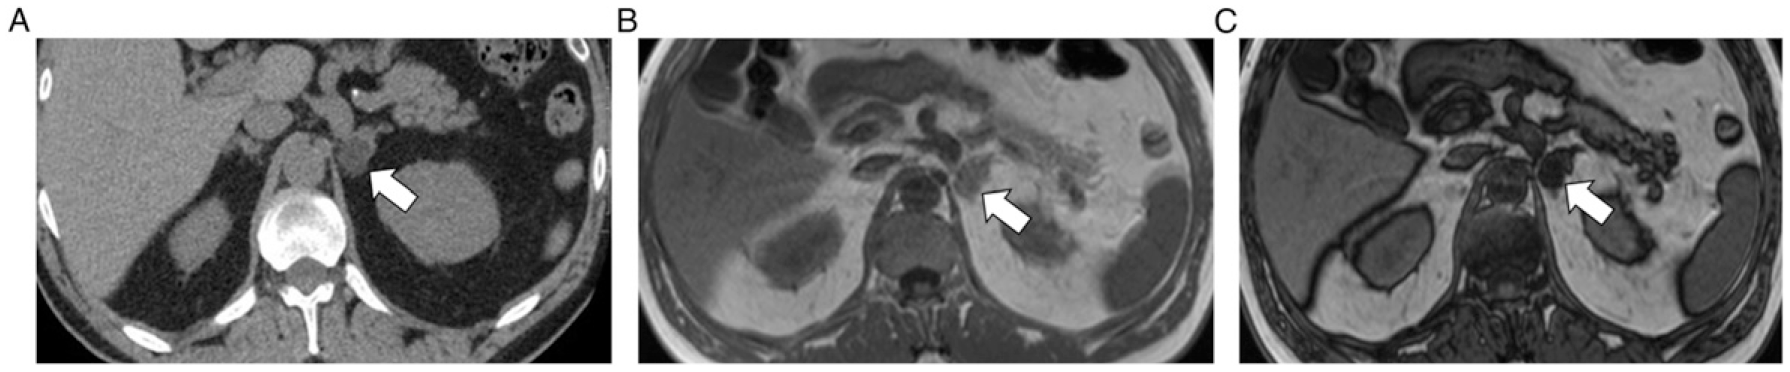
Non-contrast Enhanced CT
In 43% (55/127, 42% [50/119] adrenal adenomas and 63% [5/8] other masses) NECT was available for review in our PACS. All NECT examinations were performed using 120 kVp and variable mAs technique either at the host institution or outside institutions with verifiable technique. No cases of virtual NECT derived from dual-energy or photon-counting techniques were used. NECT examinations were reviewed 2-weeks after MRI assessment to avoid recall bias. The same radiologist, still blinded to all clinical information and the reference standard diagnoses, was instructed to measure the NECT attenuation of adrenal masses by placing an ROI on the center of the nodule using the axial image where the nodule appeared the largest, Figure 2. For adenomas, no time restriction was applied between NECT and MRI provided there was no significant growth of the mass. For non-adenomas, NECT was performed within 1 year of MRI.
Inter-observer Agreement
To determine inter-observer agreement, a second radiologist with 7 years of experience in abdominal MRI (JSP), blinded to all clinical information and the reference standard diagnoses, provided only with location of the adrenal mass, independently evaluated the masses in the same fashion as described above. Since evaluation was primarily only for reproducibility assessment, the second radiologist reviewed all of the adrenal masses which had NECT (N = 55 adrenal masses; 50 adenomas, 5 other masses) and the 2D chemical shift MRI for the same adrenal masses with NECT (N = 55).
Statistical Analysis
Patient demographic factors were tabulated and adrenal mass size recorded. Data presented are from measurements performed by radiologist 1, with measurements from radiologist 2 used to determine reproducibility. For NECT, the mean attenuation of adrenal adenomas and other masses was tabulated and compared between groups using independent t test. The sensitivity and specificity of a ≤10 HU threshold was derived and the percentage of adenomas in the <10 HU, 11-30 HU and >30 HU range tabulated. For 2D chemical-shift MRI, the sensitivity and specificity of a >16.5% HU threshold was derived and the percentage of adenomas which showed >16.5% SI index in the <10 HU, 11-30 HU and >30 HU range tabulated. Comparison of SI index between groups was performed using using independent t test. The number of masses by diagnosis with homogeneous vs heterogeneous microscopic fat was tabulated and inter-observer agreement was evaluated using Gwet’s AC statistic. Inter-observer agreement for quantitative measurements was calculated using Bland-Altman plots.
Results
Patient and adrenal mass demographics from 104 consecutive patients with 127 adrenal masses included in the study.
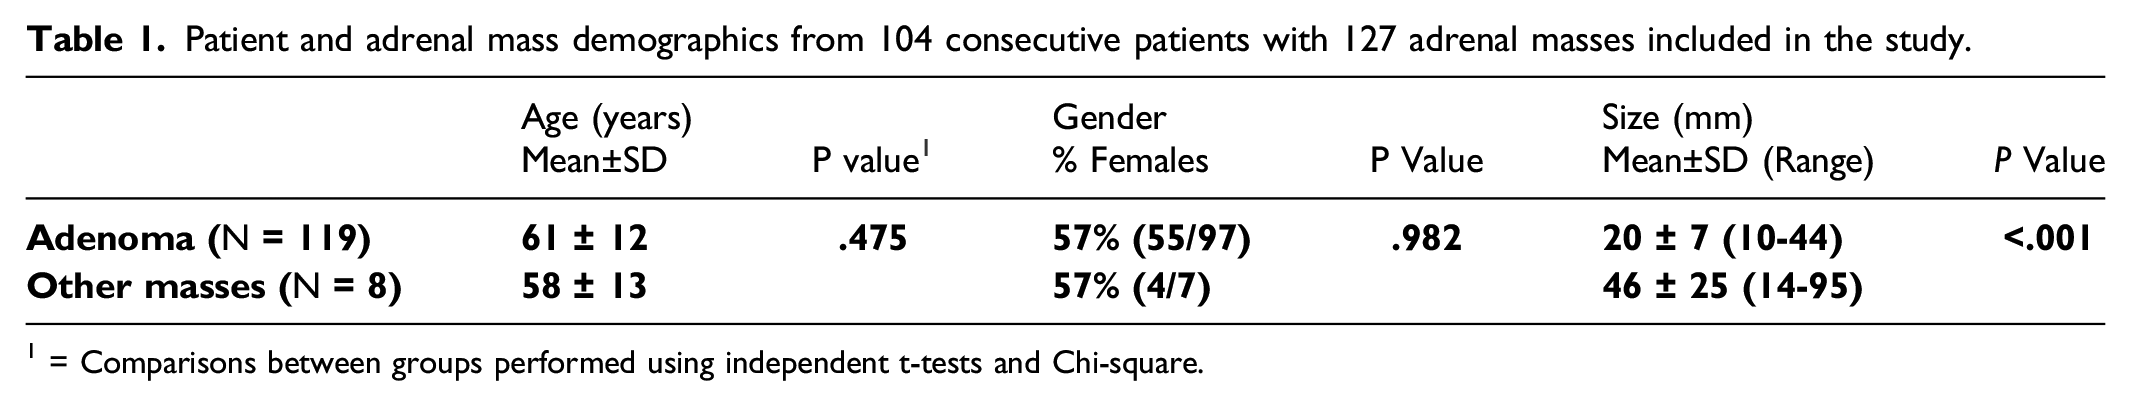
1 = Comparisons between groups performed using independent t-tests and Chi-square.
Non-contrast Enhanced CT
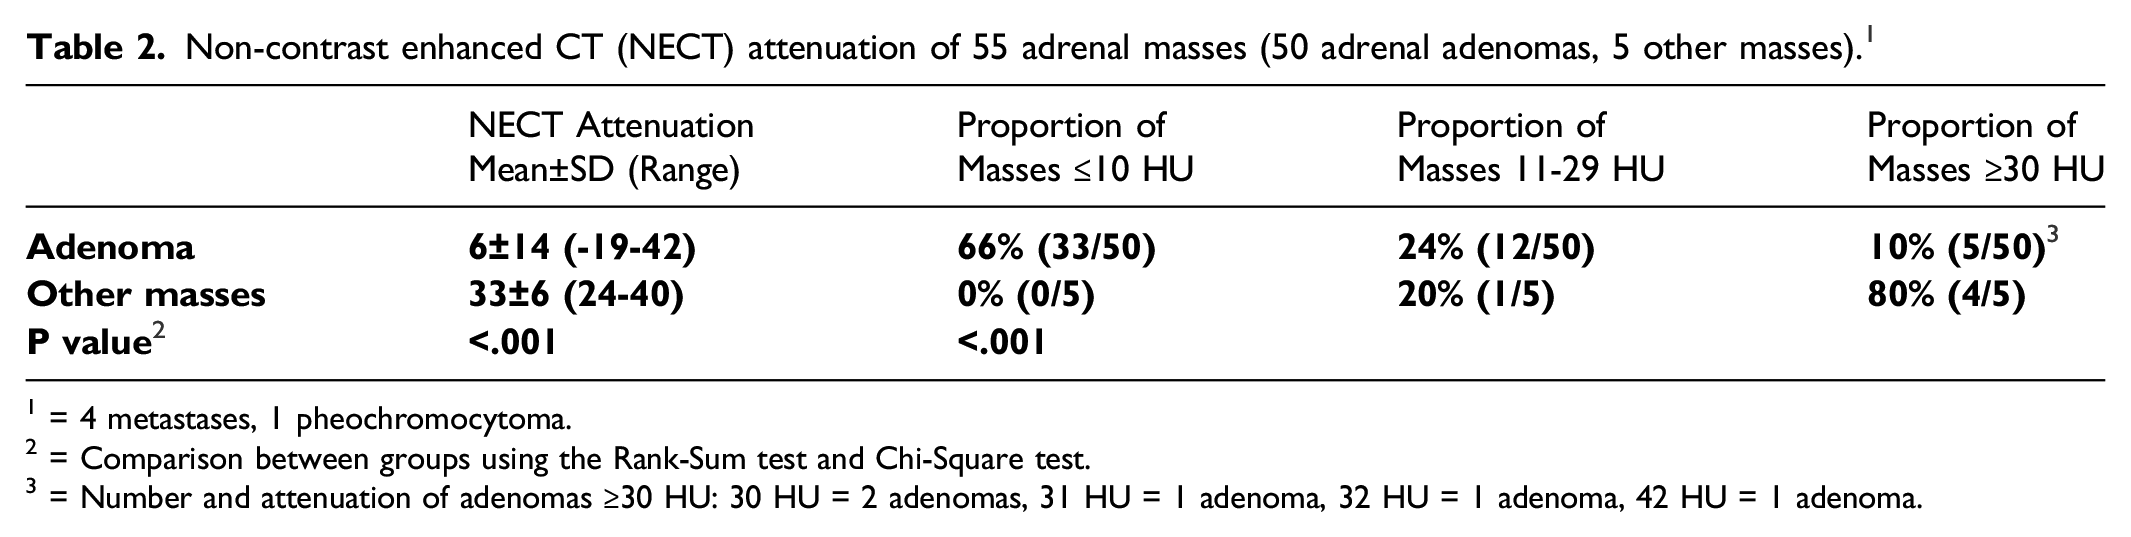
From 50 adrenal adenomas with NECT, mean attenuation was 6 ± 14 (Range −19 to 42) HU compared to 33 ± 6 (Range 24 to 40) HU for 5 other masses with NECT (P < .001). A diagnostic threshold of ≤10 HU had sensitivity and specificity of 66% (95% Confidence Intervals [CIs] 51%,79%) and 100% (48%,100%) for diagnosis of adrenal adenoma, Figure 4. By attenuation grouping, 66% (33/50) of adenomas were ≤10 HU, 24% (12/50) of adenomas were 11-29 HU and 10% (5/50) of adenomas were ≥30 HU, Table 2. Therefore, 34% (17/50) adenomas were ‘lipid-poor’ in this study. Inter-observer variability for NECT measurement was low, mean difference 2.1 HU (95% CIs 0-4HU). Box and Whisker plots for NECT HU (A) and chemical-shift MRI signal intensity index (B) measurements comparing adenomas and other masses. Horizontal lines within boxes represent means, boxes represent inter-quartile range, whiskers represent 2 standard deviations and dots represent outliers. Note that using a NECT HU threshold of 10 HU (dotted line in A) and chemical-shift signal intensity index of >16.5% (dotted line in B) were both 100% specific for diagnosis of adenoma; however, a far greater proportion of adenomas are characterized with MRI compared to NECT. Non-contrast enhanced CT (NECT) attenuation of 55 adrenal masses (50 adrenal adenomas, 5 other masses).
1
1 = 4 metastases, 1 pheochromocytoma.
2 = Comparison between groups using the Rank-Sum test and Chi-Square test.
3 = Number and attenuation of adenomas ≥30 HU: 30 HU = 2 adenomas, 31 HU = 1 adenoma, 32 HU = 1 adenoma, 42 HU = 1 adenoma.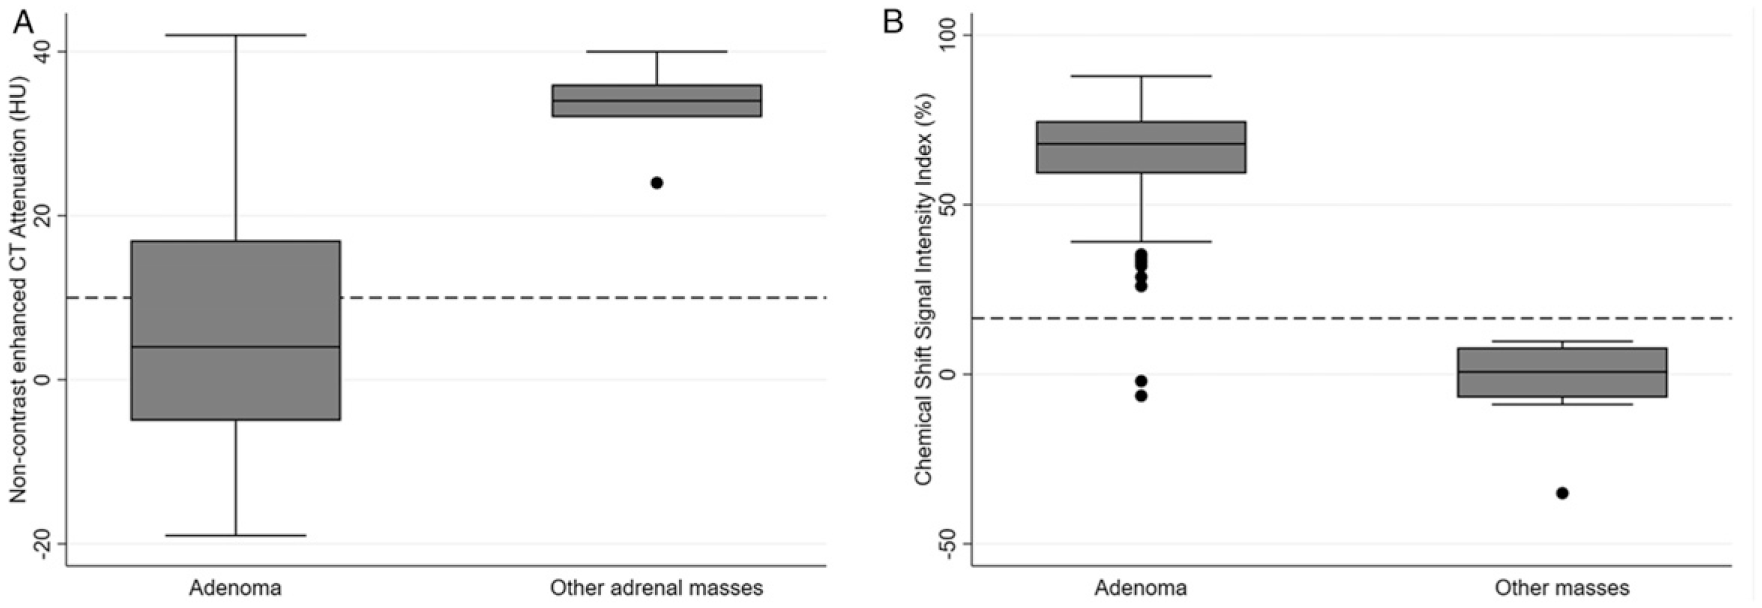
Chemical Shift Signal Intensity Index of 127 adrenal masses including proportion of masses with cross-tabulation to non-contrast enhanced CT (NECT) attenuation.
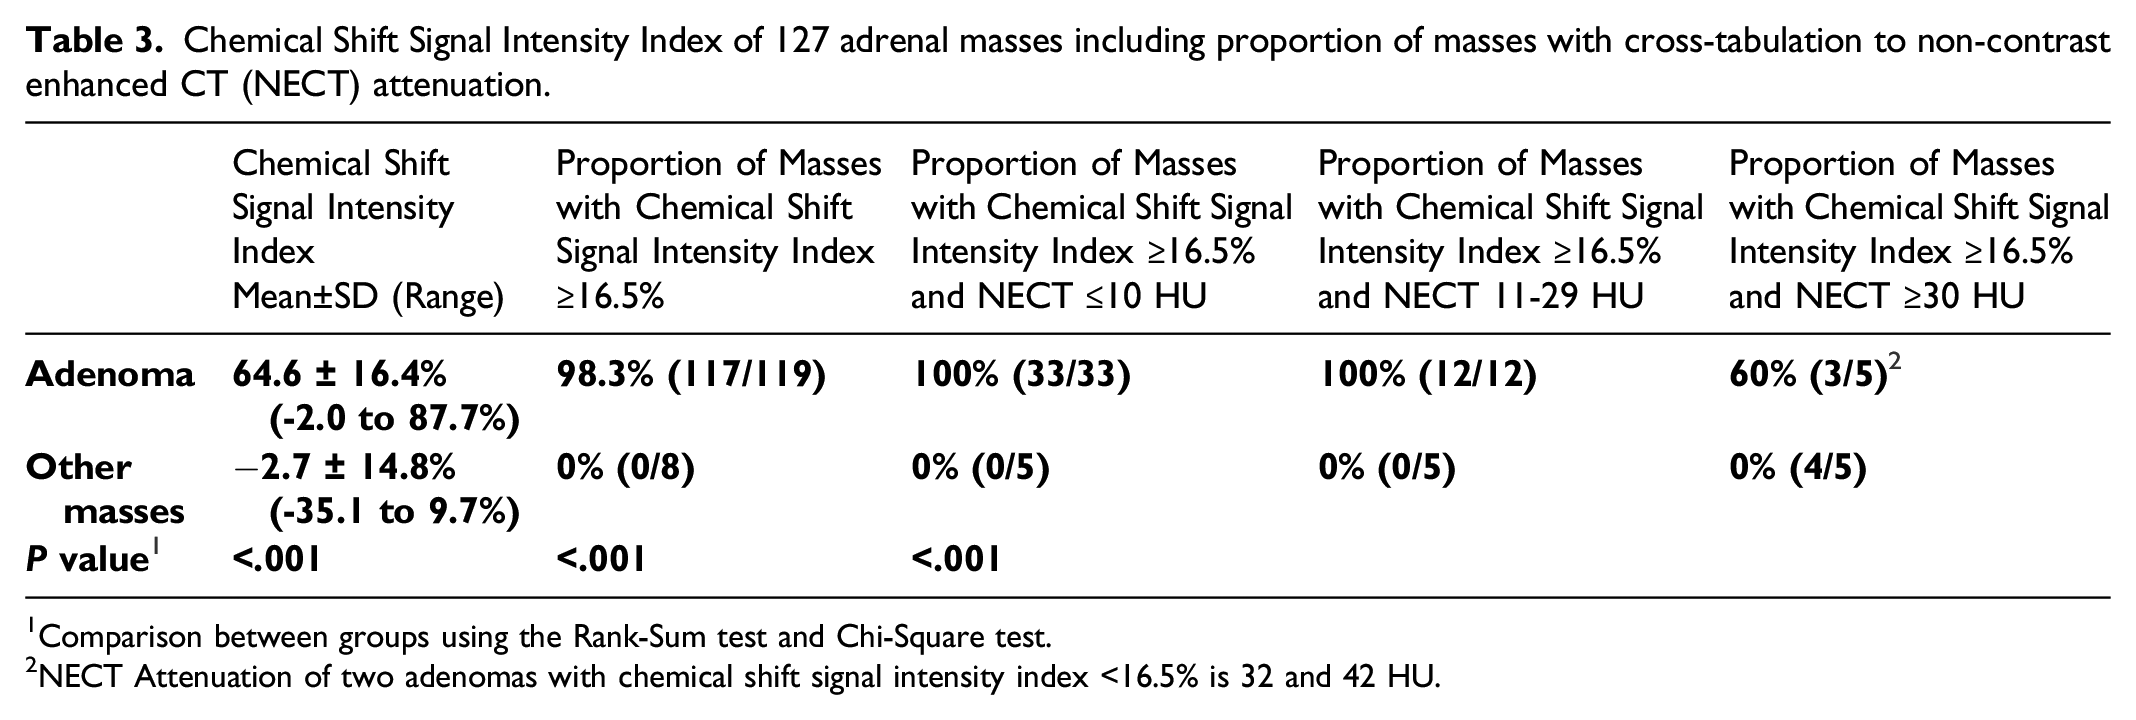
1Comparison between groups using the Rank-Sum test and Chi-Square test.
2NECT Attenuation of two adenomas with chemical shift signal intensity index <16.5% is 32 and 42 HU.
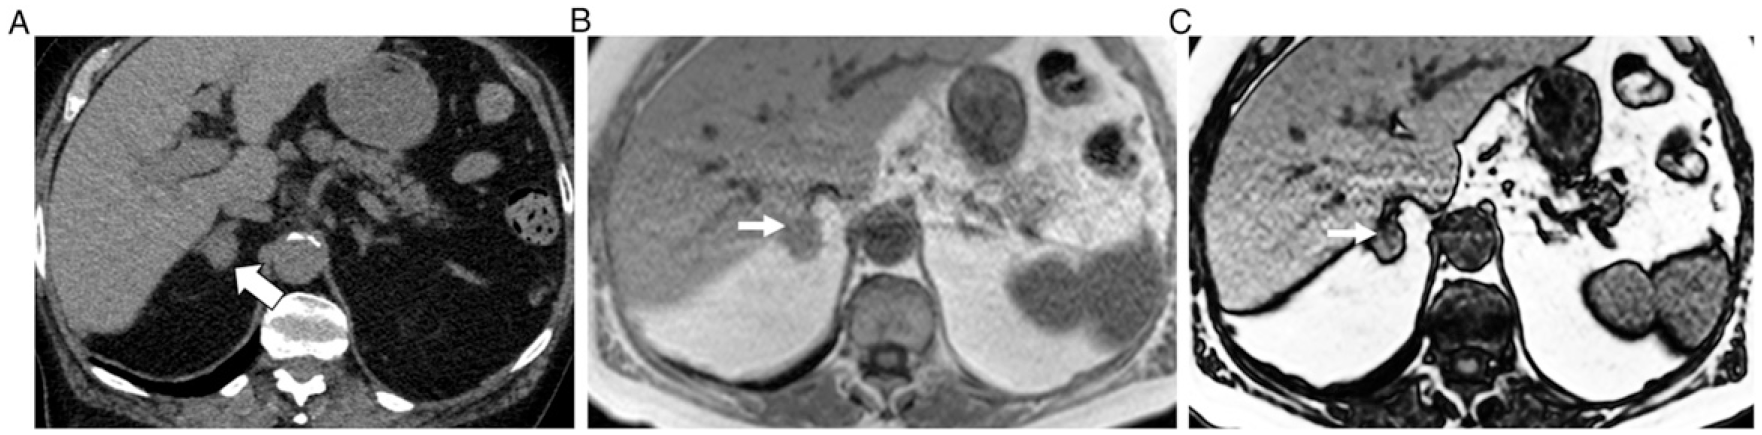
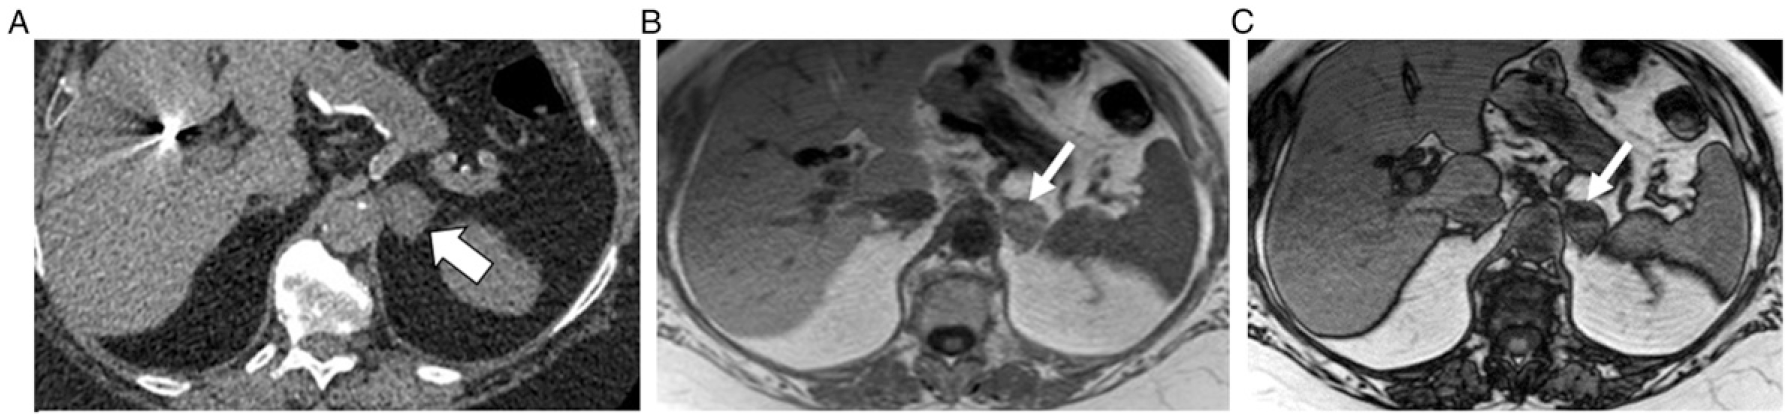
69 year old man with history of colon cancer and 15 mm right adrenal mass. Axial NECT image (A) depicts the mass as homogeneous and hyper-attenuating. The mass measured 31 HU. Axial 2D in-phase (B) and opposed-phase (C) chemical-shift MRI images depict heterogeneous microscopic fat (thin arrows) within the anterior medial portion of the mass noting a signal intensity drop comparing B to A. ROI was placed within the anterior medial portion of the mass on MRI, and the chemical-shift signal intensity index was 32%. 3 year interval stability confirmed diagnosis of benign adenoma.
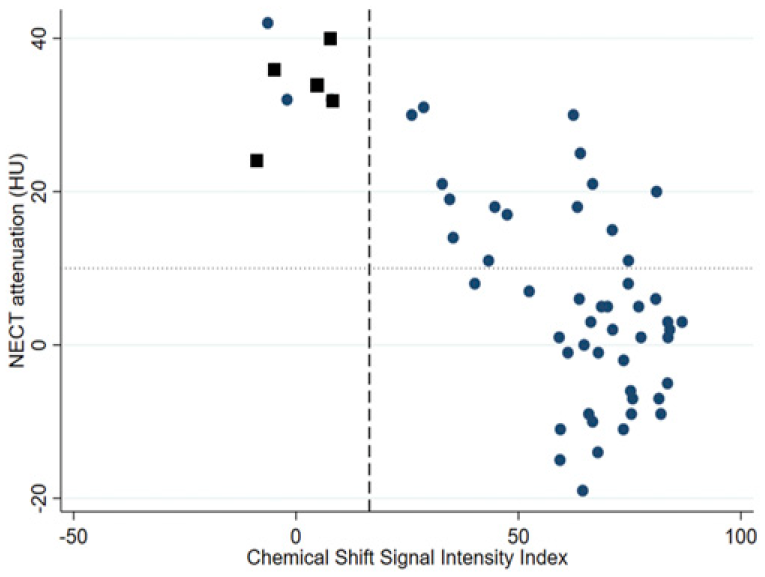
Scatter plot contrasting non-contrast enhanced CT (NECT) attenuation and chemical shift signal intensity (SI) index in 55 masses with both NECT and MRI (50 adenomas – blue circles, 5 other masses – black boxes). NECT attenuation is plotted on the y axis and SI index is plotted on the x axis with dotted horizontal line at 10 Hounsfield Units (HU) and dashed vertical line at 16.5%, which are diagnostic thresholds for adenoma at CT and MRI respectively. The four quadrants of the plot demonstrate: bottom right corner = number of masses with NECT ≤10 HU and SI index >16.5%, top right corner = number of masses with NECT >10 HU and SI index >16.5% and top left corner = number of masses with NECT >10 HU and SI Index >16.5%.
Discussion
This study prospectively evaluated the prevalence of ‘fat-poor’ adrenal adenomas on chemical-shift MRI using a 2D technique at 1.5 T and a signal intensity threshold of >16.5% to diagnose microscopic fat. Data available in the literature regarding the number of ‘fat-poor’ adrenal adenomas on chemical-shift MRI are limited by small, retrospective, biased, case-control study designs and by limitations in chemical-shift MRI technique. In our prospective series of over 100 adrenal adenomas, the vast majority depicted microscopic fat on chemical-shift MRI, such that only 2% were considered ‘fat-poor’. Moreover, the signal-intensity index threshold of 16.5% was 100% specific for diagnosis. Compared to non-contrast enhanced CT, microscopic fat was depicted in far more adrenal adenomas, since roughly one-third of adenomas were ‘lipid-poor’ at CT. All adenomas measuring 10-29 HU and two-thirds of adenomas measuring ≥30 HU had microscopic fat on chemical shift MRI. Our results would indicate that chemical-shift MRI is a superior test compared to NECT for the characterization of indeterminate adrenal masses by the presence of microscopic fat.
It is well known that approximately 30% of adrenal adenomas are ‘lipid-poor’ on NECT 3 and these results are concordant with the rate of ‘lipid-poor’ adenomas in our study. From five published guidelines on approaching incidental adrenal masses, all advise using unenhanced CT as an initial imaging test, since homogeneous low attenuation (10 HU or less) is suggestive of adenoma particularly in masses <4 cm in size. 1 Furthermore, the American College of Radiology (ACR), American Association of Clinical Endocrinologists and American Association of Endocrine Surgeons (AACE/AAES), Canadian Urological Association (CUA) and Korean Endocrine Society (KES) all advise performing NECT as the initial imaging test for characterization of an indeterminate adrenal mass. Only the KES and ESE advise MRI first in pregnant women, children and adults under 40 years of age instead of CT whenever possible. 1
Studies have repeatedly demonstrated that chemical-shift MRI is more sensitive than NECT for depiction of microscopic fat; 4 yet, the proportion of ‘fat-poor’ adenomas on MRI is unknown. The rate of ‘fat-poor’ adenomas on chemical-shift MRI has been reported to be as low as 10% 5,6,21 and as high as 33%. 22 However, these studies are biased because they focus primarily on hyperattenuating or ‘lipid-poor’ adrenal masses (i.e., >10 HU at NECT) in patients who received both NECT and chemical-shift MRI (which is not common for characterization of adrenal adenomas). Thus, the literature to date does not represent the natural prevalence of disease in the general population. Moreover, chemical-shift MRI technique is crucial for adequate depiction of microscopic fat and studies to date have suffered from technical limitations. For example, in the study by Sebro et al which reports that only 33% of adenomas measuring >30 HU will show microscopic fat on chemical-shift MRI; however, it is unclear in this study, whether 2D imaging, 3D imaging or both were used and what flip angle was selected. 2D chemical shift MRI has been shown to be more sensitive than 3D techniques for depiction of microscopic fat in adrenal adenomas with better image quality. 10,23 Yet, even in the study by Sebro et al, over 2/3 of adenomas which would have been considered indeterminate at NECT (i.e., >10 HU) had microscopic fat on MRI. 7 In a study by Hekimsoy et al., 24 2D chemical shift MRI at 1.5 T characterized 100% of adenomas correctly, outperforming 2D imaging at 3 T and 3D imaging. The use of a higher flip angle with 3D imaging may more closely match performance of 2D imaging for depiction of microscopic fat at 1.5 T 1; 10 however, with 2D imaging still yielding higher image quality. A signal intensity index threshold of 16.5% is also derived for use at 1.5 T and, although applied liberally at 3 T may require modification with a lower proposed threshold at higher field strength. 25 In another 2022 retrospective study by Martins et al., 26 only 4-5% (compared to 31% at NECT) adenomas were fat poor at chemical-shift MRI.
Another factor which may influence performance of chemical shift MRI for depiction of microscopic fat when using the chemical shift signal intensity index is placement of ROI. For example, prior studies have placed a circular ROI that is ‘as large as possible’ or to sample the entire adrenal mass on a representative axial slice or axial slice where the mass appeared the largest. 5,21,22 This technique works well for the majority of adenomas which show homogeneous signal intensity loss on opposed phase images (homogeneous distribution of microscopic fat); however, may underestimate the presence of microscopic fat when it is distributed inhomogeneously. For example, in an adrenal adenoma which contains a small focus of microscopic fat, a circular ROI encompassing the whole mass may yield a signal intensity index below the 16.5% threshold required for diagnosis by averaging higher signal pixel values into the mean measurement. While microscopic fat can rarely be encountered in other adrenal masses such as metastases from a fat containing primary tumour (e.g. hepatocellular carcinoma, renal cell carcinoma), 27 collision tumour 16 and adrenal cortical carcinoma, 28 diagnosis can usually be inferred from clinical history or other imaging features. Among incidental adrenal masses, heterogeneous microscopic fat has been shown to be highly specific for benign adrenal masses. 16,29 Using a large ROI which encompasses the whole mass on the center or a representative slice would therefore almost certainly reduce the sensitivity of the signal intensity index for diagnosis and could be overcome by using subjective analysis or by placing the ROI within the area of the mass which is subjectively losing signal on opposed phase images. This point may not be trivial, since, roughly one-third of adenomas in our study had heterogeneous microscopic fat.
Our study has limitations. The prevalence of adrenal adenomas among consecutive incidental and indeterminate adrenal masses is very high and thus, the pre-test probability of adenoma in any study evaluating consecutive adrenal masses will influence the reported results and diagnostic test accuracy. However, since the primary purpose of this study was to determine the prevalence of ‘fat-poor’ adenomas on chemical shift MRI, this point becomes less important in our study. Despite the relatively large number of consecutive adrenal masses, the number of non-adenomas is low and diagnoses heterogeneous. This can be expected given vast discrepancy in proportion of adrenal adenomas to other masses among incidental and indeterminate adrenal masses, even in higher risk populations. 12 The specificity of diagnosis of adenoma using an NECT threshold of 10 HU and chemical-shift signal intensity index of 16.5% was 100%; however, it is known that rarely, other benign and malignant adrenal masses can simulate adenomas at NECT 30,31 and chemical-shift MRI. 32 The reference standard for adenoma was based upon clinical standards rather than histology. This is a necessary limitation given the conservative management strategy used for indeterminate adrenal masses. We used NECT <10 HU as a reference standard for diagnosis of adenoma based upon near 100% specificity published in the literature, 2 yet, we acknowledge this is suboptimal for reported diagnostic test accuracy metrics of NECT in our study. Cost and access to CT vs MRI may influence the choice of which diagnostic test to pursue first, in addition to diagnostic performance, and may be unique to a particular country or geographic location potentially influencing choice of imaging.
In conclusion, this prospective consecutive cross-sectional study evaluating a large number of indeterminate adrenal masses reports the prevalence of ‘fat-poor’ adrenal adenomas at 2D chemical-shift MRI performed at 1.5 T using a 16.5% signal intensity index threshold to be very low. Only 2% (95% CIs 0%, 6%) of adrenal adenomas were ‘fat-poor’ with 100% specificity for diagnosis (95% CIs 63%, 100%). Comparatively, approximately 30% of adrenal adenomas were ‘lipid-poor’ at NECT which compares well with this widely established proportion in the literature. Our data suggest that chemical-shift MRI, when optimized for depiction of microscopic fat in adrenal masses, may be a better first-line imaging test for diagnosis of adrenal adenoma in indeterminate adrenal masses when characterization is dependent on detection of microscopic fat.
Footnotes
Declaration of Conflicting Interests
The author(s) declared no potential conflicts of interest with respect to the research, authorship, and/or publication of this article.
Funding
The author(s) received no financial support for the research, authorship, and/or publication of this article.