
Abstract
The past two decades have seen a significant increase in the use of CT, with a corresponding rise in the mean population radiation dose. This rise in CT use has caused improved diagnostic certainty in conditions that were not previously routinely evaluated using CT, such as headaches, back pain, and chest pain. Unused data, unrelated to the primary diagnosis, embedded within these scans have the potential to provide organ-specific measurements that can be used to prognosticate or risk-profile patients for a wide variety of conditions. The recent increased availability of computing power, expertise and software for automated segmentation and measurements, assisted by artificial intelligence, provides a conducive environment for the deployment of these analyses into routine use. Data gathering from CT has the potential to add value to examinations and help offset the public perception of harm from radiation exposure. We review the potential for the collection of these data and propose the incorporation of this strategy into routine clinical practice.
Introduction
The increased use of computed tomography (CT) has triggered concern over its radiation exposure. An analysis in Italy showed that the increase in usage was largely due to growth in emergent head and elective body CT, which contributed to a 42% increase in the per capita effective dose over 10 years. 1 However, the increase in CT usage, despite causing a higher radiation exposure to the population, has benefited patient care greatly. 2 CT examinations may produce large amounts of data that are not utilized in main clinical indications, but they hold a potential in prognostication and risk stratification. Studies have demonstrated the value of such data in quantitative evaluations of coronary arteries, soft tissues, bones and lung parenchyma. This information may be used to create individualised risk profiles and prognosticate the outcome of certain groups, such as the elderly or those with malignancies. Therefore, this review aims to provide an overview of the different CT quantitative biomarkers.
Brain Volume and Intracranial Arterial Calcification
Cognitive decline is part of ageing. 3 This mental condition usually affects the elderly at different levels according to individual. 4 Both low baseline brain volume and longitudinal rate of volume loss assessed through magnetic resonance imaging (MRI) have been shown to be predictive factors of cognitive decline in the elderly. 5 Generalised brain volume reduction has also been shown to be useful in prognosticating cognitive decline in a variety of brain diseases. They include multiple sclerosis and schizophrenia, as well as cancer.6-8 Although not as extensively studied as MRI volumetry, CT volumetry can utilise similar segmentation techniques at lower cost and faster acquisition time. 9 Therefore, CT brain volumetry may provide the opportunity for early detection and intervention to arrest cognitive decline.
Intracranial arterial calcification (IAC) has the potential to predict the risk of stroke. There are two methods to assess IAC: the modified Woodcock visual score (MWVS) and the Agatston–Janowitz calcium score (AJCC). 10 The MWVS is a four-point scoring system that qualitatively categorises vascular calcification by morphology and was developed for use in cervical carotid arteries. 11 In contrast, the AJCC is a quantitative method for calcium scoring of coronary arteries that has been adopted by various coronary CT software suites. 12
A large population study by Bos et al. 13 (2014) found that the severity of intracranial carotid artery calcification is associated with an increased risk of stroke. This risk was independent of other risk factors and contributed to 75% of all acute stroke cases. In addition, Quiney et al. 14 (2017) showed that the presence of IAC in a specific vessel may also increase the risk of downstream acute ischaemic stroke by a factor of 2.5. The same study found that non-calcified plaque had higher risk of causing downstream stroke or a transient ischaemic attack (TIA) relative to calcified lesions, highlighting the limits of calcified plaque evaluation in the risk stratification of patients with intracranial ischaemia. The assessment of non-calcified plaque, however, requires the administration of intravenous contrast media, thereby limiting its use in asymptomatic patients. The benefits of aggressive therapy in patients with symptomatic intracranial atherosclerosis have been well-documented. 15
Breast Density
Increased fibroglandular tissue visualised as mammographic breast density (MBD) is an independent risk factor in the development of breast cancer. 16 MBD is visually evaluated using the qualitative American College of Radiology (ACR) Breast Imaging Reporting and Data system (BI-RADs), which classifies a mammogram into four categories. 17 As screening is carried out only in populations above age 40, the value of evaluating breast density in younger subjects remains unknown.
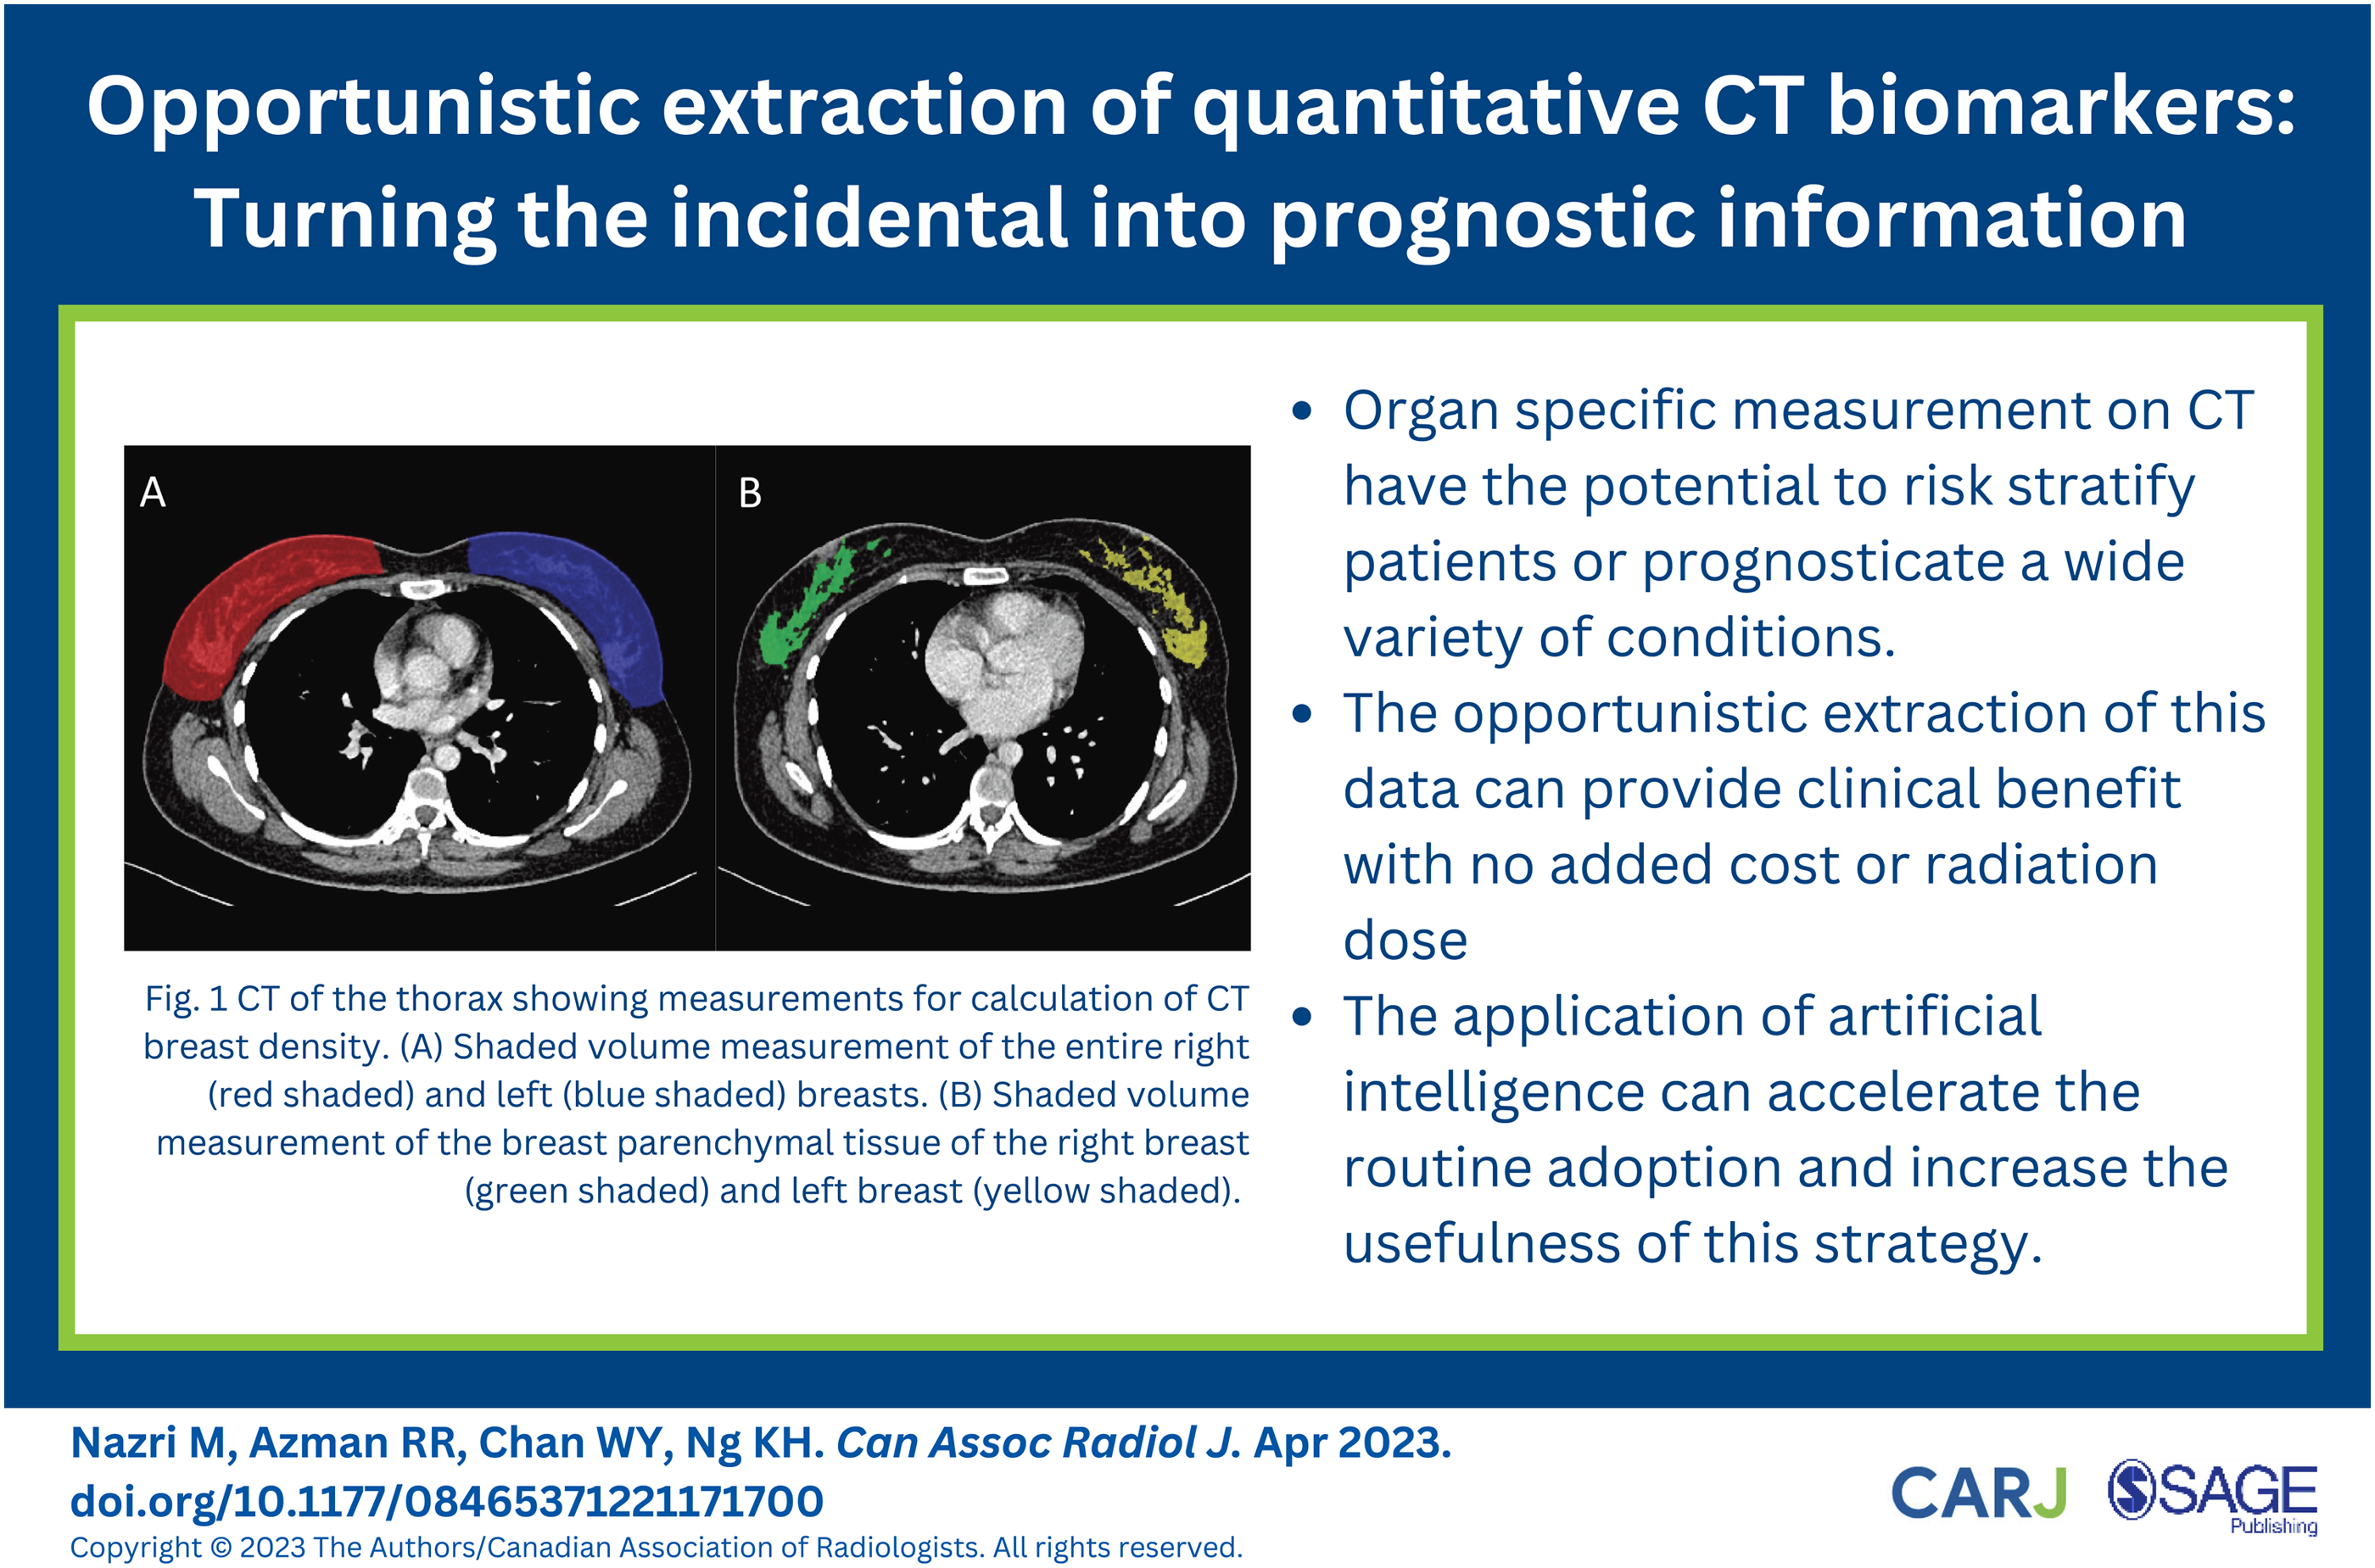
Several studies have shown that MRI breast density assessment may correlate well with the visual assessment of mammograms. 18 The use of MRI in large populations, however, is limited by cost and access to machines. Hence, the increasing use of CT may provide an alternative to assess breast density in populations younger than 40 years. CT measurements of breast density have been shown to correlate well with both visual and quantitative assessments of mammograms. However, due to poor separation between breast and chest wall fat, the anatomic landmarks used for the segmentation of breast boundaries remain a challenge for accurate and reproducible segmentation. 19 Studies have found that CT-based estimates of breast density tend to be lower than mammographic density.20,21 A study by Chen et al. 22 (2016) that evaluated patients undergoing low-dose CT for lung cancer screening found that CT breast density measurement could be well correlated with MRI measurement. The study also showed that CT breast density might be reproducibly obtained using a semi-automated technique from routine thoracic examinations. When obtained from large populations, this information can be incorporated into risk assessment models to guide screening programs. See Figure 1.
Coronary Artery Calcification and Epicardial Fat
Coronary artery calcium scoring (CACS) utilises software that evaluates both volume and peak density of coronary artery calcification. 12 This score is usually acquired from dedicated ECG-gated cardiac CT data and is a strong independent predictor of cardiovascular events, regardless of gender and ethnicity. 23 Several studies have evaluated the measurement of CACS in non-gated low-dose CT of the chest in lung cancer screening and validated the scores using ECG-gated CT.24,25 Wu et al. (2008) demonstrated that non-gated low-dose CT thorax had a negative predictive value of 98 to 99% for coronary artery calcifications. The study also showed that although the absolute calcium score in non-gated scans had a variability of up to 43% compared with ECG-gated scans, there was a high degree of concordance in designating the four-score ranks used in risk stratification. A more recent study by Hutt et al. 26 (2016) demonstrated that non-gated CT was able to detect coronary artery calcium with a sensitivity of 96.4% and specificity of 100%.
These studies suggest that the evaluation of coronary artery calcium in non-gated CT of the thorax may produce similar results with dedicated ECG-gated cardiac CT. Potential benefits of CACS in the asymptomatic population has been shown in large lung cancer screening trials. The National Lung Cancer Screening Trial (NLST) and the Dutch–Belgian Randomised Lung Cancer Screening Trial (NELSON) found that the presence of coronary artery calcium is predictive of cardiovascular events and death. 27 The routine reporting of CACS may provide an opportunity to estimate cardiovascular risk in the general population.
Multiple studies have shown the association between atrial fibrillation (AF) and increased epicardial fat.28,29 This association was observed to be independent of other risk factors for AF, such as raised body mass index, hypertension, age and visceral fat deposition. 30 A meta-analysis of 63 studies found that a one standard deviation increase in epicardial fat could cause a 2.6-fold increase in the risk of developing AF, which was greater than the risk conferred by having increased abdominal fat or total adipose tissue. 31 Evaluation of epicardial fat in CT has an advantage over echocardiography by being able to measure volume and use segmentation software to automate the process.
Liver Volume and Fat
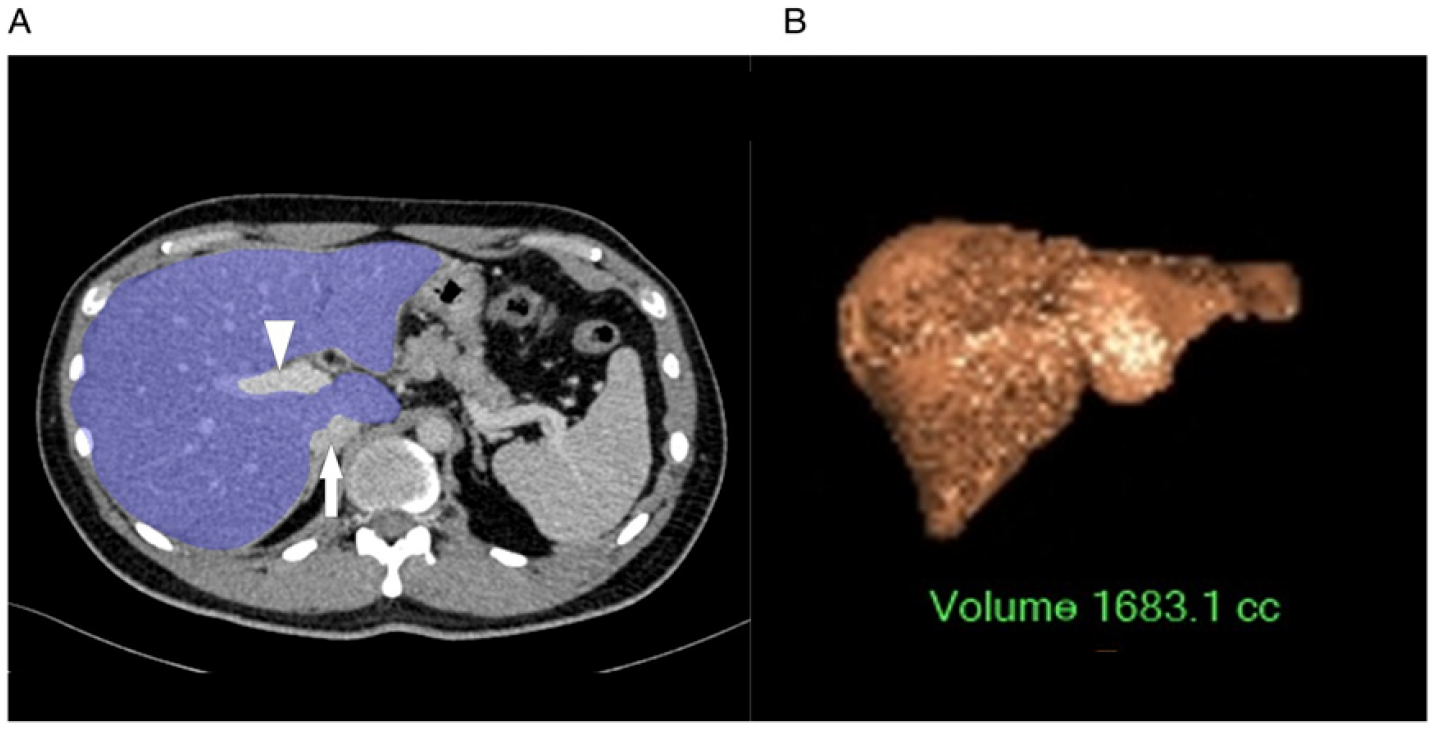
The assessment of pre-operative liver volume and remnant liver volume is vital before a resection because it significantly reduces mortality and morbidity.32,33 A low pre-operative liver volume is associated with higher morbidity, increased risk of liver insufficiency and longer stay in intensive care following surgery. 34 Patel et al. 35 (2021) showed that measuring liver volume might also help to stratify the risk of non-operative patients, demonstrating low baseline CT liver volume in cirrhosis patients as an independent predictor of mortality. As liver cirrhosis patients routinely undergo CT scans to screen for hepatocellular carcinoma, obtaining their liver volume will enable their prognostication based on the risk of disease development and mortality. See Figure 2.
Increased fat within the liver is associated with non-alcoholic fatty liver disease (NAFLD), which predominantly leads to death from cardiovascular disease. 36 The risk of cardiovascular complications in patients with NAFLD is directly correlated with increasing steatosis. 37 A minority of patients with NAFLD will develop non-alcoholic steatohepatosis (NASH), which may progress to cirrhosis and hepatocellular carcinoma. Using Hounsfield units (HU) of less than 40 or liver minus spleen HU of less than −10, non-contrasted CT has been shown to detect steatosis with a sensitivity of 46 to 72% and specificity of 88 to 95%. 38 It has been shown to reliably quantify the degree of liver steatosis, demonstrating excellent linear correlation when compared with MRI proton density fat fraction, which is the most accurate method for evaluating fatty liver disease. 39 A recent study demonstrated the feasibility of large-scale evaluation of CT liver fat fraction. It evaluated more than 9000 patients using a fully automated liver segmentation algorithm, which discovered that more than 50% of its asymptomatic cohort was suffering from steatosis.
Bone and Soft Tissues
Osteoporosis is a disease characterised by low bone mass and microarchitectural deterioration of bone tissue, leading to enhanced fragility and risk of fractures. 40 The gold standard for diagnosing osteoporosis is dual-energy X-ray absorptiometry (DEXA). The bone scans are described in grams per square centimetre (g/cm2) and compared with a reference population of young (t-score) and age-matched (z-score) adults. A t-score of greater than 2.5 standard deviations below the young adult mean is the diagnostic point for osteoporosis.
Since body CT routinely includes bone density information, the opportunistic evaluation for the diagnosis of osteoporosis will incur no additional cost or radiation exposure. Studies have proven significant correlation between CT bone density measured in HU and gold standard DEXA scans.41,42 A gradual decline in CT bone density as the patient ages, similar to that demonstrated in DEXA scans, has also been observed. 42 Most recently, the distribution of normal values has been constructed for L1 vertebral body density using data from more than 20 000 patients, including the usage of automated techniques. 43
A new qualitative method to diagnose osteoporosis – the trabecular bone score (TBS) – is gaining traction among clinicians. Using data from DEXA scans, the software analyzes the distribution of the bone trabeculae to determine its quality and score for the risk of fractures. 44 Unfortunately, no study has attempted to replicate TBS using CT, even though the technology has superior spatial resolution which, in theory, should outperform or at least be equal to DEXA scans.
Visceral fat deposition, described as the visceral-to-subcutaneous fat ratio (VSR), has been associated with multiple metabolic risk factors, including NAFLD and liver fibrosis.45,46 Since routine abdominal CT examinations may clearly visualise abdominal fat, be it visceral or subcutaneous, it is only a matter of time before automated segmentation of these parameters becomes possible. A study in 2018 managed to opportunistically validate an automated adipose-segmentation algorithm in over 8000 non-contrast enhanced CT scans; potentially allowing for the assessment of cardiovascular risk, metabolic syndrome and their changes over time. 47 It also found that CT-derived VSR was an independent predictor of mortality, regardless of cardiovascular risk factors. 48
The utility of sarcopenia (low muscle mass and function) in prognosticating geriatric diseases and cancer has been well established. Patients with severe sarcopenia tend to have longer hospital stay, require non-elective readmission and high mortality rate. 49 Popular methods for rapid screening of sarcopenia include the usage of the SARC-F (strength, assistance with walking, rising from a chair, climbing stairs and falls) questionnaire, grip strength or chair stand test and appendicular muscle mass estimation using DEXA. 50 CT measurements of sarcopenia, typically measured at standard vertebral body levels, such as T12 and L3, have been proposed as a prognosticator for cancer patients. A recent study has proven that higher skeletal muscle density measured through CT is associated with better survival in cancer patients. 51 More recently, opportunistic screening for osteoporosis/osteopenia was proven feasible using only knee CT scans, with the assistance of multivariable machine learning models. 52 Other methods to assess sarcopenia include MRI, bioelectrical impedance analysis ultrasound and peripheral quantitative computed tomography (pQCT). 53
Conclusion
There is extensive evidence that qualitative assessment using CT may help diagnose and risk-stratify patients with a variety of conditions. The routine use of this approach, however, has been hampered by the time-consuming nature of measuring and segmenting processes. The use of auto-segmentation software provides an opportunity to incorporate qualitative measurements in CT scans. This will enhance the usefulness of CT, expanding its application beyond clinical indications. CT biomarkers can help determine the patient’s risk, prognosticate outcome and monitor disease progression. The incorporation of qualitative measurements in clinical practice will strengthen the benefits and applicability of these CT biomarkers. CT of the thorax showing measurements for the calculation of CT breast density. (A) Shaded volume measurement of the entire right (red shaded) and left (blue shaded) breasts. (B) Shaded volume measurement of the breast parenchymal tissue of the right breast (green shaded) and left breast (yellow shaded). (A) CT of the abdomen showing shaded volume measurement of the entire liver, excluding the portal vein (white arrow head) and inferior vena cava (white arrow). (B) Volume rendered image of the liver following volume measurement.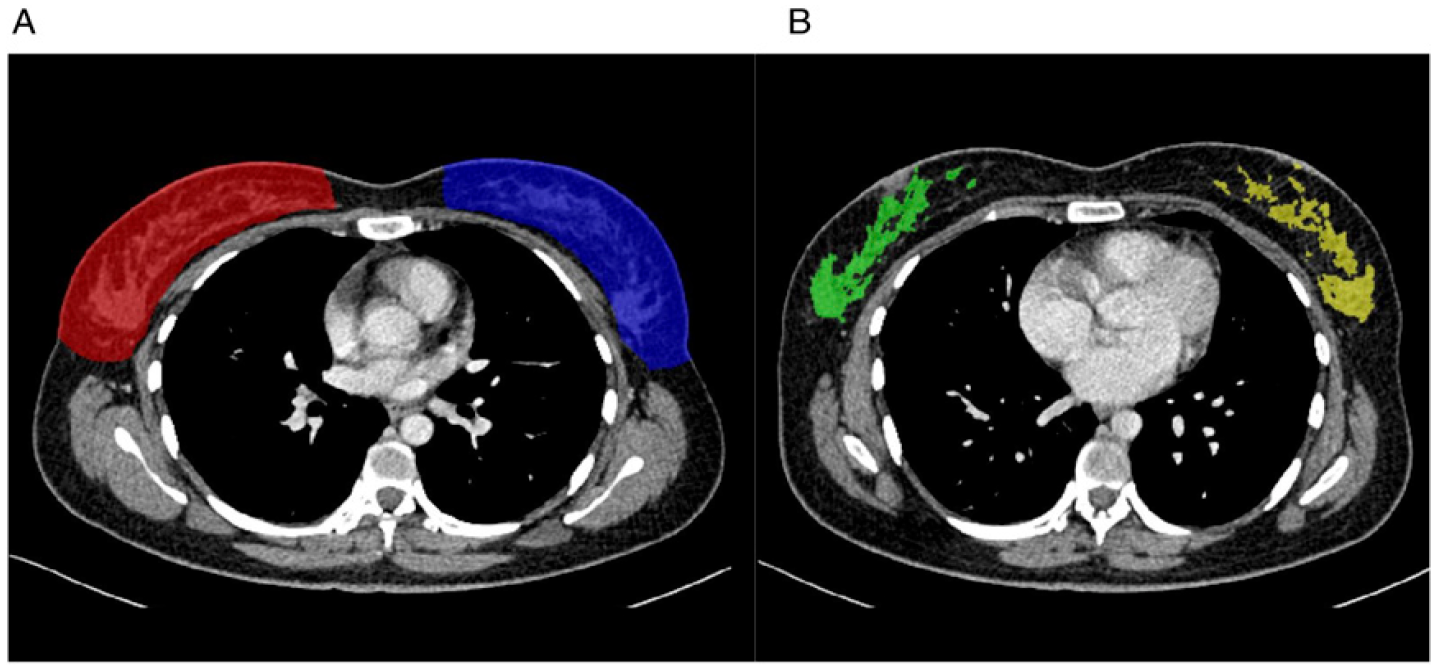
Footnotes
Declaration of conflicting interests
The author(s) declared no potential conflicts of interest with respect to the research, authorship, and/or publication of this article.
Funding
The author(s) received no financial support for the research, authorship, and/or publication of this article.