
Abstract
Purpose
Rapid identification of hematoma expansion (HE) risk at baseline is a priority in intracerebral hemorrhage (ICH) patients and may impact clinical decision making. Predictive scores using clinical features and Non-Contract Computed Tomography (NCCT)-based features exist, however, the extent to which each feature set contributes to identification is limited. This paper aims to investigate the relative value of clinical, radiological, and radiomics features in HE prediction.
Methods
Original data was retrospectively obtained from three major prospective clinical trials [“Spot Sign” Selection of Intracerebral Hemorrhage to Guide Hemostatic Therapy (SPOTLIGHT)NCT01359202; The Spot Sign for Predicting and Treating ICH Growth Study (STOP-IT)NCT00810888] Patients baseline and follow-up scans following ICH were included. Clinical, NCCT radiological, and radiomics features were extracted, and multivariate modeling was conducted on each feature set.
Results
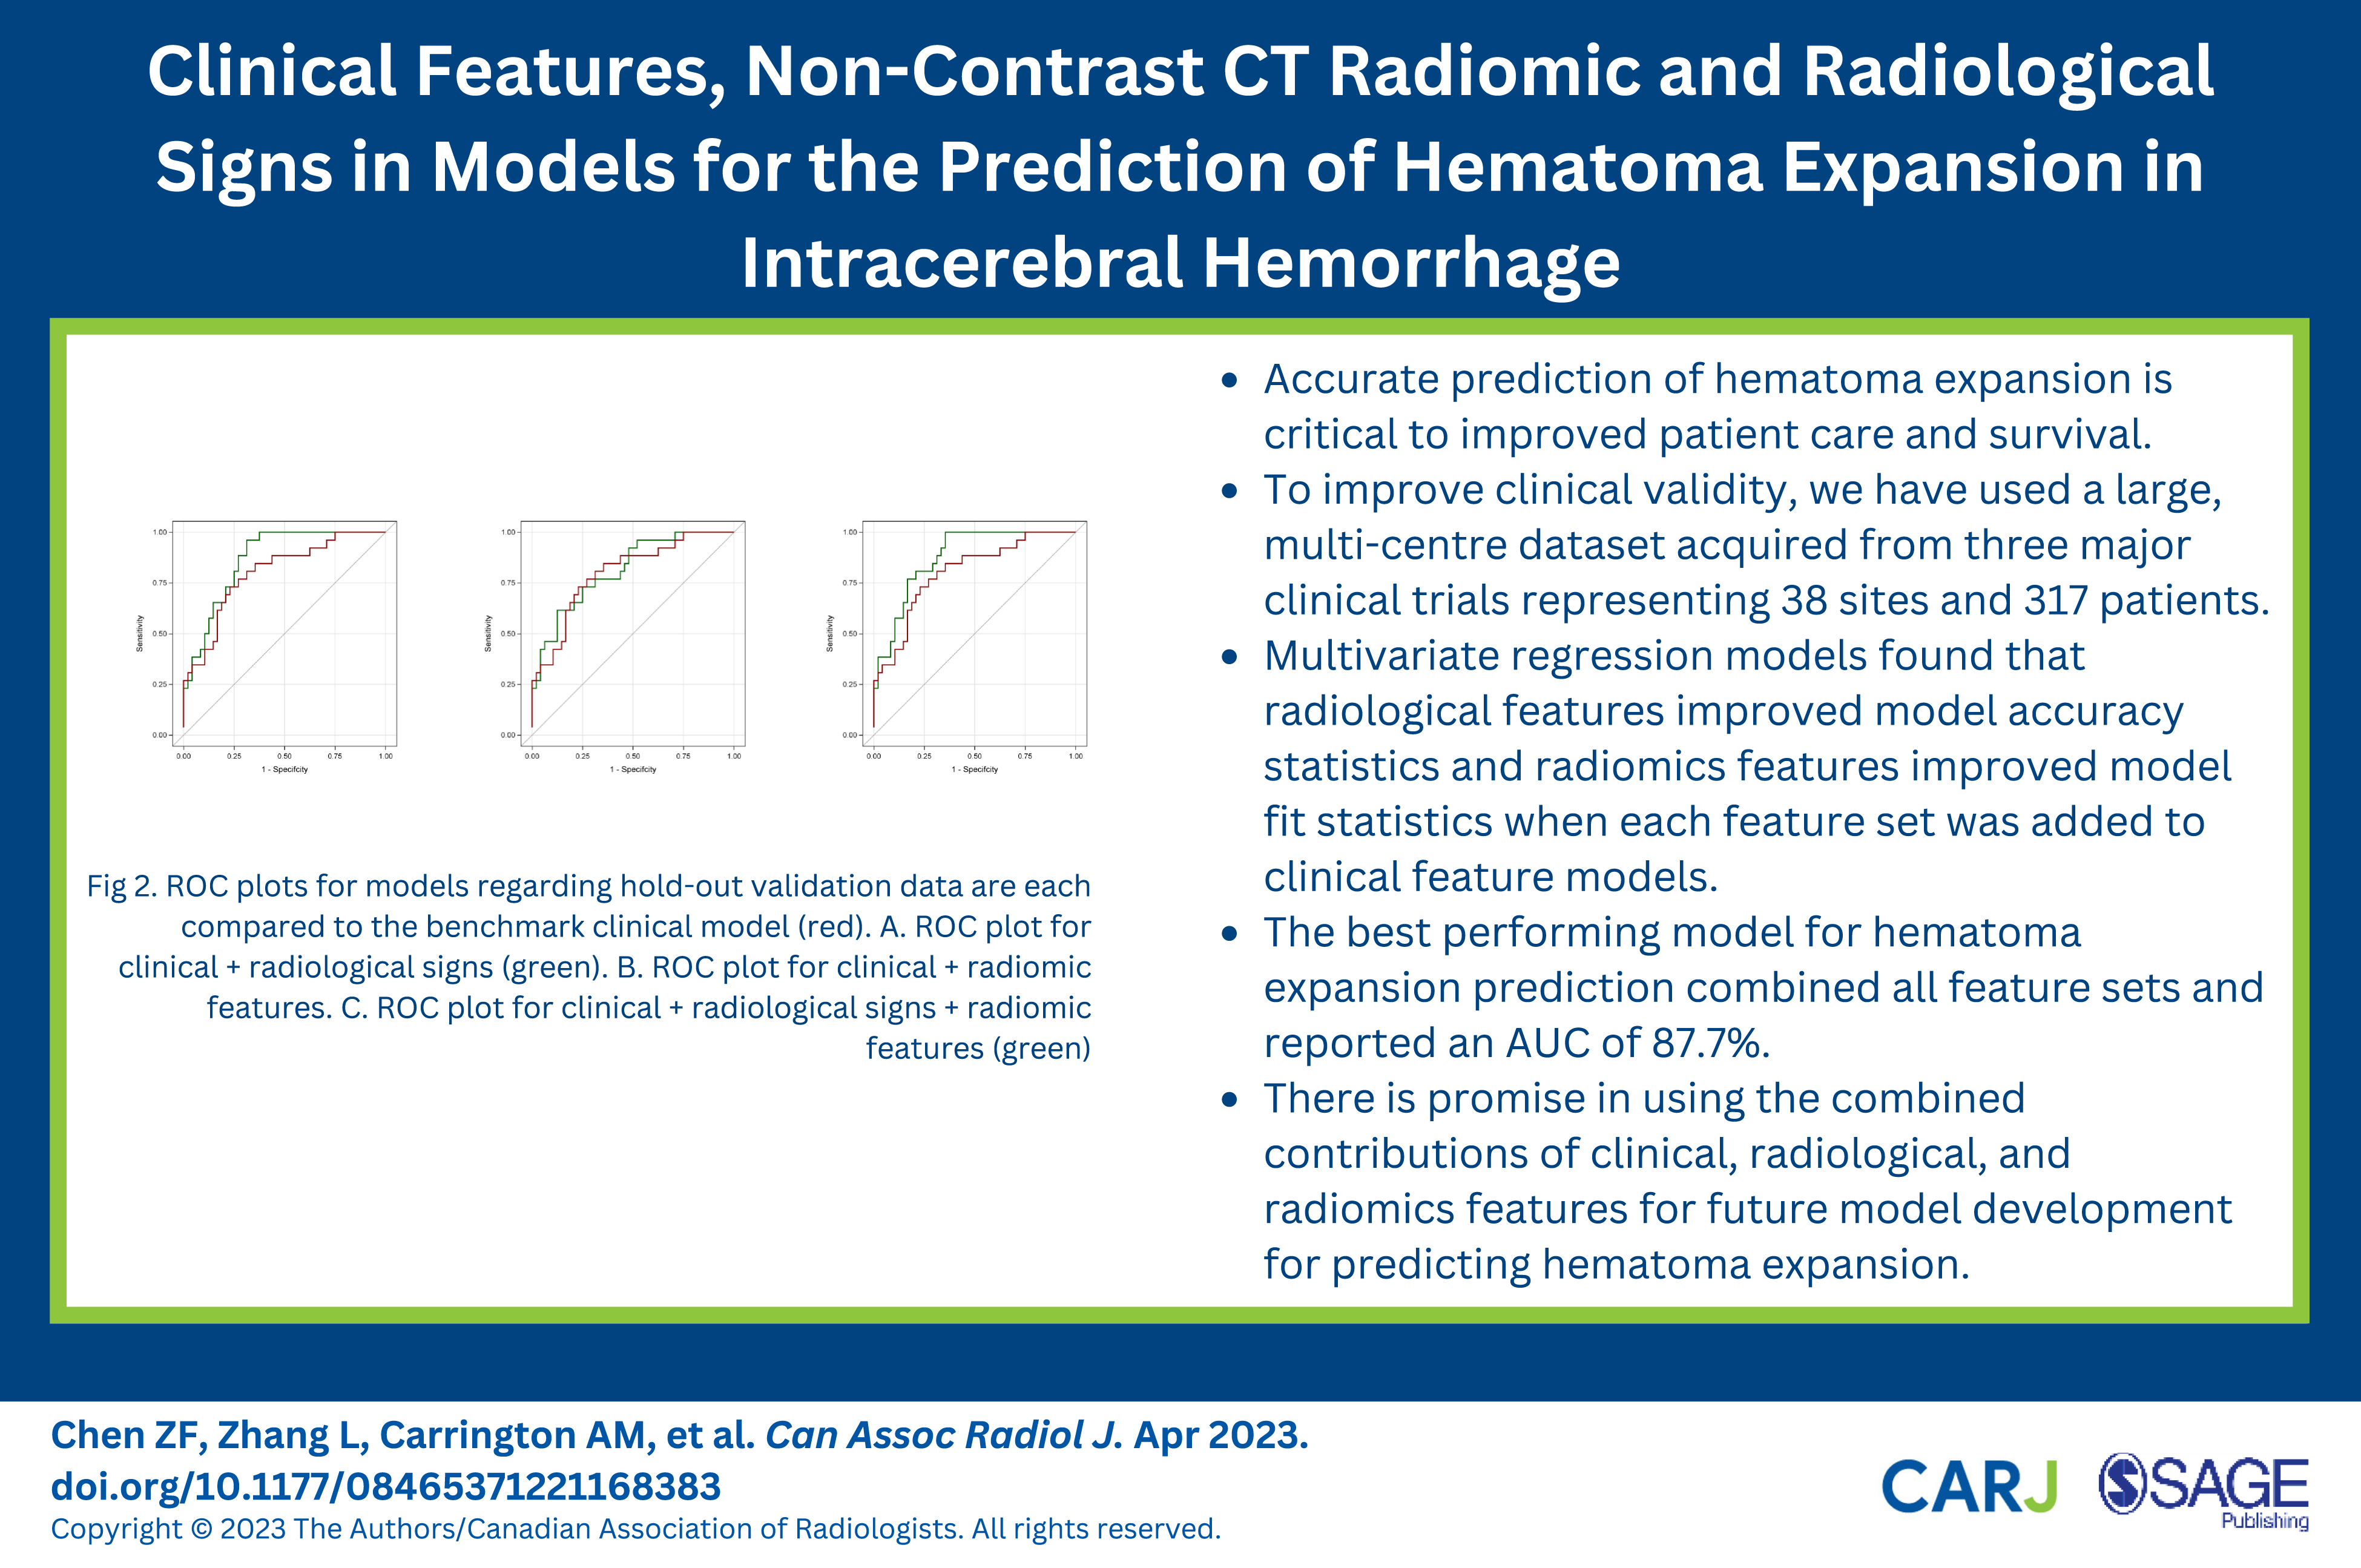
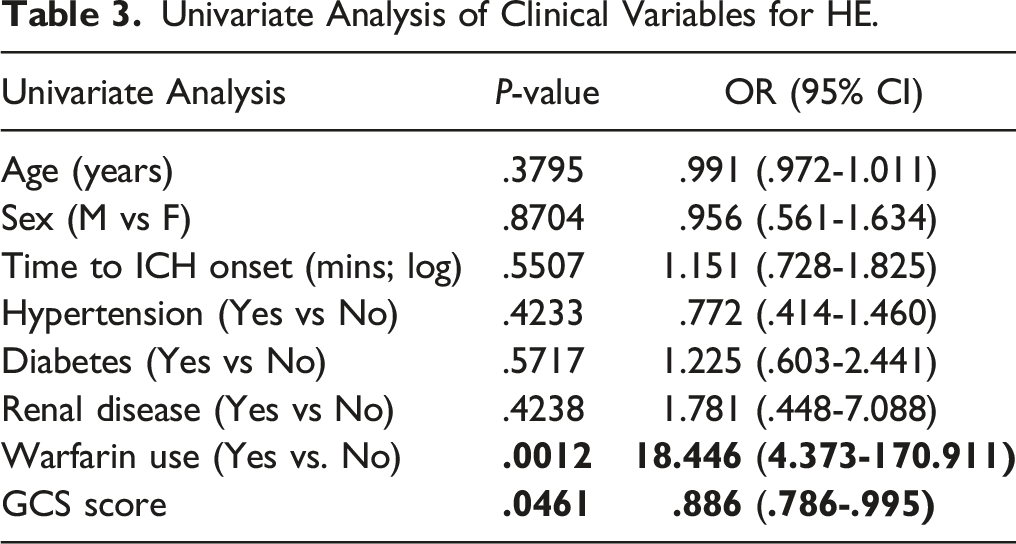
317 patients from 38 sites met inclusion criteria. Warfarin use (p=0.001) and GCS score (p=0.046) were significant clinical predictors of HE. The best performing model for HE prediction included clinical, radiological, and radiomic features with an area under the curve (AUC) of 87.7%. NCCT radiological features improved upon clinical benchmark model AUC by 6.5% and a clinical & radiomic combination model by 6.4%. Addition of radiomics features improved goodness of fit of both clinical (p=0.012) and clinical & NCCT radiological (p=0.007) models, with marginal improvements on AUC. Inclusion of NCCT radiological signs was best for ruling out HE whereas the radiomic features were best for ruling in HE.
Conclusion
NCCT-based radiological and radiomics features can improve HE prediction when added to clinical features.
Introduction
Intracerebral hemorrhage (ICH) accounts for 10-20% of all strokes and is associated with up to 40% mortality after 30 days. 1 Hematoma expansion (HE) occurs in 18% of patients with ICH within 3 hours of presentation and is a marker of poor prognosis. The rapid identification of ICH is critical to ongoing clinical trials of tranexamic acid and recombinant factor VIIa (rFVIIa). There is some optimism that early treatment using mobile stroke units may allow treatment of all patients and reduce HE. However, the therapeutic options are not all benign and it is plausible that a subpopulation may be a more ideal target for these therapies, sparing patients who are unlikely to respond to therapy from potential adverse drug effects. As such, treatment of patients at risk for HE remains an important, although somewhat elusive, target to improve clinical decision-making and outcomes in ICH treatment. 2
The computed tomography angiography (CTA) spot sign is validated as a predictor for HE 3 ; however, CTA is frequently not performed hyperacutely in ICH due to systemic barriers in obtaining vascular imaging in non-comprehensive stroke centres, concerns that additional imaging delays time to treatment and to a lesser degree lingering concerns over iodinated contrast induced injury in a rare disease without an available treatment. 4 Non-contrast CT (NCCT) imaging remains the imaging modality of choice in ICH diagnosis. Multiple NCCT markers of HE have been published, including both density markers—such as swirl sign, hypodensity, black hole sign, blend sign, fluid level—and shape markers, including irregular shape, island sign, satellite sign. 5 However these features occur with relatively low prevalence, and are subject to inter- and intra-observer bias, 5 highlighting the need for objective tools such as radiomics. Further, overlapping definitions and criteria exist between signs, adding complexity to clinical use, and few studies have assessed the combination of signs or features to predict ICH. Recent literature has re-explored radiomic and machine learning approaches to the problem of predicting HE, arguing that quantitative analysis may facilitate more complex assessment of ICH features and more accurately predict HE.
Radiomics is an established tool used for extraction of quantifiable features from medical images, including shape, textural, or intensity measurements. Previous studies have evaluated the predictive ability of extracted radiomic features for HE outcome.6–8 While some prospective multicentre studies have evaluated or validated radiomics-based predictive tools, few have incorporated commonly collected clinical variables directly into their models. In this study, we sought to identify the relative value of clinical, radiological, radiomics, and combination models in HE prediction using a large prospective multicentre ICH dataset.
Methods
Patients
This study is a retrospective analysis of prospectively collected data from the PREDICT, SPOTLIGHT, and STOP-IT trials, three large multicentre studies conducted across multiple countries and was approved by the Institutional Review Board of a large Canadian Research Institute. The PREDICT observational study investigated the potential of the CTA spot sign at baseline for the prediction of HE in follow-up. SPOTLIGHT (NCT01359202) and STOP-IT (NCT00810888) investigated the effect of rFVIIa on HE stratified by CTA spot sign presence. Full inclusion and exclusion criteria of the studies can be found in the supplementary materials section.3,9 Patients from these studies were excluded if valid baseline and follow-up images were not available; or if significant NCCT degradation was present (Figure 1). HE was defined as any ICH growth exceeding 6 mL or 33% from baseline.
10
ICH volume segmentation derived with the semiautomated ITK-SNAP software (http://www.itksnap.org), was then reviewed, modified and approved by an experienced neuroradiologist (R.I.A, 20 years’ experience). Images were normalized for gantry tilt and intensity (−1024 to 3071 HU) and submitted for feature extraction. Distribution of collected baseline imaging data from PREDICT, SPOTLIGHT, and STOP-IT studies.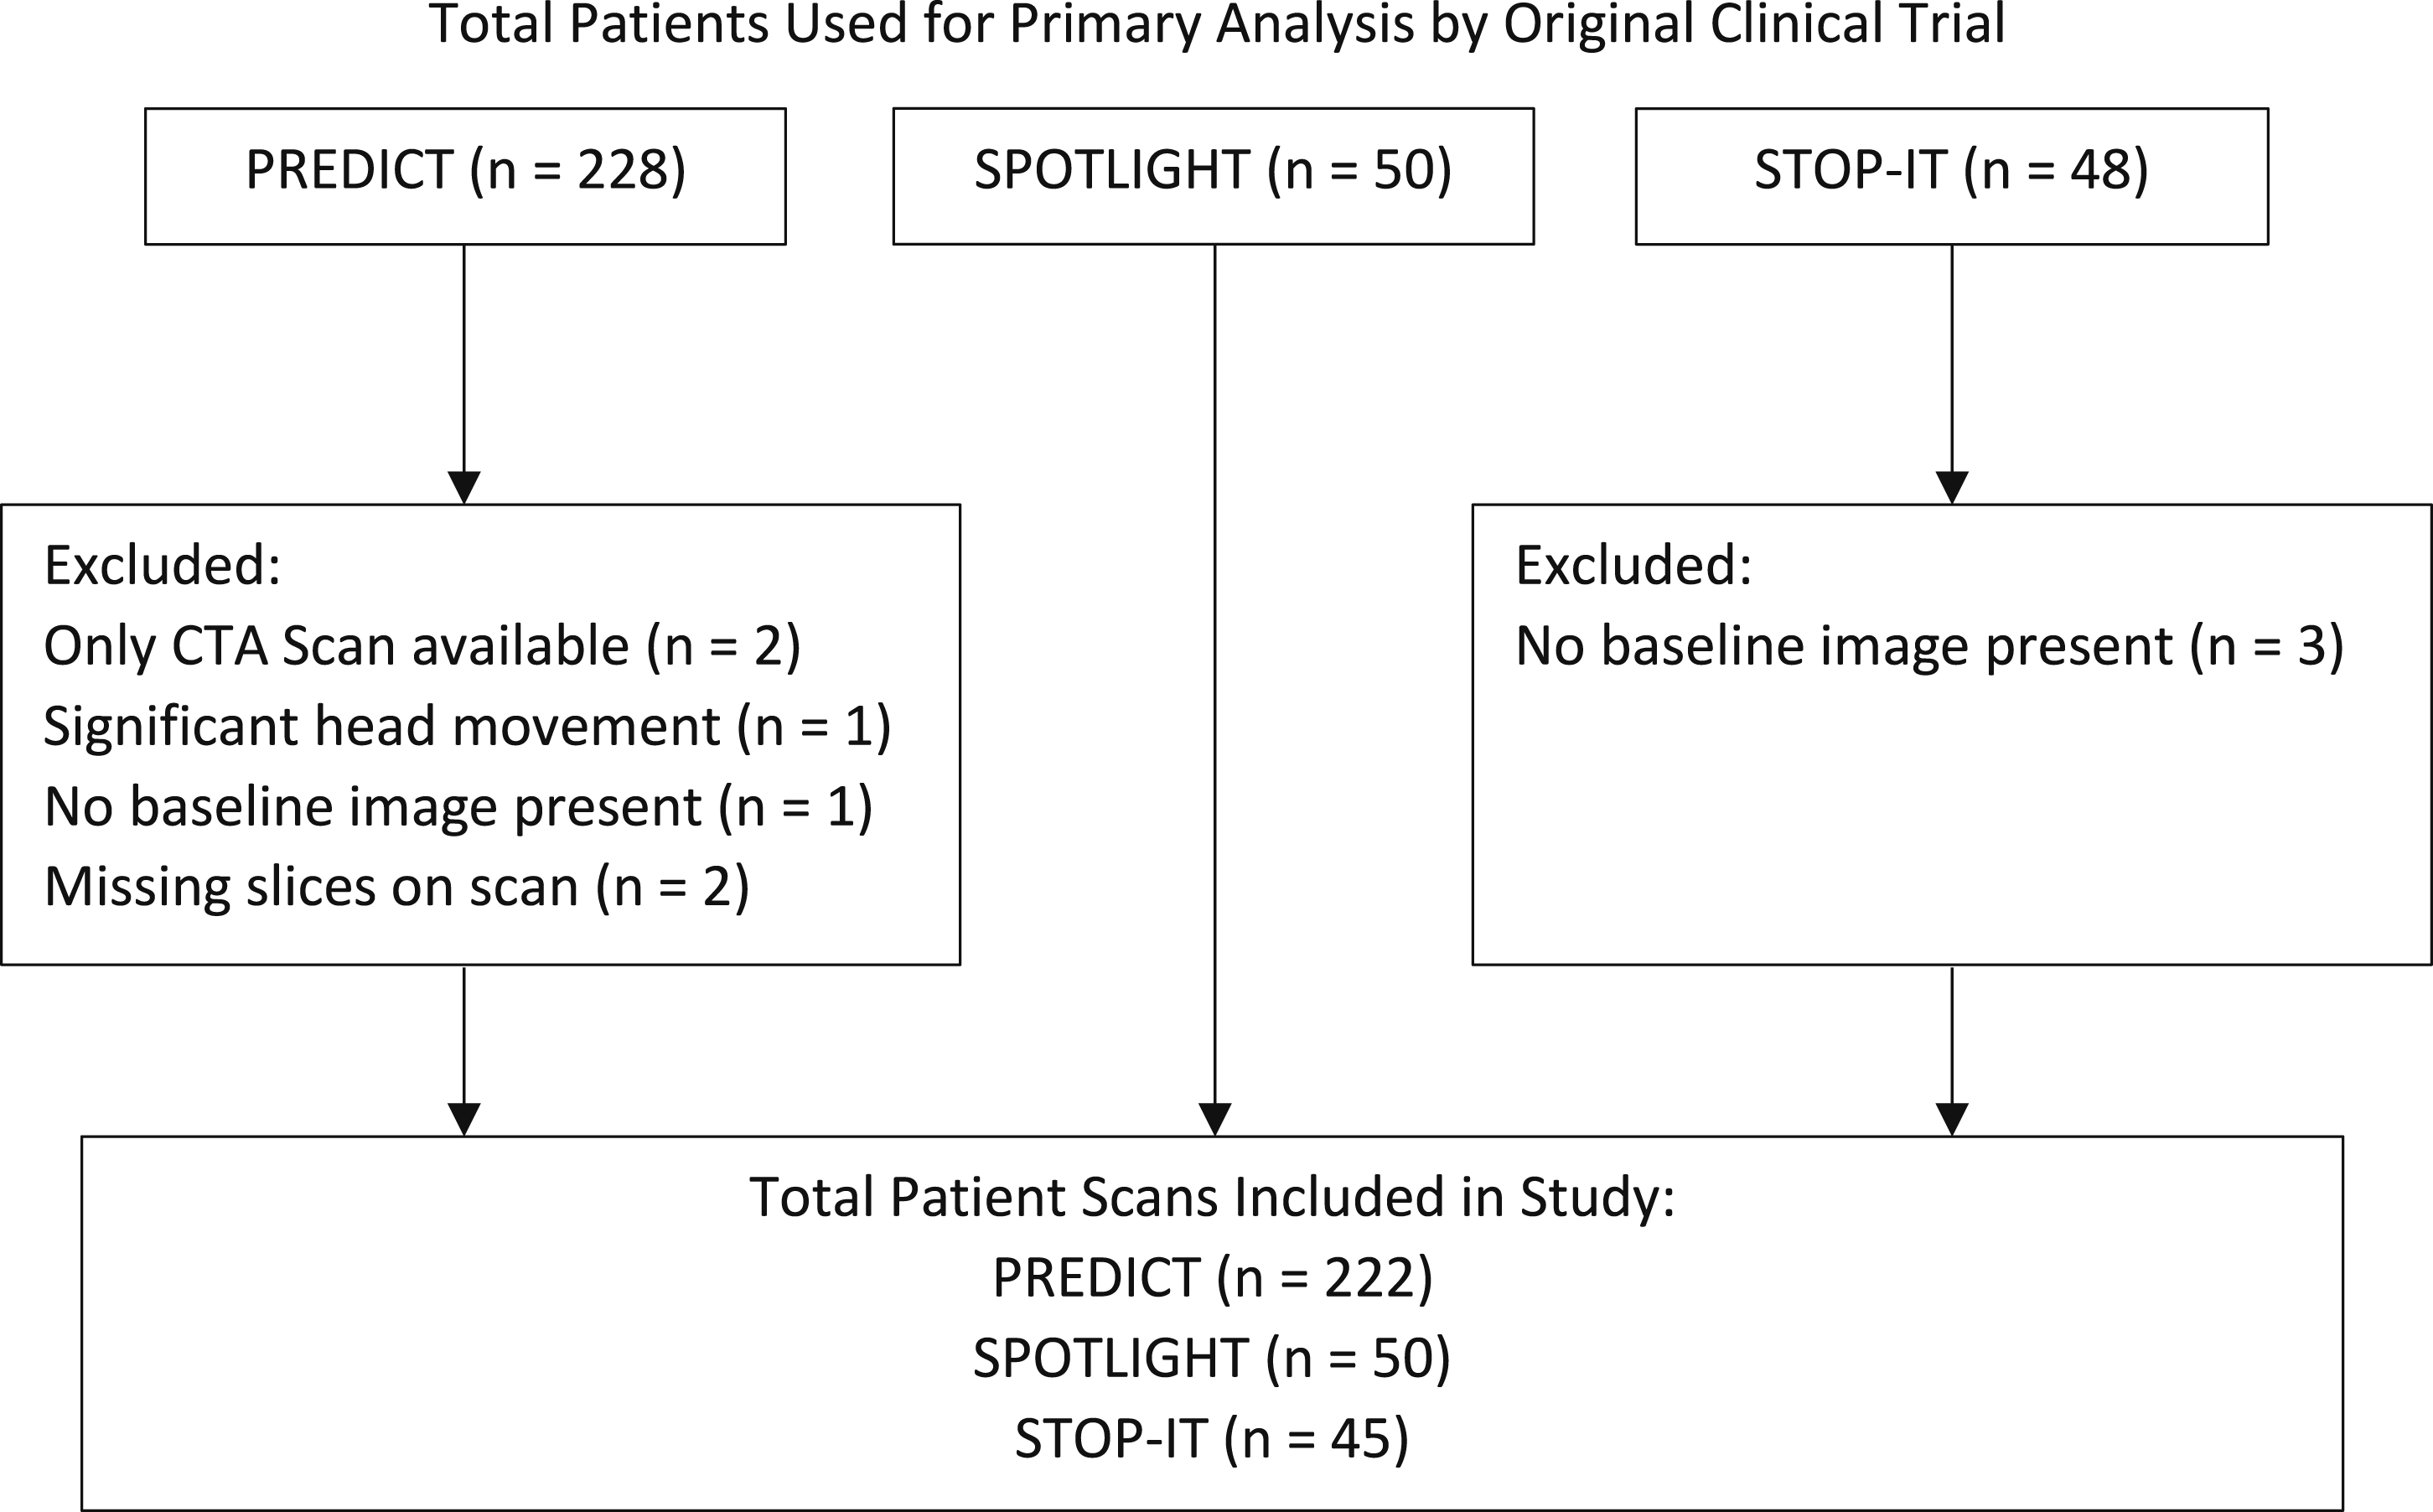
Data Acquisition and Analysis
Images were obtained from 38 centres across 6 countries. Baseline and follow-up images were acquired at median: 24.92 hours, range: 11-46 hours apart in the SPOTLIGHT/STOP-IT trials and at median: 23.56 hours, range: 1-91 hours apart in the PREDICT. Images were collected using a variety of CT scanners ranging from 4 to 64 slices. Although varying across sites, typical imaging parameters were: 120 kVp; 340 mA; 4 × 5 mm-collimation; 1 second/rotation; and a table speed of 15 mm/rotation.
Clinical features were obtained from original study data, and included age, sex, time to ICH onset, hypertension, diabetes, renal disease, warfarin use, and Glasgow Coma score.
Three neuroradiology fellows with (1-3 years of Neuroradiology experience) independently reviewed all CTs from the dataset for radiological features, blinded to HE outcome. Prior to review a consensus meeting was held and 20 independent ICH cases were reviewed together and discussed in the context of established guidelines of NCCT ICH HE marker description. 5 The following features were extracted for each blindly reviewed study: Barras density and irregularity, island sign, black hole sign, blend sign, fluid level, any hypodensity and swirl sign.11–16 Following review, a consensus of sign presence or absence was determined by agreement between at least of 2 of the 3 reviewers. Inter-observer and intra-observer agreement between reviewers were assessed using Cohen’s kappa statistic.
Radiomic features were extracted for each 3-D lesion volume using PyRadiomics open-source software (version 3.0). 17 The features extracted from the raw NCCT volumes included 14 shape and 88 textural features computed from each of three sets of Laplacian of Gaussian (LoG) filtered image volumes derived for fine, medium, and coarse filters (σ = 1, 2, or 3, respectively) for a total of 264 LoG filtered features. These features were also extracted for wavelet filtered images corresponding to each of 8 possible decompositions for a total of 704 wavelet filtered features. Overall, 1070 radiomic features were extracted for each patient. Feature selection was performed in RStudio version 1.3.1093 (RStudio, PBC, Boston, MA), using a method designed to rank features according to P-value and exclude correlated features. 18 Five total radiomic features emerged for further consideration.
The patients were assigned to train/validation/hold-out cohorts using a specific criterion. First patients were evenly divided by site of scan, then by location of hemorrhage (deep, lobar, etc.), and finally by type of ICH (intraparenchymal, subarachnoid, subdural, intraventricular).
Statistical Analysis
The inter- and intra-observer agreement for each NCCT radiological sign was calculated to assess variability between and within reviewers using Cohens Kappa. Kappa of 0-.20, .21-.40, .41-.60, .61-.80 and .81-1 was considered as slight, fair, moderate, substantial, and perfect, respectively. To search for significant clinical, radiological, and radiomics predictive factors for HE, univariate logistic regression analysis was conducted. The P-value, odds ratio, 95% confidence interval (CI) and R2 were calculated for each feature using the training cohort.
ROC Statistics for Nested Comparisons Between Multivariate Models Predicting HE on Hold-Out Validation Data.
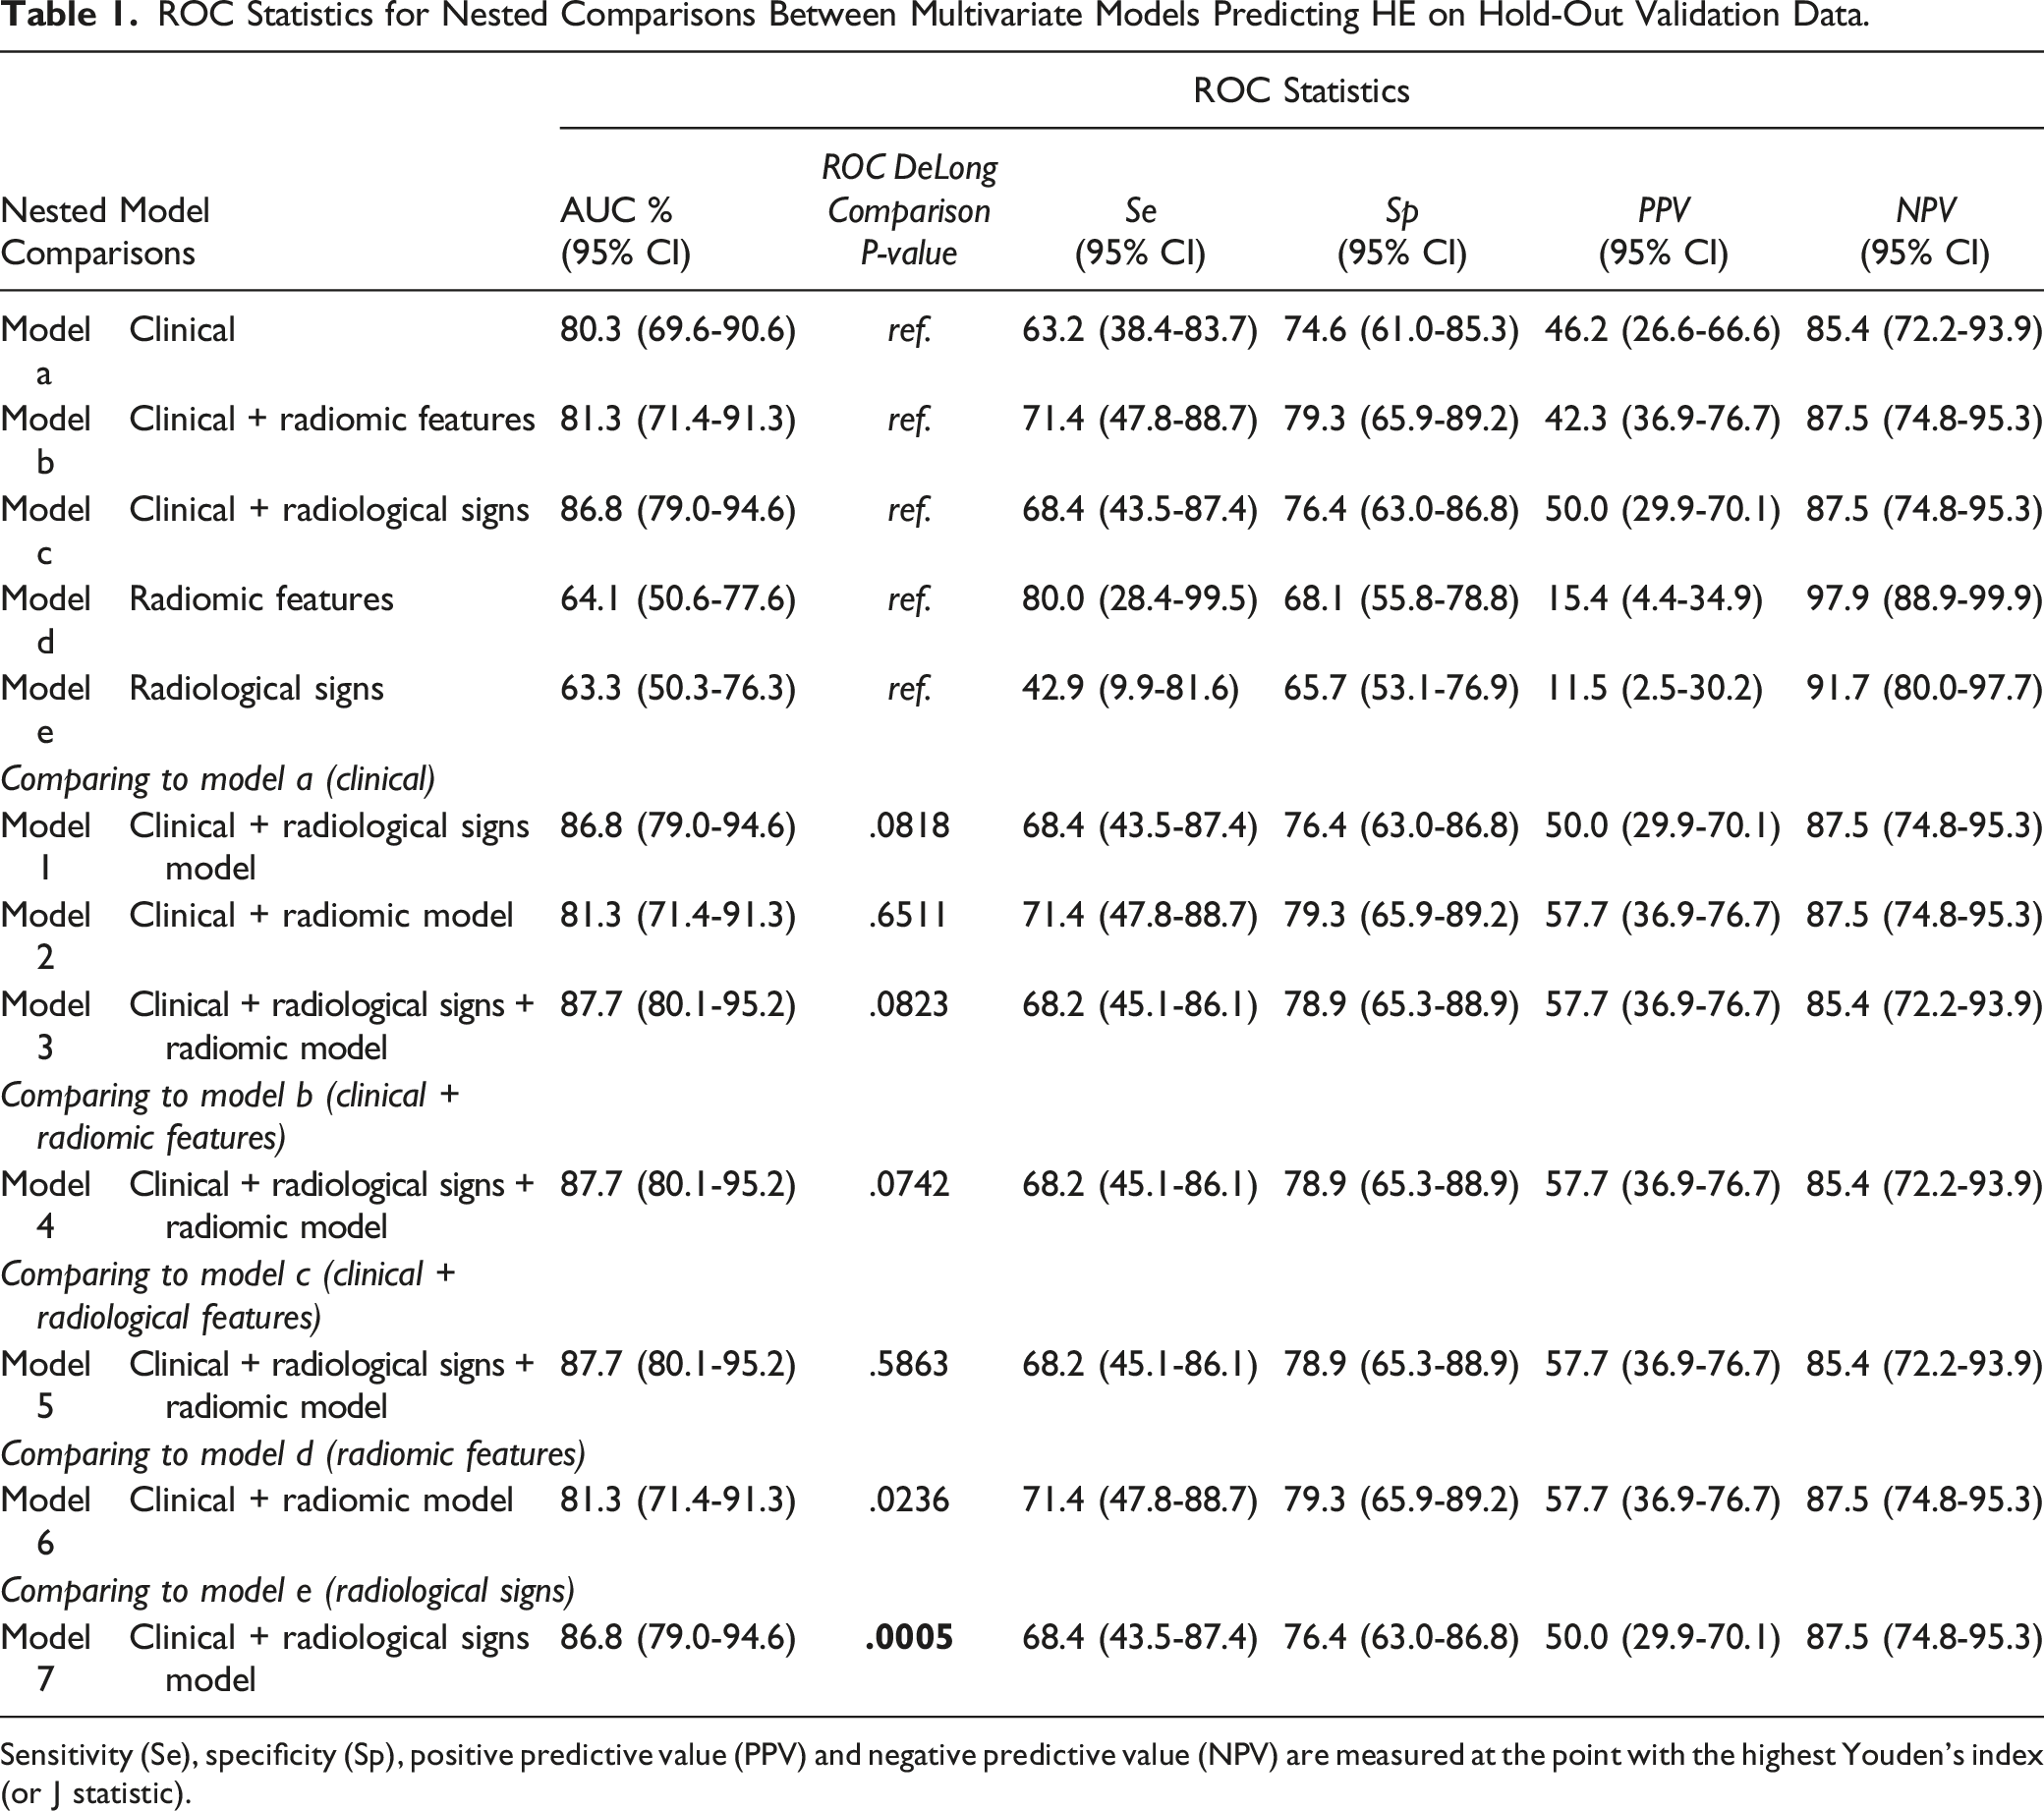
Sensitivity (Se), specificity (Sp), positive predictive value (PPV) and negative predictive value (NPV) are measured at the point with the highest Youden’s index (or J statistic).
To evaluate the suitability of candidate models for ruling in HE as a condition, we focused on specificity >85% as the region of interest (ROI) and computed the average specificity of models as 95.4%, 94.2%, and 96.3% (i.e., “very high”[22]) for the clinical + radiomics, clinical + radiological signs, and clinical + radiological signs + radiomics models, respectively (Supplementary Table 4).20,21 The normalized AUC in the ROI 21 is compared against the overall AUC, to confirm the model is not worse in the ROI for the clinical + radiological signs + radiomics model.
To understand the complexity of the radiomic features for classification, we visualized the data with 3 different dimension reduction and factor analysis techniques: principal components analysis (PCA); t-Stochastic neighborhood embedding (t-SNE) for all combinations of perplexity in {5,15,25,...,55} and learning rates in {10, 110, 210,…, 1010}; and kernel supervised principal components analysis (kSPCA) with a Gaussian Radial Basis Function (RBF) kernel for widths in {1, 2, 5, 7, 20}. Complete case analysis was utilized requiring removal of incomplete cases from analysis. Multiple comparisons were controlled using Bonferroni correction.
Results
Patients
Characteristics of Patients Allocated to Train and Hold-Out Cohorts.
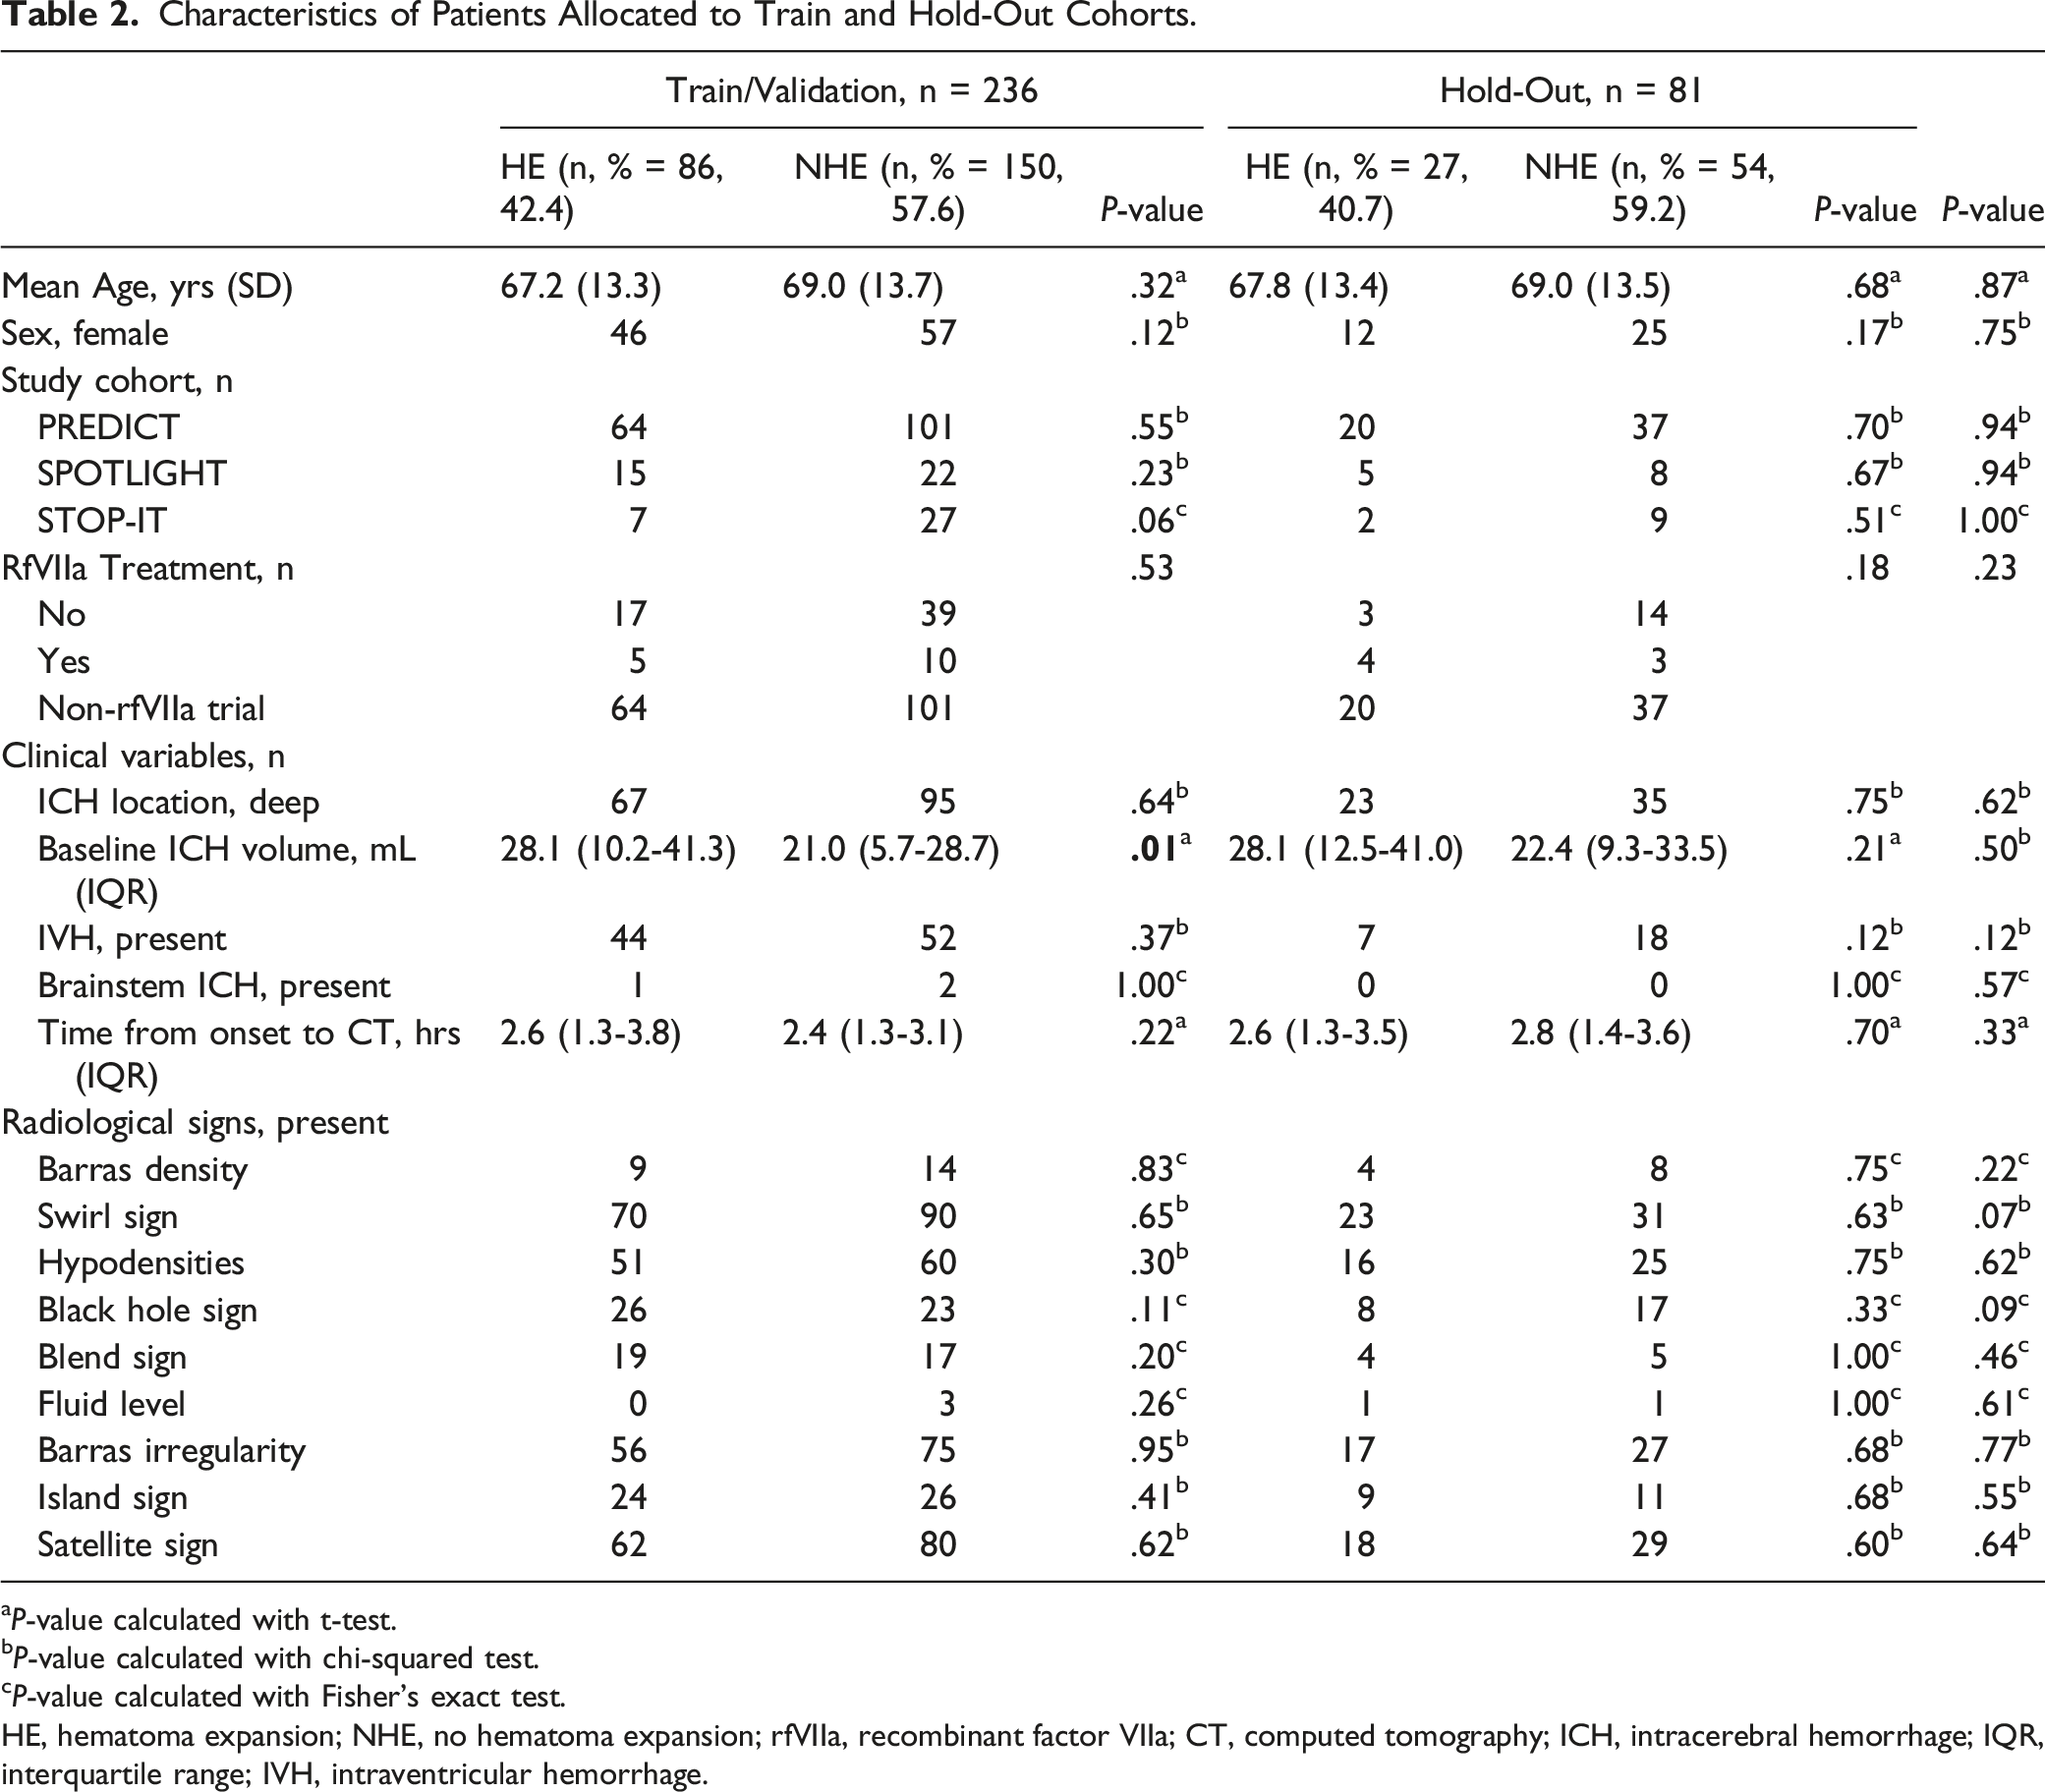
aP-value calculated with t-test.
bP-value calculated with chi-squared test.
cP-value calculated with Fisher’s exact test.
HE, hematoma expansion; NHE, no hematoma expansion; rfVIIa, recombinant factor VIIa; CT, computed tomography; ICH, intracerebral hemorrhage; IQR, interquartile range; IVH, intraventricular hemorrhage.
Univariate Analysis of Clinical Variables for HE.
Inter- and Intra-Observer Agreement of NCCT Signs
Inter-observer agreement was moderate for most signs, with the exceptions of slight agreement for fluid level, fair agreement for Barras and irregularity, and fair to moderate agreement for island sign (Supplementary Table 2). 22 Intra-observer agreement was lowest for Barras irregularity and density and fluid level across 2 readers with slight to fair agreement. The remaining features performed well demonstrating moderate to almost perfect agreement (Supplementary Table 3).
Multivariate Analysis Outcomes
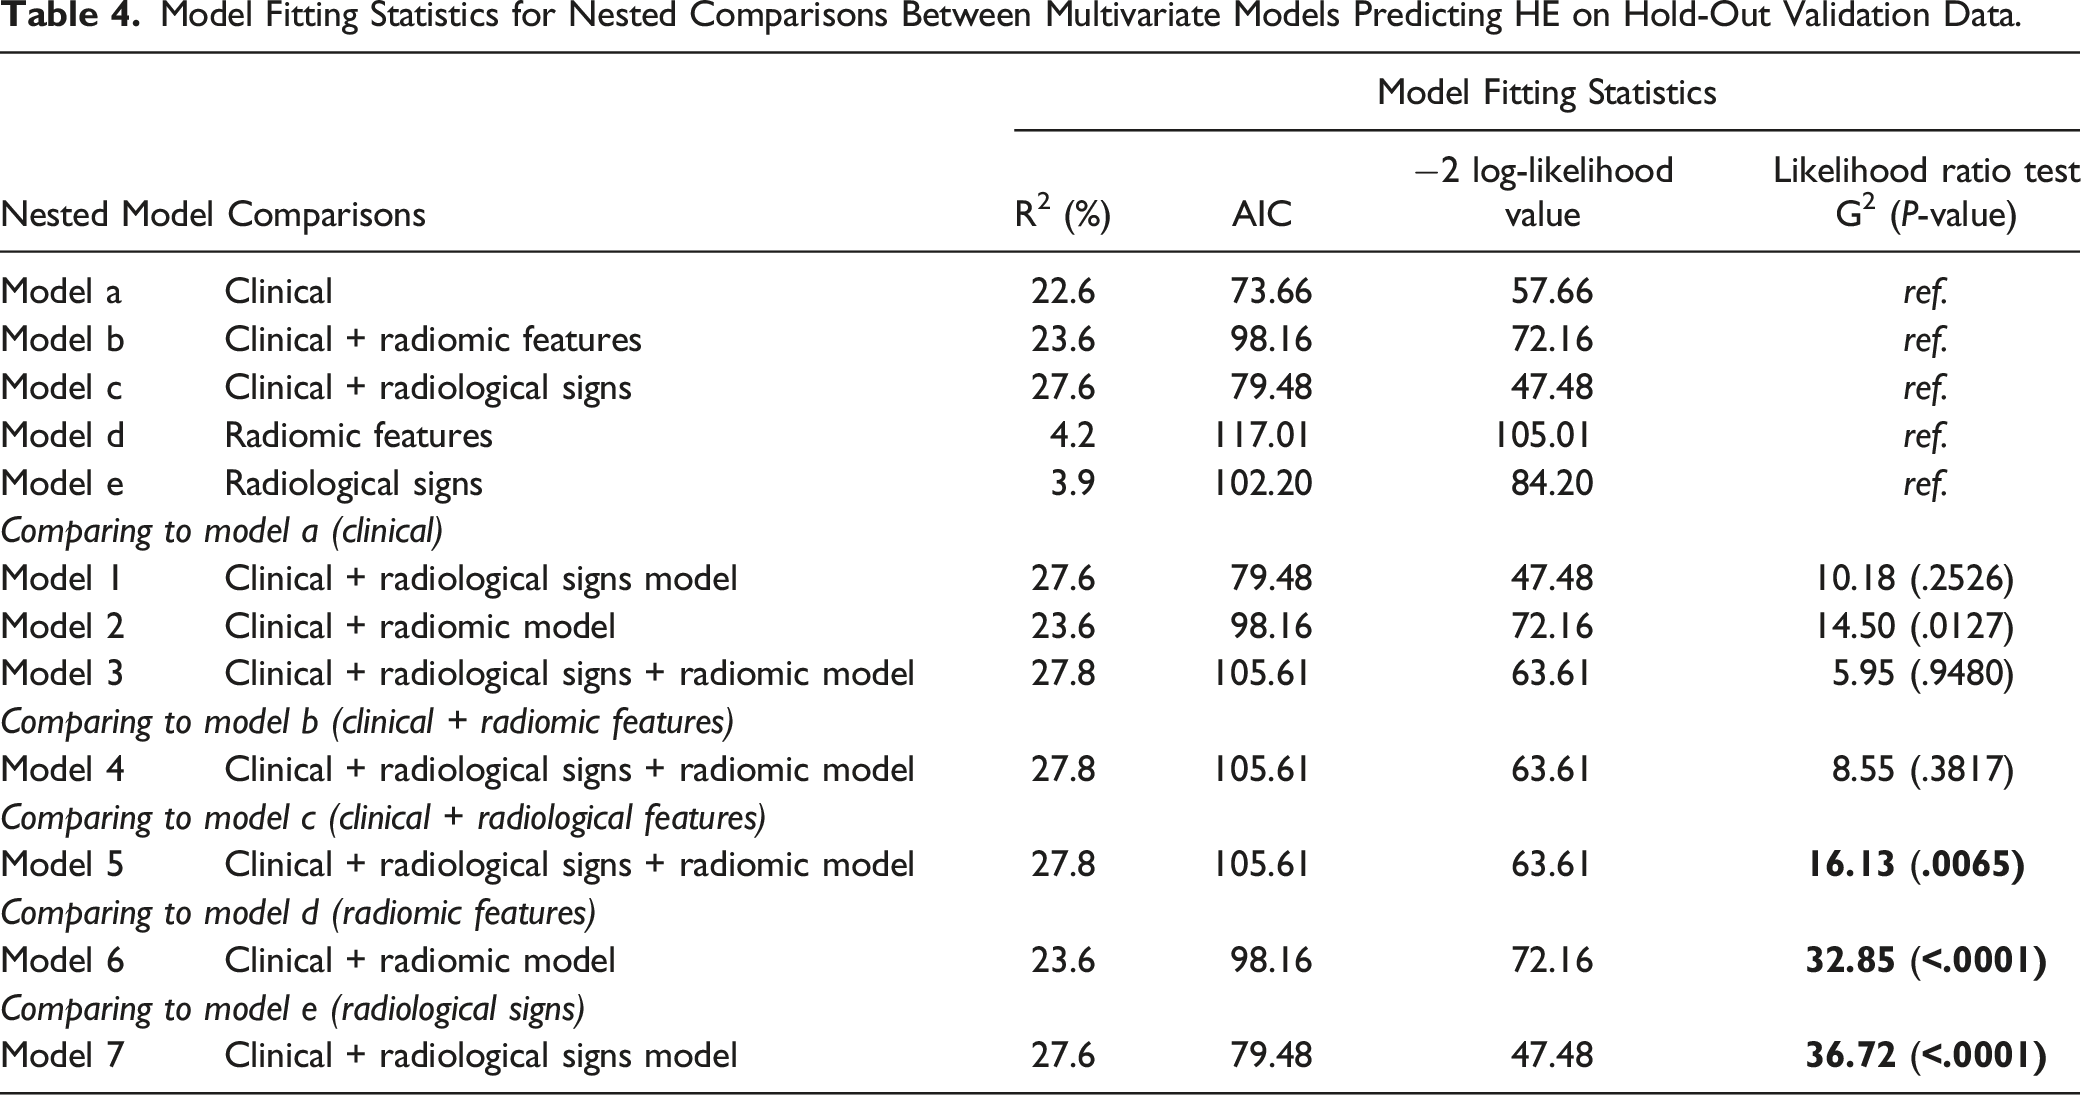
Model Fitting Statistics for Nested Comparisons Between Multivariate Models Predicting HE on Hold-Out Validation Data.
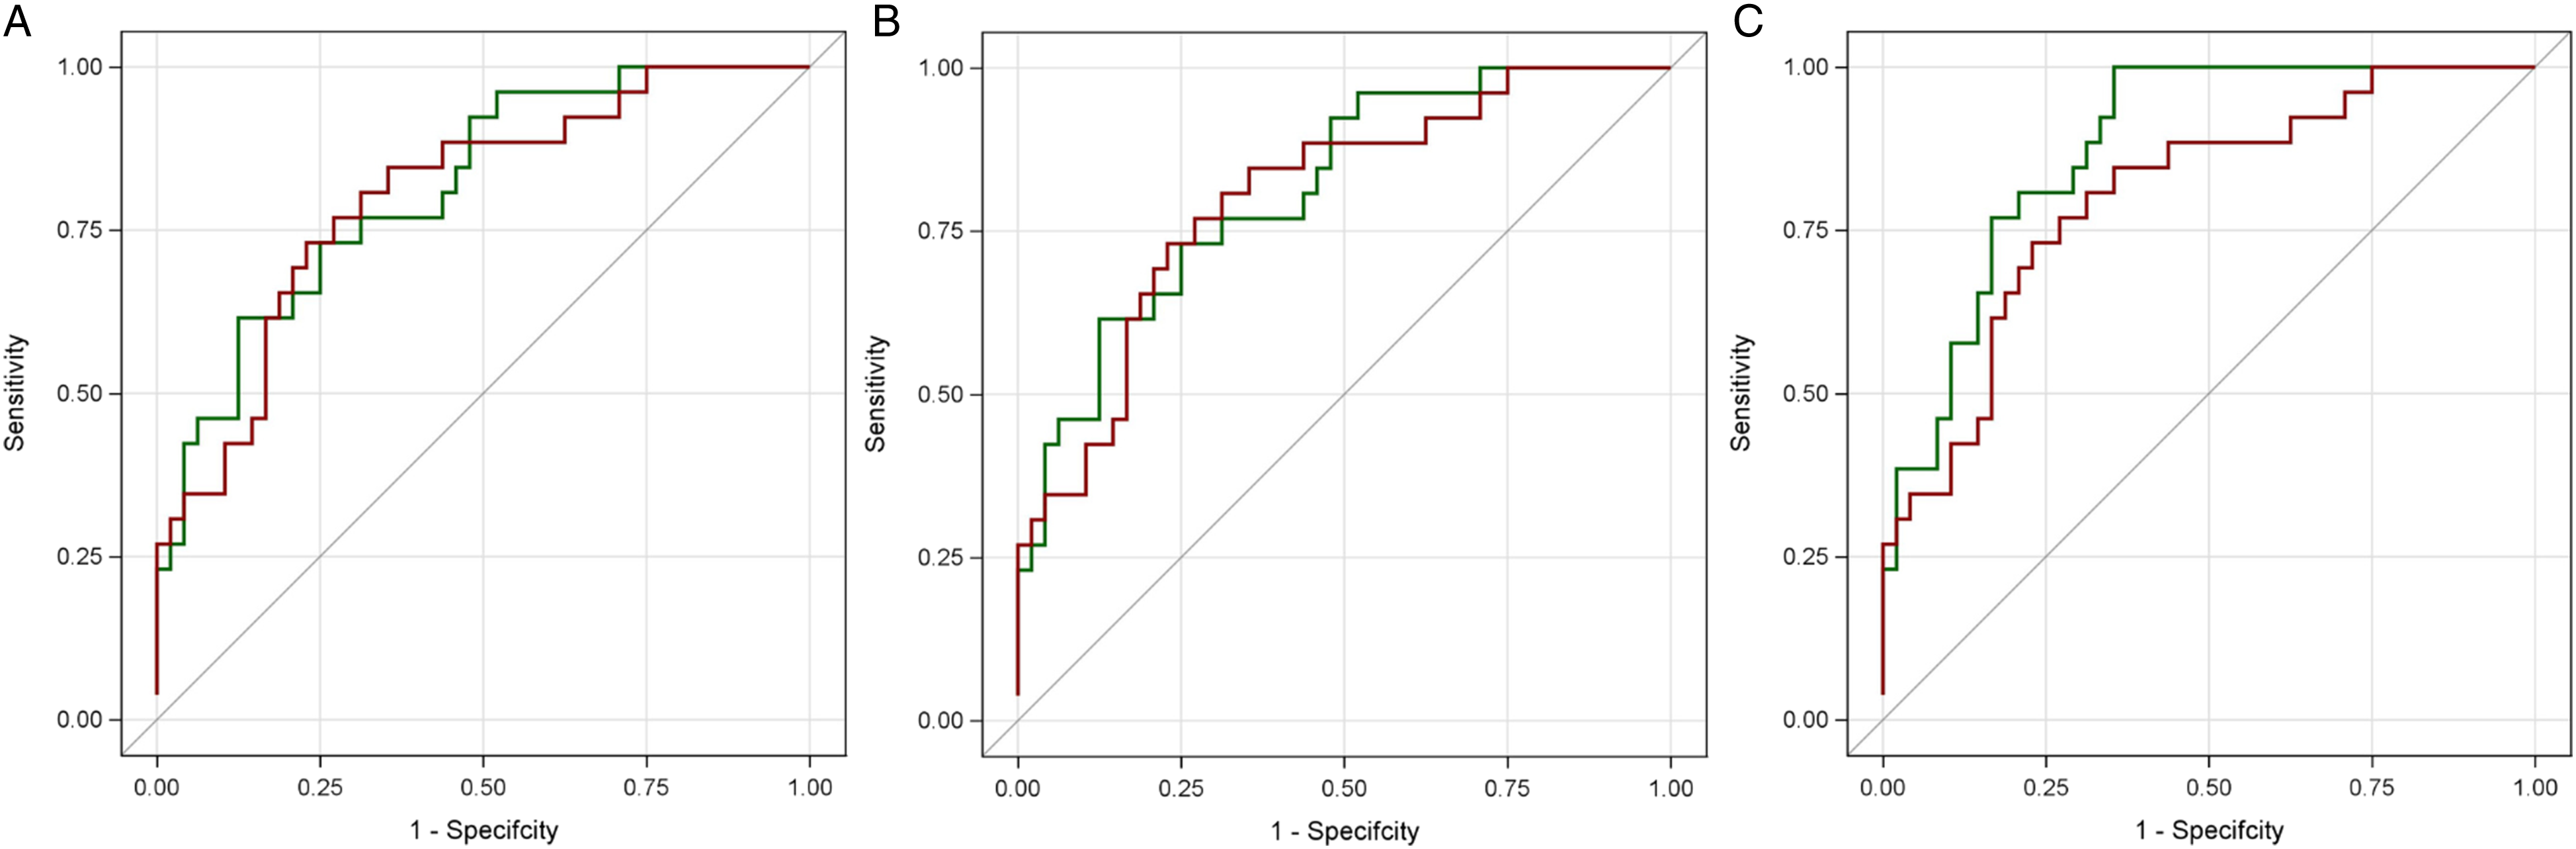
ROC plots for models regarding hold-out validation data are each compared to the benchmark clinical model (red). A. ROC plot for clinical + radiological signs (green). B. ROC plot for clinical + radiomic features. C. ROC plot for clinical + radiological signs + radiomic features (green).
The addition of radiomic features to models improved model fit of clinical and radiological features (G2 16.13; P = .0065, Table 4). Addition of clinical features to a model of radiomic signs alone markedly improved performance, (P = .0005; Model 7, Table 1).
For ruling in, the clinical and radiomic model was better in average specificity and the AUC in the ROI was better than the overall AUC. For ruling out, the clinical and radiological sign model was better in average sensitivity (Supplementary Table 4); and the AUC in the ROI is better than the overall AUC (Figure 2).
Post-Hoc Radiomic Feature Visualization
Kernel supervised principal components analysis (KSPCA) revealed a potential separation of HE positive from HE negative patients with radiomic features (Figure 3). The complexity of the groups in the plot needed to imperfectly separate the data indicates that the HE classification problem is challenging with radiomics alone. Radiomic features in the test set are visualized with kernel supervised principal components analysis (kSPCA) at left with red and blue dots for HE and NHE. Each point represents one feature set for each patient case. A hypothetical yet achievable separation is shown at right.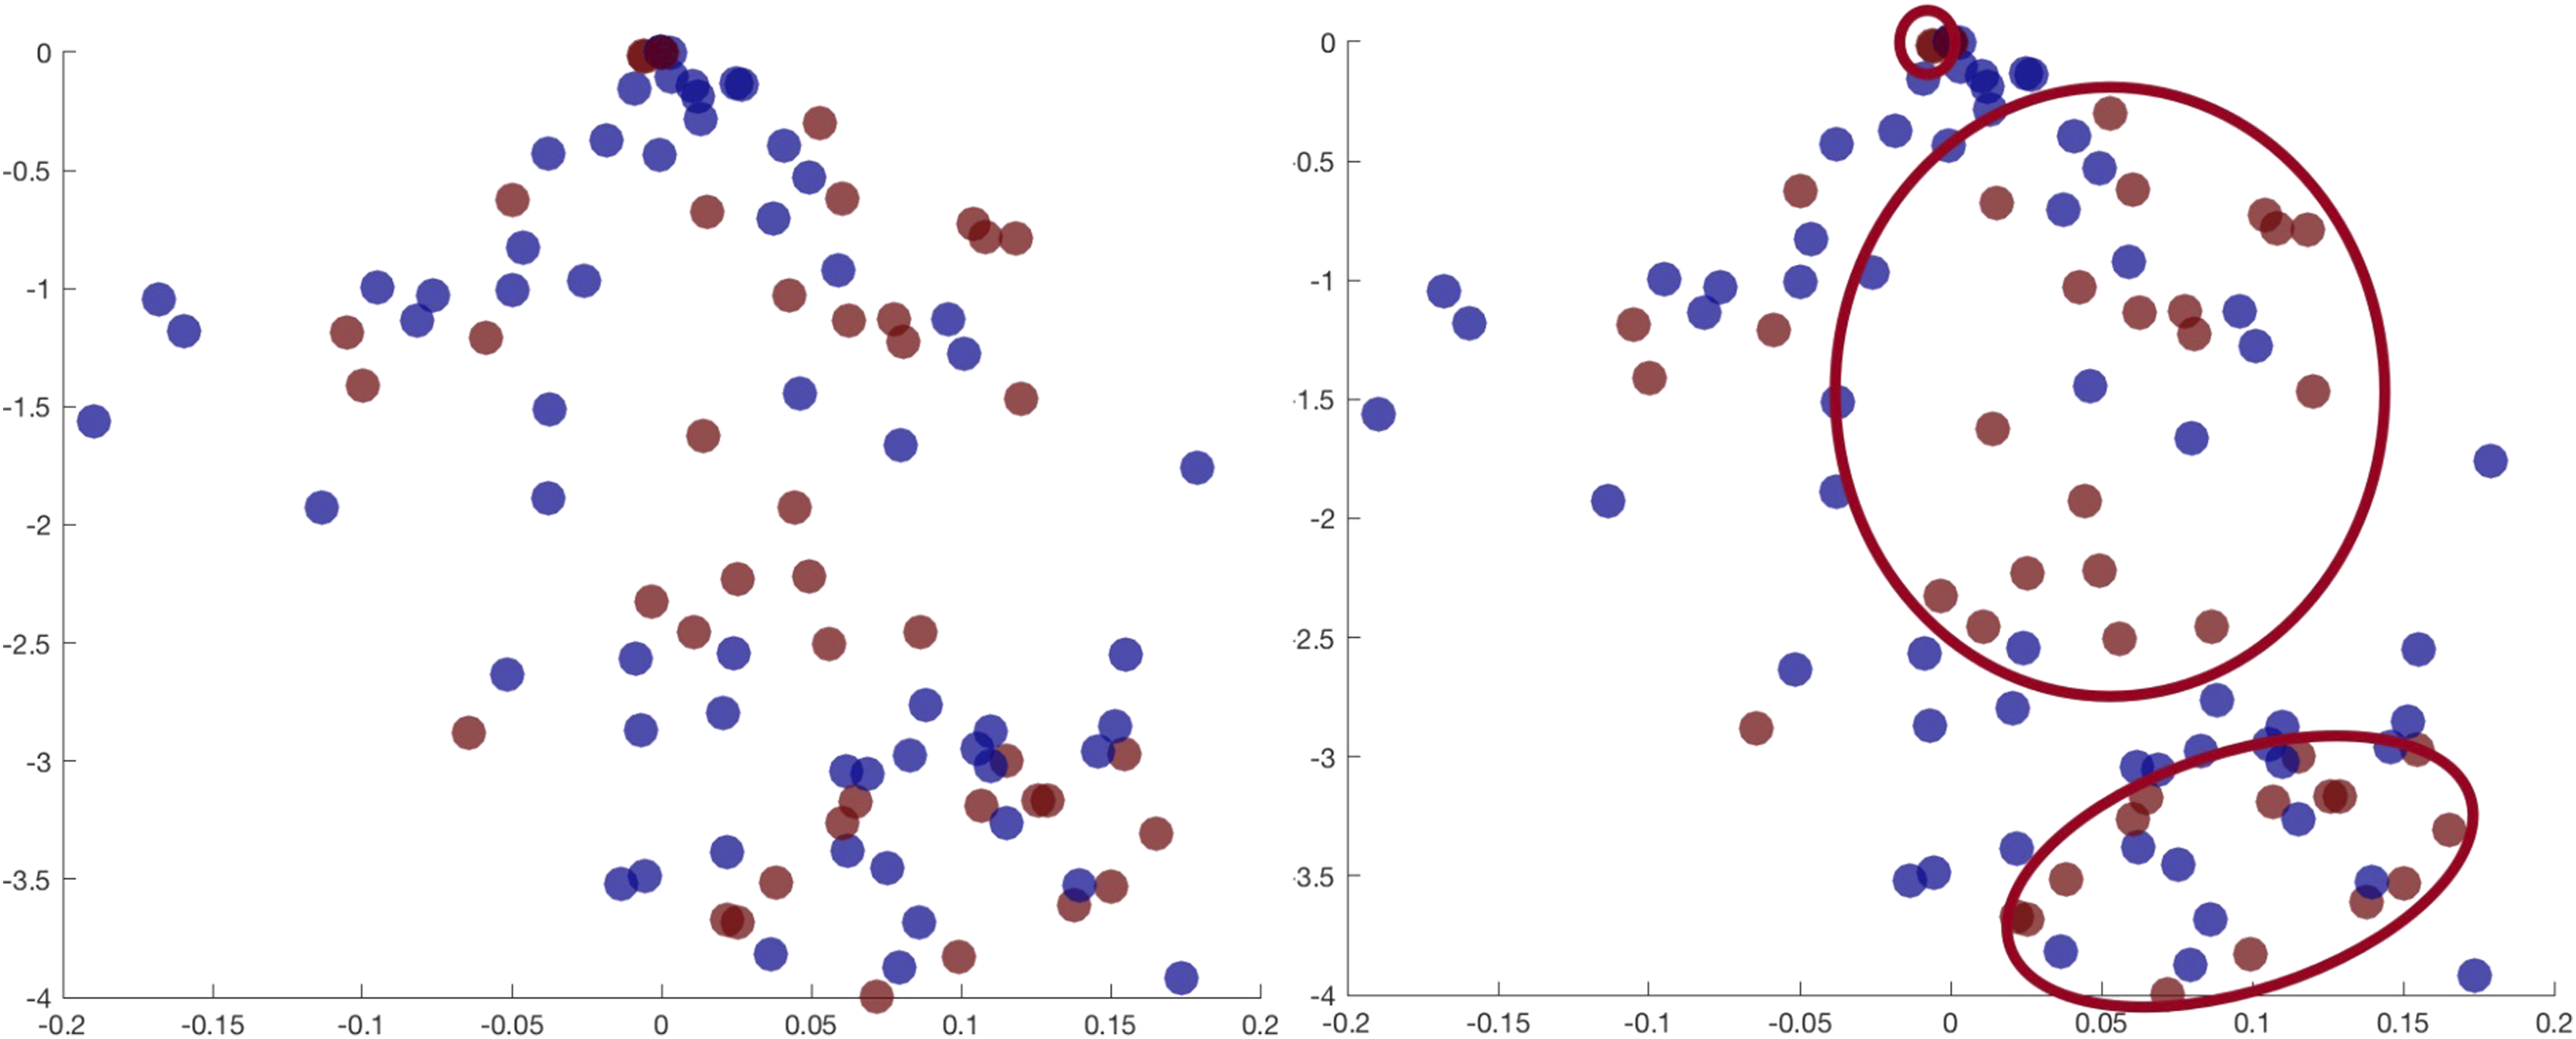
Discussion
Using iterative additions of sets of features to a benchmark clinical model, we demonstrated the potential value of adding NCCT radiological signs and radiomics features to predict HE. NCCT-based radiological and radiomics features may complement HE prediction when added to clinical features. The best performing model included clinical, radiomic, and radiological feature sets and had an AUC of 87.7%. That is a 7.4% increase from the clinical benchmark AUC of 80.3%, although no statistical significance was observed, we believe these findings highlight the potential benefit of including radiological and radiomic features in models of HE. A model including radiomic features demonstrated better goodness of fit, with statistical significance, compared to models of clinical plus radiological features and increased the AUC by approximately 1%. Inter- and intra-observer agreement for NCCT radiological markers were heterogeneous, demonstrating, on average, fair to moderate agreement emphasizing the utility of radiomic augmentation of clinical features.
The CTA Spot sign remains the most robust imaging biomarker of HE but has limited generalizability in clinical practice because of the need for CTA and contrast administration. 23 This was demonstrated in the slow recruitment from three recent clinical studies.3,9 While the 2015 acute stroke studies requiring CTA demonstration of a large vessel occlusion have significantly increased CTA access in many centres, the employment of CTA may not be necessary. A recent study demonstrated a modest reduction in ICH volume with tranexamic acid administration based on NCCT diagnosis of ICH. 24 A growing body of evidence suggesting that hyperacute administration is required to be effective in preventing HE.24,25 Whereas earlier studies sought to intervene medically within 6 hours, current ICH trials are focused on hyperacute (<2 hour) medical intervention with either rFVIIa or Tranexamic acid (STOP-MSU NCT03385928 and FASTER NCT00109382 studies). Rapid ICH diagnosis is required, established either in mobile stroke units where CTA is not available or in the emergency room where contrast administration may lengthen the time from ictus to diagnosis. While the safety profile of tranexamic acid may lend itself to “nonselective” administration to patients with and without a risk of HE, ideally intervention would be best given only to patients with risk for HE. There is therefore an increased interest in NCCT markers of HE as potential biomarkers to guide therapeutic intervention. However, the relatively low prevalence of these markers and heterogeneity of inter- and intra-agreement suggests that an autonomous assessment utilizing radiomic features may be a superior approach.
Our data demonstrated that the inclusion of NCCT radiological signs is best for “ruling out” conditions whereas the inclusion of radiomic features is best for “ruling in” conditions.21,26 The distinction may be important depending on the drug choice to avert HE. rFVIIa is previously shown to be effective in reducing HE however is associated with a significant risk of thrombotic complications including deep vein thrombosis, stroke, and myocardial infarction. rFVIIa use would favor a “rule in” approach to the condition so that only patients with risk of HE is exposed to the potential complications of rFVIIa administration. Tranexamic acid is recently shown to be an alternative promising intervention with a relatively robust safety profile. A rule out approach to conditions would be most appropriate for this intervention given its safety profile. Our data suggest that a combination of radiological and radiomic features appears to provide some compromise between the two approaches.
Scores incorporating clinical and radiological elements for the prediction of HE have been previously published. Inclusion of baseline imaging features, including baseline ICH volume or CTA Spot sign improve outcome prediction in ICH. 27 Several scores employing NCCT features have been validated including the 9-point, BRAIN, HEAVN, and BAT scores.28–31 The AUC for HE ranged from 72% to 81%. The predictive results presented in the current study exceed existing NCCT scores in the literature; however, it should be acknowledged that score assessments of HE has not yet impacted research or clinical decision-making in the absence of effective therapies. The ICH score is a common tool used to guide clinical care by predicting 30-day mortality in patients with ICH. 32 External validation of the ICH score at 30 days reported a c-statistic of .86 that is maintained at 3 (c = .88), 6 (c = .87), and 12 months (c = .87). 33 This standard implies that a similar performance will be required for NCCT radiological and radiomics-based tools to guide clinical decision-making in the era of effective interventions for HE.
While our results meet these standards, there are differences in magnitude between our results and existing results in previously published literature. Other papers have reported better performances of up to 92% AUC on datasets of similar size but represent fewer than 4 centres6–8 (compared to the 38 sites in our study). Optimistic AUC would be expected in studies involving fewer sites because the inter-centre variation in image acquisition protocols is reduced, making data more homogeneous and predictable, but less generalizable. Conversely, the heterogeneity in our data makes HE prediction using radiological and radiomic features more challenging, but yields results that are potentially more generalizable. A larger multicentre study including 112 sites, achieved a lower mean performance of 70% 34 compared to 81% in our study. This study and a study by Xie et al. also reported the added value of radiomics to clinical and radiological methods. 4 Pszczolkowski and Xie respectively report higher increases of 8.4% and 13.3% when adding radiomics features to radiological-based models, and Pszczolkowski reports a 3.6% increase when adding radiomics features to clinical-based models compared to 1% increases in our study.4,34 Pszczolkowski et al. incorporated clinical features within their model, reporting an AUC of .668 (95% CI: .613-.723). However, their clinical model also included baseline hematoma volume and ultra-early hematoma growth in addition to true clinical features such as age or sex. In contrast, the clinical model in this study, achieved an AUC of .803 (95% CI: 69.6-90.6) driven by anticoagulation status and GCS alone. Despite differences between feature sets our data recapitulate findings of other studies demonstrating the importance of anticoagulation use, and baseline GCS as strong clinical predictors of HE. 27
Limitations of this study are inclusion of data from 2 treatment trials utilizing rFVIIa. However, in the absence of a treatment effect demonstrated in these studies it is unlikely that the HE outcome measure would be impacted. We must also acknowledge the processing required to generate radiomics-based features will add significant time to the generation of HE prediction models. Given the critical nature of acute prediction of HE it will be important to develop accessible processing tools capable of providing radiomics information to clinicians in a rapid time frame.
In conclusion, addition of radiological and radiomic signs can improve accuracy in HE prediction. AUC for HE prediction was 87.7%, but further study and external validation is necessary to investigate both the clinical validity and utility of these models.
Conclusion
The best performing model for HE prediction combined all feature sets and reported an AUC of 87.7%, with significant improvement in model fit. This finding suggests there is promise in using these feature sets for predicting HE, and establishes the contributions of clinical, radiological, and radiomics features for future model development or validation. This study importantly highlights the value of including radiological feature analysis as an imaging biomarker to improve prediction of HE.
Supplemental Material
Supplemental Material - Clinical Features, Non-Contrast CT Radiomic and Radiological Signs in Models for the Prediction of Hematoma Expansion in Intracerebral Hemorrhage
Supplemental Material for Clinical Features, Non-Contrast CT Radiomic and Radiological Signs in Models for the Prediction of Hematoma Expansion in Intracerebral Hemorrhage by Zejia Frank Chen, Liying Zhang, André M Carrington, Rebecca Thornhill, Olivier Miguel, Angela M Auriat, Nima O Fard, Shiva Hiremath, Vered Tshemeister Abitbul, Dar Dowlatshahi, Andrew Demchuk, David Gladstone, Andrea Morotti, Ilaria Casetta, Enrico Fainardi, Thien Huynh, Marah Elkabouli, Zoé Talbot, Gerd Melkus, and Richard I Aviv in Canadian Association of Radiologists Journal
Footnotes
Declaration of Conflicting Interests
The author(s) declared no potential conflicts of interest with respect to the research, authorship, and/or publication of this article.
Funding
The author(s) disclosed receipt of the following financial support for the research, authorship, and/or publication of this article: This work was supported by the Canada Foundation for Innovation - John R. Evans Leaders Fund (41174).
ORCID iDs
Supplemental Material
Supplemental material for this article is available online.
References
Supplementary Material
Please find the following supplemental material available below.
For Open Access articles published under a Creative Commons License, all supplemental material carries the same license as the article it is associated with.
For non-Open Access articles published, all supplemental material carries a non-exclusive license, and permission requests for re-use of supplemental material or any part of supplemental material shall be sent directly to the copyright owner as specified in the copyright notice associated with the article.