
Abstract
Introduction
Diabetic foot ulcers are commonly seen complications in long-standing disease and generate a significant societal medical and economic burden. 1 Twenty-five to 30% of diabetic patients will develop a foot ulcer and 50% of these foot ulcers will become infected, possibly resulting in osteomyelitis. 2 Diabetic foot ulcers are the leading cause of non-traumatic amputation of the lower limb and have been found to be a significant independent predictor of mortality with 50% of patients dying within 5 years. 3 Infection and ischemia are the most important factors in determining the prognosis of foot ulcerations and can both be assessed with magnetic resonance imaging (MRI). 4 In the presence of zones of ischemia, or devascularization, Ledermann et al found more false negatives in the identification of foot osteomyelitis and abscess.5,6 To our knowledge, no other studies have described the impact of their identification on clinical management or therapy. The aim of our study is to evaluate the prevalence of devascularization on contrast-enhanced MRIs in diabetic patients suspected of having foot osteomyelitis, the impact on the performance of the MRI assessment and to evaluate if there were any pitfalls for identifying it or, when present, if there were any pitfalls in interpreting the MR images.
Material and Methods
Patient Demographics
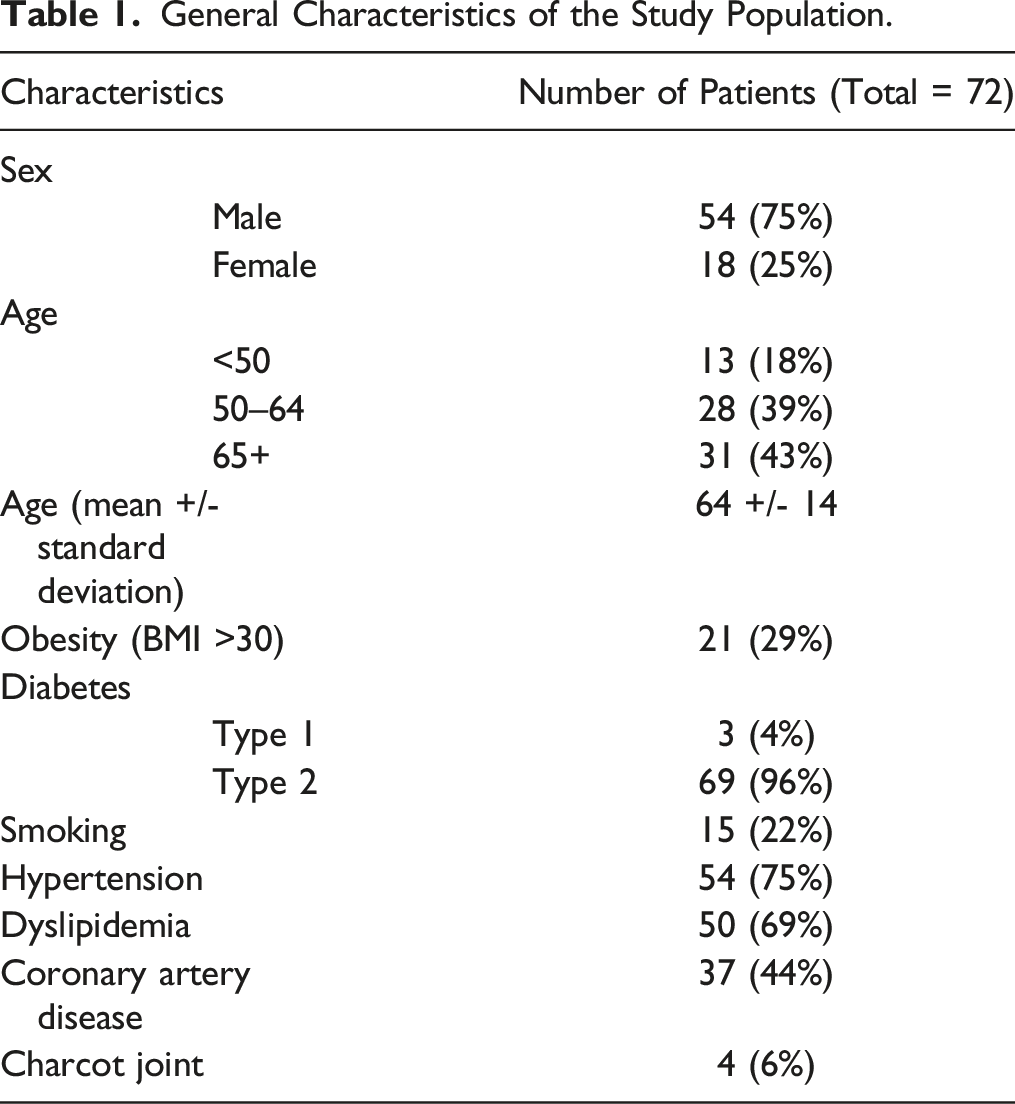
All patients presenting at our institution between January 1st, 2016 and December 31st, 2017 with suspicion of diabetic foot infection were screened through our archive data system. Exclusion criteria included age below 18, non-diabetic patients, pregnancy, recurrent episode in the same patient and previous amputation at or above the ankle for the investigated extremity. 223 diabetic patients were identified, and 98 had a foot MRI. From those 98 MRIs, 72 were contrast-enhanced and were included in our analysis (Figure 1). The studied population included 54 men and 18 women with a mean age of 64 years ± 14 (standard deviation) (age range 33–90 years). Most of them (69/72, 96%) suffered from type II diabetes. Clinical information regarding peripheral pulse was available in 40/72 patients (56%), of whom 28/40 (70%) had a week or absent pulse in the lower extremity. Antibiotic therapy was initiated in a total of 67/72 patients (93%) intravenously, orally, or both. Other patient characteristics are described in Table 1. Flow chart diagram of patients for this study. General Characteristics of the Study Population.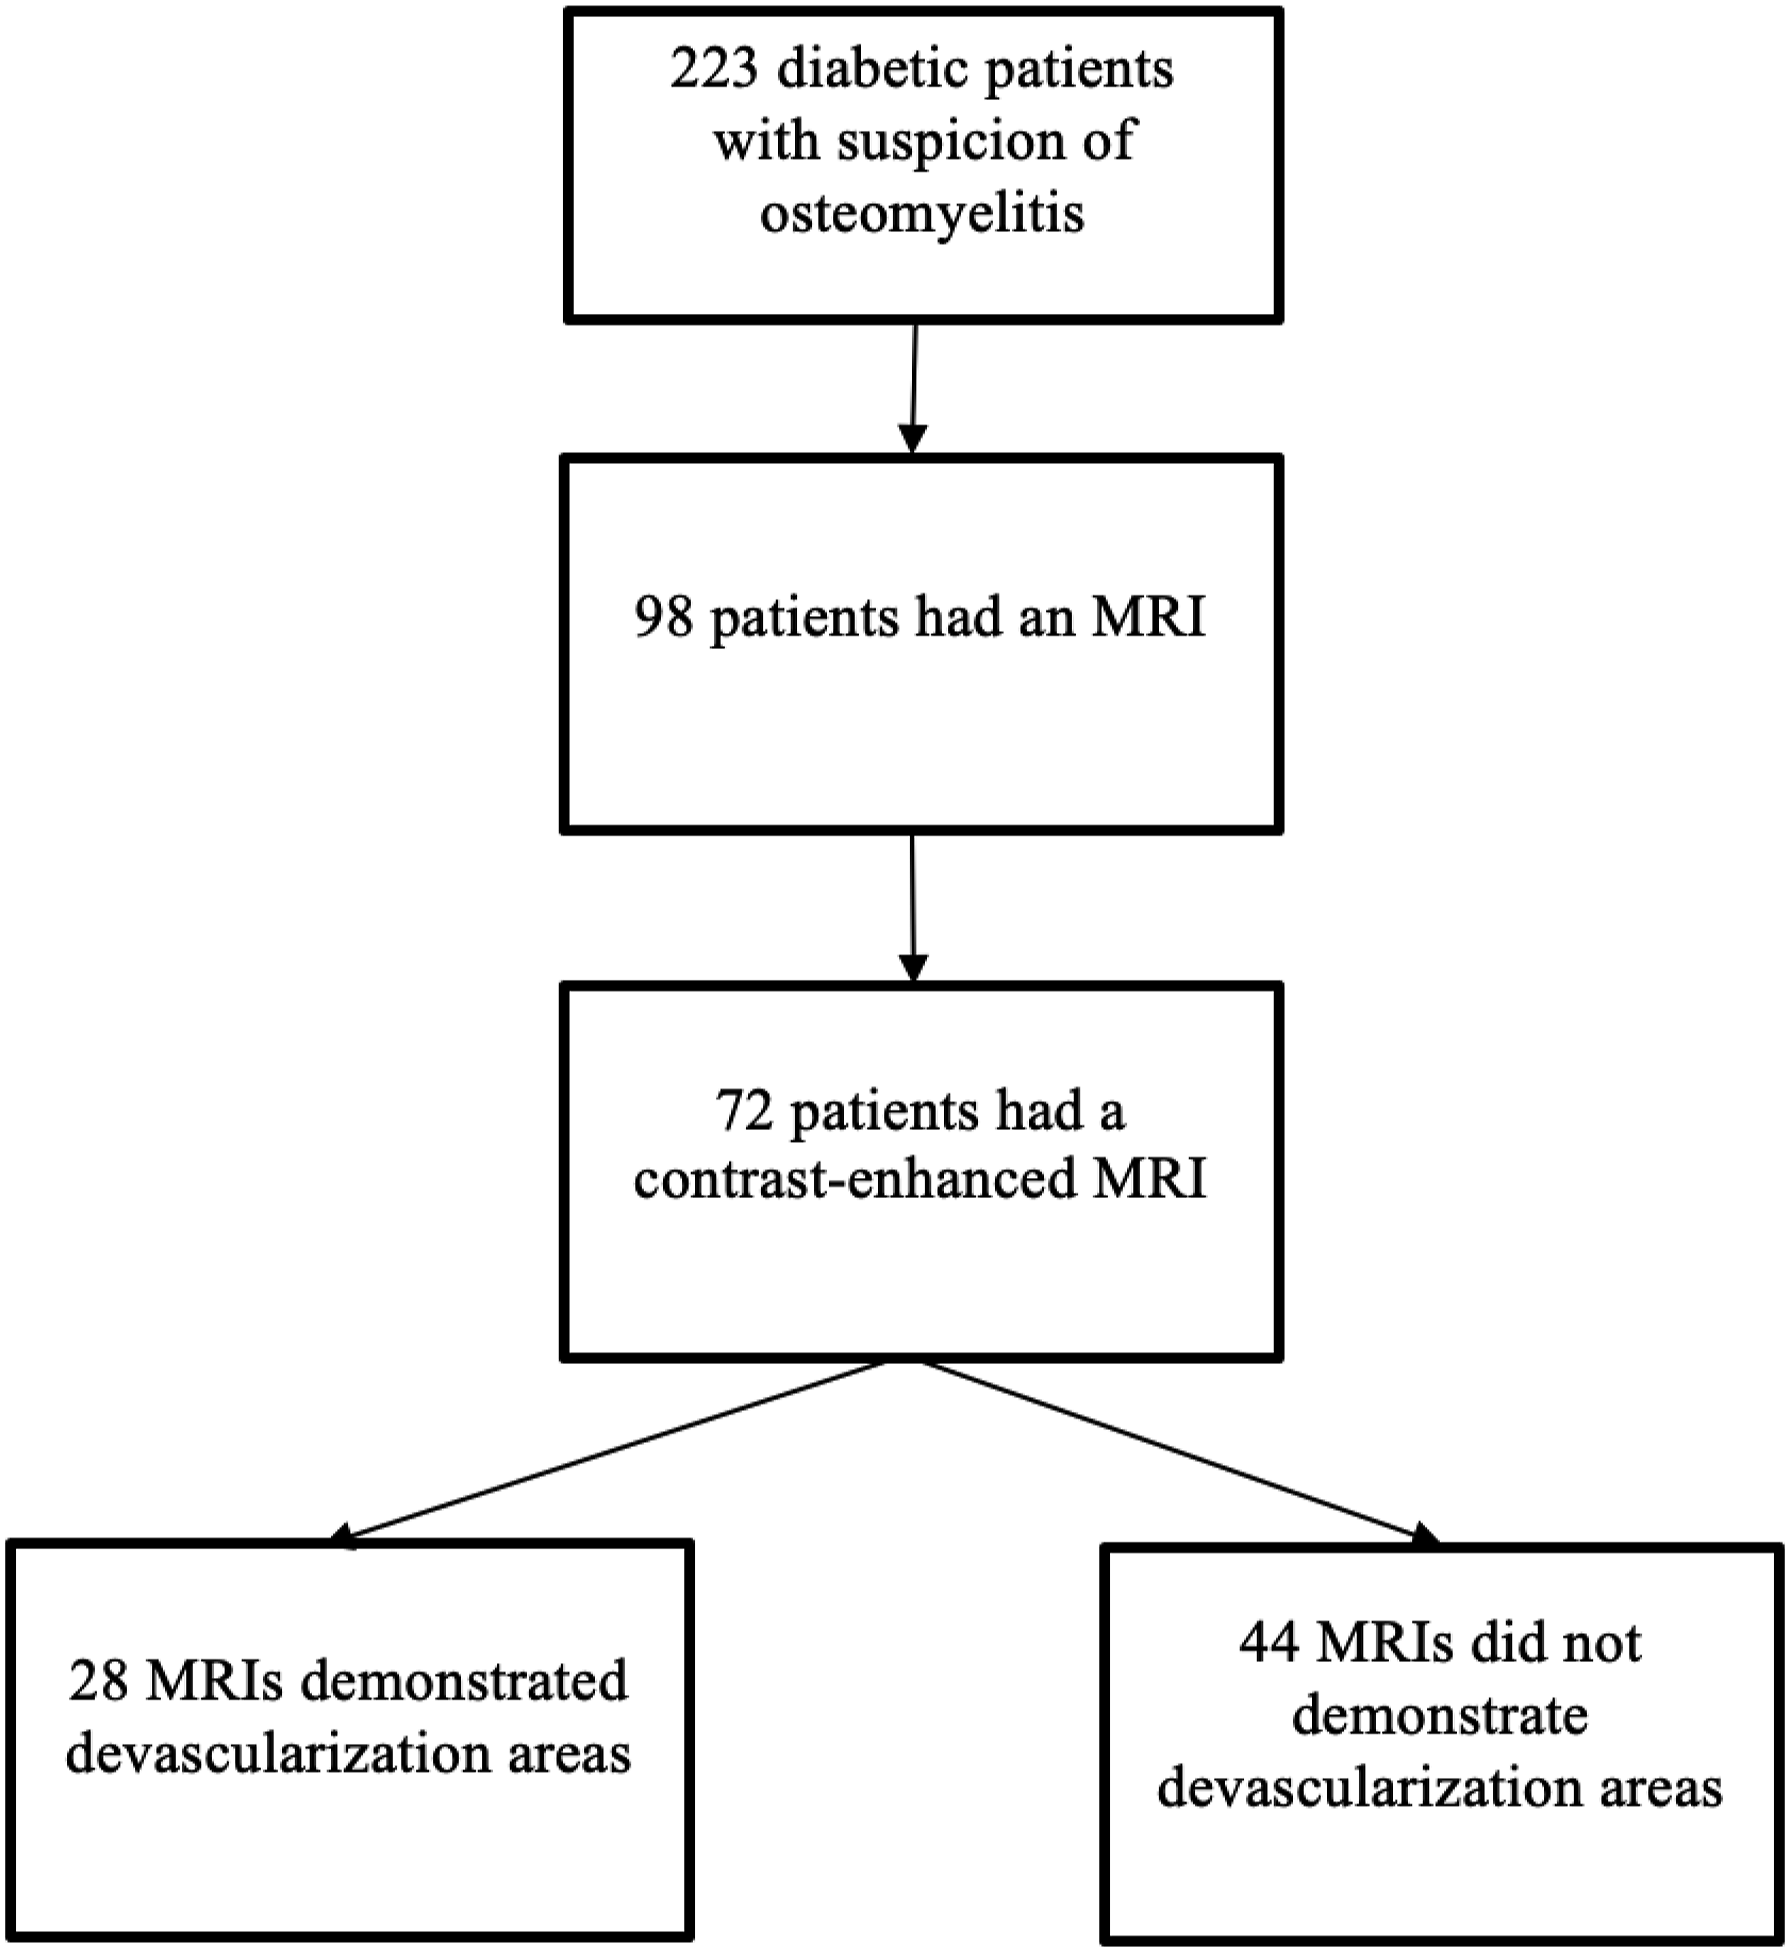
The local ethics committee approved this study. Oral and written consent was waived due to the retrospective nature of this study.
MR Imaging
MR imaging was performed with a 1.5T scanner (Optima MR450w (GE Healthcare) or MAGNETOM Avanto Fit (Siemens Healthcare)) for 17 patients and with a 3T scanner (Achieva or Ingenia (Philips Healthcare)) for 55 patients. All exams were performed with a dedicated foot and ankle coil (field of view ranging from 12 to 20 cm).
The standard sequences for the foot or ankle MRI included at least coronal (short-axis) and sagittal fast spin echo (FSE) T1-weighted (echo time (TE): 10–15 msec, repetition time (TR): 500–730 msec, echo-train length (ET): 3–5, matrix size 256 × 224 or 320 × 320, 2 NEX), and coronal (short-axis) and axial fat-saturated (FS) FSE T2-weighted (TE: 80–100 msec, TR: 3275–7340 msec, ET: 14–17, matrix size 256 × 224 or 256 × 128, 2 NEX) or short tau inversion recovery (STIR) (TE: 48–60, TR: 3400–5250 msec, ET: 11–19, TI: 140–160, angle: 150, matrix size 256 × 192, 2 NEX). Coronal (short-axis) and sagittal FS T1-weighted sequences pre- and post-contrast injection were also performed. The gadolinium-enhanced images were obtained approximately 3 minutes after the administration of gadoteridol (Prohance; Bracco Diagnostics Inc, Monroe Township, NJ) at a dose of .1 mmol/kg of body weight. Slice thickness ranged from 3 mm (with 3.3 mm spacing) to 4 mm (with 5 mm spacing).
Image Analysis
A diagnosis of osteomyelitis was established on MRI if confluent decreased bone marrow signal intensity on T1-weighted images, increased signal intensity on fat-suppressed T2-weighted and STIR images and focal marrow enhancement were detected.7-10 The gold standard for osteomyelitis was defined as pathology-proven osteomyelitis when available (25/72) or, when not available, by history of concordant imaging, laboratory, clinical findings, and clinical follow-up (47/72).11,12 The MR images were also analyzed to evaluate the presence of secondary signs of osteomyelitis including cellulitis, cutaneous ulcers, osteolysis, sinus tract, septic arthritis, tenosynovitis, abscess, neuroarthropathy, and devascularization.7,13
Cutaneous ulcers were defined as a breach in the continuity of the skin or to the soft tissues. Devascularization areas were defined as non-enhancing areas showing homogenously low signal after contrast injection, with an abrupt cut-off of enhancement at the demarcating border.6,8 Areas with extrinsic pressure, as seen with change in skin contour appearing flattened, were not considered as devascularization.
One musculoskeletal radiologist with 10 years of experience and one fellow with 2 years of experience in musculoskeletal radiology independently evaluated the foot and ankle MRIs and looked more precisely for the presence of devascularization and for osteomyelitis, blinded to each other’s readings and to any clinical information about the patients. The readings took place between June and July 2018 on a PACS workstation (Impax 6.6, AGFA HealthCare). A consensus agreement was made by the 2 radiologists afterward for the final diagnosis when discordant. A medical student, blinded to the MRI results, collected clinical data including pathology reports, revascularization procedures, surgical interventions, and outcome.
An unfavorable outcome was defined as antibiotic treatment failure (no resolution of symptoms and no improvement of laboratory inflammatory markers), an amputation or recurrence of osteomyelitis in less than a month at the same location. Recurrence beyond one month was not considered an unfavorable outcome since it could have been due to a new episode and therefore considered a potential bias.
Statistical Analysis
Statistical analysis was conducted by the local biostatistics service. Mean and standard deviation as well as median and interquartile range were used for continuous variables, and count and proportions for categorical variables. The association between devascularization and other clinical variables were tested using a chi-square test. A Fisher exact test was performed when expected frequencies were inferior to 5 in any cell of the contingency table. The agreement between readers regarding the presence of devascularization on MRI was assessed via Cohen’s kappa and agreement percentages. R Software, version 4.0.5 was used for all statistical analysis, and a P-value of .05 was considered significant.
Results
Devascularization Areas in Contrast-Enhanced MRIs of Diabetic Patients
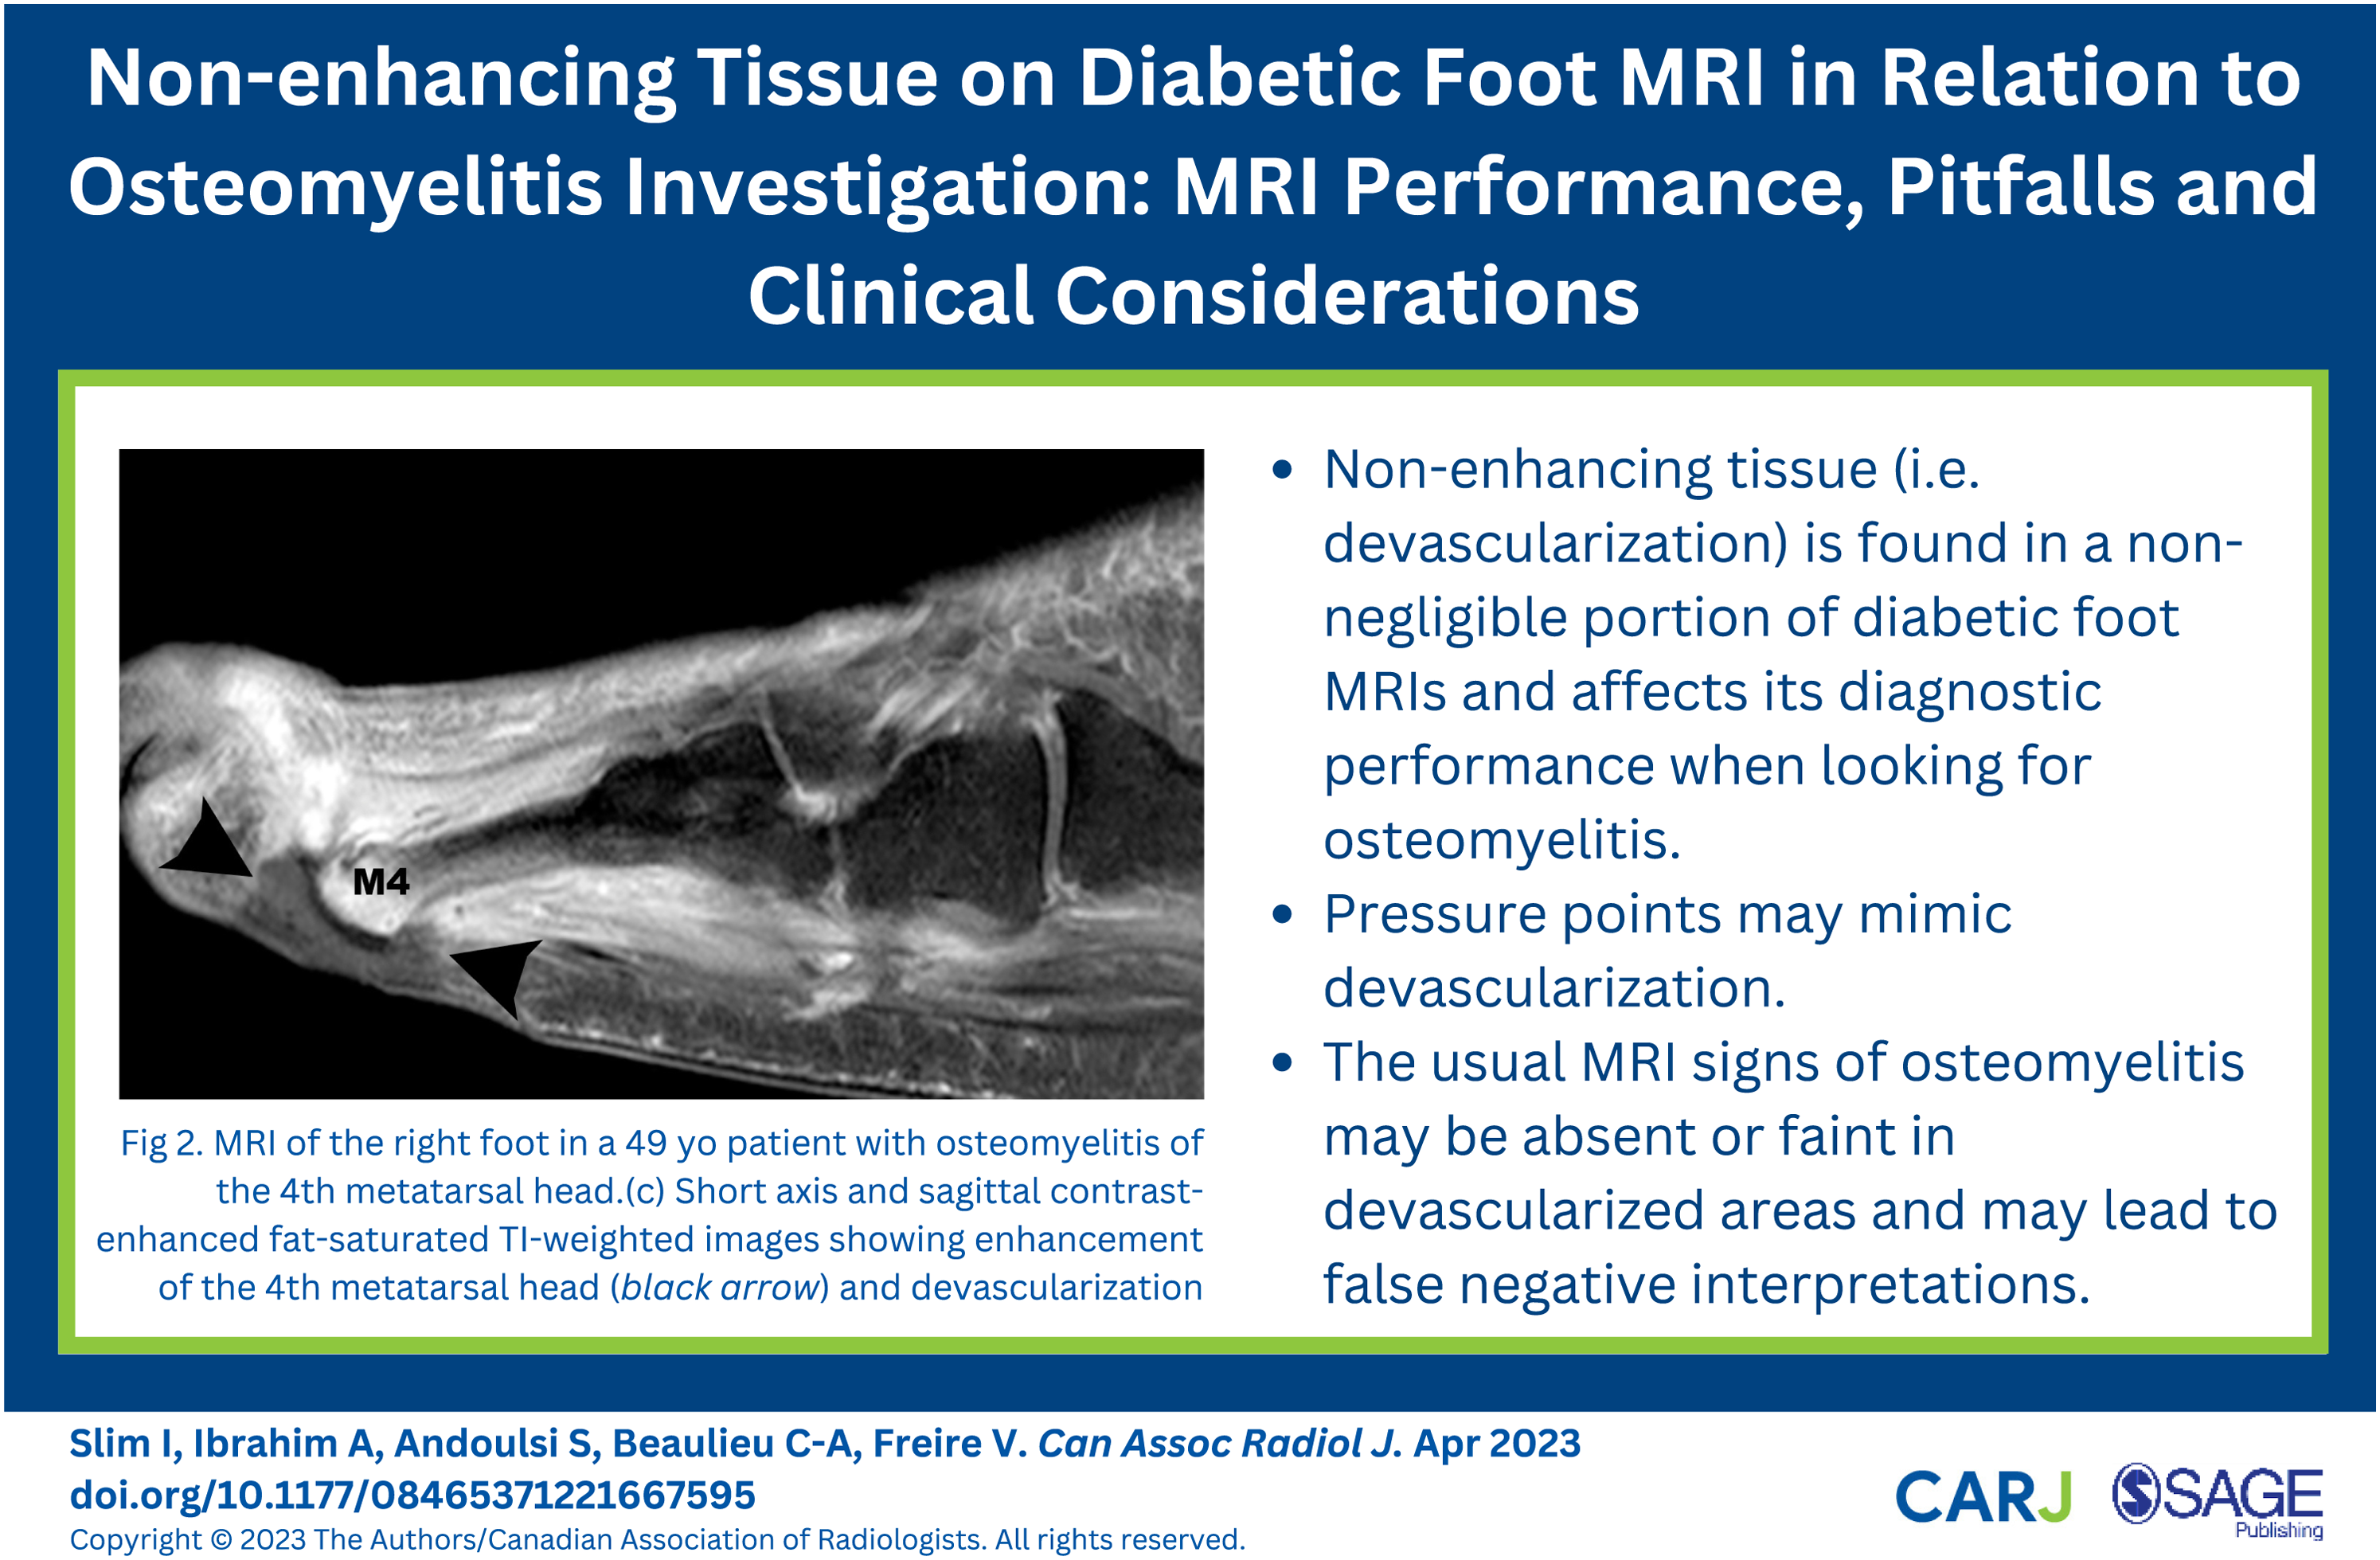
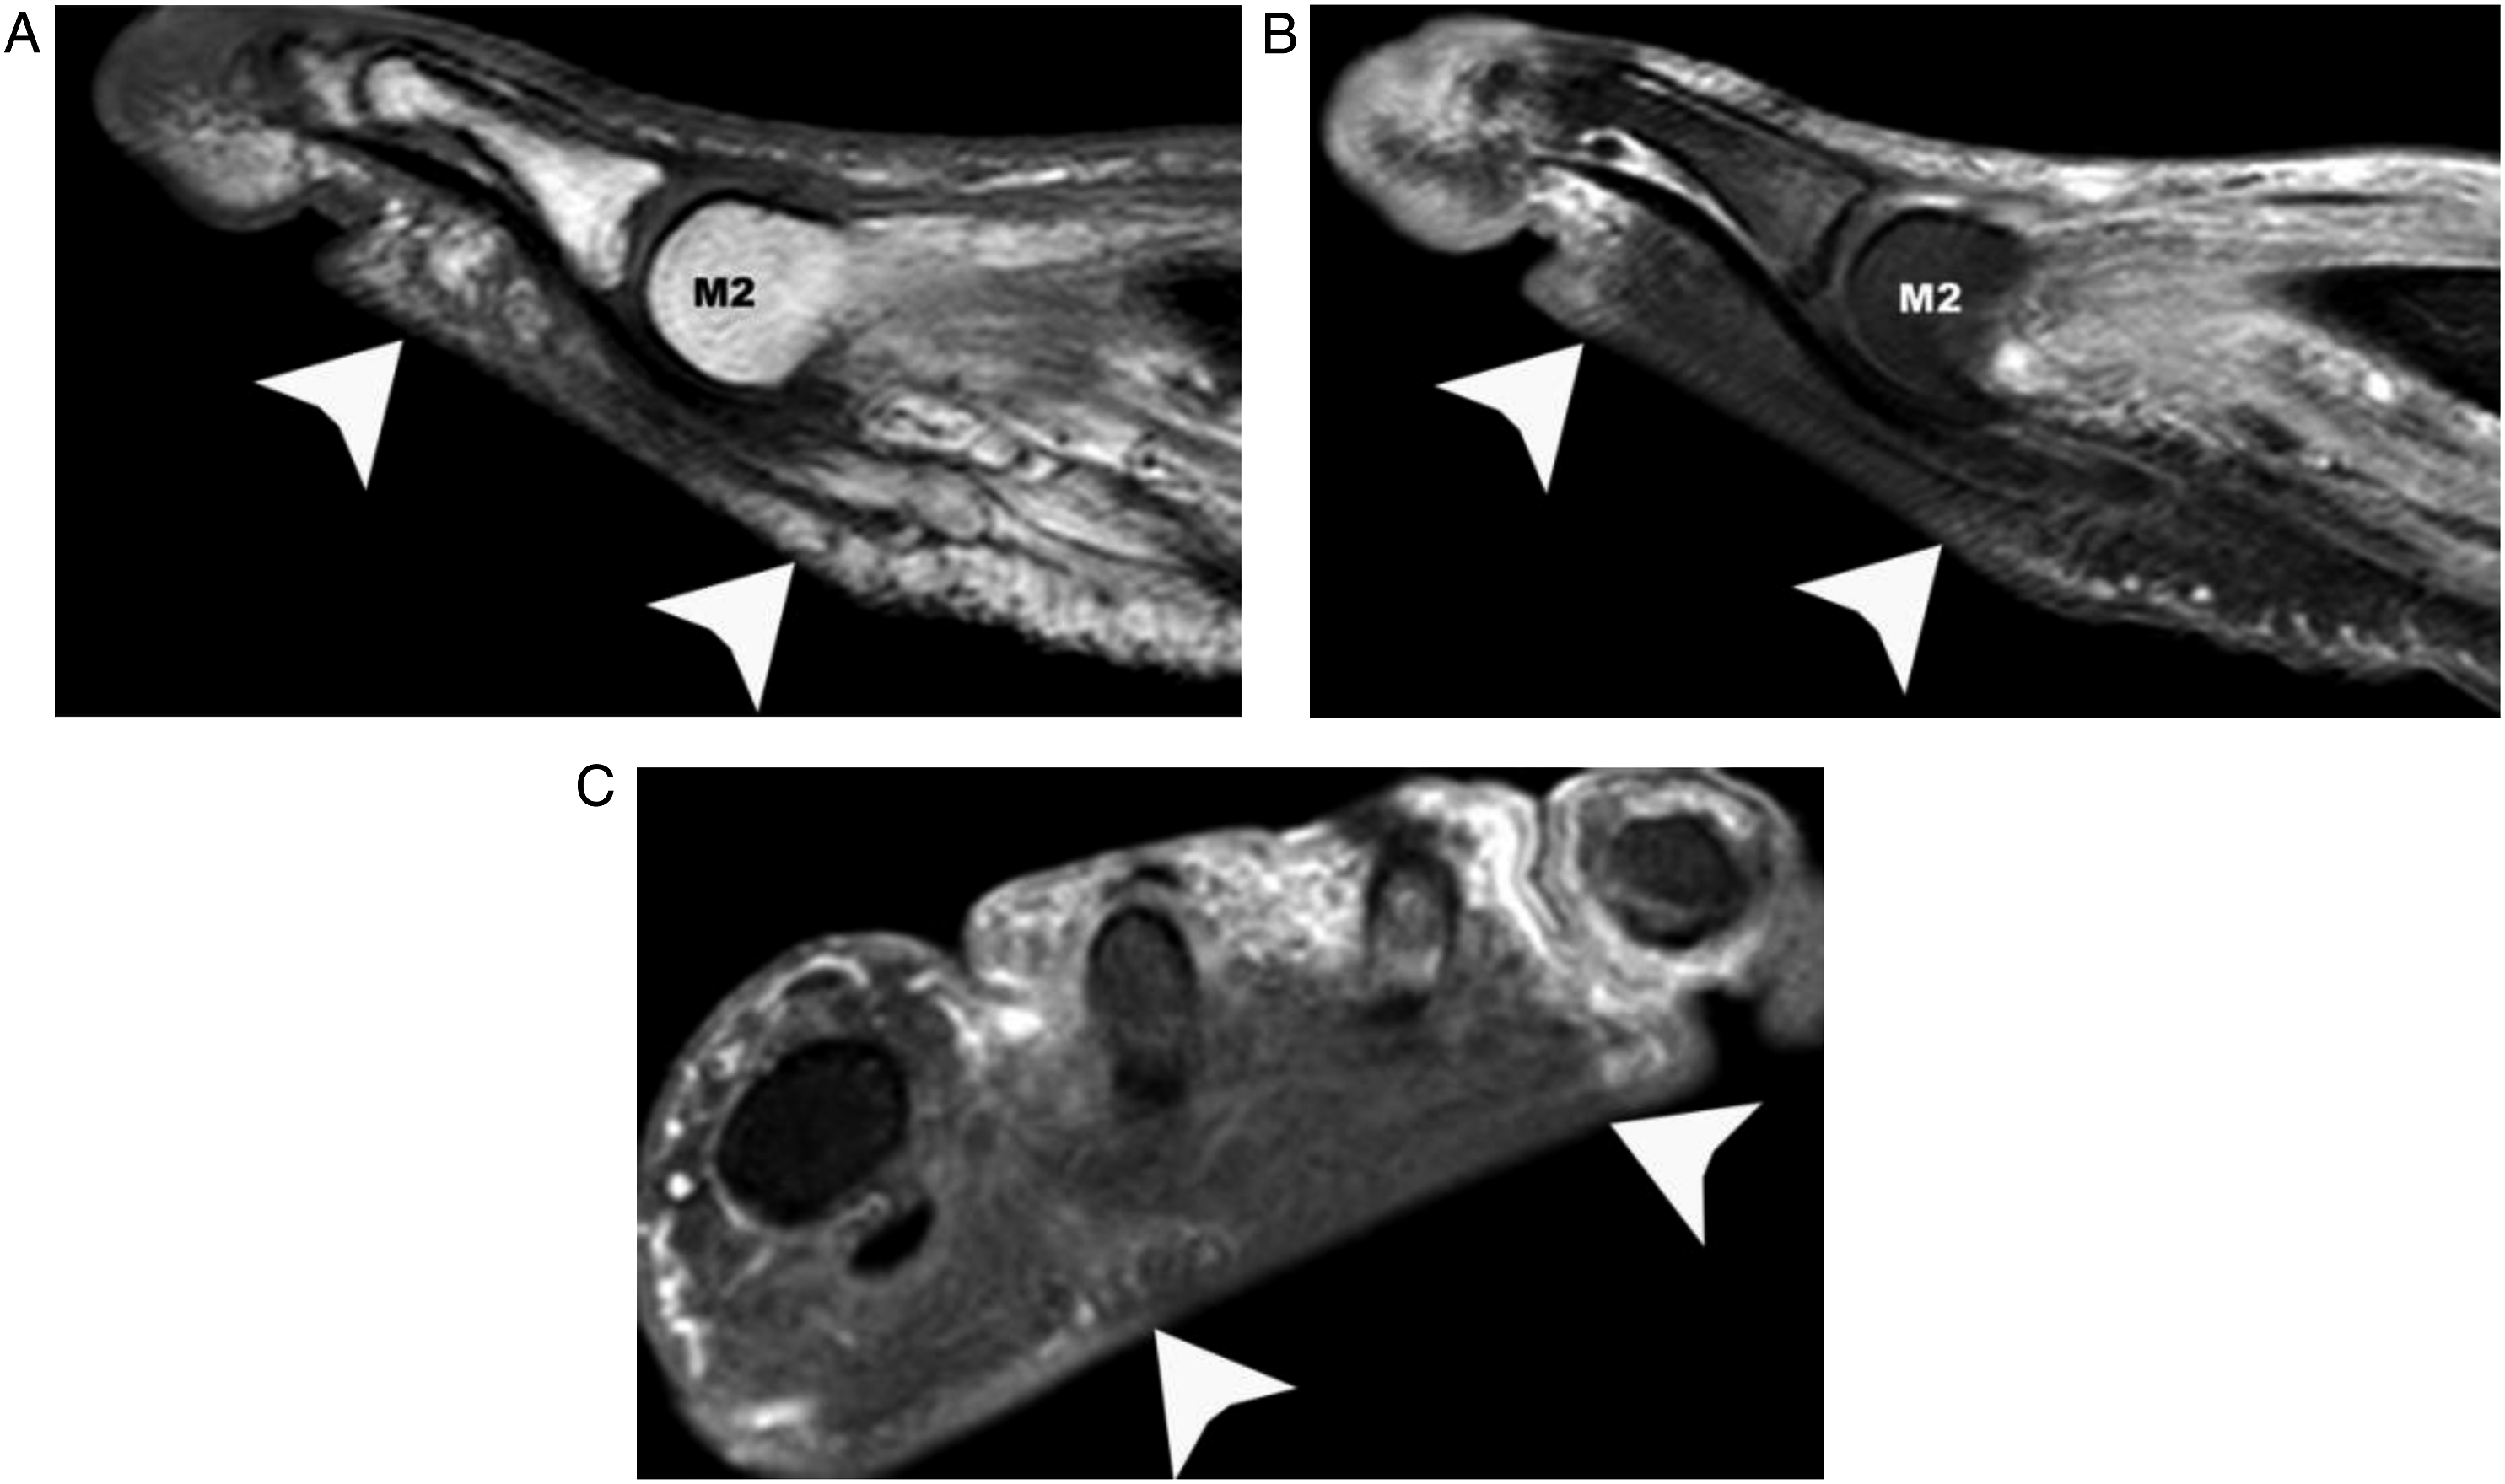
Among the 72 contrast-enhanced MRIs, 28 demonstrated non-enhancing areas (28/72, 39%) (Figure 2 and Figure 3). Of the 72 patients, 10 were discordant regarding the presence or not of devascularization. The kappa coefficient was .71 (substantial). Discordance was mostly associated with zones of pressure that were found to mimic devascularization (Figure 3). No difference in discordance rate was found between 1.5T and 3T scanners (2/17 vs 8/55, P = 1). MRI of the right foot in a 49-year-old patient with osteomyelitis of the fourth metatarsal head. (a) Short-axis T1-weighted image showing confluent hypointense signal of the bone marrow of the fourth metatarsal head (black arrow) (b) STIR-weighted image showing hyperintense signal of the fourth metatarsal head (black arrow) (c-d) Short-axis and sagittal contrast-enhanced, fat-saturated T1-weighted images showing enhancement of the fourth metatarsal head (black arrow in c) and devascularization under the fourth metatarsal head (black arrowhead). M1: first metatarsal head, M4: fourth metatarsal head. Zone of pressure mimicking devascularization areas. MR images obtained in a 54-year-old patient with suspected osteomyelitis demonstrating zones of pressure mimicking areas of devascularization. (a) Sagittal T1-weighted image showing a flatten skin contour beneath the second metatarsal head (white arrowheads) (b) Sagittal contrast-enhanced fat-saturated T1-weighted image demonstrating an area of homogenously low signal after contrast, with an abrupt cut-off of enhancement, mimicking an area of devascularization but limited to the area with flatten skin contour (white arrowheads). There were no hyper-enhancing margins. (c) Short-axis fat-saturated T1-weighted image post contrast showing absence of enhancement in the region of the flatten skin contour (white arrowheads). M2: second metatarsal head.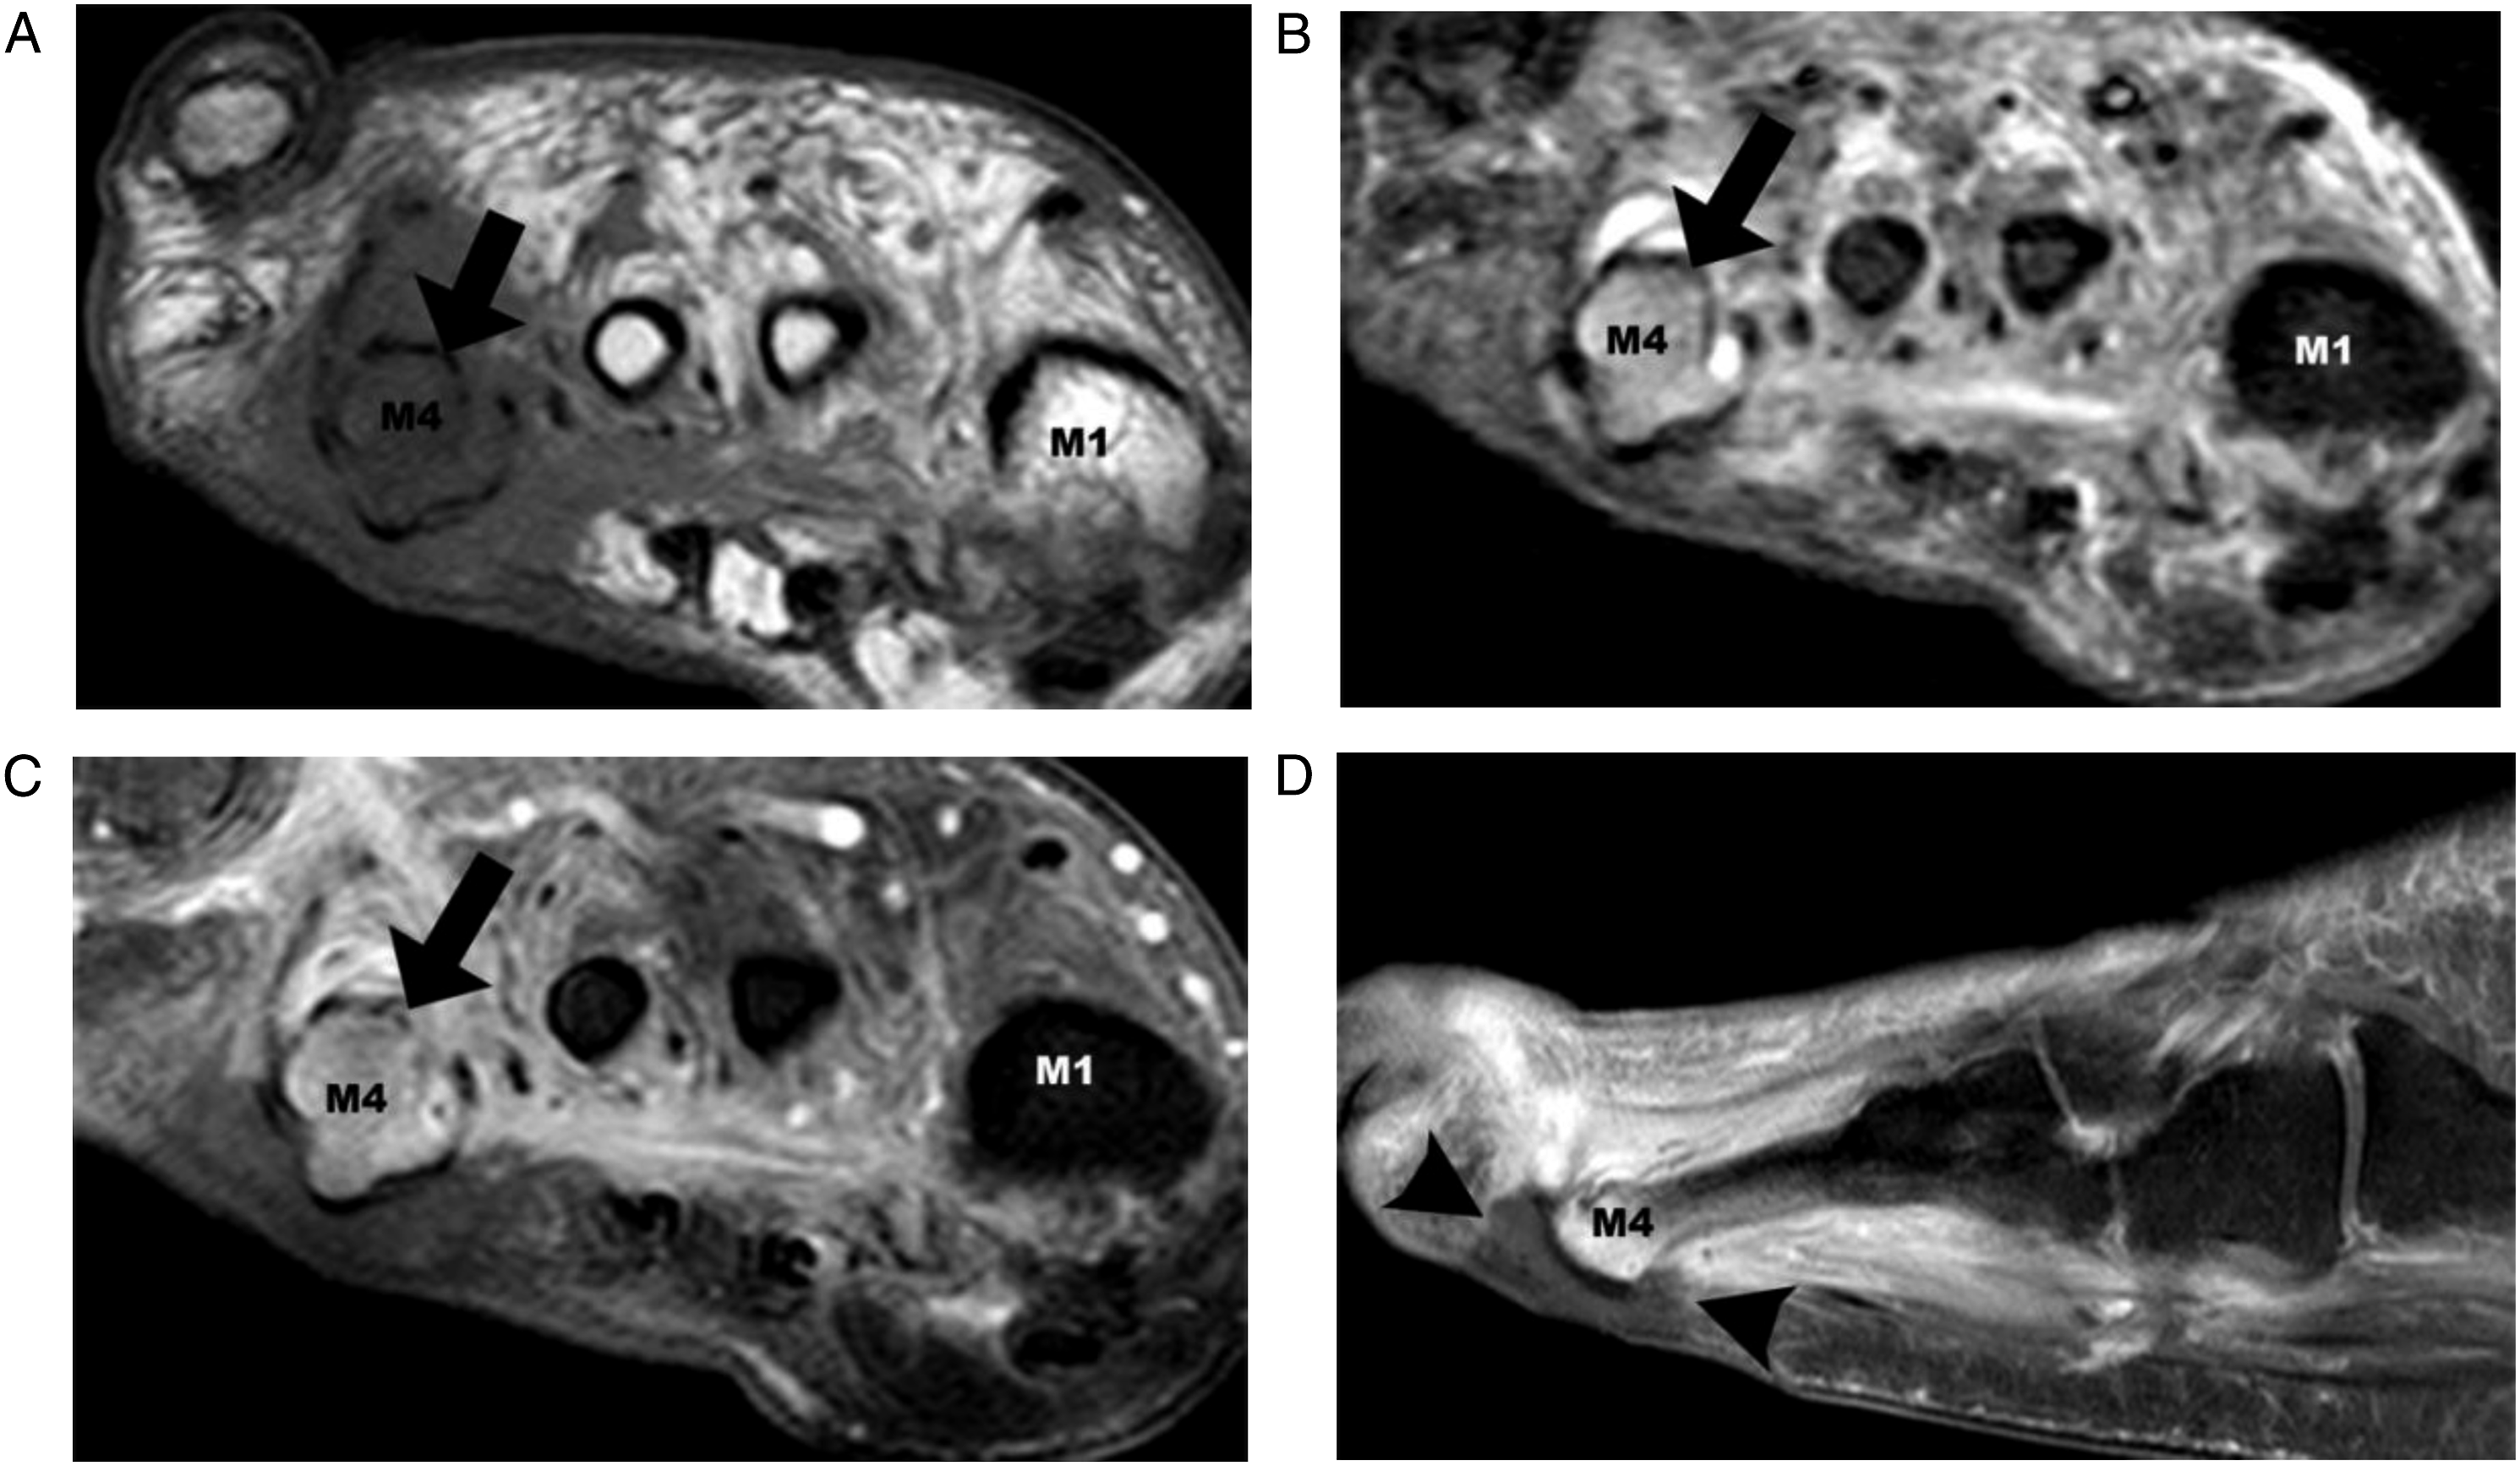
Among the 72 MRI initial reports, 3 were not mentioning a definitive diagnosis of either presence or absence of osteomyelitis (1 in the devascularization group, P = 1). Those MRIs were treated as discordant—or non-diagnostic—for statistical analysis purposes. All 3 were described as severe ischemic foot, 2 with emphysematous changes masking the underlying bone. Comparing the MRI with the gold standard diagnosis, there were 3 false negatives (2 with 1.5T, 1 with 3T, P = .137) and 4 false positives (1 with 1.5T, 3 with 3T, P = 1).
Devascularization and Osteomyelitis
Comparison of Diagnostic and Treatment Outcome in Patients with and without Devascularization on MRI.
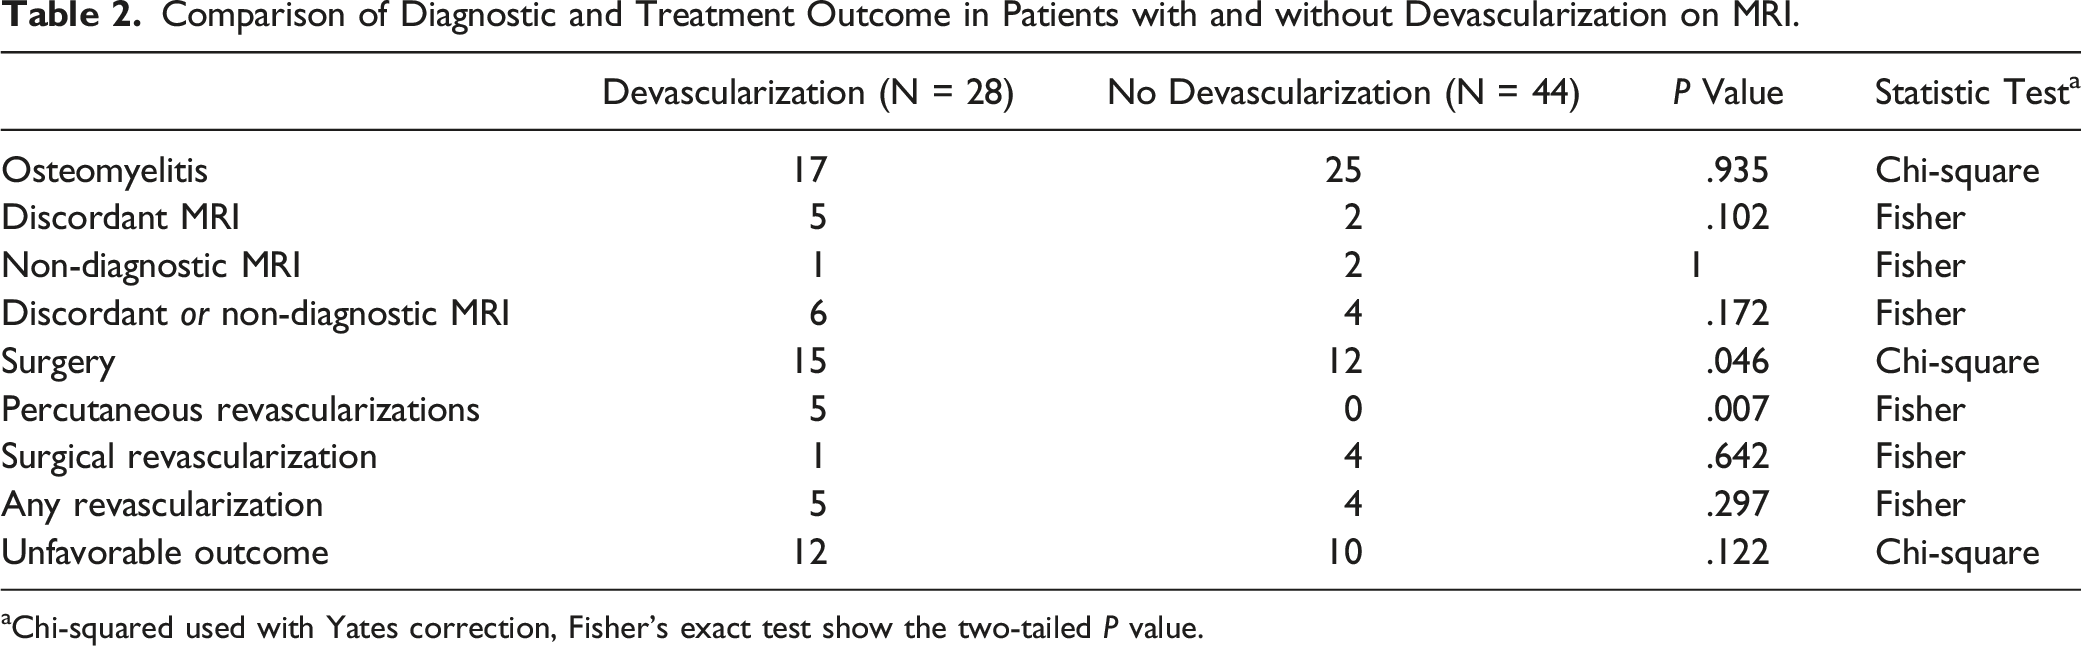
aChi-squared used with Yates correction, Fisher’s exact test show the two-tailed P value.
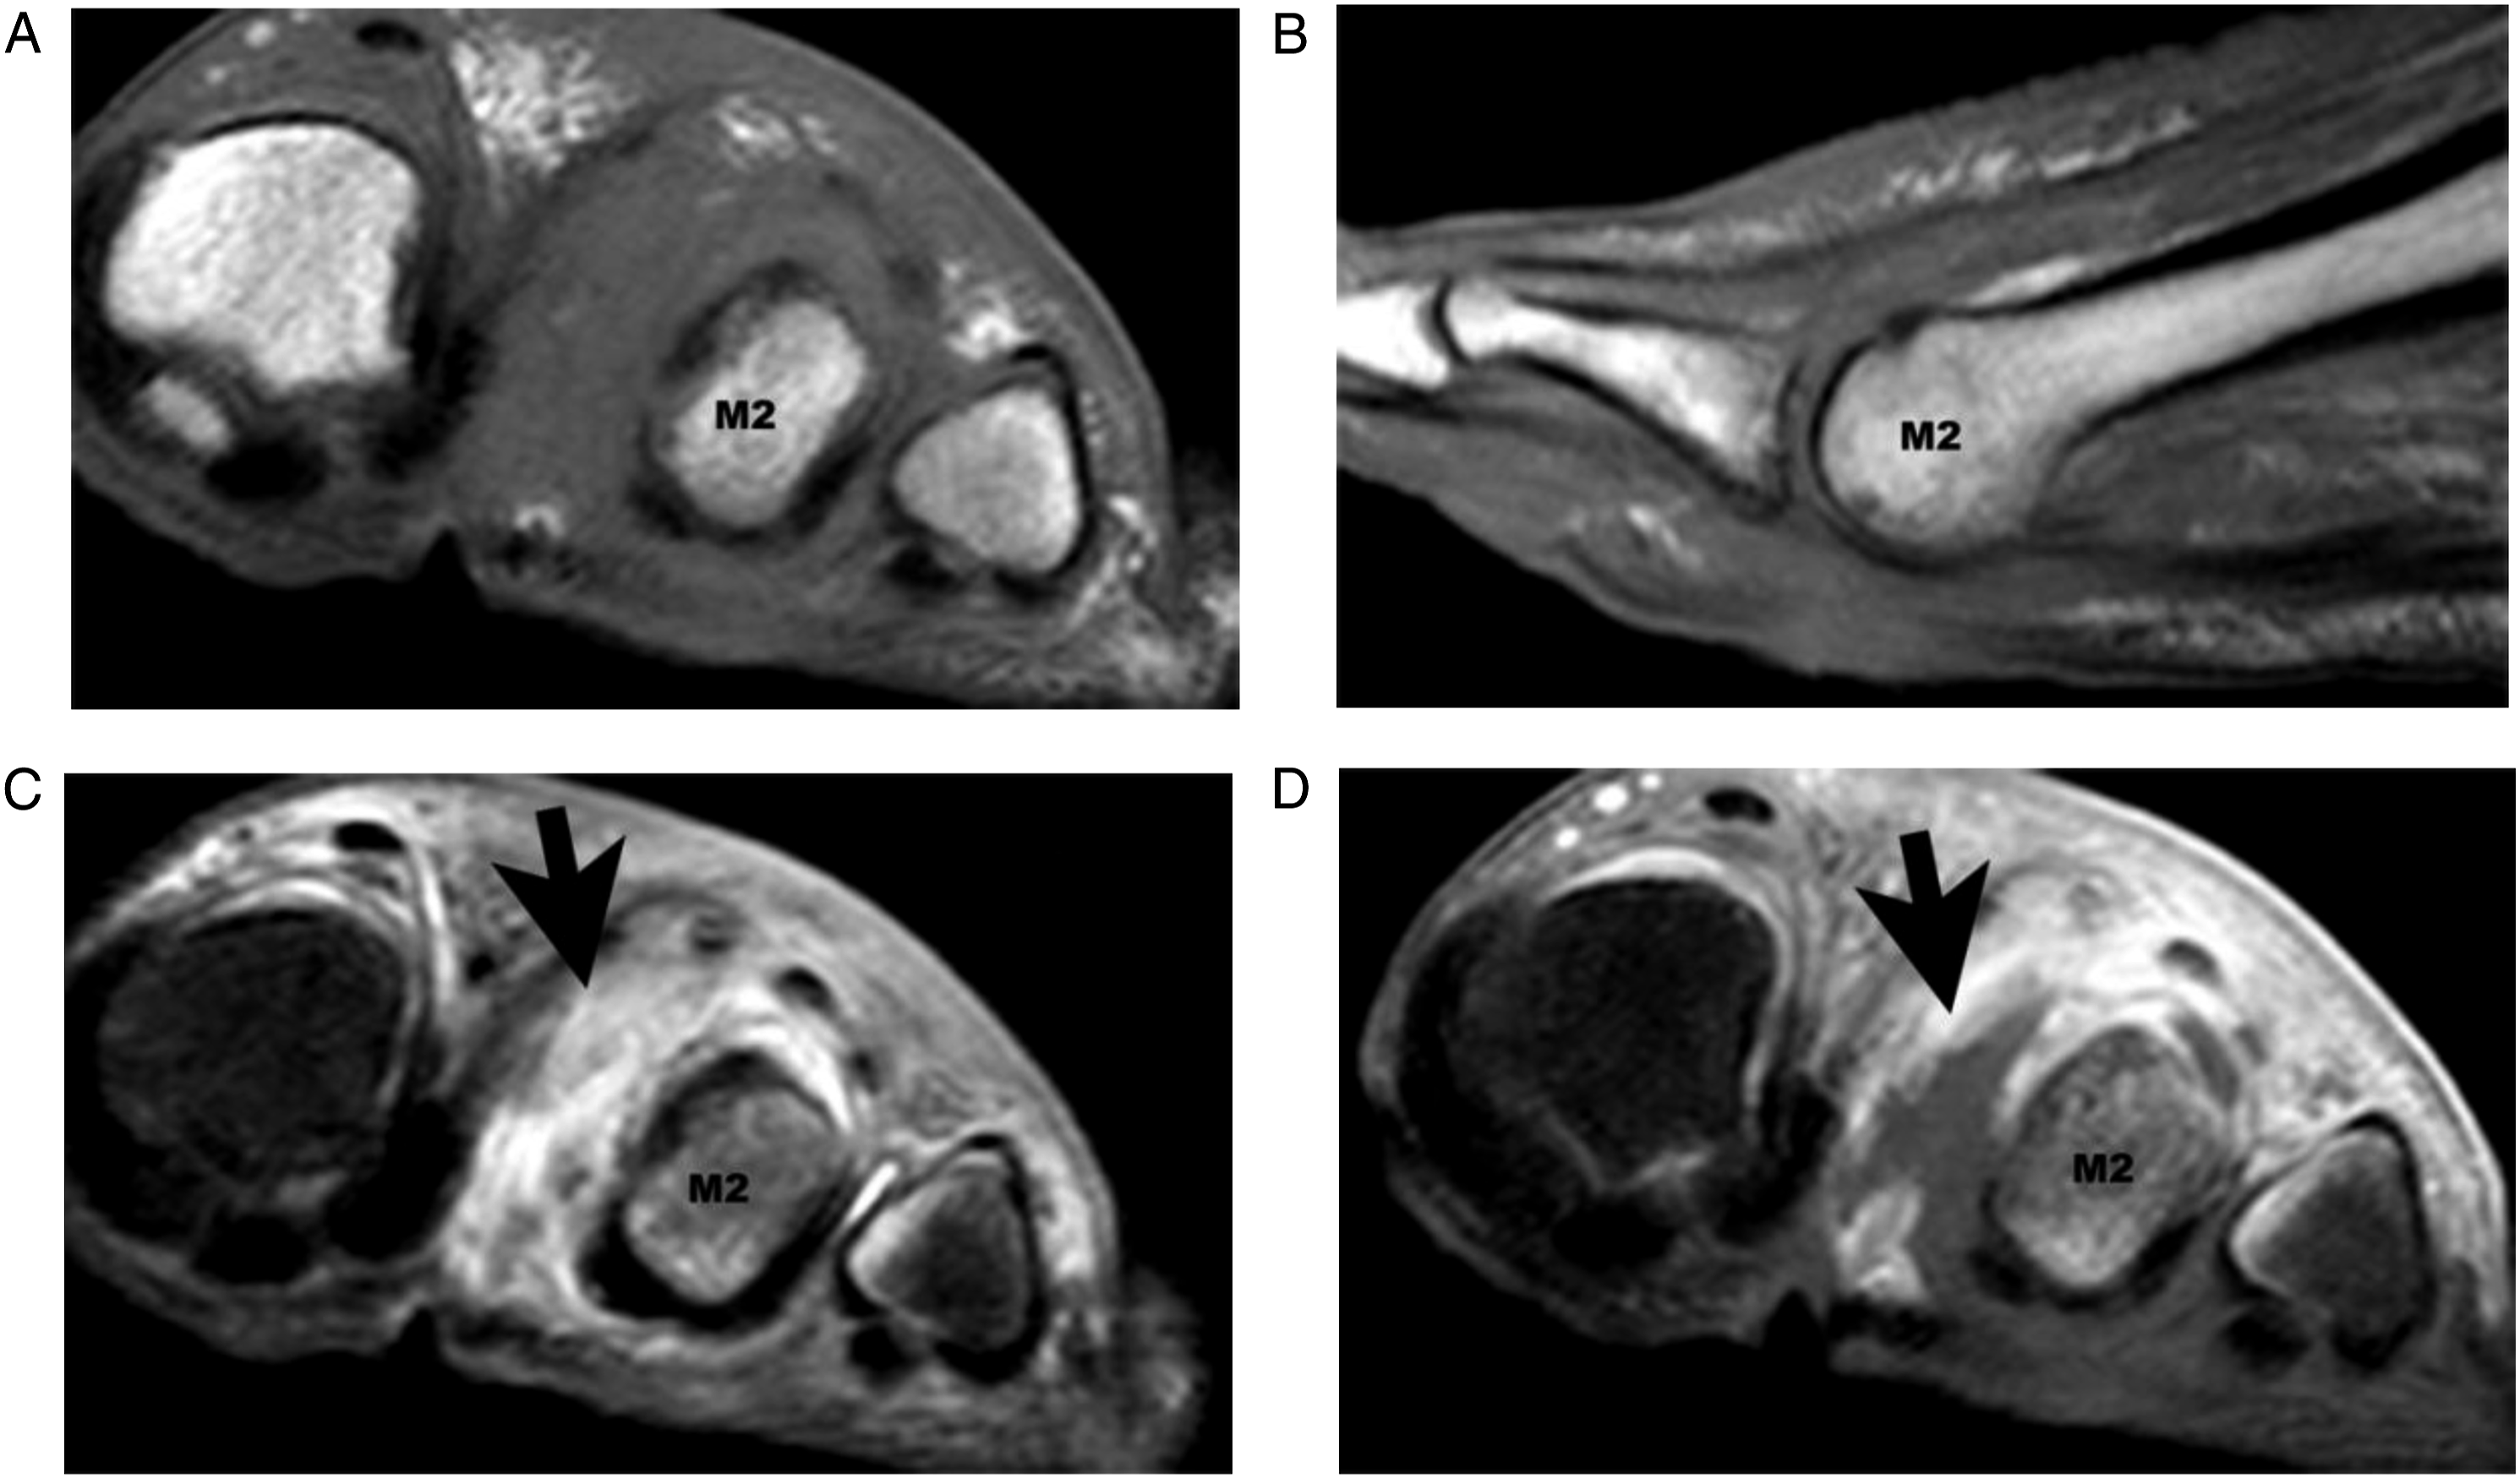
False negative MRI of the foot obtained in a 54-year-old patient with suspected osteomyelitis. (a) Short-axis T1-weighted image showing preserved hyperintense bone marrow in the second metatarsal head. (b) Sagittal T1-weighted image showing preserved hyperintense bone marrow in the second metatarsal head (M2). (c) Short-axis STIR-weighted image showing mild hyperintense signal of the bone marrow in the second metatarsal head on the plantar surface. (d) Corresponding short-axis fat-saturated T1-weighted image post contrast, where an area of devascularization between the first and second metatarsals is seen (black arrow) and only mild plantar enhancement of the second metatarsal head (M2). The devascularization area shows hyper-enhancing margins as opposed to extrinsic pressure points. The MRI reported absence of sign of osteomyelitis for this patient. Patient was amputated and pathology results were osteomyelitis with gangrene. M2: second metatarsal head.
Among the 44 MRIs which showed no devascularization, 25 had a positive diagnosis of osteomyelitis. Based on the gold standard, 3 were misdiagnosed, 1 false positive and 2 non-diagnostics. The false positive was later diagnosed with a fracture, explaining the signal change in the phalanx with T1 medullary replacement mimicking osteomyelitis. Of the 2 non-diagnostic MRIs, one was later found with definitive osteomyelitis and the signal change represented early osteomyelitis that was not definitely diagnosed by MRI initially. The other one was a necrotic toe that was later amputated, and pathology showed necrotic bone.
In MRIs that showed non-enhancing tissue, the discordance rate (including non-diagnostic MRIs) between the MRI diagnosis and the gold standard diagnosis was higher than in MRI that did not show devascularization (21%, 6/28 vs 9%, 4/44, P = .172).
Devascularization and Percutaneous Revascularization
Among the patients whose MRIs demonstrated devascularization areas, 5 (5/28, 19%) underwent percutaneous revascularization, whereas none of the patients without devascularization underwent intervention (P < .01). The decision to treat with revascularization was not based on our MRI report but on the clinical evaluation by the surgeon.
Devascularization and Surgery
Among the contrast-enhanced MRIs which showed devascularization, 15 (15/28, 54%) underwent surgery, which consisted of debridement or amputation. By contrast, 12 patients (12/44, 27%; P = .046) without devascularization underwent surgery.
Unfavorable Outcome and Revascularization
Among those who had a contrast-enhanced MRI with devascularization, 12 patients had an unfavorable outcome (12/28, 43%) as compared to 10 patients among those who did not show areas of devascularization on MRI (10/44, 23%; P = .122).
Discussion
MR imaging is warranted when foot osteomyelitis is suspected in a diabetic patient with inconclusive or equivocal X-ray imaging. 14 MR imaging is also increasingly used in the diabetic population preoperatively, to evaluate the extent of pedal infection and enable a targeted surgical approach, which optimizes preservation of limb tissue and function. 15 Although the utility of MRI to characterize the extent of pedal infection is well-established, it is less often used to assess ischemia. Nonetheless, MR imaging can be informative in the evaluation of ischemia when foot osteomyelitis is suspected in a diabetic patient, given that peripheral arterial disease plays a major role in the development of gangrene and, therefore, in the decision to pursue amputation. 16 The prognostic utility of sharply defined areas of non-enhancement on contrast-enhanced foot and ankle MRIs, that is, devascularization areas, has been described in the past, but never specifically in the diabetic population. Our results confirms that these areas of devascularization are widely prevalent in the diabetic population (28/72, 39%). This percentage is slightly higher than previously described by Lederman and al., in 2002, who found a prevalence of 24.5% (27/110 patients). 6
Lower performance of MRI in ischemic feet was reported in 2013 by Fujii et al. with an interesting study of 16 patients in which they classified the patients’ ulcers in neuropathic or ischemic nature, with or without infection. 5 They found that unenhanced MRIs were reliable in distinguishing osteomyelitis from reactive bone marrow edema for neuropathic ulcers but not for ischemic ulcers. This phenomenon was explained by insufficient interstitial fluid since MRI depends on the presence of fluid in the bone marrow to diagnose osteomyelitis. This could explain our false negative result shown in Figure 4, where no marrow replacement was found on T1-weighted images and where only mild hypersignal on STIR and mild enhancement after contrast injection were found. Our study also shows lower performance of MRI in diagnosing osteomyelitis in patients showing areas of devascularization. An estimated sensitivity of 80% was found (taking into account that this is not a prospective study and therefore not a true sensitivity), lower than reported in the literature, where MR imaging for the evaluation of pedal osteomyelitis and soft-tissue infections has shown a sensitivity of 90%. 17 Although this finding was not statistically significant, it is still consistent with the findings reported by Ledermann et al. in 2002 and might be of clinical relevance for radiologists dealing with the diagnosis of diabetic foot infections. Knowing that the usual signs of osteomyelitis (i.e., confluent hypointensity on T1-weighted images) might be absent when there is devascularization is certainly of clinical importance when interpreting MRIs and stating our degree of certainty in the final interpretation. Clinicians and radiologists should keep in mind that specific signs of osteomyelitis might be masked in the presence of devascularization, leading to both false negative and false positive studies. One of the false positives in our study was due to previous osteomyelitis with sclerotic chronic bone changes, with hypointensity on T1-weighted images mimicking medullary replacement found in osteomyelitis. Another false positive was due to the presence of a fracture, reiterating the importance of always obtaining a plain radiograph before or with any musculoskeletal MRI.
Since osteomyelitis and ischemia are the most important factors for prognosis and therapeutic management, MRI reports should include if devascularization areas are observed. However, care must be taken not to take pressure points as devascularization areas. We found those pressure points corresponding to cushioning in the extremity coil and points of contact related to positioning. Those areas appear as a flat or deformed skin contour, mostly on the plantar surface of the foot. They can show an abrupt cut-off between enhancing and non-enhancing areas described by Ledermann et al. They don’t show hyper-enhancing margins, which can be present with devascularization and might help to differentiate between both entities. To our knowledge, this has not been published nor described before in the literature and is based solely on our qualitative assessment. Delayed imaging might allow for progressive filling of those pressure points but at the cost of a longer scan time. Alternatively, care as to not put too much pressure on the foot in the antenna could also help, but at the cost of possibly increasing motion artifacts.
Most other imaging modalities for the diagnosis of osteomyelitis in diabetic foot infections rely on a premise of adequate vascular supply (bone scintigraphy, FDG-PET/CT) for the radiotracer to reach the suspected infected area. To our knowledge, no studies have compared specifically the sensitivity and specificity of these modalities and MRI in patient with ischemic disease.
The proportion of percutaneous revascularization and surgery was statistically significantly higher in patients demonstrating areas of devascularization on contrast-enhanced MRIs, although only minimally for surgery. Most probably, devascularization represents a sign of a more severe underlying ischemic disease in the diabetic foot infection. Our absolute numbers are too low to generalize this conclusion. Future studies might look at the ability of MRI to influence patient selection for revascularization procedures and might change clinical practice by identifying those devascularization areas.
Limitations
This retrospective study has some limitations. First, we did not have pathology confirmation for all cases of suspected foot osteomyelitis. Pathological specimens were available for patients who were not considered candidates for medical treatment with antibiotics and underwent surgery. However, in most clinical practices, diagnosis of osteomyelitis involving the diabetic foot is based solely on the combination of clinical findings, biochemical inflammatory markers, and imaging modalities such as MRI or scintigraphy. 11 Only including patients with bone specimen might select more severe infections and disease, necessitating more aggressive treatment with surgery.
A second important limitation was the relatively small sample of patients used to conduct our analysis, limiting external validity. Our study is a retrospective observational study, and as such, does not imply causality. Further work is necessary to validate our observations.
A third limitation was the fact that the presence or absence of devascularization was determined qualitatively and not quantitatively. Two radiologists independently evaluated the images to reduce subjectivity with defined criteria of absence of enhancement surrounded by an abrupt cut-off. Dynamic contrast evaluation has been reported but is not standard for investigation of diabetic foot infections in our institution. This quantitative approach could have improved reproducibility.
Conclusion
In conclusion, non-enhancing tissue is found in a non-negligible portion of diabetic foot MRIs and affects its diagnostic performance when looking for osteomyelitis. Two pitfalls were identified. The first one was in the identification of non-enhancing areas because pressure points may mimic devascularization. The second one was that the usual MRI signs of osteomyelitis may be absent or faint in devascularized areas and may lead to false negative interpretations. It is mandatory that radiologists rely on all the other findings (including ulcer, sinus tract, abscess, osteolysis) in their final interpretation. The recognition of these areas of devascularization may be helpful for the physician in planning the best treatment option for the patient.
Footnotes
Declaration of Conflicting Interests
The authors declared no potential conflicts of interest with respect to the research, authorship, and/or publication of this article.
Funding
The author(s) disclosed receipt of the following financial support for the research, authorship, and/or publication of this article: This work was supported through a grant from the Department of Radiology, Radiation Oncology and Nuclear Medicine of the University of Montreal (2250$ CAD) and the Department of Radiology of the University of Montreal Health Centre (2250$ CAD), essentially for biostatistical support.