
Abstract
Purpose:
Quantify resident caseload during call and determine if there are consistent differences in call volumes for individuals or resident subgroups.
Methods:
Accession codes for after-hours computed tomography (CT) cases dictated by residents between July 1, 2012 and January 9, 2017 were reviewed. Case volumes by patient visits and body regions scanned were determined and categorized according to time period, year, and individual resident. Mean shift Relative Value Units (RVUs) were calculated by year. Descriptive statistics, linear mixed modeling, and linear regression determined mean values, differences between residents, associations between independent variables and outcomes, and changes over time. Consistent differences between residents were assessed as a measure of good or bad luck / karma on call.
Results:
During this time there were 23,032 patients and 30,766 anatomic regions scanned during 1,652 call shifts among 32 residents. Over the whole period, there were on average 10.6 patients and 14.3 body regions scanned on weekday shifts and 22.3 patients and 29.4 body regions scanned during weekend shifts. Annually, the mean number of patients, body regions, and RVUs scanned per shift increased by an average of 0.2 (1%), 0.4 (2%), and 1.2 (5%) (all p < 0.05) respectively in regression models. There was variability in call experiences, but only 1 resident had a disproportionate number of higher volume calls and fewer lower volume shifts than expected.
Conclusions:
Annual increases in scan volumes were modest. Although residents’ experiences varied, little of this was attributable to consistent personal differences, including luck or call karma.
Background
Across different disciplines in medicine, after-hours medical care is evolving toward more service availability outside of regular working hours.1-3 Correspondingly, imaging studies are now viewed as standard components of patient care regardless of the hour of the day.4,5 This is highlighted by a 45-75% increase in after-hours imaging volumes reported in Toronto between 2006 and 2013, with computed tomography (CT) as the dominant modality. 4 Part of the resident educational and service experience involves coverage during after-hours (“on-call”) shifts. Prior to this study, it had also been felt anecdotally that resident medical imaging call at our institution was becoming more demanding, with perceived higher patient volumes and caseload variation between shifts and, possibly, between residents. This perception of higher volume shifts was based on resident recall and experience. There were no recent changes to departmental equipment or imaging protocols that would have been expected to increase case volumes.
Although a cultural misappropriation of the concept of karma, “call karma” refers to the belief that the call busyness of a particular health care provider is predictable. This has alternatively been called “jinxing” or “black clouds.”6-10 For example, radiology residents thought to possess bad call karma would expect an inordinate amount of CT imaging during their call shifts compared to peers. A subjective sense of this call demand inequality has been expressed both within our institution and in training programs elsewhere.6-10
Given these perceptions, the call schedule structure was under review at the time of study initiation, aiming to ensure both resident well-being and high-quality case interpretation. Our aim was to ensure that call demands were manageable for all resident experiences, not just the average shift. We also wanted upcoming changes to be robust enough to handle expected case load increases based on trends from the recent past. At the time of this review, resident call shifts were 15 hours on weekdays (17:00 to 08:00) and 24 hours on weekends (08:00 to 08:00). During call hours, residents organized and interpreted all emergency department and inpatient CTs, ultrasounds, and fluoroscopic procedures, with back-up from staff radiologists. They also interpreted radiographs if directly consulted by a hospital physician. Full reports were given for all cases. During weekend shifts, a second resident was on call for the morning, interpreting emergency department radiographs and ultrasound while also performing fluoroscopic procedures during that time. Resident call coverage is for a single tertiary care hospital in the city of Saskatoon with a regional population of approximately 250,000. Defining exact catchment is difficult as the city is also serviced by 2 additional smaller hospitals, but many patient and imaging referrals are from outside of the city, ultimately servicing of the province with a catchment population of 500,000.
Thus, this study’s objective was to quantify resident caseload during call and determine if there were consistent differences in call volume for individuals or resident subgroups.
Methods
This study qualified as exempt from research ethics board review. All after-hours CT cases dictated by medical imaging residents between July 1st, 2012 and January 9th, 2017 were assessed. Data was obtained using software integrated with the radiology information system (RIS) and the picture archiving and communication system (PACS), Philips Intellispace PACS Radiology with iSyntax 4.4 (Koninklijke Philips N.V., Amsterdam, Netherlands). On-call volume was assessed as both the number of CT cases and body regions evaluated respectively, both overall and during sub-periods of daytime (08:00-17:00 on weekends only), evening (17:00-24:00) and overnight (00:00-08:00). Only exams performed after-hours and dictated by the on-call resident were included to exclude after-hours outpatient cases dictated by staff the following days and on-call cases solely reviewed by staff radiologists.
CT scans for all residents performing call during the study period were included in the evaluation of volumes by shift and time period. However, for consideration of individual resident call volume, 2 residents were excluded as they asymmetrically shared their call shifts, preventing accurate assessment of individual call volume. Ultrasound, fluoroscopy, and plain radiographs were not evaluated as it was difficult to definitively separate those performed by the on-call resident from those performed by other imaging residents and some non-radiologists.
All exams were identified and downloaded into an Excel spreadsheet (Microsoft, Redmond, WA) including date/time scanned, dictating resident, and exam code. Some exam codes at our institution are for single body regions while others represent multiple commonly combined regions. Additionally, some patient visits receive multiple codes if the combination of regions scanned is not represented by a single code. Therefore, to determine number of patient assessments per shift, multiple codes performed at the same time on a single patient were collapsed into a single assessment. To determine number of body regions scanned per assessment, all codes were manually reviewed and the number of regions determined (e.g. CT Head = 1 region; CT Head, Neck, Chest, Abdomen-Pelvis = 4 regions). In the case of anatomic redundancy of multiple codes, we estimated the information provided; if the information visible on the exams differed significantly, they were coded as separate regions. For example, CT head combined with CT angiogram (CTA) and Circle of Willis (COW) would be coded as 2 regions while chest CT plus thoracic spine CT would be coded as 1 region.
To account for scan complexity, relative value units (RVUs) were calculated for each study type based on the US-Medicare/Medicaid medical work relative value units from 2015. 11 Since the US-RVUs did not perfectly match the CT body regions in our study, some modifications were made for application to to our data. As in the study by Dora et al, arithmetic means were used if a body region in our study encompassed multiple codes (e.g. CT head included unenhanced, enhanced, and combined studies). 12 There was no single code to describe CTA carotids/COW cerebrovascular scans, so we assumed the sum of codes for CTA neck and CTA circle of Willis. As such, the RVUs utilized for the 6 most common regions in the study were 1.08 for head, 1.82 for abdomen/pelvis, 1.36 for chest, 1.07 for cervical spine, 3.50 for cerebral vasculature, and 1.0 for peripheral bones/joints. These RVUs, in addition to others, were then applied as appropriate to each study and summed to give an overall value for each individual scan.
Using SPSS, version 26 (IBM Corp, Armonk, NY), the average number of scans/body regions by shift, sub-period, and individual resident were assessed. Average RVU per shift was also calculated. Changes in proportion of multiple regions scan over study years was evaluated using the Mantel-Haensel trend test. Simple and multiple linear regression modeling was utilized to evaluate factors (academic year, postgraduate year, weekend call shift, and seasonality) that were potentially associated with higher numbers of scans and regions scanned per shift. To compare shift sub-periods, simple and multiple regression was again used to model the above outcomes by time of day. Linear regression was also used to evaluate the association between academic year and the outcome of shift RVU; this relationship was also assessed when adjusted for number of scans per shift to isolate changes in complexity from changes in volume.
To evaluate individual resident experiences, linear mixed modeling was initially used to assess the degree of variability in the average experience between residents overall; if considerable, this would suggest that call volume is generally related to the specific resident and that the modeling approach utilized above should be revised to account for the clustering of similar call outcomes by specific resident. However, as we were also interested in reviewing the experience of individual residents, the multiple linear regression model evaluating the number of scans per shift was also used to assess residents individually. To examine whether a resident’s specific call volumes repeatedly exceeded those expected, the standardized residuals (the difference between the actual number of scans per shift and that predicted by the model, standardized by the variance of the residuals) were evaluated for each resident. If the number of scans per shift among individuals varied randomly, the residuals for an individual should be normally distributed around an expected value of zero.
During data review it was noted that the calendar months of July through October had greater call volumes. To evaluate for trauma as a potential cause, the percent of scans from the emergency department including at least chest-abdomen-pelvis or at least unenhanced cervical spine was calculated for these months and compared with that from the remainder of the year utilizing the Chi-square test.
Results
Number of On-Call Shifts, Residents, Scans, and Scanned Body Regions
During the study period, a total of 1,652 call shifts were accounted for and divided among 32 unique residents at all levels of training (PGY2 to PGY5) (Table 1).
Sample Characteristics.
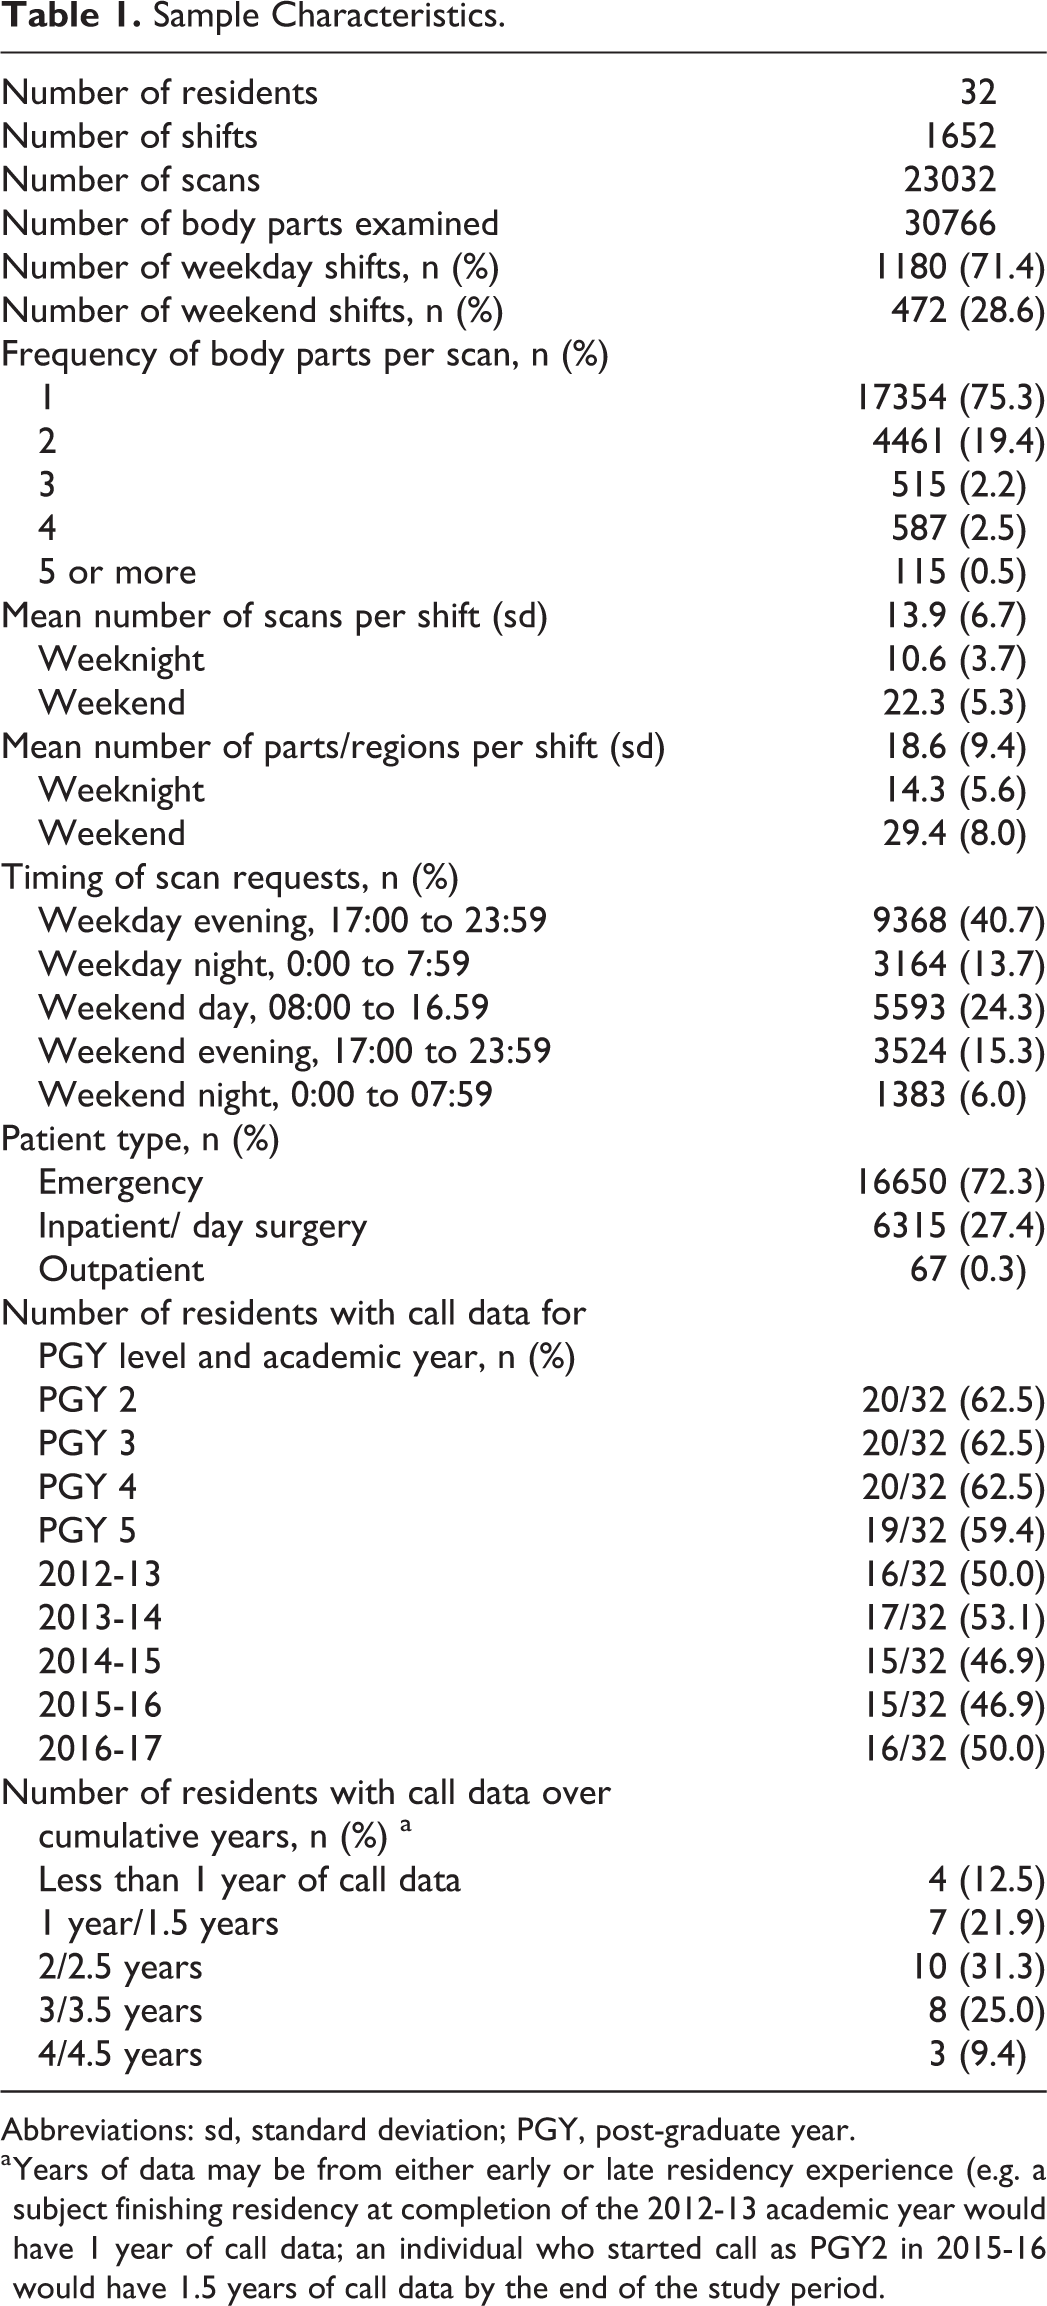
Abbreviations: sd, standard deviation; PGY, post-graduate year.
a Years of data may be from either early or late residency experience (e.g. a subject finishing residency at completion of the 2012-13 academic year would have 1 year of call data; an individual who started call as PGY2 in 2015-16 would have 1.5 years of call data by the end of the study period.
Over the whole study period, the mean number of scans per shift was 10.6 ± 3.7 on weeknights and 22.3 ± 5.3 for weekends; the corresponding mean number of body regions scanned per shift was 14.3 ± 5.6 and 29.4 ± 8.0 respectively (Table 1). On weekend shifts, the peak volumes were seen during daytime hours, scanning 11.9 ± 3.5 patients and 14.7 ± 5.0 body regions on average during this call sub-period (Figure 1). Volumes for other call sub-periods are also illustrated in Figure 1.
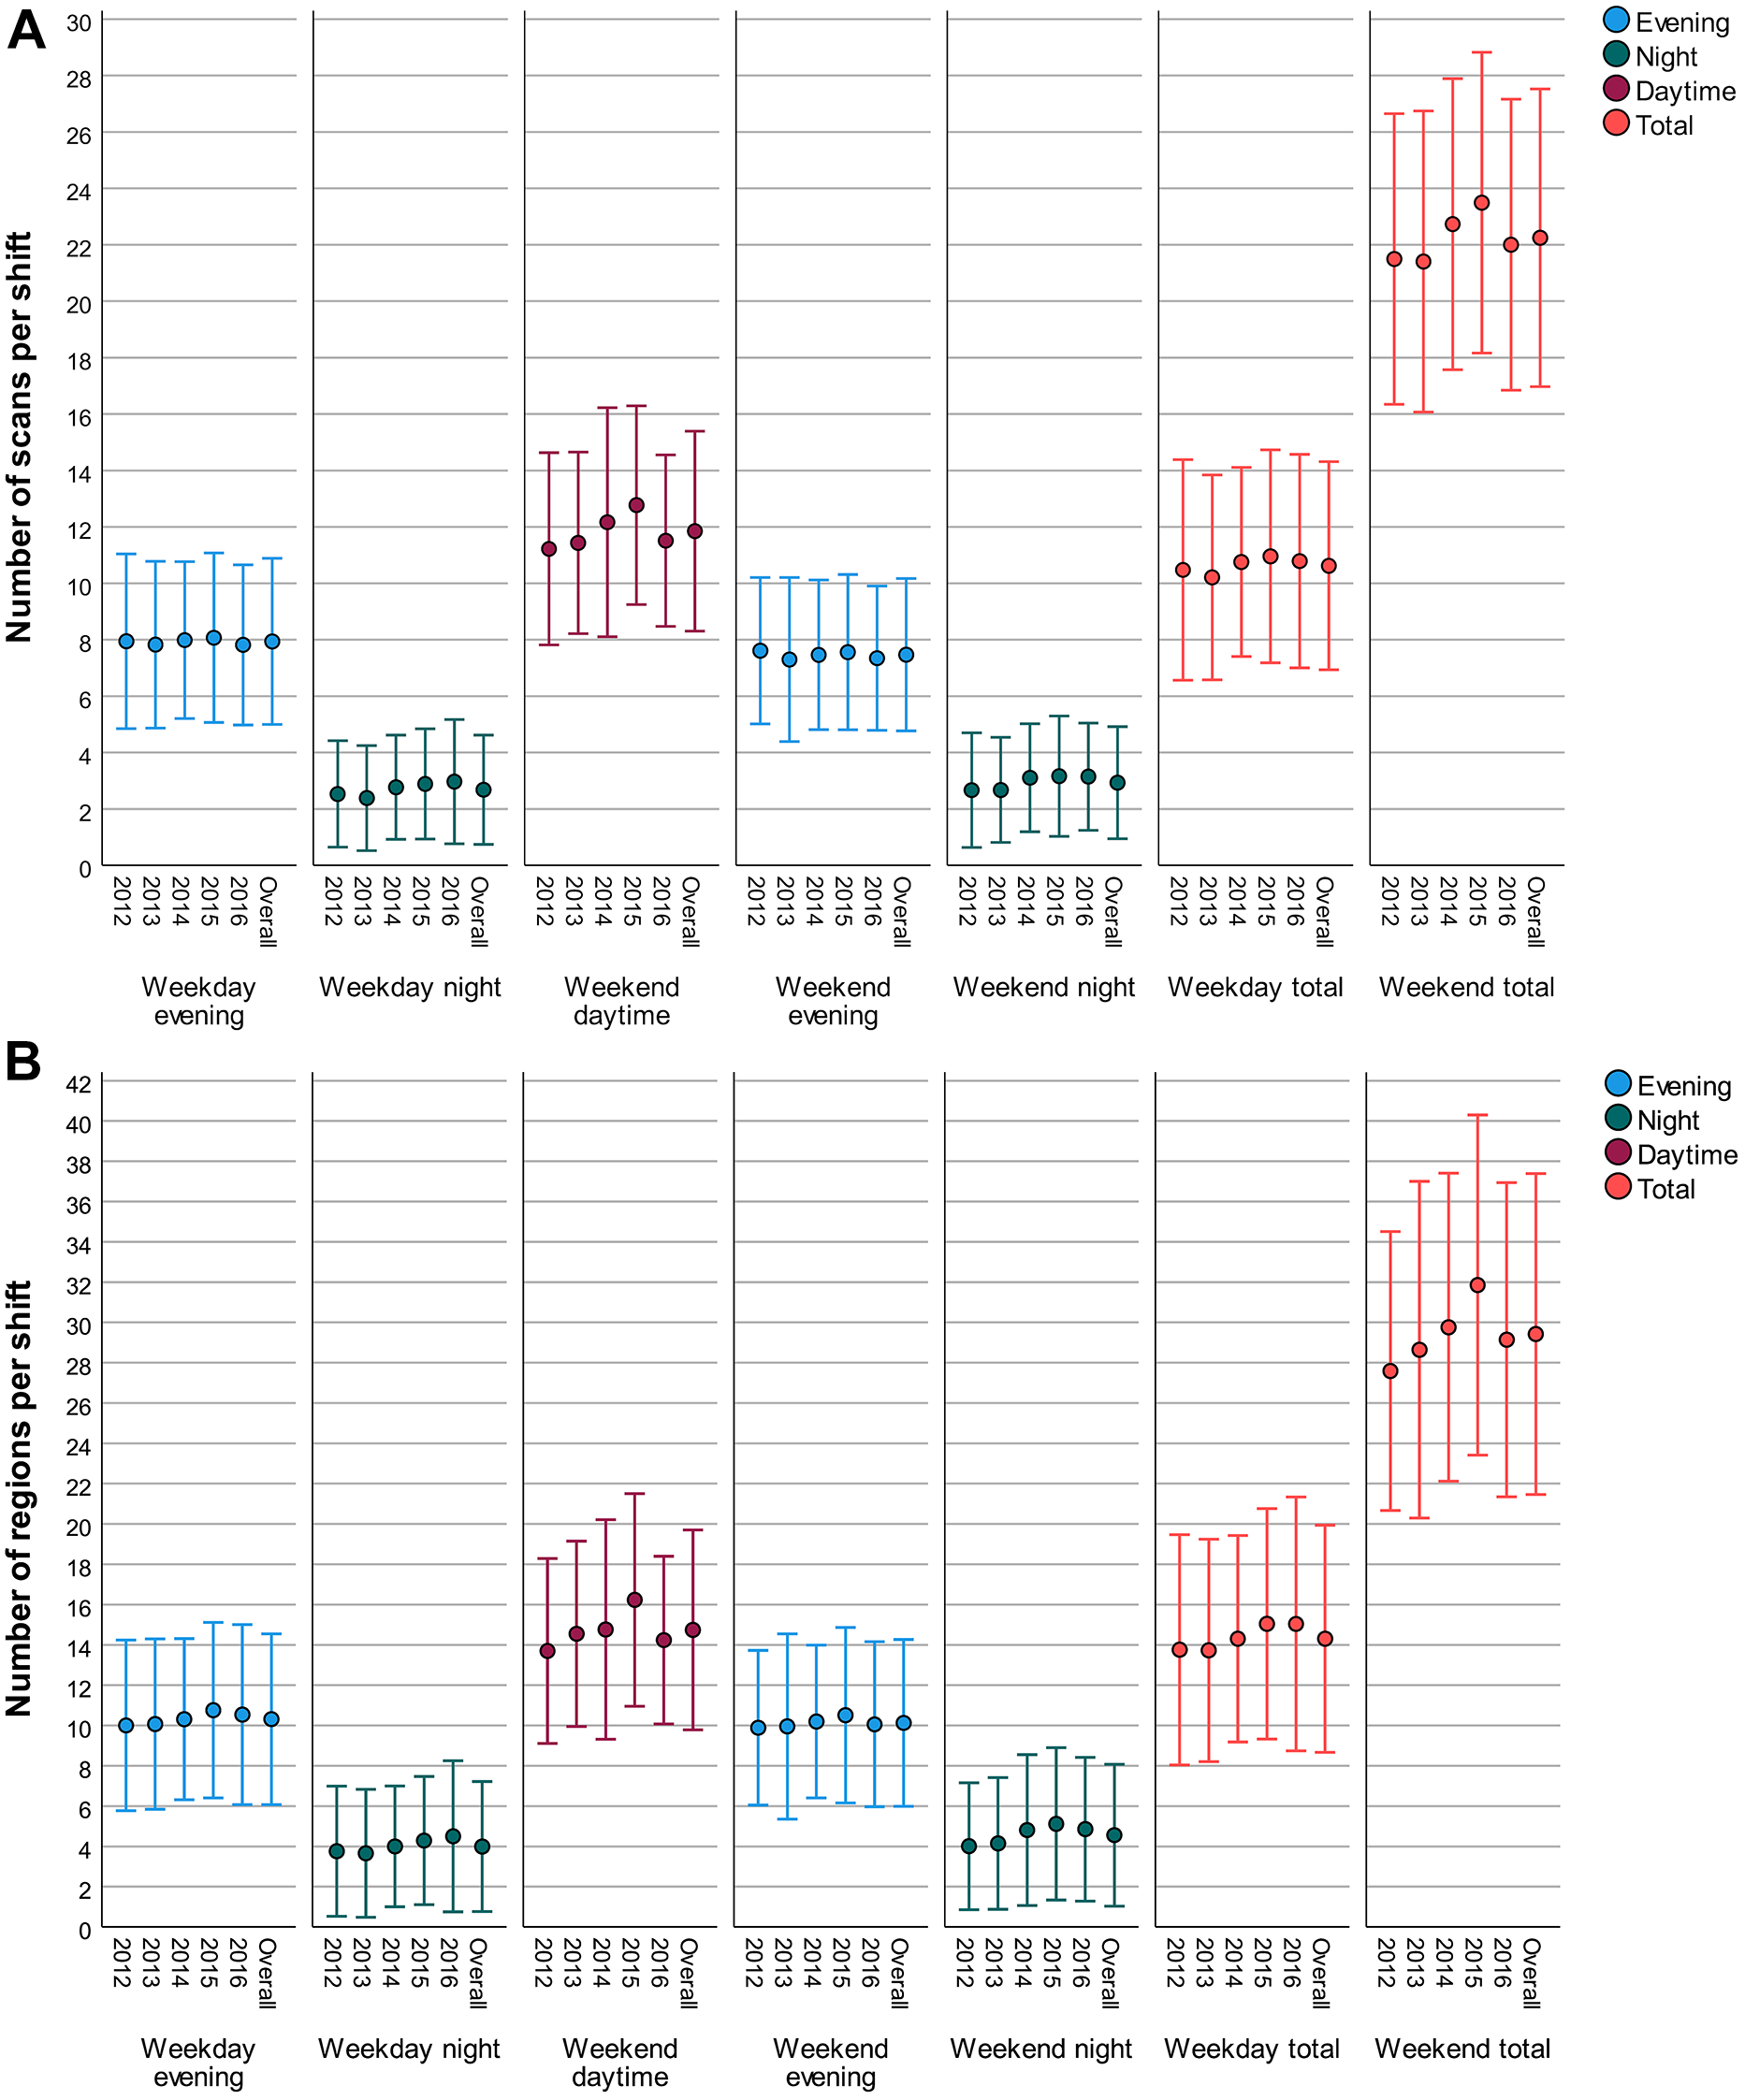
Average number of (A) scans per call sub-period and (B) regions scanned per call sub-period, stratified by year. Intervals represent 1 standard deviation above and below the mean value.
Respective simple and multiple linear regression estimates on the outcomes of number of scans and number of regions scanned per full call shift are reported in Table 2. Annually, the average number of scans/regions per shift increased by 0.2 (approximately 1%) (p < 0.05) and 0.4 (approximately 2%) (p < 0.001) respectively in the adjusted models (Table 3). On average, weekend call responsibilities typically resulted in 11.6 more scans and 15.1 regions assessed compared to weekdays. It was also observed that the calendar period of July to October was associated with an increase in scans performed and regions assessed (Table 2). On initial assessment, higher post-graduate year appeared to be associated with increased call volumes. However, in the model building process, the inclusion of this calendar period as a covariate negated the previously seen relationship between higher post-graduate year and increasing call demands. As such, post graduate year was not retained in the multiple regression models. In the months of July to October, likely trauma scans from the emergency department accounted for 6.4% of scans versus only 5.1% in the other months (p = 0.0003).
Simple and Multiple Linear Regression Models Displaying the Degree of Association Between Independent Variables and Number of Scans/Regions per Call Shift.
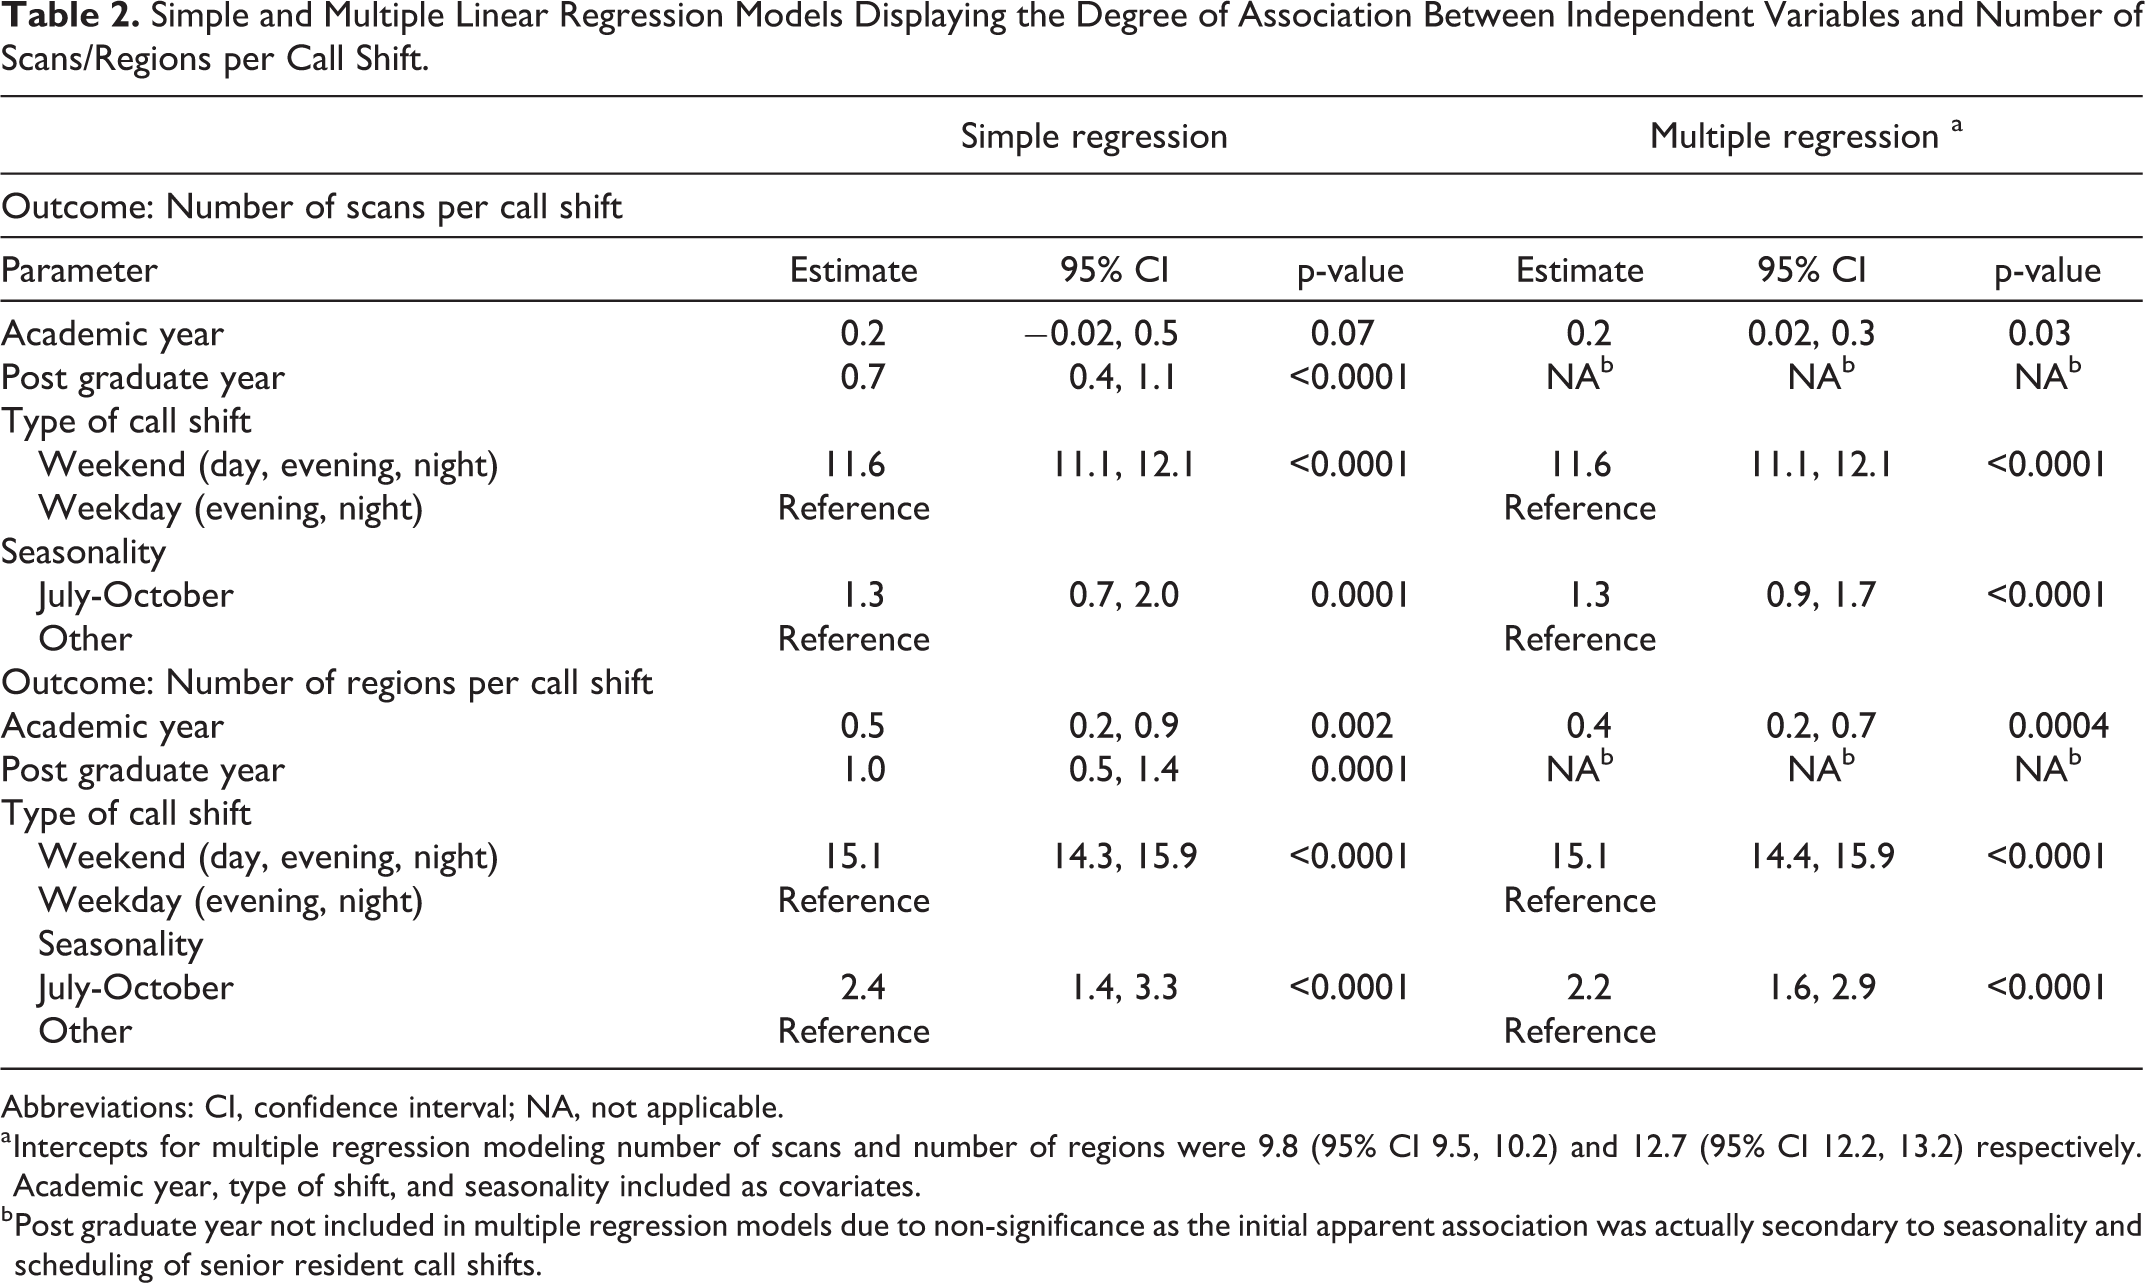
Abbreviations: CI, confidence interval; NA, not applicable.
a Intercepts for multiple regression modeling number of scans and number of regions were 9.8 (95% CI 9.5, 10.2) and 12.7 (95% CI 12.2, 13.2) respectively. Academic year, type of shift, and seasonality included as covariates.
b Post graduate year not included in multiple regression models due to non-significance as the initial apparent association was actually secondary to seasonality and scheduling of senior resident call shifts.
Mean Number Scans, Body Regions, and RVUs per Shift by Year.
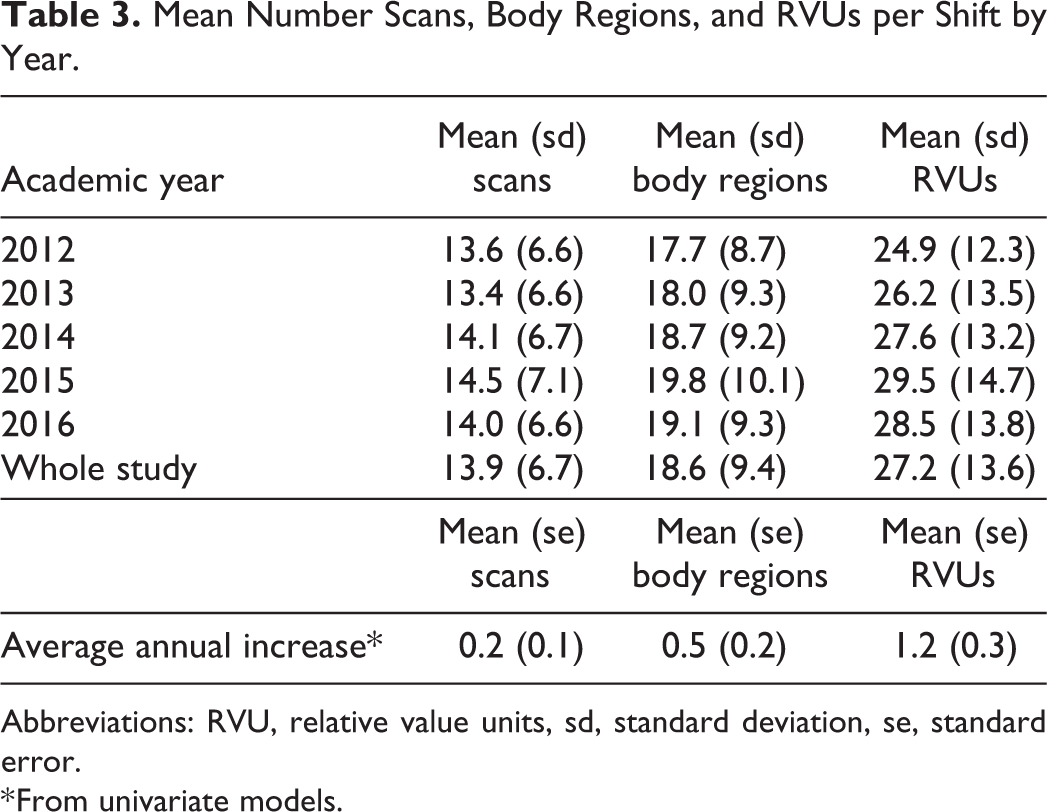
Abbreviations: RVU, relative value units, sd, standard deviation, se, standard error.
* From univariate models.
Specific Body Regions Scanned and Number of Regions Per Scan
Over the study period, the most common single part scanned was the head, included in 51.5% of single scans, followed by abdomen/pelvis at 23.0% and chest at 12.0% (Table 4). Across all scans, the average number of regions examined per scan was 1.33, increasing from 1.31 in 2012 to 1.36 in 2016 (p = 0.0004). The proportion of multiple body region scans increased from 22.2% to 26.9% across these years (Table 4, p < 0.0001). Most of this change was accounted for by scans imaging 2 regions, which increased from 17.3% to 21.4% (Table 4, p < 0.0001), largely reflecting an increase in CT head plus cerebral vasculature scans. This was partly offset, however, by decreases in dual region scans of both the head/cervical spine and chest/abdomen-pelvis combinations detailed as supplemental material (Table S1). Scans comprising 3 or more regions were relatively rare, totaling 5.3% of scans overall.
Number of Scans by Region and Multi-Region Scans per Academic Year.
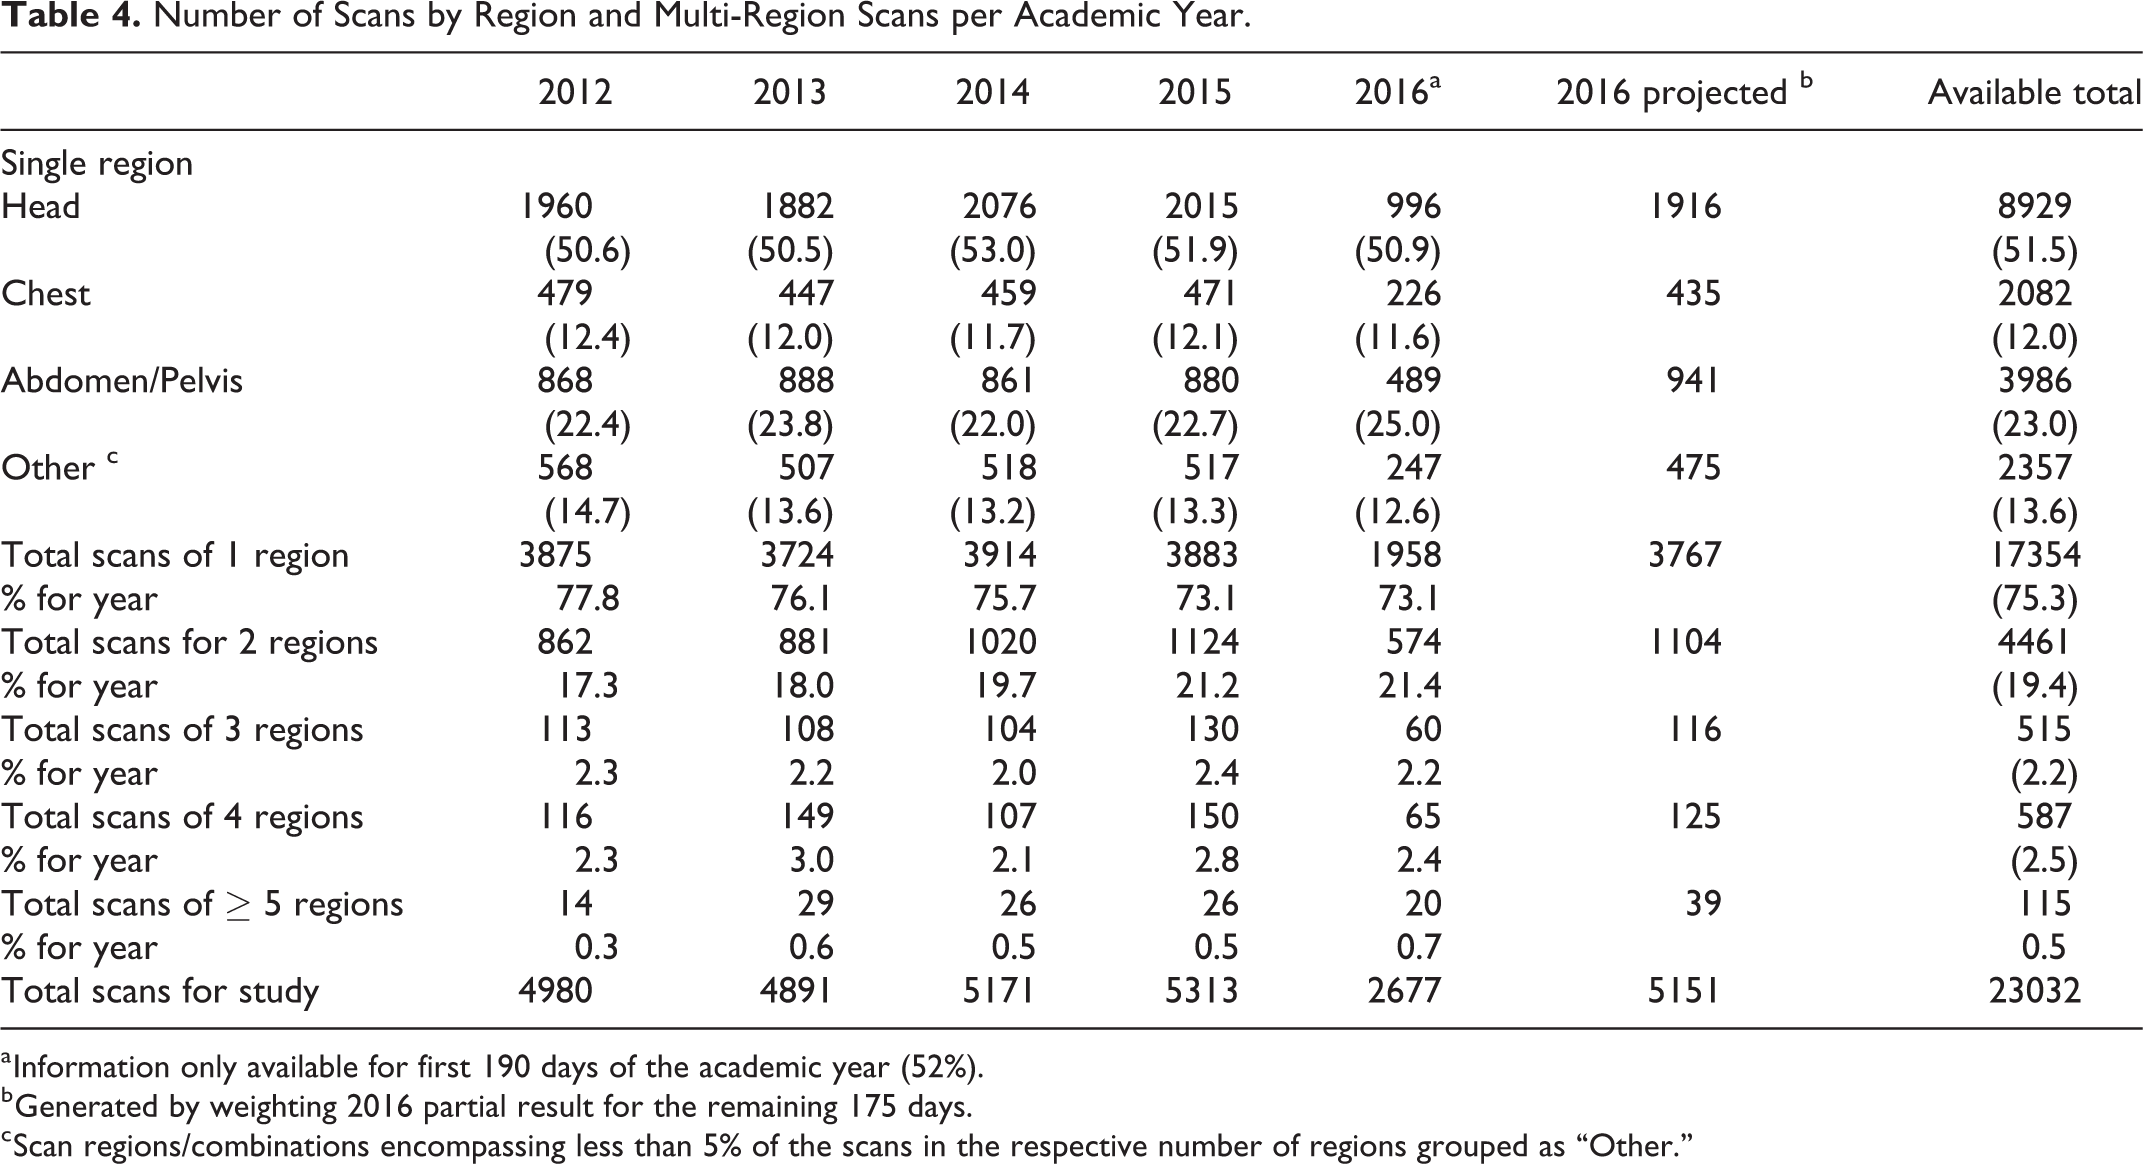
a Information only available for first 190 days of the academic year (52%).
b Generated by weighting 2016 partial result for the remaining 175 days.
c Scan regions/combinations encompassing less than 5% of the scans in the respective number of regions grouped as “Other.”
Relative Value Units Per shift
Mean shift RVUs showed an increase over the study period (Table 3). As for the relationship of time to RVU, for every 1-year increase in the data, the RVU increased on average by 1.2 units (p < 0.0001) (approximately 5%), compared with 0.2 scans and 0.5 body regions per shift. In adjusting the association by scans per shift, we found that even if the number of scans remained constant, shift RVUs still increased by an average of 0.8 RVU per year (p < 0.0001) indicating increasing scan complexity during the study period.
Evaluation of Call Period Sub-Periods
Results of the repeat modeling procedure, assessing both outcomes within the specific subperiods of a call shift, are detailed as supplemental material (Table S2). Weekday and weekend evenings had greater call volumes than the night times, typically exceeding their associated overnight time values by 5.3 and 4.5 scans respectively (P < 0.0001 for both). On average, weekend evenings and nights also had slightly fewer scans than their weekday counterparts (0.5 fewer scans, P = 0.002 for evenings; 0.3 fewer scans, P = 0.02 for nights). Estimates for the prediction of regions per shift were similar.
Resident-Specific Workload
The degree of variability in the average on-call experience of residents both during a given year and within individuals across years is illustrated in Figure 2. From the linear mixed modeling procedure, the variance partition coefficients of the model containing both fixed effects for academic year, call type, and seasonality as well as a random intercept for each individual indicated that only 2.0% and 1.5% of the variance in the number of scans per shift and number of regions per shift could respectively be attributed to differences in each resident’s average experience.
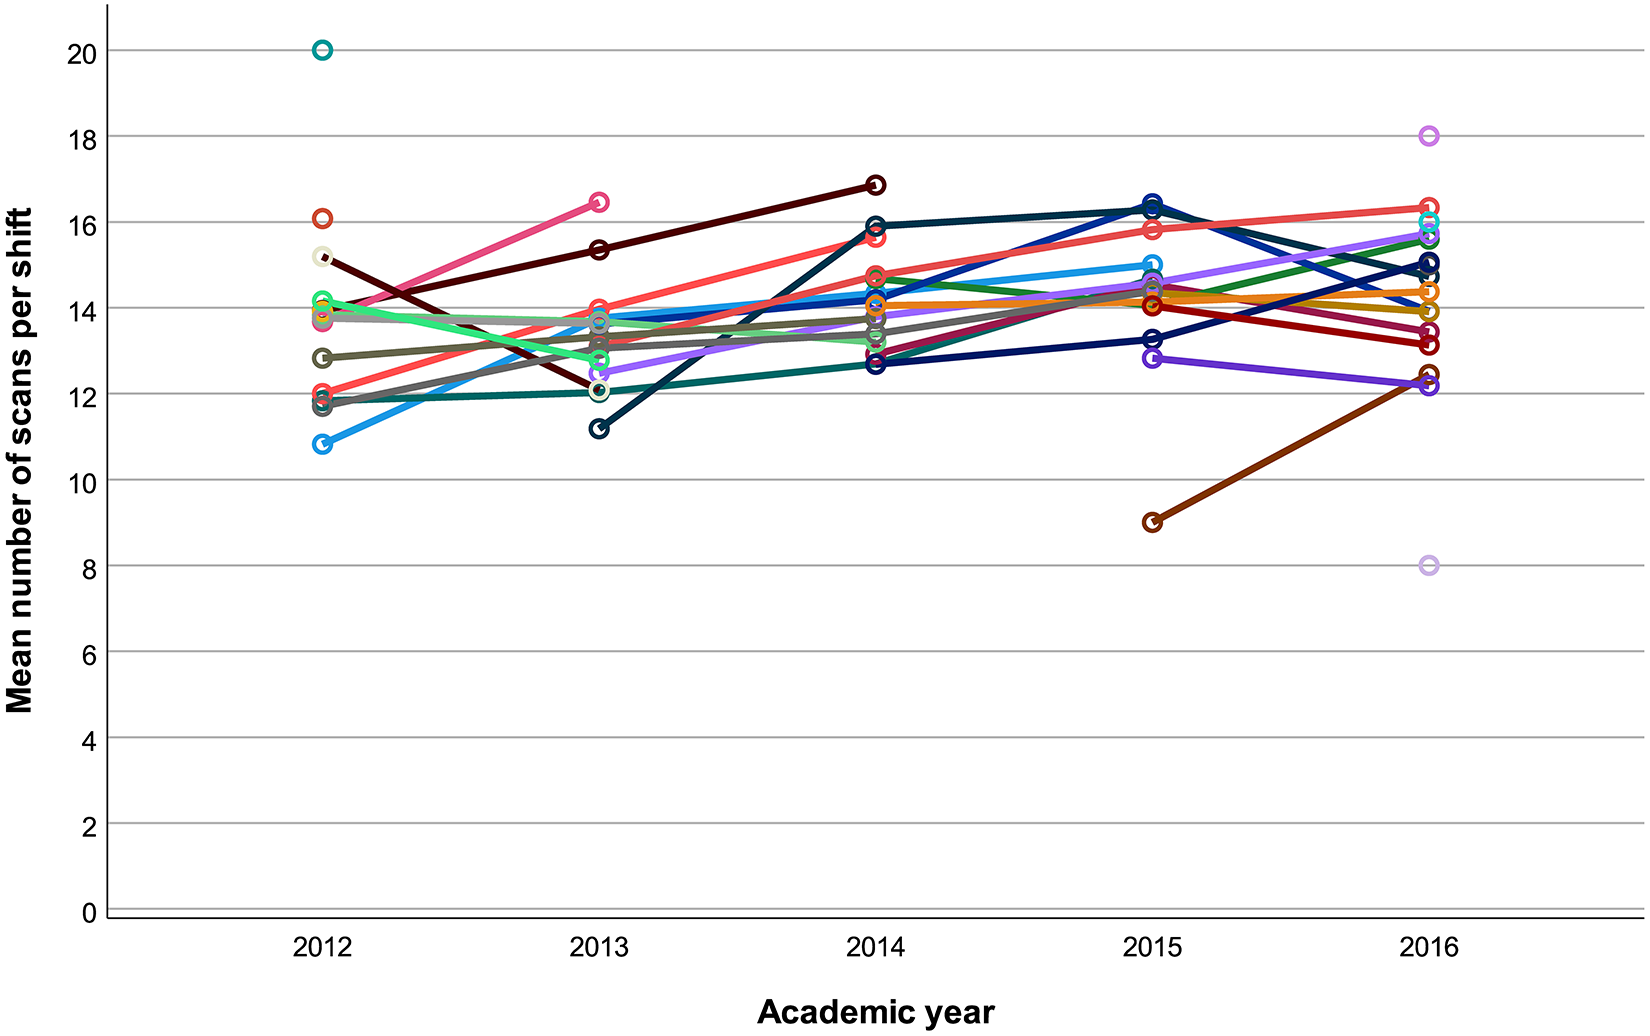
Average annual scan volumes per shift between 2012-2016. Each line represents an individual resident’s experience. Isolated data points in 2012 and 2016 were residents just completing or beginning their residency call requirements, respectively; therefore, only 1 year of averages could be assessed and no trend is presented.
To evaluate the overall call experience (i.e. both demanding and less demanding shifts), the standardized residuals for each shift by resident were visualized in as boxplots (Figure 3) for the 26 residents who had more than 1 shift (4 residents who started call on January 1, 2016 only had a single call shift, and 2 residents who asymmetrically split their shifts were excluded.) All residents had shifts with both positive and negative residuals, although Resident 10 had a disproportionate number of high volume calls and fewer that had less volume than expected.
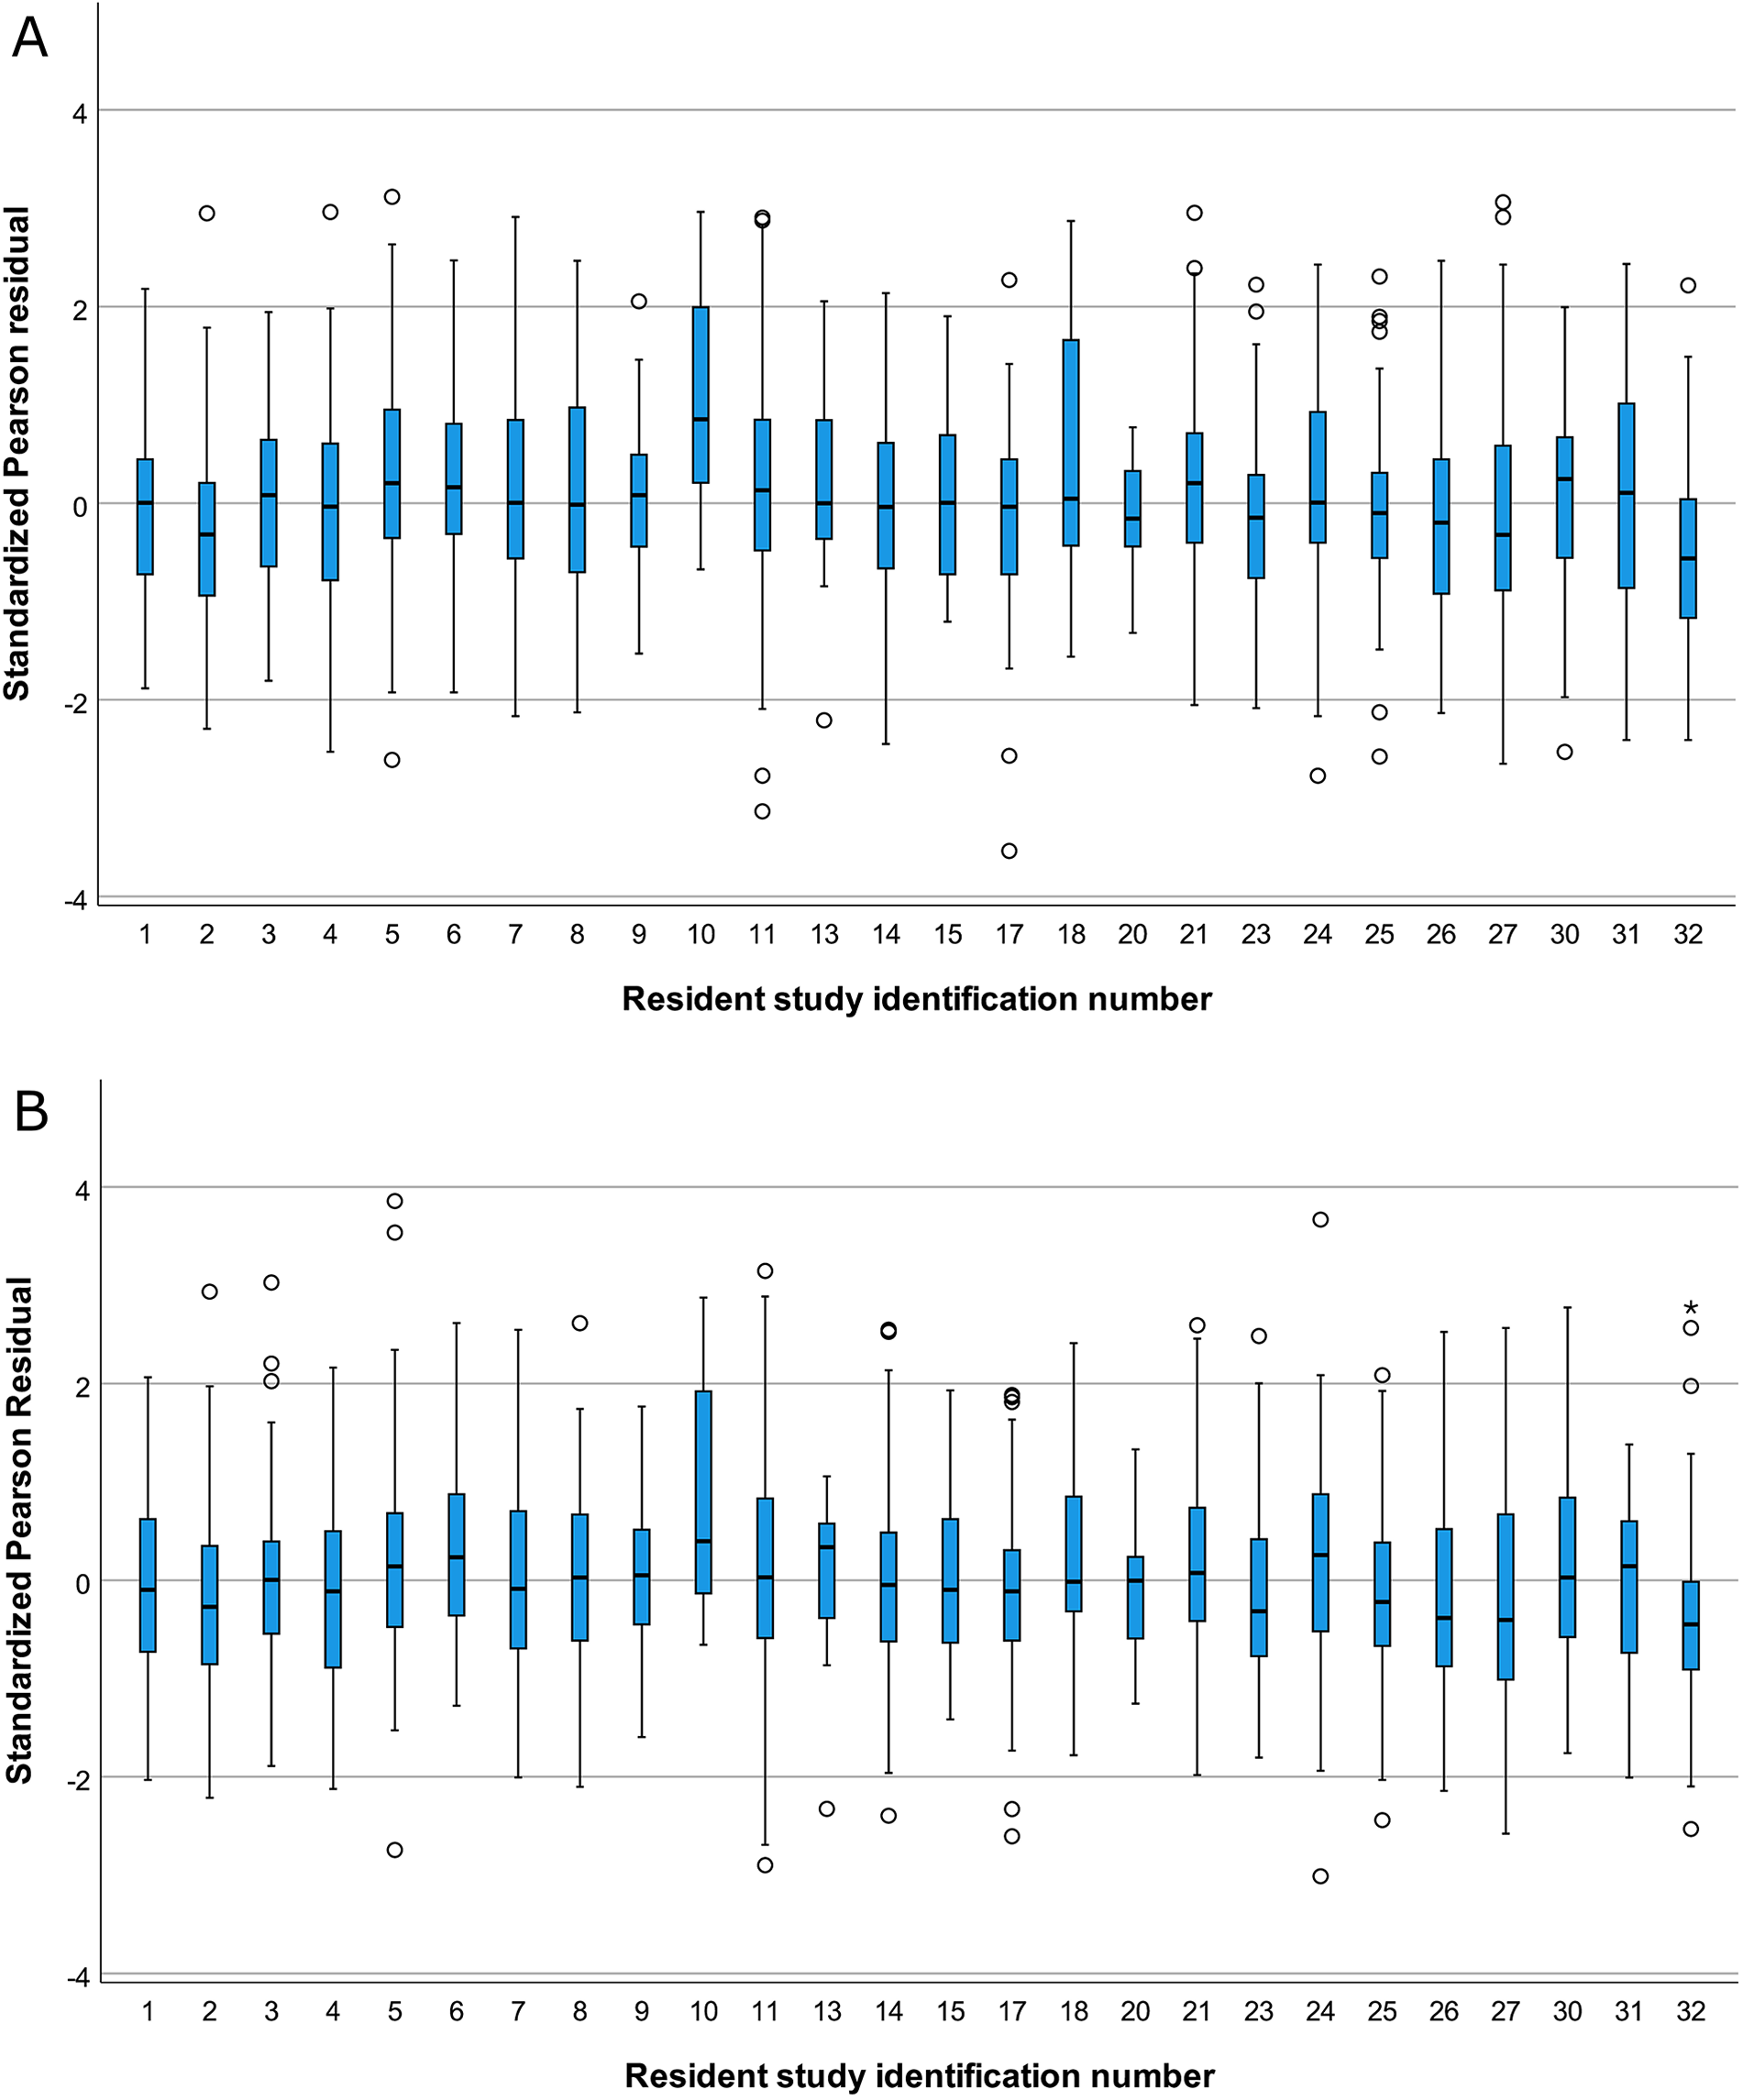
Boxplot of standardized pearson residuals for the multiple regression models predicting (A) number of scans per shift and (B) number of regions evaluated per shift, stratified by resident. SD, Standard Deviation; open dots, outlier, >1.5 Times Interquartile Range (IQR) Beyond box; Asterisk, Extreme Values, >3 times IQR beyond box. Note that 4 residents with single call shifts and 2 residents who shared shifts are not included.
Discussion
Our results did show an overall increasing trend in volume of cases; although, the increases were smaller than expected. There was, however, a greater increase in shift RVUs over time, which give a broader assessment of both case volumes and scan complexity/reading times. 12 Scans covered an average of 1.3 anatomic regions, with minimal increase over time. Notably, on-call experiences had higher call volumes during summer and into mid fall. Although residents overall were not found to vary meaningfully in their personal average number of scans per shift, 1 resident appeared to have a concerning imbalance of high volume shifts.
The hypothesis that call caseload, reflected by average case volume and body parts scanned per shift, followed residents throughout their training was largely unsubstantiated. However, rather than aiming to demystify this impression, a more imperative study purpose was to recognize any individual residents who more frequently experienced challenging call than their peers. Although persistently personal heavy or light call (i.e. “bad/good call karma”) does not appear to be widespread in our program, the observation that 1 resident often experienced more demanding call than their peers was a notable reminder that programs need to monitor individual resident workloads, as legitimately struggling residents may be missed. The relatively greater increase in complexity over time reinforces the fact that assessing volume of work should also include some recognition of scan complexity. Given the anonymization of data, we are unable to identify specifically which resident had consistently higher call volumes for this paper and as such cannot offer an individualized hypotheses for why they may have been busier. Allowing for that, an individual resident may have higher call volumes/demands because of a perceived greater openness to scanning by referring clinicians, a tendency to add on extra series (e.g. adding a CTA sequence if cervical spine fractures are seen on initial trauma CT), or perhaps preference to performing CT instead of ultrasound for some clinical indications as ultrasound cases were excluded from this study. Additionally, higher volumes may have simply been due to chance.
There have been few prior studies on the question of call karma, jinxing, or bad cloud color. Among internal medicine residents in British Columbia, 45% expressed a belief in call karma and 39% believed in the adverse effects of the word “quiet;” however, there was no difference in call caseload between those who believed they had bad call karma and those who did not. 6 Neurosurgical residents from the University of Western Ontario recorded the number of times they were jinxed pre-call, and although there was no correlation between jinxing and objective measures of volume, there was a trend toward less sleep and more surgeries during jinxed nights. 7 Another study randomly assigned jinxing to senior medical residents through envelopes potentially containing jinxed messages and found a favorable jinx effect of fewer admissions and more sleep on “jinxed nights.” 8 A study of pediatric resident perception of “black clouds” during call found an association between perceived black clouds and perceived call difficulty, with less sleep but no association with actual work metrics. 9 Finally, a study of pediatricians found no difference in emergency department visits but a slightly higher admissions rate among the “jinxed” physicians during call shifts. 10 Our study fits with these prior evaluations of consistent variation in on-call case volumes between healthcare providers in that we found minimal if any consistent increased or decreased caseload beyond what is statistically expected. However, we did not measure perceived busyness or other metrics of call stressors such as less sleep or more time working on cases because of our study length and design.
Comparing radiology resident call volumes between institutions is problematic as responsibilities, level of interpretations (complete report vs limited report), and supports vary. Additionally, there is relatively little empirical data in the literature regarding call case volumes, with many comparisons based on conversations and assumptions. The only prior published Canadian data are from Toronto and Vancouver.4,13 A 2015 paper states that the average on-call University of British Columbia resident interprets 20-40 studies (mix of CT, ultrasound, and x-rays) per 12 hour 8 pm to 8 am night shift. 13 A review of after-hours call volumes at Toronto’s academic hospitals with single resident coverage showed 45-70% per hospital increases in case volumes between 2006 and 2013; however, there were no details regarding average shift case loads provided. A review of 24 hour weekend periods of two 12 hour single resident shifts from Duke University showed mean increased workloads of 58.1 CT scans in 2011 to 75.3 CT scans in 2015 for the full 24 hour period. 14 A 2008 study from Temple University showed mean overnight resident case volume to be 18 CT or ultrasound cases. 15 Both of these American studies also showed correlation between busier shifts and more errors in interpretation.14,15
When considering that our residents take radiology call over only 3 years’ time, these average yearly increases in patient and body region volumes over the period of a single residency is relatively small. Although our results are more modest, they are consistent with increasing use of CT previously documented in outpatient and emergency department settings16-18 as well as on-call.4,14 When case complexity is considered through the application of RVUs, the increases become more clinically impactful as a 1.2 unit increase per year would result in an average 3.6 unit increase (approximately 15% above baseline) during a single residency. It is also important to note that experience in a single residency is less important than overall volumes, as projected annual increases will apply to both current and new residents moving forward.
Our observed seasonal association with both outcomes has not been previously noted in the literature. A single study from New York evaluating season in relation to CT use in the emergency department did not find an association. 19 Given the markedly increased mobility of our local population during the summer months, this increase could be due to higher incidence of trauma/injury as previously associated with the season.20-22 The occurrence of more trauma-type scans in the data during these months aligns with this hypothesis. Our finding that the addition of seasonality to the multiple regression model negated the association of more advanced training with higher call volumes is explainable as our PGY5 residents stop doing call in January of their final year and therefore had fewer shifts in the lower volume months.
A final question emerges–if call volumes are not meaningfully increasing the workload of residents, what fuels the perception of increasing call demands among trainees? Some of this may be explained by the relatively greater increase in RVU adjusted workload compared to actual patient and scan volumes, suggesting that increasing complexity of cases could increase the work on call. Since the perception of increased volumes was based on resident reflection, recall bias, a systemic error where past experiences or memories are not remembered well and may be influenced by newer events or experiences, may be playing a role. 23 Unrecognized burnout or inadequate resident support could also be contributing factors.24-27 A survey of New England radiology residents showed more than one-third of residents reporting a high degree of burnout in each dimension assessed, with greater burnout symptoms among senior residents. 25 Recent surveys of Canadian radiologists and residents have been performed.24,26 Survey responses from 144 Canadian radiology residents showed between one-third to half of respondents reporting high degrees of burnout symptoms, with identified contributing factors of feeling unsupported by staff radiologists and poor education-service balance. 24 Responses from 262 Canadian radiologists (including 46 trainees) revealed that 48-72% of respondents had a high degree of burnout symptoms. 26 Recommendations from the American College of Radiology on remedies for burnout among radiologists highlight the importance of having adequate staffing, reducing prolonged stresses including that from excessive pace of work, and restoring a sense of control. 27 A study such as ours followed by call schedule modifications aims to address all 3 of these factors.
After assessing the data described in the paper, our department made several changes to resident call structure. In July 2017, the weekend call shift was split into day (08:00 to 20:00) and evening/overnight (20:00 to 08:00) shifts staffed by 2 separate residents. Following that in 2018, mandatory staff review of all resident reports up until 20:00 was instituted. A third change was made, requiring residents to only provide preliminary reports between 20:00 and 08:00 every night of the week. The importance of collaboration and communication between staff and residents has also been repeatedly reinforced, with encouragement of staff to read call cases directly whenever the resident is behind or potentially overwhelmed.
Our study had several relevant limitations. The total on-call data from an entire residency duration was only available for 4 residents who began taking call in 2012 and completed residency in 2017. Other residents only had data from 1 to 3 years, depending on timing of residency entry/completion. Ultrasound, fluoroscopy, and radiograph volumes were not assessed. Also excluded were CT cases directly dictated by staff radiologists and phone consultations that did not result in new CT imaging being performed. Additionally, although RVUs were applied to each shift and evaluated across years, there was no way to capture true complexity of cases, clustering/timing of scans, and time to interpret individual cases as consistent application of RVUs to residents with different levels of training and experience may be problematic. Our retrospective assessment also prevented assessment of other factors such as workflow interruptions or loss of sleep. Finally, regarding call karma, we did not solicit or statistically correlate opinions about superstitions or perceived karma/jinxing as has been done in prior studies.6-8,10
In summary, there was a small but measurable average annual increase in CT utilization via patient scans, body regions scanned, and shift RVUs on-call at our institution between the 2012 and 2016 academic years. Although residents do not generally appear to experience call volumes that vary personally from those of their peers, it remains important to recognize the potential for such and ensure residents can access support if frequently experiencing heavy call demands.
Supplemental Material
Supplemental Material, sj-pdf-1-caj-10.1177_08465371211026310 - Is Call Karma Real? Resident After-Hours On-Call Imaging at the University of Saskatchewan: An Assessment of Call Volumes Including Inter-Resident Variability
Supplemental Material, sj-pdf-1-caj-10.1177_08465371211026310 for Is Call Karma Real? Resident After-Hours On-Call Imaging at the University of Saskatchewan: An Assessment of Call Volumes Including Inter-Resident Variability by James Huynh, David Horne, Rhonda Bryce and David A Leswick in Canadian Association of Radiologists Journal
Supplemental Material
Supplemental Material, sj-pdf-2-caj-10.1177_08465371211026310 - Is Call Karma Real? Resident After-Hours On-Call Imaging at the University of Saskatchewan: An Assessment of Call Volumes Including Inter-Resident Variability
Supplemental Material, sj-pdf-2-caj-10.1177_08465371211026310 for Is Call Karma Real? Resident After-Hours On-Call Imaging at the University of Saskatchewan: An Assessment of Call Volumes Including Inter-Resident Variability by James Huynh, David Horne, Rhonda Bryce and David A Leswick in Canadian Association of Radiologists Journal
Footnotes
Authors’ Note
James Huynh, MD, FRCPC, David Horne, MD, FRCPC, Rhonda Bryce MD, MSc, and David Leswick, MD, FRCPC contributed equally to this paper.
Acknowledgments
We would like to sincerely acknowledge Brenda Downing for her support in handling the data extraction from the radiology information system for this project.
Declaration of Conflicting Interests
The authors declared no potential conflicts of interest with respect to the research, authorship, and/or publication of this article.
Funding
The authors received no financial support for the research, authorship, and/or publication of this article.
Supplemental Material
Supplemental material for this article is available online.
References
Supplementary Material
Please find the following supplemental material available below.
For Open Access articles published under a Creative Commons License, all supplemental material carries the same license as the article it is associated with.
For non-Open Access articles published, all supplemental material carries a non-exclusive license, and permission requests for re-use of supplemental material or any part of supplemental material shall be sent directly to the copyright owner as specified in the copyright notice associated with the article.