
Abstract
School absence negatively impacts academic performance and is more prevalent among students with health conditions and/or disabilities. Using data from the British Columbia Adolescent Health Survey, we explored school absences, which were defined as missing one or more classes at school for any reason during the past 30 days, among youth with self-reported health conditions and/or disabilities. Using descriptive analyses, we explored the prevalence and factors that may contribute to school absences, including feelings about and treatment at school, and perceptions of safety while in different school locations or contexts. We found that, overall, students with health conditions and/or disabilities are more likely to report school absences than students without health conditions and/or disabilities. Further, within this population three specific groups reported more school absences: those with two or more health conditions and/or disabilities, those with mental or emotional needs, and those with physical needs. To address potential educational inequities for these students, targeted programmes and supports that address interpersonal and structural factors that contribute to school absence are needed.
Introduction
School absence negatively impacts the academic performance of youth, particularly those with health conditions and/or disabilities (HCD; Anderson, 2021; Cosgrove et al., 2018). School absence is generally understood as the presence or absence of students at school; however, definitions of school absence are varied and can overlap absenteeism/exclusion or excused/unexcused, among other permutations of voluntary/involuntary absence (Birioukov, 2016). A common, and simplistic definition of school absence/absenteeism is a student’s physical presence in a “bricks and mortar” school building, however, this definition does not account for variations in educational delivery systems or reasons for school absence, yet is still often used to inform policies and guide school-level practices (Kearney & Childs, 2023). This lack of consensus on definition and inconsistent quality of data create challenges in creating cohesive educational policy (Kearney, 2003, Skedgell & Kearney, 2018). For the purpose of our research, school absence was defined as missing one or more classes at school for any reason during the past 30 days.
Previous research indicates that school absences are more common for youth with HCD than youth without HCD (Black & Zablotsky, 2018; John et al., 2022). In Canada, 15% of students with HCD reported prolonged disruptions to their schooling for extended periods due to their HCD (Kohen et al., 2012). In 2021, in the Canadian province of British Columbia (BC) there were over 4,700 exclusion incidents for students with disabilities (an increase of nearly 400 incidents from 2020; Dao & Little, 2022). In the United States, Black and Zablotsky (2018) analysed chronic school absenteeism for students with developmental disabilities. They found that students with Autism Spectrum Disorder (ASD) or Attention-Deficit/ Hyperactivity Disorder (ADHD) had chronic school absenteeism compared to students without these disorders. Further, they found that students with intellectual disabilities had chronic school absenteeism compared to students without intellectual disabilities. In Wales, research by John et al. (2022) demonstrated that youth living with neurodevelopmental disorders or bipolar disorder had higher rates of school absences compared to youth without these disorders. Moonie et al. (2008) studied the school absence of students with asthma in a predominantly African American school district in Missouri, United States. They found that students with asthma were likely to be absent for approximately 1.5 more days compared to students without asthma (Moonie et al., 2008). In sum, across a range of disabilities and health conditions and in different countries, there is a trend towards greater school absence among students with HCD than those without HCD.
A variety of reasons for school absence among youth with HCD are documented in the literature. In a report by the National Center on Educational Outcomes [NCEO] (2018) the authors found that some youth with HCD may experience anxiety related to going to school due to bullying and discrimination. Additionally, some youth with HCD may experience medication-related side effects, such as fatigue, which can make going to school challenging (NCEO, 2018). Also, youth with HCD may have medical appointments that occur during school hours and they end up absent from school due to conflicting commitments for their time (Melvin et al., 2023). Further, certain youth with HCD may attend specialised schooling options outside of their community (Kohen et al., 2012), thus, commuting far distances or away from their home community, in turn contributing to school absences. In many cases, youth with HCD may not have access to adequate support resources that are essential for their education, such as educational assistants or assistive devices (Kohen et al., 2012). Additionally, various socioeconomic conditions, such as housing or food insecurity, can create barriers for youth with HCD from attending school (NCEO, 2018). It is necessary to acknowledge that, oftentimes, multiple, intersecting factors can contribute to school absence in this population (Melvin et al., 2023).
The potential long-term impacts associated with school absence for youth with HCD is multi-faceted and varies across group, highlighting the need for further longitudinal research in this area. For example, a study by Christani et al. (2015), reported mixed results in body of literature about the impact of school absence due to attending out-of-school therapy services or healthcare appointments during school hours on the grade point averages of students with physical disabilities or chronic health issues (Christani et al., 2015). Previous research has documented potential long-term impacts of school absence including associations between school absence in middle and high school with on-time graduation and transitioning to post-secondary education (Liu et al., 2021). Despite the need for further research, there is the indication that persistent school absence can have negative social and economic implications for students in various HCD groups (Liu et al., 2021; Rocque et al., 2017).
The purpose of this study was to conduct secondary analysis of population-level data collected from youth with HCD to begin to address the relative paucity of research around school absences within this population (Children’s Commissioner for England, 2022). The primary objective was to:
explore and describe the reasons for school absences among youth with HCD.
Secondary objectives to further explore factors potentially contributing to school absences:
investigate feelings about school and perceptions about their treatment while at school, and
explore perceptions of school safety while in different school locations or contexts.
Materials and Methods
Design
We conducted a secondary analysis using data from the 2018 British Columbia Adolescent Health Survey (BCAHS). The survey was created by the McCreary Centre Society (https://www.mcs.bc.ca/) and is administered with high school students (Grades 7 to 12) in British Columbia (BC), Canada, every 5 years beginning in 1992. The aim of the survey is to generate evidence related to health trends, emerging issues, as well as risk and protective factors regarding healthy development among youth. Consent is obtained by one of two methods (chosen by the local school district): (i) parent notification and student consent, or (ii) parental and student consent (Saewyc et al., 2014).
Our study used data from the 2018 cycle of the survey, which was administered between February and June 2018. Therefore, when students responded to questions about school absence, they were referring to a 30 day period when they completed the survey during these months.
Setting
In Canada, public education systems are administered through provinces and territories and, as a result, systems of support for students with disabilities vary across the country (Towle, 2015). This study took place in BC, Canada’s westernmost province. BC has an umbrella policy on inclusive education and part of it involves a system of categorising students according to support needs (BC Ministry of Education and Child Care, 2024). In BC, there are 60 public school districts, which receive funding through the province and each district has its own elected school board. In recent years, inclusive education in BC’s public education system has been criticised in a number of reports, and in 2025 the provincial Ombudsperson launched a study into widespread school exclusion of students with disabilities.
Of note, the categories of HCD on the BCAHS do not align with the province’s inclusive education designations. Further, survey respondents were not asked if they had a designation or an Indivdualized Education Plan.
Participants
The final unweighted sample size was 38,015 youth, in turn weighted to represent the target provincial population of 255,146. The BCAHS data involves complex sampling rather than simple random sampling. As such, factors such as stratification, clustering, and weighting are applied by McCreary during data collection. After weighting, the complex sample can be scaled to represent the target population (Saewyc et al., 2014).
Health Conditions and/or Disabilities
Table 1 provides the description of each self-reported HCD group, as determined by youth’s responses to Item 39 on the BCAHS 2018 survey. We highlight that this item is a self-reported HCD, and does not necessarily capture HCD that have been clinically diagnosed. Respondents could mark all that applied. The “two or more conditions” group is largely comprised of those with a mental health condition and may also include those with physical conditions, according to McCreary Centre Society. So, for clarity, although we refer to 2+ conditions as a “group” for shorthand, it is actually a “group of groups,” rather than its own exclusive group.
Health Conditions and/or Disabilities Identified in the BCAHS (2018)*.
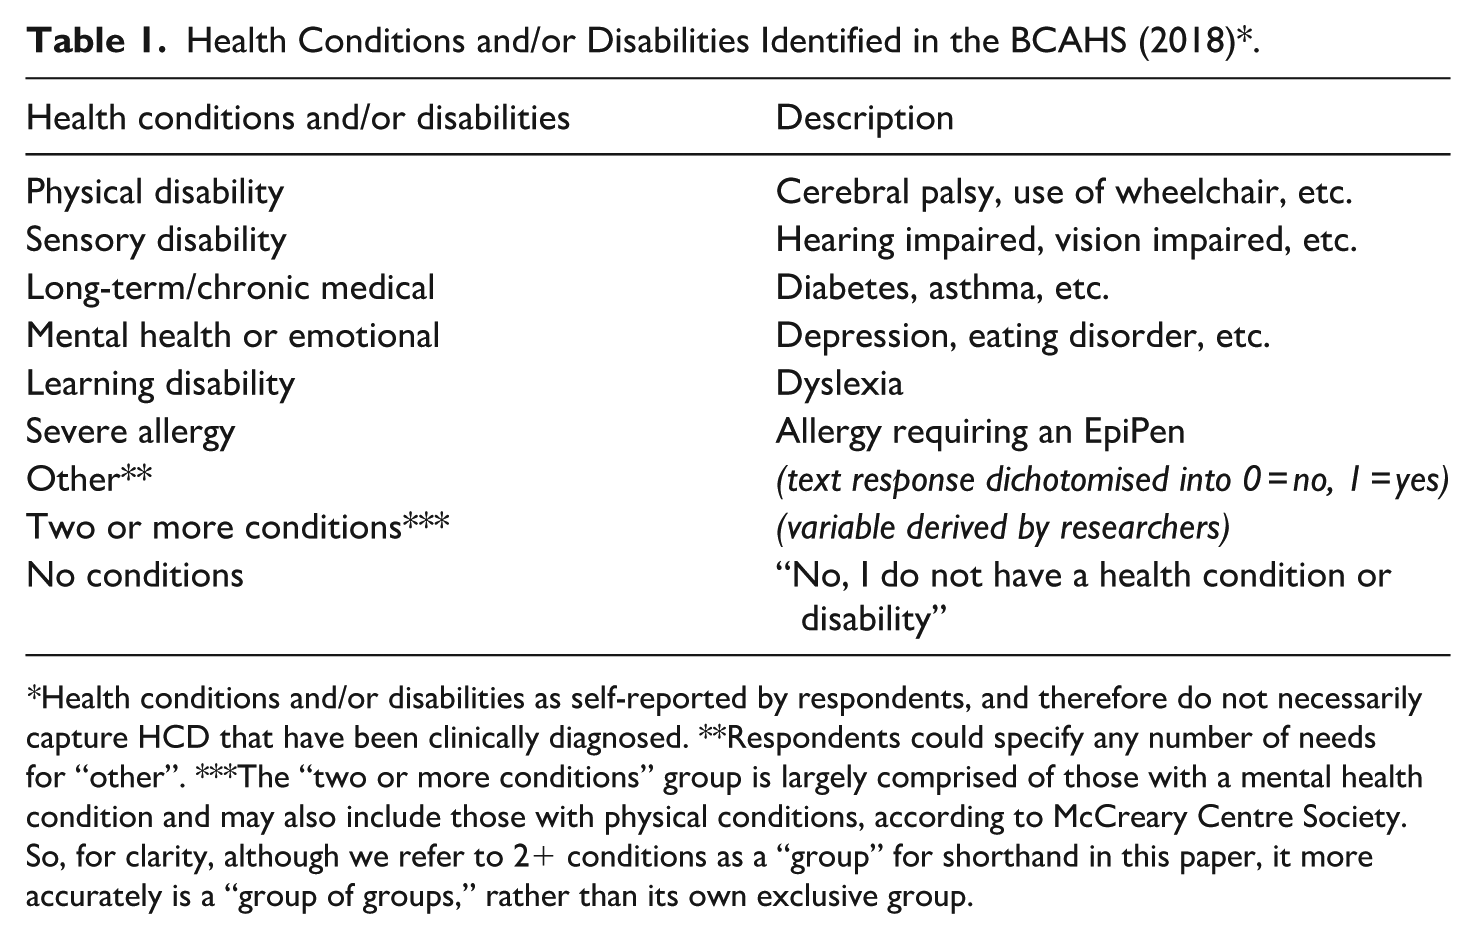
Health conditions and/or disabilities as self-reported by respondents, and therefore do not necessarily capture HCD that have been clinically diagnosed. **Respondents could specify any number of needs for “other”. ***The “two or more conditions” group is largely comprised of those with a mental health condition and may also include those with physical conditions, according to McCreary Centre Society. So, for clarity, although we refer to 2+ conditions as a “group” for shorthand in this paper, it more accurately is a “group of groups,” rather than its own exclusive group.
Table 2 presents the estimated number of youth in the provincial population for each HCD group captured in Item 39. It also displays the relative proportion to the provincial/total weighted N and the weighted HCD N of the population with HCD groups, respectively. These counts and proportions are presented in descending order. Note youth with no conditions (N = 174,097), which we excluded from this table, accounted for 71.5% of entire target provincial population. All other HCD groups accounted for approximately 28.6% of the total sample (N = 69,548). The final working provincial weighted N was 243,645 (not 255,146), due to some missing values.
Weighted Ns and Percentages of Health Conditions and/or Disabilities by Prevalence.
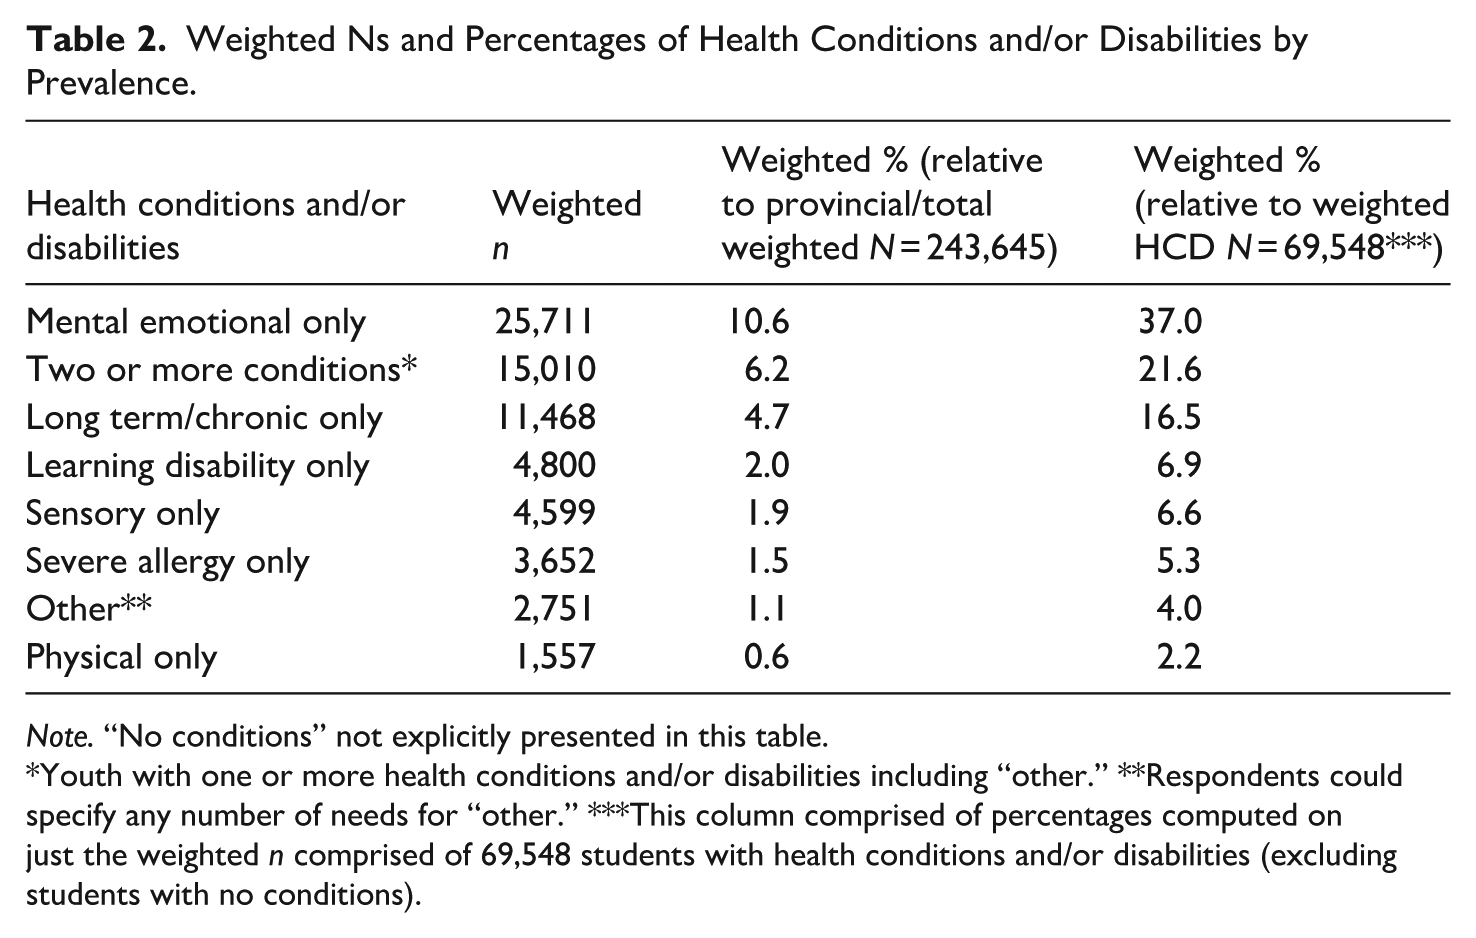
Note. “No conditions” not explicitly presented in this table.
Youth with one or more health conditions and/or disabilities including “other.” **Respondents could specify any number of needs for “other.” ***This column comprised of percentages computed on just the weighted n comprised of 69,548 students with health conditions and/or disabilities (excluding students with no conditions).
Of the total provincial study population, 46.7% never spoke a language other than English at home (English was their only home language), 29.5% sometimes spoke another language than English, and 23.1% most of the time spoke another language than English (when percentages do not total to 100%, it is because of missing responses, multiple responses, and/or rounding).
Previously, we conducted research using the 2013 BCAHS data to explore the sample’s demographics. This previous research indicates gender had the most difference between male and female students as compared to other demographic variables. Therefore, here we report gender at birth for the total provincial study population and also for the HCD groupings that had particularly noticeable differences (although gender was not an explicit of the current study). For the total provincial study population, 49% were male and 50.6% were female. For mental or emotional, it was 24.6% male and 75.1% female and for or two or more conditions, it was 30.6% male and 68.8% female. In short, the mental or emotional and two or more conditions HCD groups had disproportionately more females than males.
Procedure
The 2018 BCAHS was administered to students in Grades 7 to 12 (inclusive), aged 12 to 19 years, who attended public school in 58 of the 60 public school districts across BC. The survey was completed at school.
Instrumentation
The following subset of 2018 BCAHS variables were analysed:
School Absence: Reasons For
Item 32 of the BCAHS asks that youth report how many days, during the past 30 days, they have missed one or more classes at school because of these assorted reasons: illness, skipping class, bullying, family responsibilities, work, sleeping in, no transportation, appointments, mental health (anxiety, depressions, etc.), and other school responsibilities. In each case, the response options were three-fold: 0 days, 1 to 2 days, or 3 or more days. Respondents could mark all that applied.
School: Feelings About/Treatment While At
Item 33 asks that youth report how much they agree or disagree with assorted statements pertaining to their feelings about and treatment while at school. The statements include: “I feel like I am part of my school,” “I am happy to be at my school,” “School staff treat me fairly,” “School staff expect me to do well,” “I feel safe at my school,” “My teachers care about me,” and “Other school staff care about me.” In each case, the response options were five-fold: strongly disagree, disagree, neither agree nor disagree, agree, and strongly agree. We, in turn, collapsed those options into the following three categories: strongly disagree/disagree, neither agree nor disagree, and agree/strongly agree for brevity and also to avoid small cell sizes.
School: Perceptions of Safety in Assorted Locations
Item 106 asks that youth report how often they feel safe, while in assorted locations at school. They include: in the classroom, in the washrooms, in the changing rooms, in the hallways and stairwells, in the library, in the cafeteria, outside on school grounds, and getting to/from school. In each case, the response options were six-fold: never, rarely, sometimes, usually, always, and not applicable. We, in turn, collapsed those options into the following four categories: never/rarely, sometimes, usually/always, and not applicable.
Data Analysis
In this study, we produced a series of descriptive statistics, including frequencies. We performed all analyses using the Complex Samples module of IBM SPSS Statistics, Version 24 (IBM Corp, 2016). Complex Samples helps compute statistics and standard errors from complex sample designs (such as stratified, clustered, or multistage sampling) and adjusts for the complex cluster-stratified sampling method and weighted data by incorporating sample designs into survey analysis (Saewyc et al., 2014). When running our Complex Samples analyses, McCreary Centre Society supplied us with a plan file containing the complex sampling plan specifications. Jennifer Baumbusch discuss details about plan files.
Masking Small Cell Sizes
Per McCreary Centre Society requirements, we masked any (unweighted) cell size that had nine or fewer youth and/or had a cell size which had a standard error that was 5% or greater so as to avoid deductive disclosure. None of the cells had problems related to the latter.
Results
In this section, we refer to “highest percentages” and “lowest percentages.” With these phrases, we refer to the highest within-HCD group percentage and the lowest within-HCD group percentage, respectively – when the within-group percentages have been compared across groups for a given row of data.
School Absence: Reasons For
Table 3 presents how many days, during the past 30 days, respondents missed one or more classes at school because of assorted reasons. Here, we focus on 0 days and 3+ days, but the results for 1 to 2 days are included in Table 3.
Percentages of Youth Who Reported “During the Past 30 Days, on How Many Days Have You Missed One or More Classes at School Because of. . .” (Working Provincial Weighted N = 243,645).
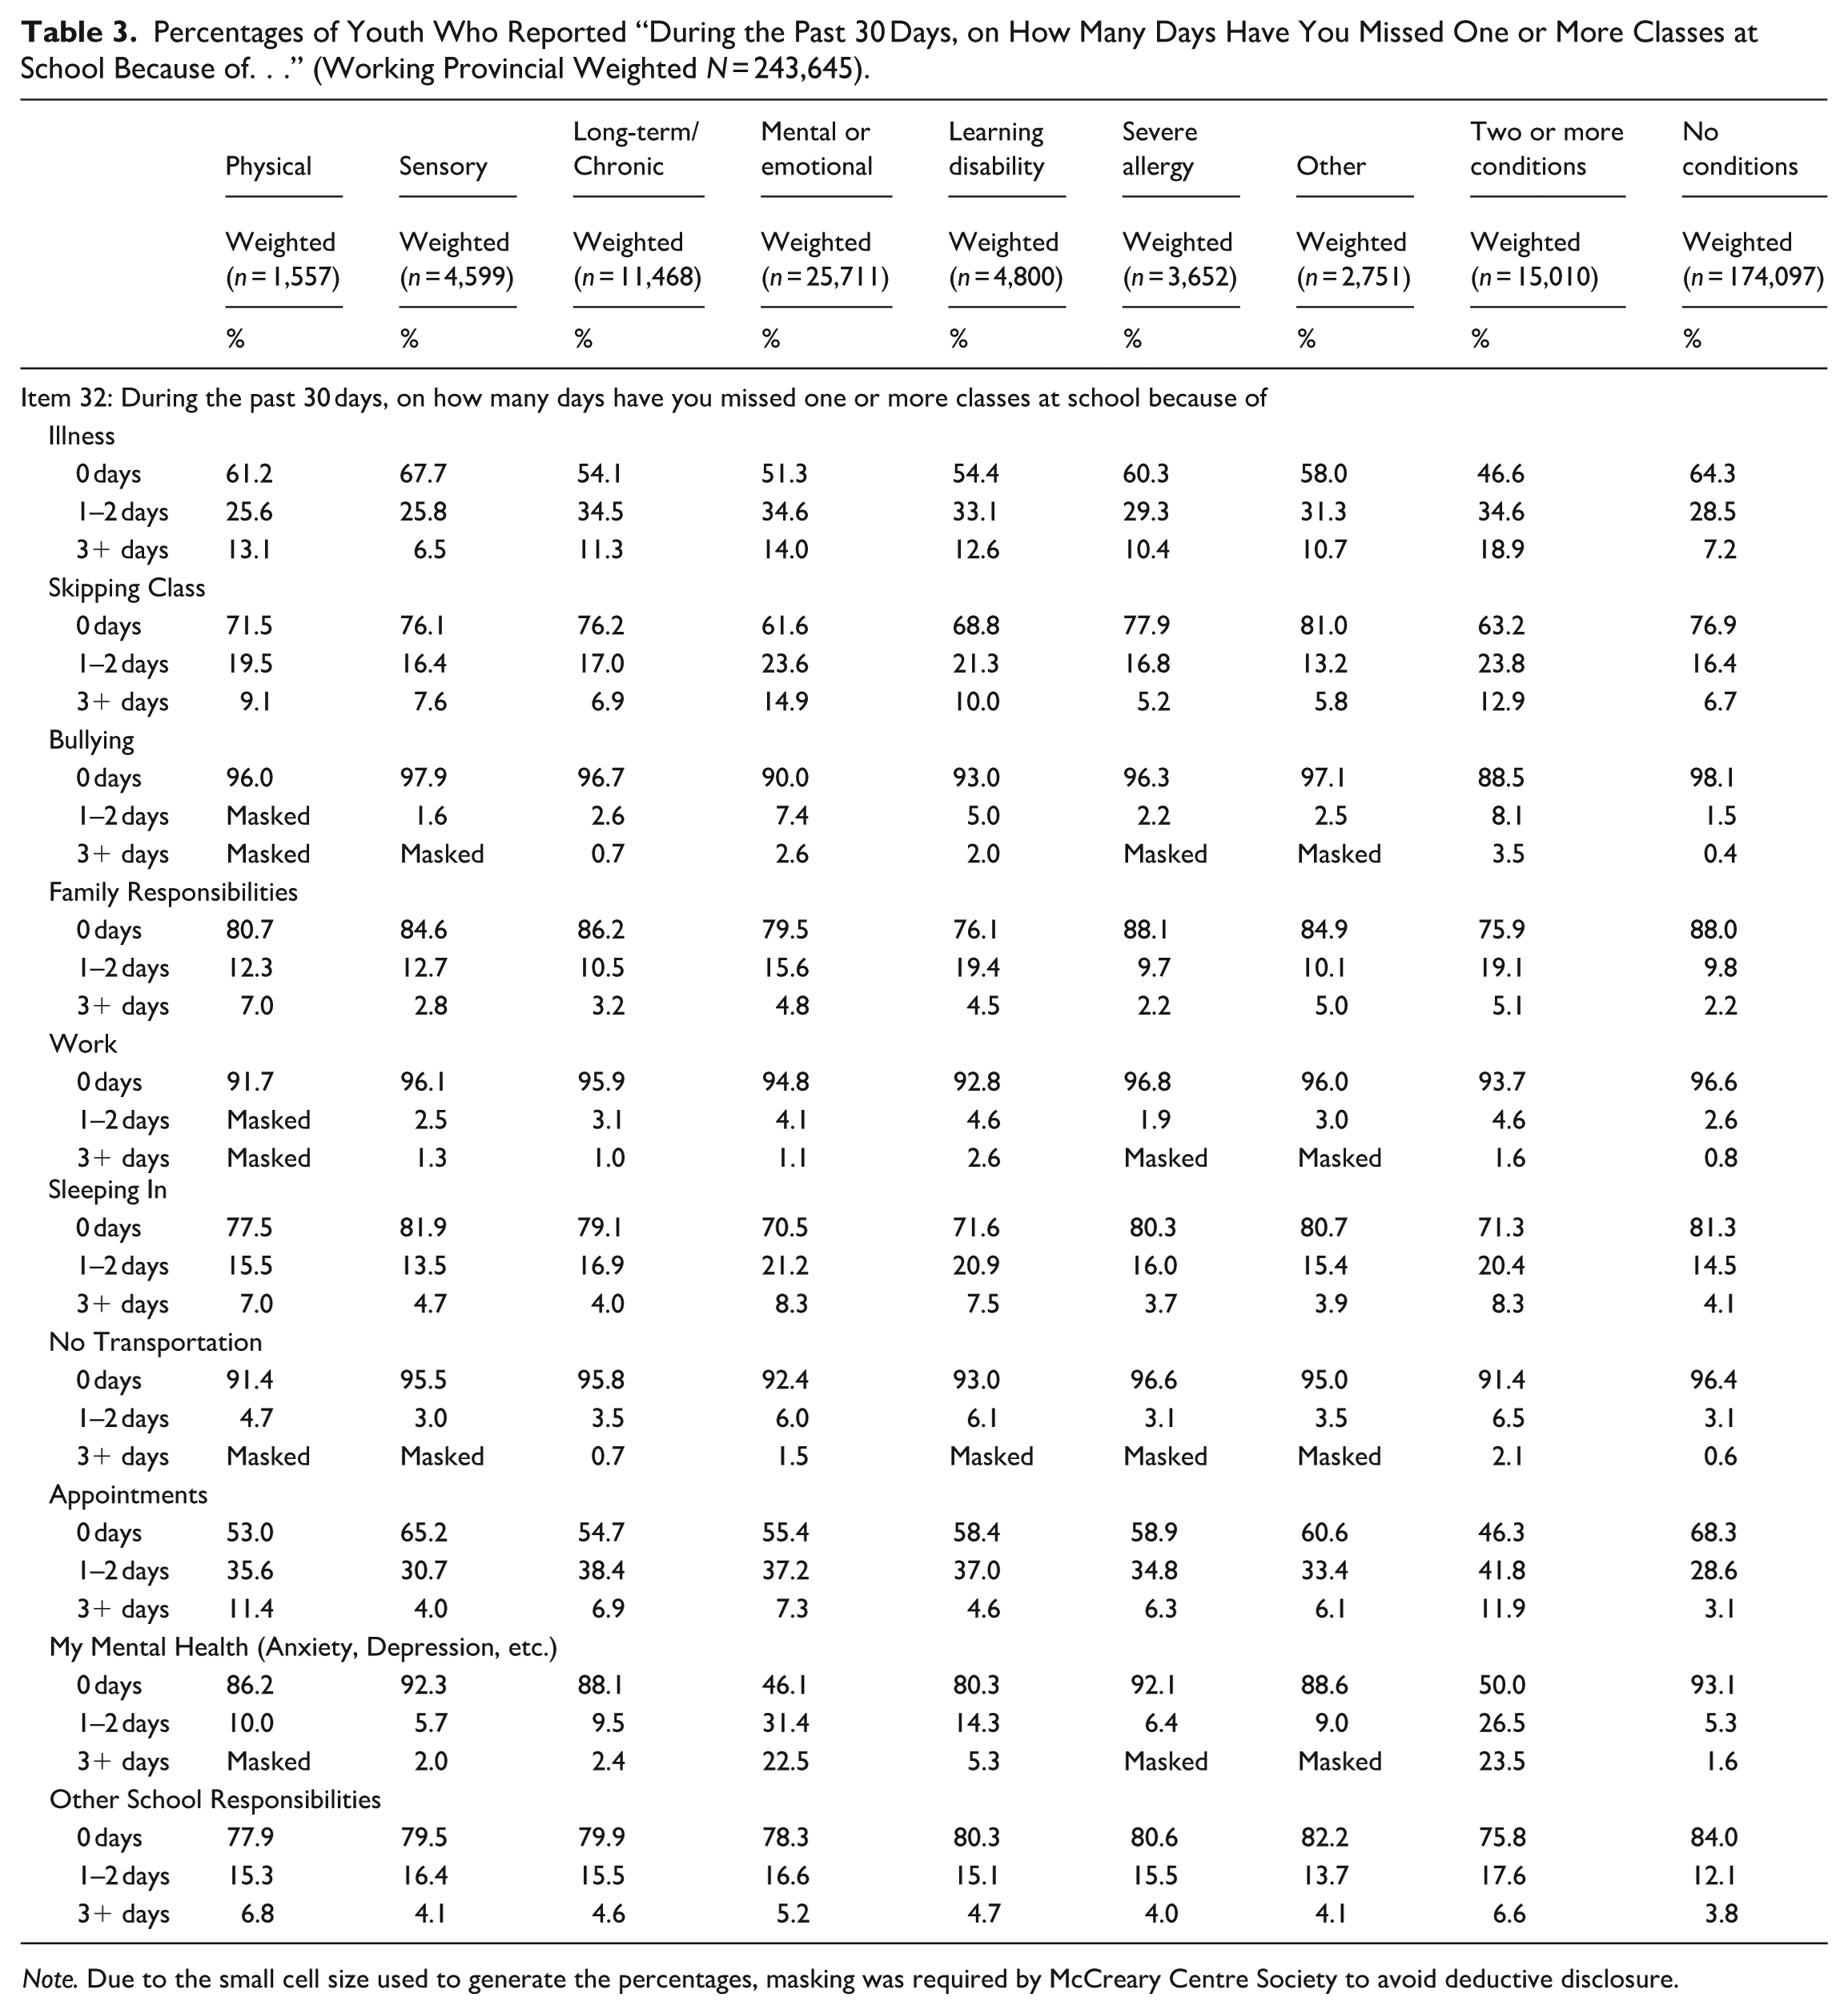
Note. Due to the small cell size used to generate the percentages, masking was required by McCreary Centre Society to avoid deductive disclosure.
For illness, sensory had the highest percentage of 0 days missed (67.7%), whereas two or more conditions had the lowest (46.6%). Sensory had the lowest percentage of 3+ days missed (6.5%), whereas two or more conditions had the highest (18.9%).
For skipping class, mental or emotional had the lowest percentage of 0 days missed (61.6%), whereas other had the highest (81.0%). Mental or emotional had the highest percentage of 3+ days missed (14.9%), whereas severe allergy had the lowest (5.2%).
For bullying, two or more conditions had the lowest percentage of 0 days missed (88.5%), whereas no conditions had the highest (98.1%). Two or more conditions had the highest percentage of 3+ days missed (3.5%), whereas no conditions had the lowest (0.4%).
For family responsibilities, severe allergy had the highest percentage of 0 days missed (88.1%), whereas two or more conditions had the lowest (75.9%). Severe allergy and no conditions had the lowest percentage of 3+ days missed (2.2%, tied), whereas physical had the highest (7.0%).
For work, physical had the lowest percentage of 0 days missed (91.7%), whereas severe allergy had the highest (96.8%). Learning disability had the highest percentage of 3+ days missed (2.6%), whereas no conditions had the lowest (0.8%).
For sleeping in, sensory had the highest percentage of 0 days missed (81.9%), whereas mental or emotional had the lowest (70.5%). Mental or emotional and two or more conditions had the highest percentage of 3+ days missed (8.3%, tied), whereas severe allergy had the lowest (3.7%).
For no transportation, physical and two or more conditions had the lowest percentage of 0 days missed (91.4%, tied), whereas severe allergy had the highest (96.6%). Two or more conditions had the highest percentage of 3+ days missed (2.1%), whereas no conditions had the lowest (0.6%).
For appointments, two or more conditions had the lowest percentage of 0 days missed (46.3%), whereas no conditions had the highest (68.3%). Two or more conditions had the highest percentage of 3+ days missed (11.9%), whereas no conditions had the lowest (3.1%).
For my mental health, mental or emotional had the lowest percentage of 0 days missed (46.1%), whereas no conditions had the highest (93.1%). Two or more conditions had the highest percentage of 3+ days missed (23.5%), whereas no conditions had the lowest (1.6%).
Finally, for other school responsibilities, two or more conditions had the lowest percentage of 0 days missed (75.8%), whereas no conditions had the highest (84.0%). Physical had the highest percentage of 3+ days missed (6.8%), whereas no conditions had the lowest (3.8%).
School: Feelings About/Treatment While At. Table 4 presents respondents’ assorted feelings about school and perceptions about their treatment while at school. Here, we focus on “strongly disagree/disagree” and “agree/strongly agree,” with results for “neither agree nor disagree” also included in Table 4.
Percentages of Youth Who Reported “How Much Do You Agree or Disagree With the Following Statements?” (Working Provincial Weighted N = 243,645).
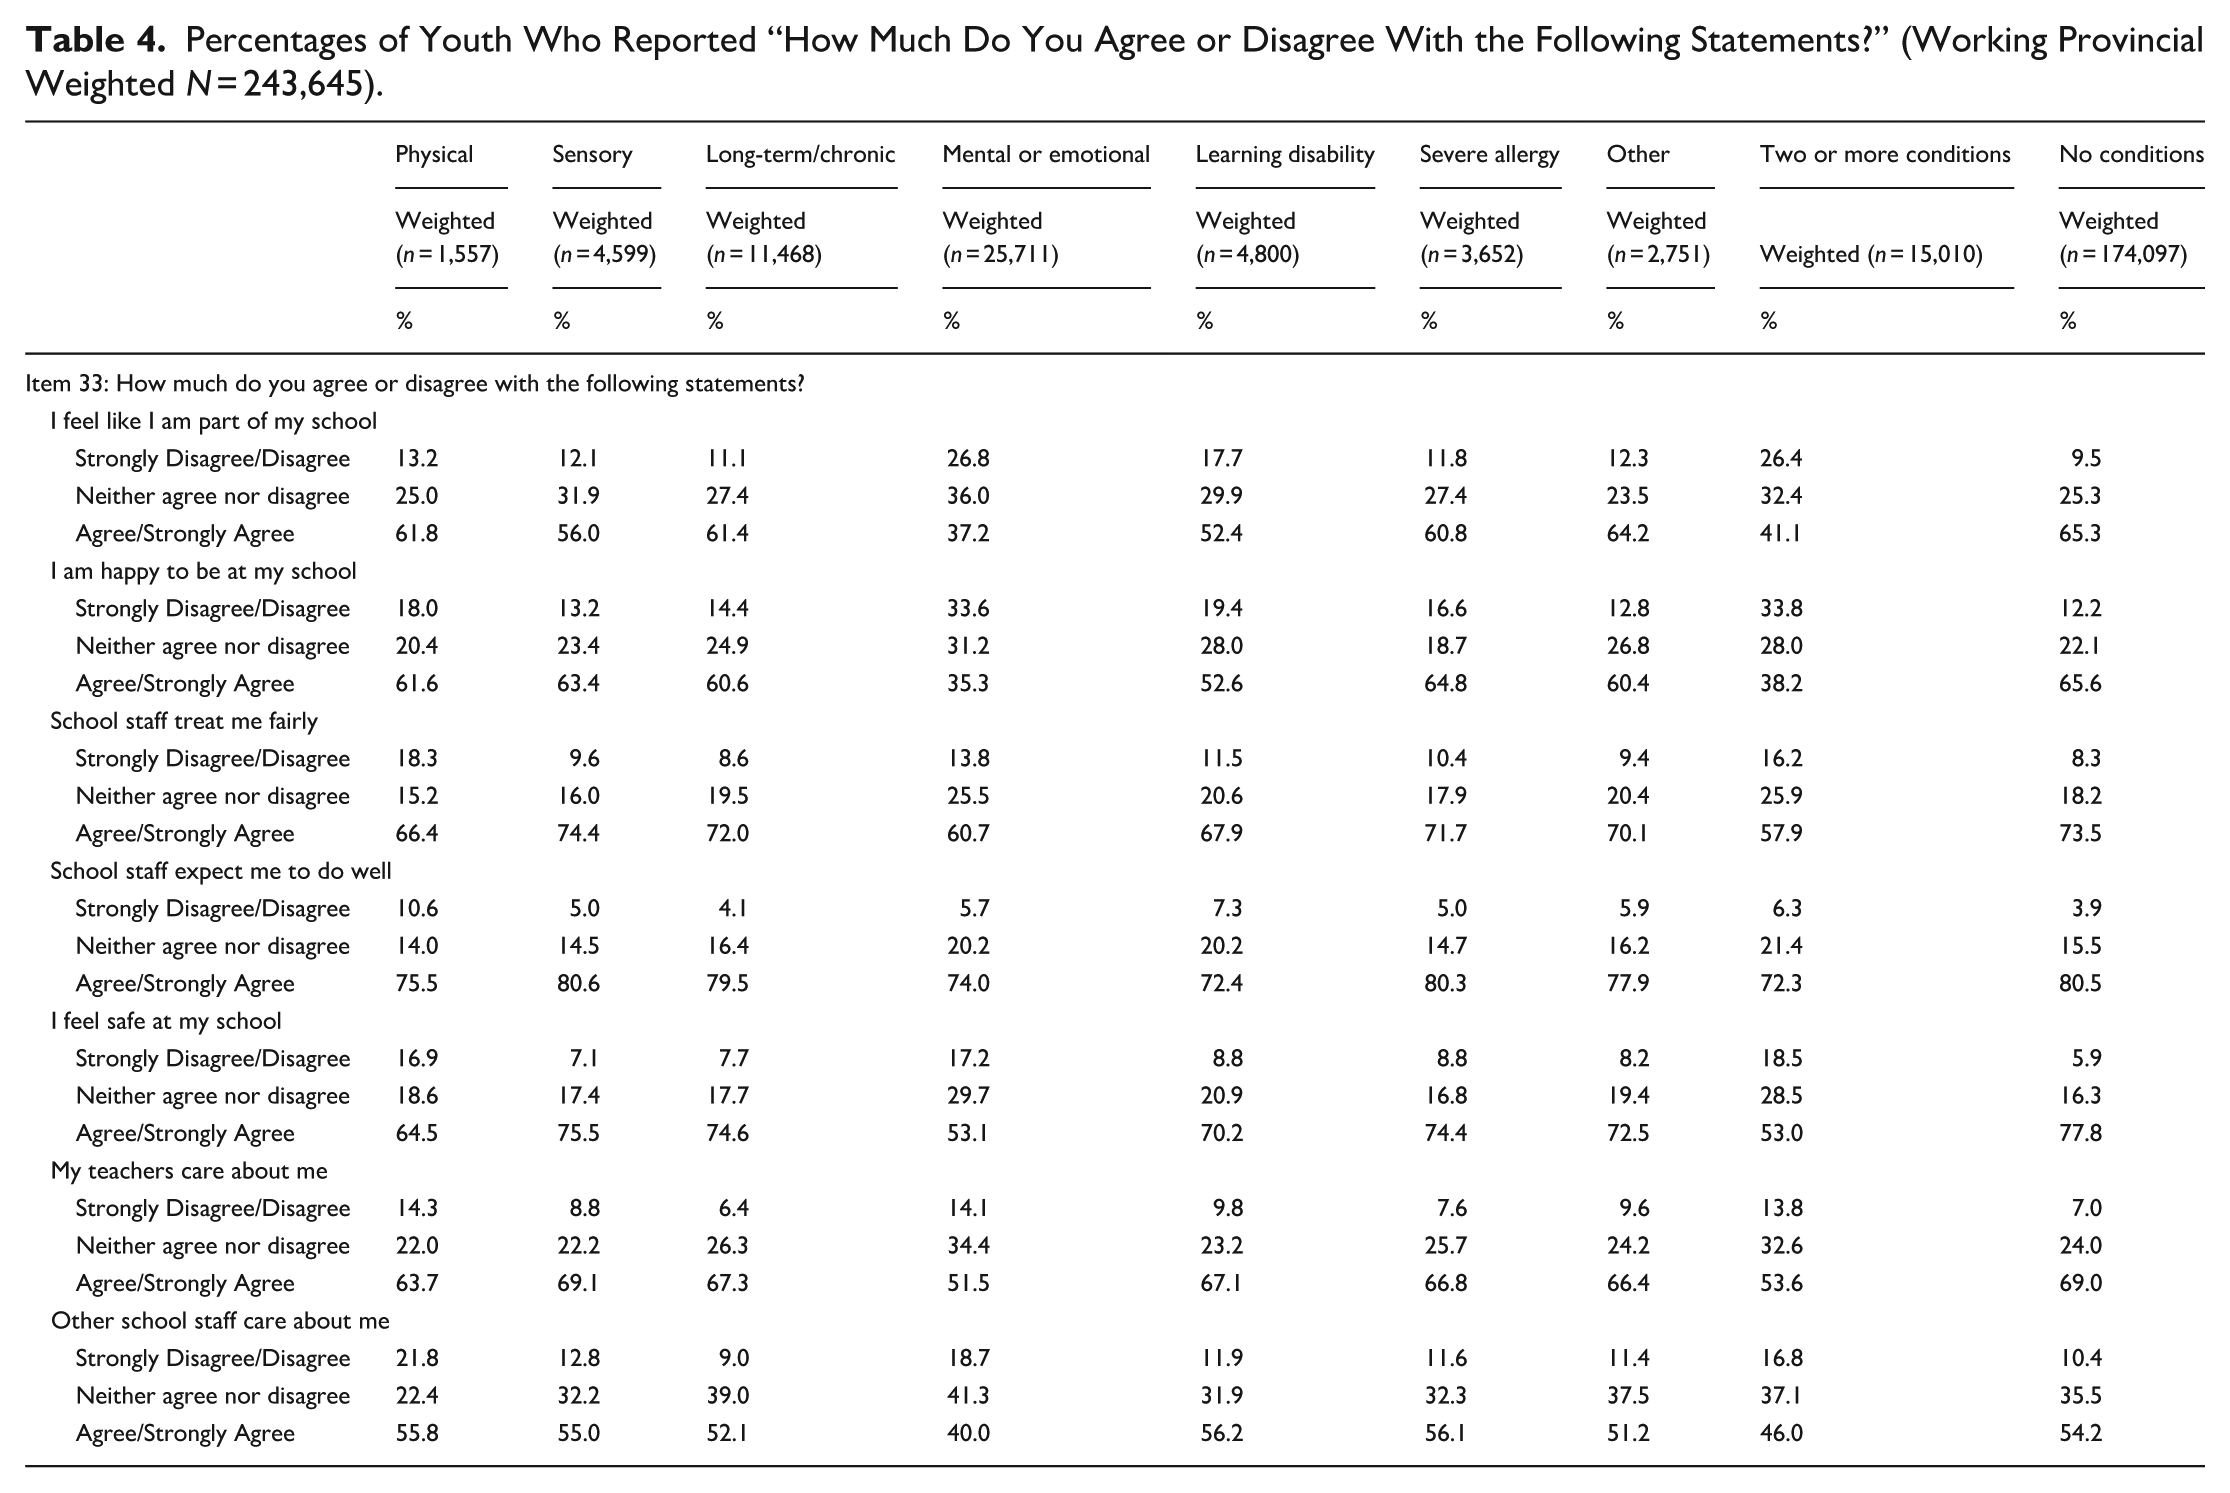
For I feel like I am part of my school, mental or emotional had the lowest percentage of strongly disagree/disagree (26.8%), whereas no conditions had the lowest (9.5%). Mental or emotional had the lowest percentage of agree/strongly agree (37.2%), whereas no conditions had the highest (65.3%).
For I am happy to be at my school, two or more conditions had the highest percentage of strongly disagree/disagree (33.8%), whereas no conditions had the lowest (12.2%). Mental or emotional had the lowest percentage of agree/strongly agree (35.3%), whereas no conditions had the highest (65.6%).
For school staff treat me fairly, two or more conditions had the highest percentage of strongly disagree/disagree (16.2%), whereas no conditions had the lowest (8.3%). Sensory had the highest percentage of agree/strongly agree (74.4%), whereas two more conditions had the lowest (57.9%).
For school staff expect me to do well, physical had the highest percentage of strongly disagree/disagree (10.6%), whereas no conditions had the lowest (3.9%). Sensory had the highest percentage of agree/strongly agree (80.6%), whereas two more conditions had the lowest (72.3%).
For I feel safe at my school, two or more conditions had the highest percentage of strongly disagree/disagree (18.5%), whereas no conditions had the lowest (5.9%). Two or more conditions had the lowest percentage of agree/strongly agree (53.0%), whereas no conditions had the highest (77.8%).
For my teachers care about me, physical had the highest percentage of strongly disagree/disagree (14.3%), whereas long-term/chronic had the lowest (6.4%). Sensory had the highest percentage of agree/strongly agree (69.1%), whereas mental or emotional had the lowest (51.5%).
Finally, for other school staff care about me, physical had the highest percentage of strongly disagree/disagree (21.8%), whereas long-term/chronic had the lowest (9.0%). Physical had the highest percentage of agree/strongly agree (55.8%), whereas mental or emotional had the lowest (40.0%).
School: Perceptions of Safety in Assorted Locations. Table 5 presents reports about how often youth feel safe, while in assorted locations at school. As aforementioned, we collapsed the “never” and “rarely” response options, and also the “usually” and “always” options. Here, we focus on “never/rarely” and “usually/always,” but the results for “sometimes” and “not applicable” are included in Table 5.
Percentages of Youth Who Reported “While at School, How Often Do You Feel Safe?” (Working Provincial Weighted N = 243,645).
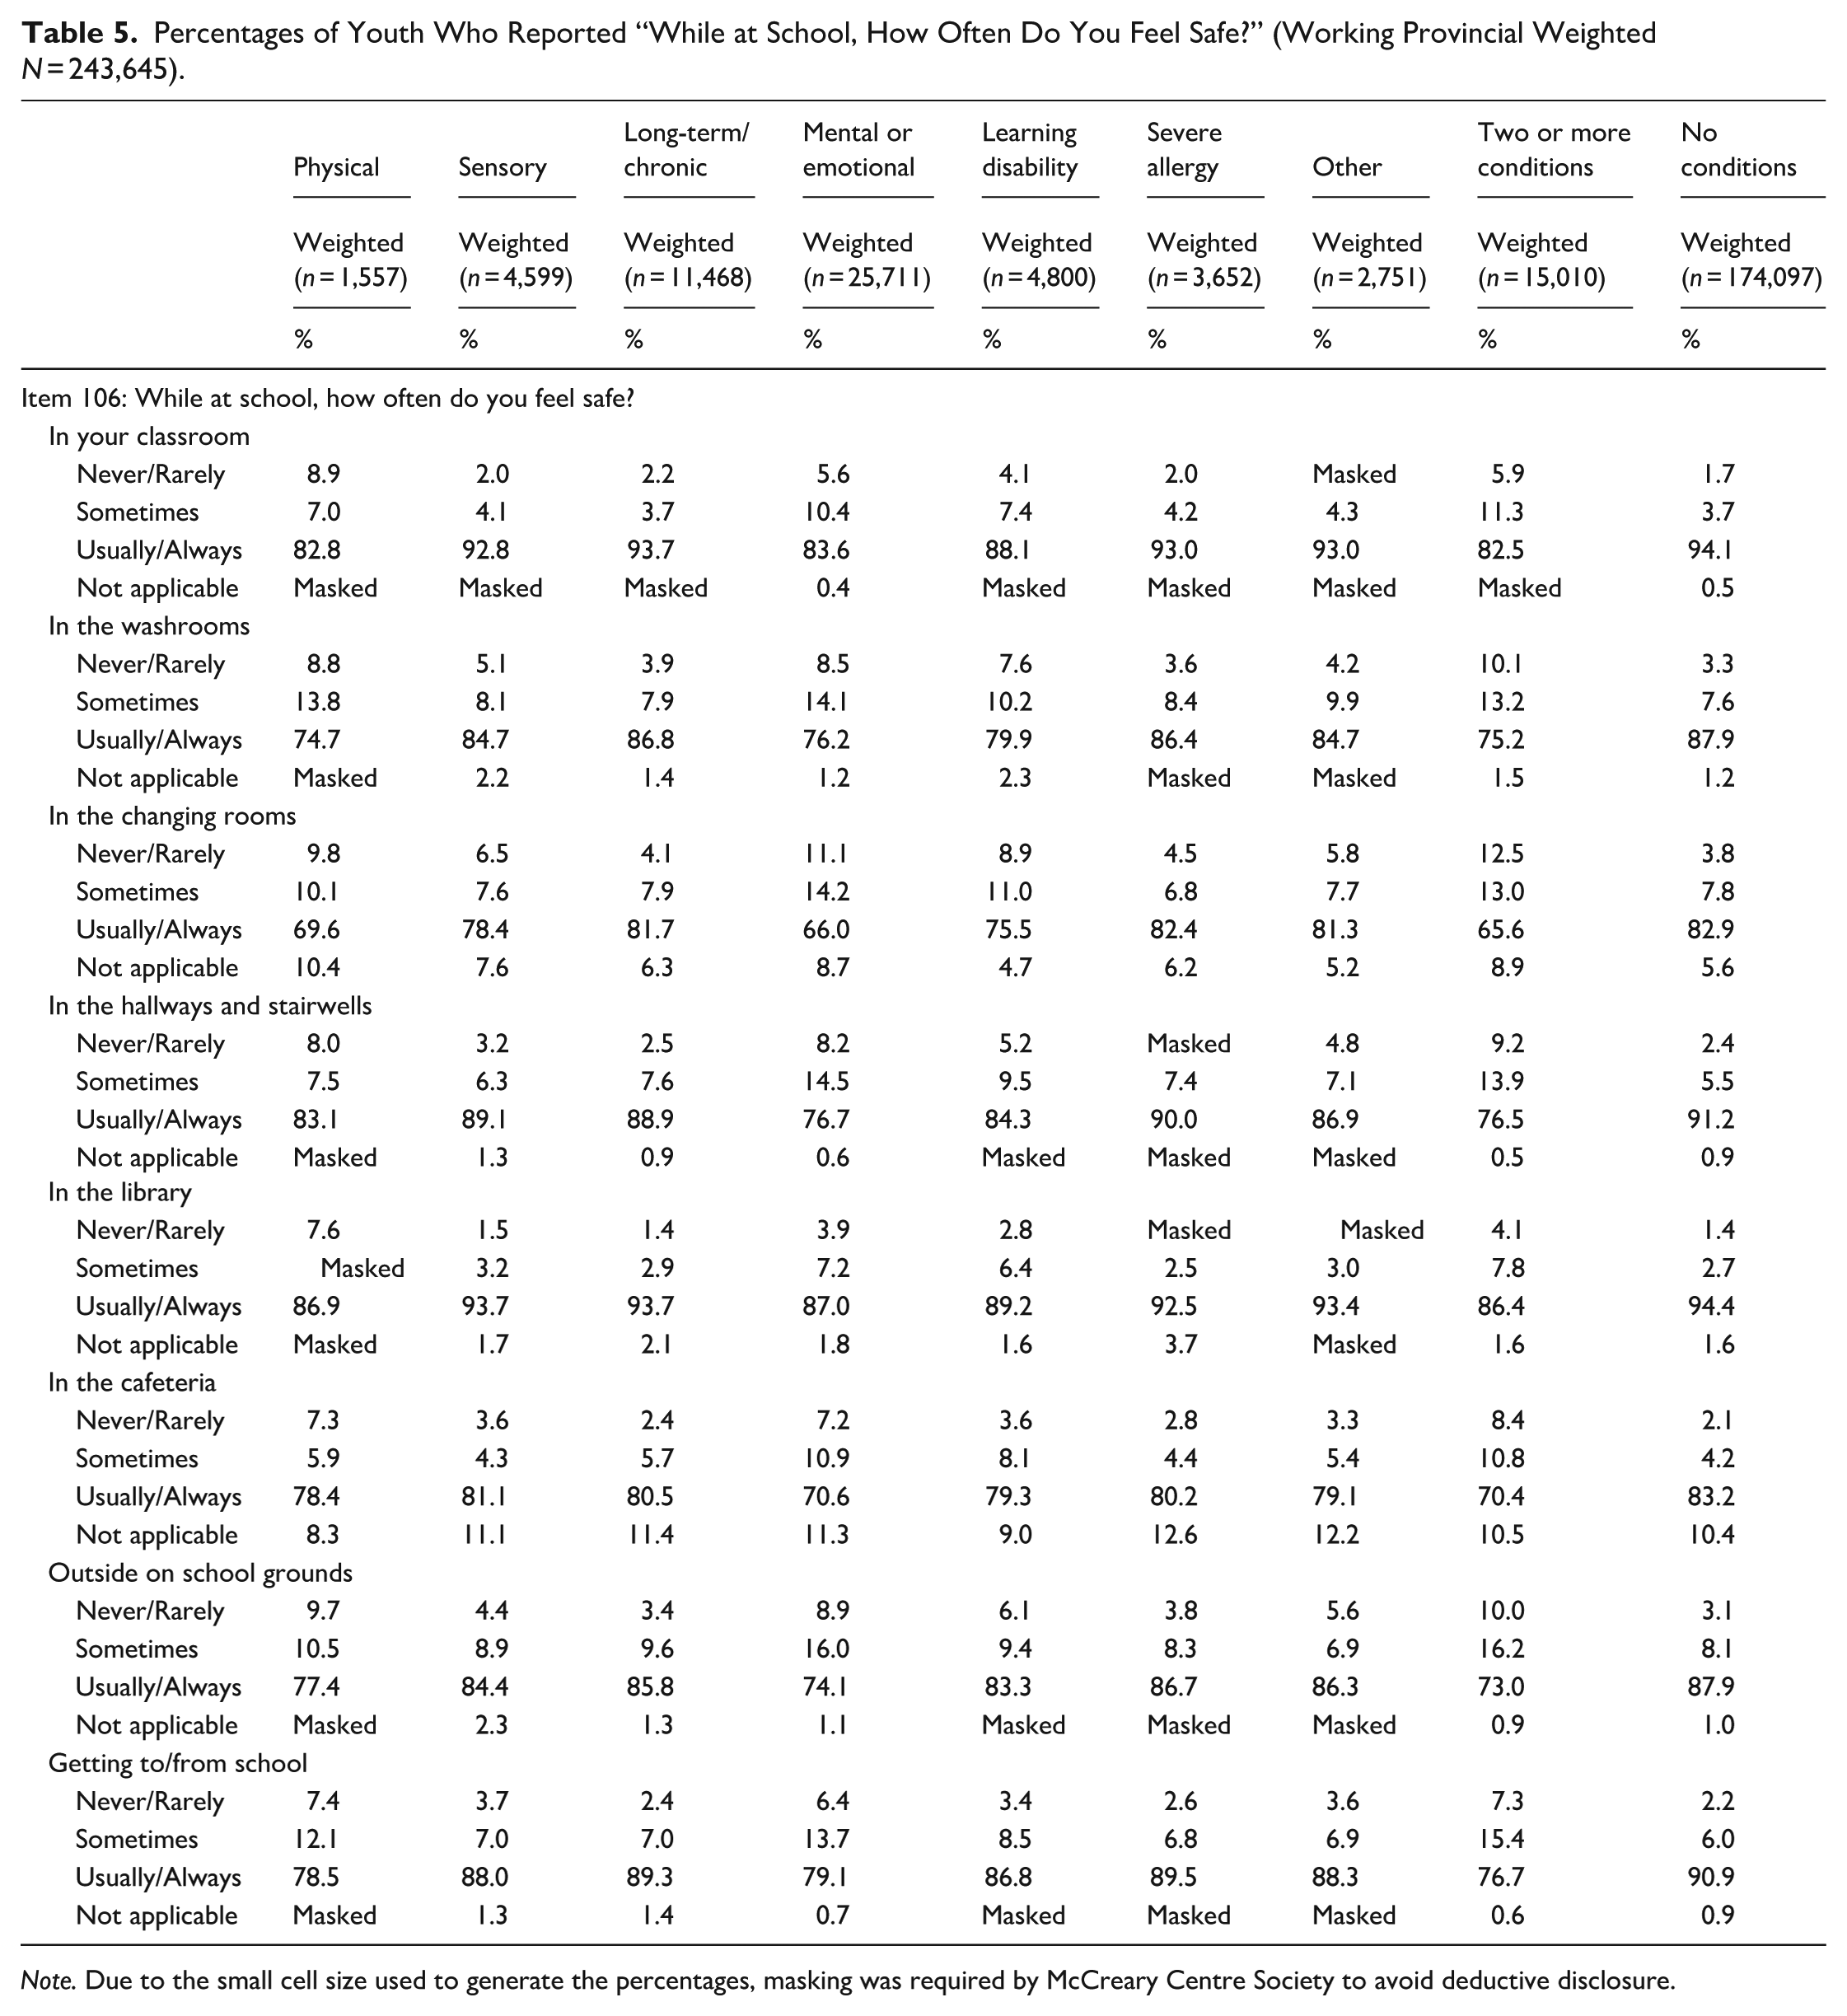
Note. Due to the small cell size used to generate the percentages, masking was required by McCreary Centre Society to avoid deductive disclosure.
For In your classroom, physical had the highest percentage of never/rarely (8.9%), whereas no conditions had the lowest (1.7%). Two or more conditions had the lowest percentage of usually/always (82.5%), whereas no conditions had the highest (94.1%).
For In the washrooms, two or more conditions had the highest percentage of never/rarely (10.1%), whereas no conditions had the lowest (3.3%). Physical had the lowest percentage of usually/always (74.7%), whereas no conditions had the highest (87.9%).
For In the changing rooms, two or more conditions had the highest percentage of never/rarely (12.5%), whereas no conditions had the lowest (3.8%). Two or more conditions had the lowest percentage of usually/always (65.6%), whereas no conditions had the highest (82.9%).
For In the hallways and stairwells, two or more conditions had the highest percentage of never/rarely (9.2%), whereas no conditions had the lowest (2.4%). Two or more conditions had the lowest percentage of usually/always (76.5%), whereas no conditions had the highest (91.2%).
For In the library, physical had the highest percentage of never/rarely (7.6%), whereas long-term/chronic and no conditions had the lowest (1.4%, tied). Two or more conditions had the lowest percentage of usually/always (86.4%), whereas no conditions had the highest (94.4%).
For In the cafeteria, two or more conditions had the highest percentage of never/rarely (8.4%), whereas no conditions had the lowest (2.1%). Two or more conditions had the lowest percentage of usually/always (70.4%), whereas no conditions had the highest (83.2%).
For Outside on school grounds, two or more conditions had the highest percentage of never/rarely (10.0%), whereas no conditions had the lowest (3.1%). Two or more conditions had the lowest percentage of usually/always (73.0%), whereas no conditions had the highest (87.9%).
Finally, for Getting to/from school, physical had the highest percentage of never/rarely (7.4%), whereas no conditions had the lowest (2.2%). Two or more conditions had the lowest percentage of usually/always (76.7%), whereas no conditions had the highest (90.9%).
Discussion
School absence can negatively impact the academic performance of youth, with subsequent long-term impacts. Using data from the BCAHS, our study examined the issue of school absence among a population of youth with HCD. We explored the prevalence and factors that may contribute to school absences, including feelings about and treatment at school, as well as perceptions of safety while in different school locations or contexts. In terms of the overall prevalence of school absences, we found that youth with HCD were generally more likely to report being absent from school compared to youth without HCD, which is consistent with findings from other studies (Black & Zablotsky, 2018; John et al., 2022; Moonie et al., 2008). Also consistent with previous research (Anderson, 2021), we found that school absence varied among different types of HCDs. Three specific groups of students reported experiencing more school absences and factors that may contribute to school absence more than the other HCD groups or students with no HCD: those with two or more HCD, those with mental or emotional needs, and those with physical needs.
In terms of the reason for school absences, students with two or more conditions were more likely to be absent three or more days in the past 30 days than the other HCD groups, across a number reasons including: illness, bullying, no transportation, appointments, and mental health. In line with our findings, Fleming et al. (2017) suggest that students with certain disabilities, such as ADHD, were more likely to have poorer outcomes related to school attendance and performance, alongside greater utilisation of healthcare. These students may experience school absences that are not in their control (e.g. health or therapy appointments) to address their varied and multiple needs. They would benefit from policies and school-based practices that proactively accommodate the multiple demands on their time, such as pre-planned school work for anticipated absences and access to virtual educational supports.
Our results indicated that, of all HCD groups, youth with two or more conditions were the most likely to feel unsafe while at school. Youth with more than two conditions may experience more psychosocial stressors at school due to having difficulties in multiple academic areas (Sahoo et al., 2015). Beyond perceptions of safety at school, Ramirez et al. (2004) highlight that the overall school-related injury rate was the highest among students with multiple disabilities compared to other disabilities, such as physical or developmental disabilities. Fears around injury may also contribute to feelings of being unsafe at school. School teachers, counsellors, nurses and administrators play an important role in creating a sense of community within a school that foster a safe learning environment (Williams et al., 2018). Further, Williams et al. (2018) highlight that feelings of safety may increase when students have positive relationships with peers and teachers, rules are consistent, the school is well-maintained and occupied, and there are feelings of belonging to the school. The importance of fair rule enforcement in relation to perceived school safety was also echoed by the findings from Mori et al.’s (2021) systematic review. This finding highlights the need for tailored supports for this group around school safety.
For the three specific HCD groups of students who reported experiencing more school absences, the results of our study demonstrated an association between school absence and the following factors: being less happy at school, not being treated well at school, and feeling less safe at school. This is consistent with research from Daily et al. (2020) highlighting that satisfaction with school and perceptions of safety have a role in school absences. Steiner and Rasberry (2015) further highlight that students who experience bullying (whether in-person or electronic) had increased odds of school absences, compared to those who did not experience bullying. Our results extend what is currently understood by illustrating differences between groups of students with HCD and amplify the need for supports that address their unique needs.
Our results add to the literature and extend previous research about students with mental or emotional needs being more at risk of school absence than other groups (Klan et al., 2024). Given that this group of youth were also disproportionately female, this is also a gendered issue. Previous research has demonstrated that school absences in this group are related to a variety of inter-relate factors including: emotional/behavioural needs, social needs, and academic needs (Klan et al., 2024). These diverse factors point to the need for responses that both explore the underlying reasons for school absence and multi-faceted interventions. However, depending on the jurisdiction, there can be significant gaps in formal resources. In a systematic review, the authors estimate that 12.7% of children meet the diagnostic criteria for a mental health disorder at any given time (Barican et al., 2022). In BC, the study setting, it is estimated that there is one school counsellor per 693 students (Katral, 2025). Moreover, access to diagnoses and ongoing mental health supports often involve lengthily waitlists and out-of-pocket costs for families. These complex issues involving youth with mental or emotional needs point to the need for greater integration of education and healthcare services.
Implications for Policy and Practice
Our study demonstrates the need for programmes that support students with HCD to be present at school and mitigate factors contributing to school absence. Importantly, interventions focused on interpersonal factors ought to be school-level rather than student-level, that is, these programmes need to include students with HCD and students who do not have HCD. In a meta-analysis of the literature, Chae et al. (2018) indicate that school-based interventions focused on improving attitudes towards disability were more effective compared to interventions focused on disability awareness and recommended strategies that include contact-based interventions, using materials related to human rights and role-playing (Chae et al., 2018). Additionally, interventions that aimed to promote the inclusion of youth with HCD may help them feel more included and safer at school. Previous research has demonstrated that increasing the amount of time students with HCDs are in “mainstream” or “general” classrooms with their peers, can decrease school absence in this population. However, an important caveat is that these classrooms and teachers need to be equipped with resources that facilitate inclusion (Anderson, 2021). For students with ongoing health conditions requiring treatment, better coordination is needed between the health and education systems to minimise overlap of care and services that contribute to school absence. Currently, there is inadequate data on interventions to improve inclusion at schools on a global scale and more research is needed (Mendoza & Heymann, 2022). In particular, research that addresses the heterogeneity of HCD among students and contributes to the development of targeted rather than generic educational policies and school-level programmes.
Strategies to address structural factors are also needed. These include practical issues such as improving availability of transportation for students with HCD, ensuring supports are in place to make up material when they are absent due to medical appointments, and ensuring that physical spaces in the school feel safe.
Limitations
With respect to our study limitations, is necessary to acknowledge this is a descriptive study only and causal relationships can not be established from our results. Future studies should include inferential models to explicitly explore the role of age, gender, socioeconomic status and other characteristics. As well, data were collected over a 5 month period and school absence would fluxuate during that period due to extraneous factors such as flu seasons, holidays, etc. Future research should also include linked databases that could provide further context for school absence, for example health-related data, family socioeconomic status (Kearney & Childs, 2023). Further, small cell sizes required masking of some results. In terms of the study population, one classification of HCD that is not indicated on the survey is intellectual and developmental disabilities and therefore we cannot report on this group of students. As stated previously, the HCD classifications in this study are student self-reported and are not based on clinical diagnosis by a healthcare professional.
In conclusion, in this study we explored school absence among youth with HCD. A key finding was that youth with HCD reported higher rates of school absence than those with no HCD. This is a critical issue as it stands to impact the quality and effectiveness of youth’s educational experiences, as well as being a considerable source of educational inequity. Addressing this inequity will require tailored interventions to address the factors impacting each group of students with HCD; these include structural (e.g. availability of transportation to school, creating safe spaces throughout schools) and interpersonal (e.g. bullying) programmes. This descriptive study provides a foundation for further inquiry into these factors, including feelings of belonging and school climate, which influence school absence among students with HCD in the Canadian context.
Footnotes
Acknowledgements
Funding
The authors received no financial support for the research, authorship, and/or publication of this article.
Declaration of Conflicting Interests
The authors declared no potential conflicts of interest with respect to the research, authorship, and/or publication of this article.