
Abstract
Introduction
The amount of survival is not the primary aim of palliative care. Nevertheless, calculating the survival of patients is essential for several reasons. It is crucial for patients and their families to plan their lives and allow them to solve issues such as settling financial matters and saying their goodbyes to their loved ones. It is also essential for health professionals to judge the adequacy of interventions, such as proceeding with transfusions, initiating antibiotics, or concentrating on comfort measures. In some countries, survival is essential for reimbursement for medical services. 1
However, prognostication is uncertain, so survival might be longer or shorter than expected. The survival of patients referred to palliative care is usually expected to be relatively short. For example, the surprise question used frequently to identify patients for palliative care uses different time frames for the expected survival. 2 However, 1 year is the longest used, 3 to the best of our knowledge. The studies on prognosis performed in palliative care aim to determine how short survival seems. 4 Some even try to find signs of impending death. 5
Palliative care services (PCS) are often overwhelmed by admission requests, and there is a need to establish priorities, and the expected survival can be crucial in the decision process. In our PCS, many patients had relatively long survivals, sometimes several years, but patients with more than 1 year of follow up were not rare. For that reason, this study was carried out aiming to quantify them and to identify prognostic factors associated with those longer survivals, comparing the available factors recorded in patients’ files who lived more than 1 year with the same factors of patients who lived 6 months or less, a criterium that was once used to define a terminal patient. 6 Therefore, the aim of this study is not about factors associated with short survival; on the contrary, this study aims to find prognostic factors of relatively long survival. To our knowledge, this is the first study that deals with this question.
Methods
Study Design
This is a retrospective case-control study. Patients were identified through electronic records from 2012 (the starting year of using electronic records) until December 2018. All patients were older than 18 years with solid tumors. Cases were all patients who survived longer than 1 year after being admitted to the PCS and had already died. As controls, patients had survival ≤6 months after admission on the PCS. Control patients were matched to cases by cancer type and sex, and in descending order:
age (the limit was age more or less than 5 years from the case) and year of diagnosis (also more or less than 5 years).
When the criteria of age and year of diagnosis could not be respected, the patients closer to those criteria were selected. For patients with more than one cancer diagnosis, the last cancer diagnosed was considered the primary, except for nonmelanoma skin cancer, where the primary was the next-to-last.
Setting
This study was carried out in a PCS of a public oncology hospital where around 10 000 new patients are admitted each year. The PCS was founded in 1994. Patients are referred to the PCS by physicians from the surgery, medical oncology, and radiotherapy services of the hospital. After being admitted to the PCS, patients usually are not submitted to antineoplastic treatment besides single fractions or short courses of radiotherapy for symptom control, such as metastatic bone pain or hemorrhage. Patients may be followed as inpatients, outpatients, or at home, depending on patients’ needs.
Data Collection
Data studied were collected at admission to the PCS, except for serum hematological and biochemical parameters, which were the closest to the admission, as most patients did not undergo blood tests, at least in the first contact. Data collected included demographics, symptoms, other problems (such as ascites and pressure ulcers), Eastern Cooperative Oncology Group (ECOG) performance status, Charlson Comorbidity Index, social data, blood tests, date of diagnosis, date of the first observation in the PCS, initial context (out or inpatient), and date of death. Cognition was categorized as normal or abnormal based on the notes in patients’ files: if, in the record at admission, there was any reference to abnormal cognition, such as confusion, agitation, impaired consciousness, or another similar expression, cognition was classified as abnormal; otherwise, it was classified as normal.
Statistical Analysis
For statistical purposes, initially, data were analyzed to identify coding errors, inconsistencies, and the presence of misclassification of cases or controls, and corrections were made where needed. An exploratory analysis of the data was performed to describe the sample. Variables were excluded if there were more than 15% missing. Continuous variables were categorized in quartiles. A logistic regression was used for univariable and multivariable analyses, and a confidence interval at 95% was calculated. The level of significance was deemed to be 0.05. In the univariable analysis, the Bonferroni correction was used to compensate for the number of variables. In the multivariable analysis, the Variance Inflation Factor was assessed to test for multicollinearity. The 29.0 version of the IBM SPSS statistical software was used to analyze the data.
Results
In the period under consideration, a total of 1721 patients were identified through the administrative records of the hospital. Of those patients, 111 (6.4%) were followed for at least 1 year and were included as cases. As controls, 363 patients were identified according to the established criteria. The objective was to match 4 controls for 1 case, but only a proportion of 3.3:1 was reached. The median survival of cases was 581 days (range: 371-2763), and the median survival of controls was 57 days (range: 1-182). Table 1 presents demographic data. The intended proportion of primary diagnosis between cases and controls could not be reached in some cases; some of them do not have any control, and in thyroid cancer, the number of cases was higher than in controls.
Demographic Data.
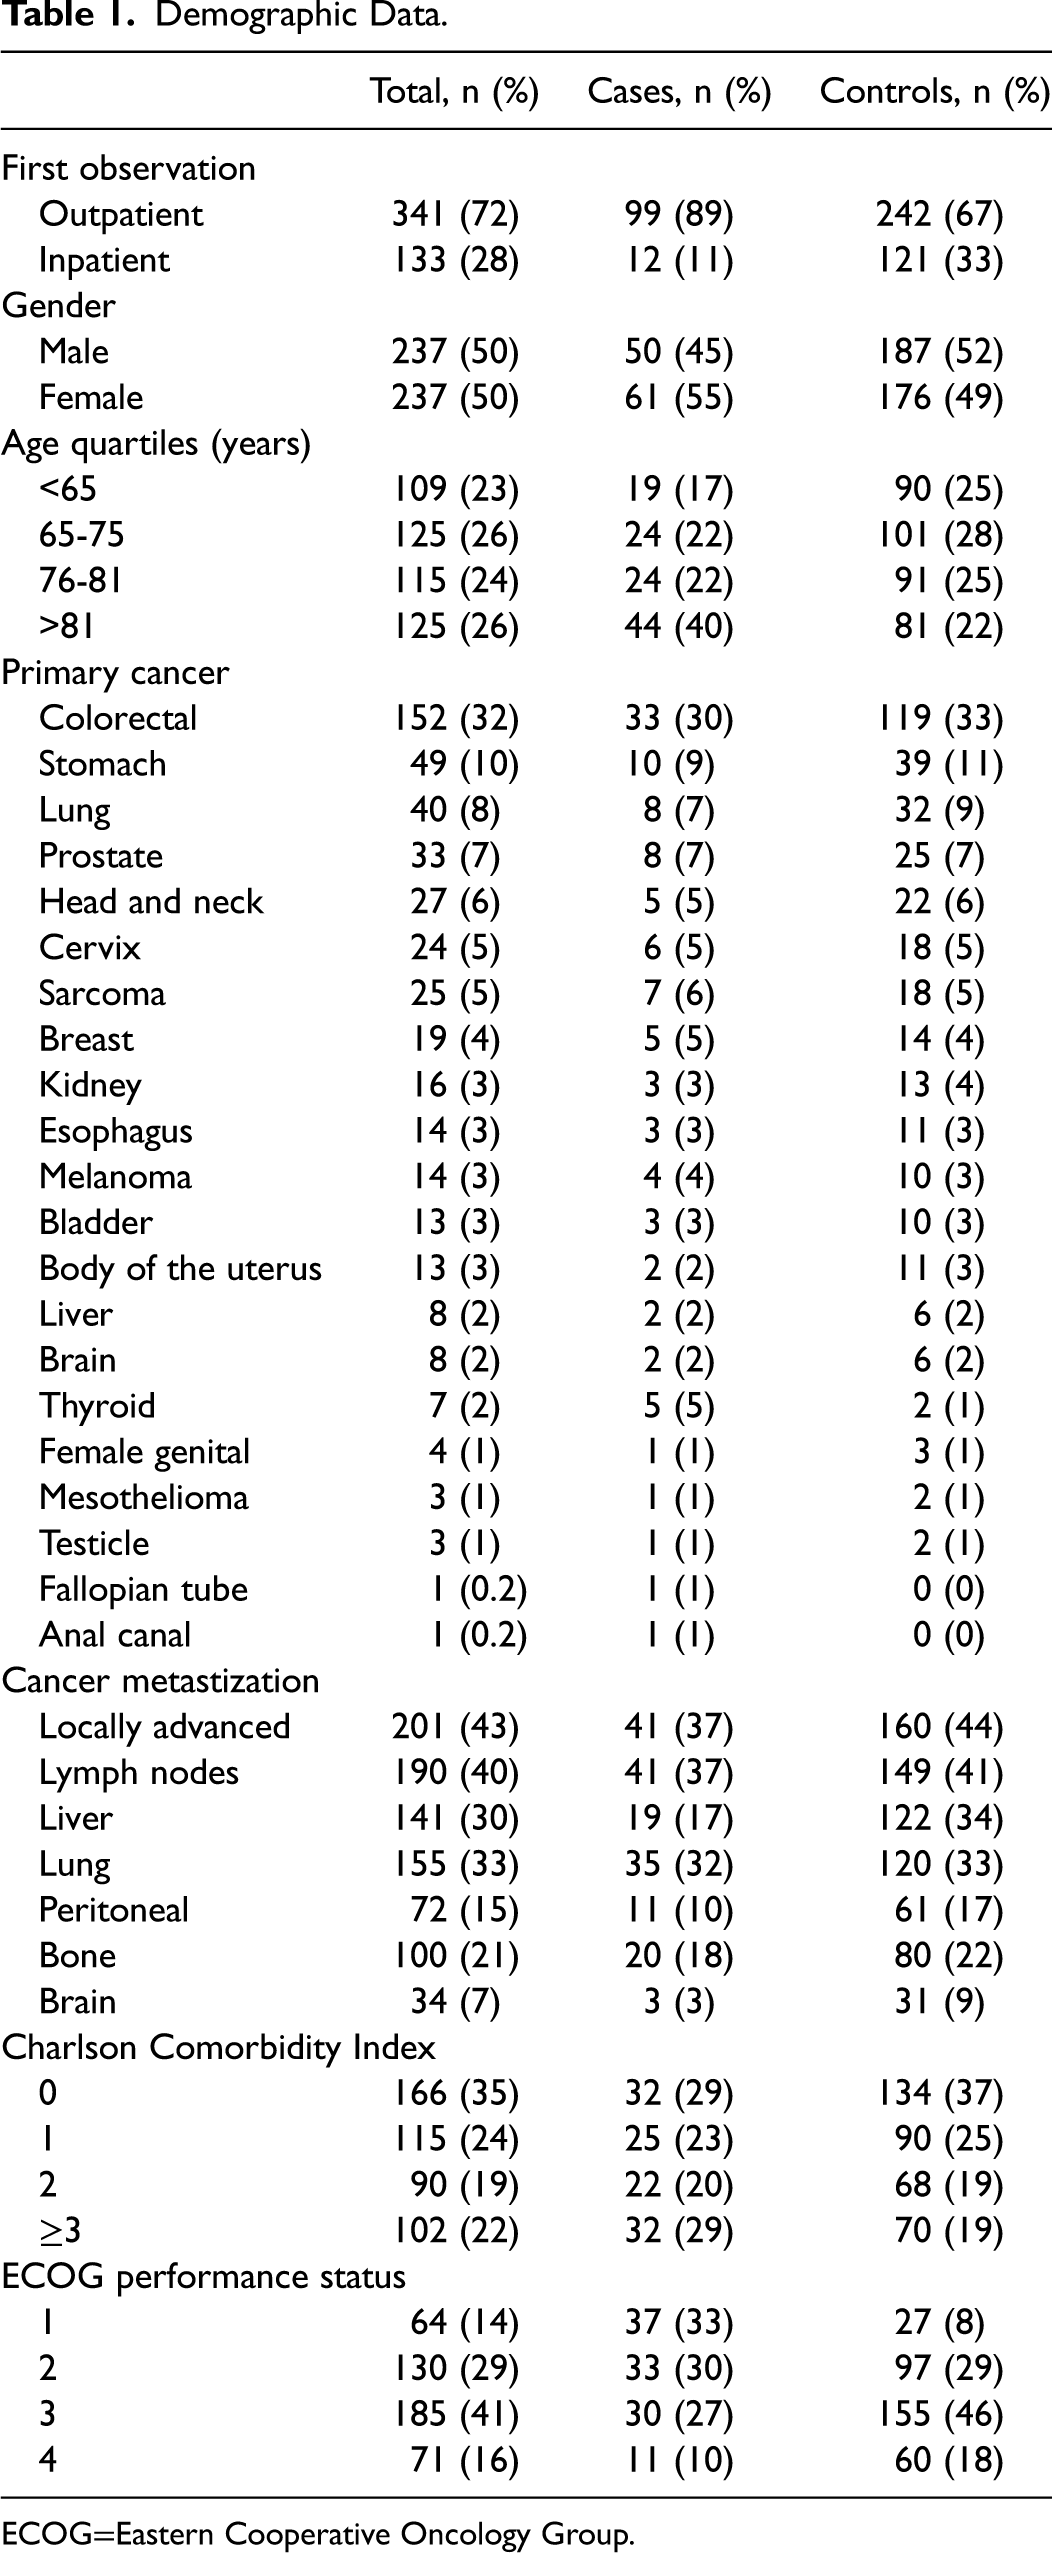
ECOG=Eastern Cooperative Oncology Group.
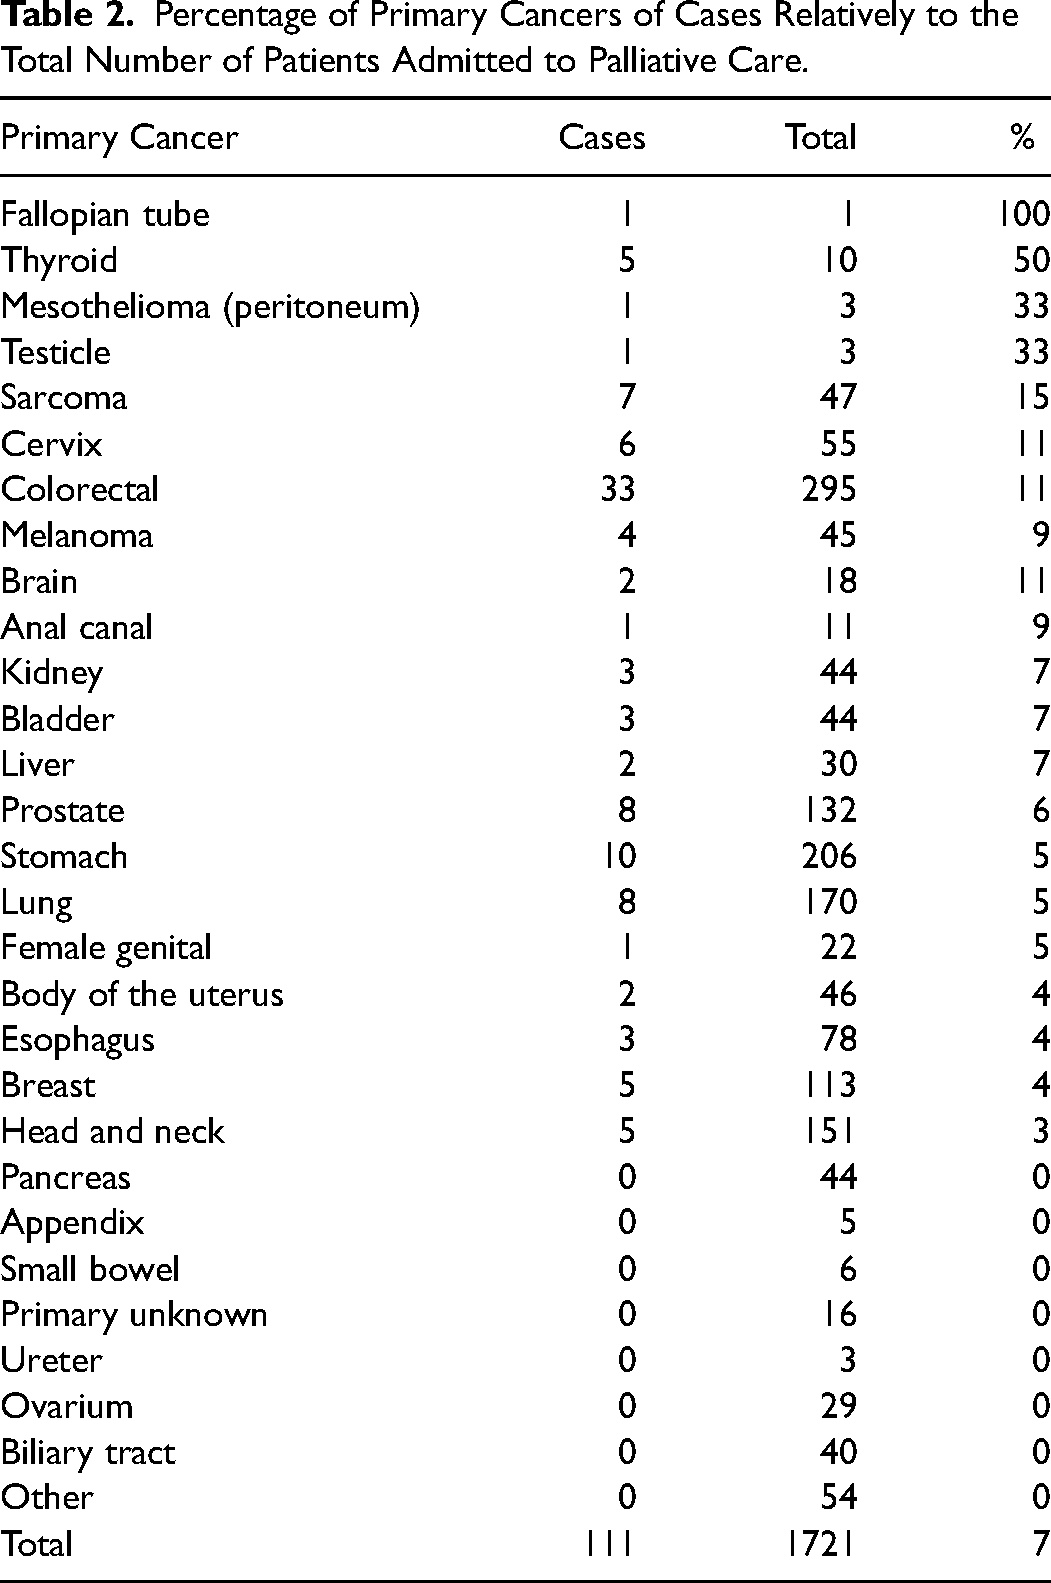
Table 2 shows the proportion of cases relative to the total number of patients identified in the study period. Some cancer types, such as pancreas, biliary ducts, and unknown primary, are not represented in cases.
Percentage of Primary Cancers of Cases Relatively to the Total Number of Patients Admitted to Palliative Care.
The results from the univariable analysis are presented in Tables 3A to 3D. The level of significance was calculated considering the number of variables, which was 24, using the Bonferroni correction. According to this correction, only variables with an adjusted P < .002 (0.05/24 = 0.002) were deemed significant. Therefore, only those variables were selected for the multivariable analysis. Of the general data, being observed for the first time as an inpatient, abnormal cognition, ECOG performance status higher than 1, and needing help for self-care were significantly associated with survival <6 months (Table 3A). Concerning the disease extension, liver metastases and the number of metastatic sites were significantly associated with controls (Table 3B). Several symptoms and problems were associated with a low probability of survival > 1 year, including pain, anorexia, nausea/vomiting, and the number of symptoms and other problems (Table 3C). Most available serum hematological and biochemical parameters, except potassium, lymphocytes, and platelets, were linked to survival (Table 3D).
Univariable Analysis by Logistic Regression—General Data.
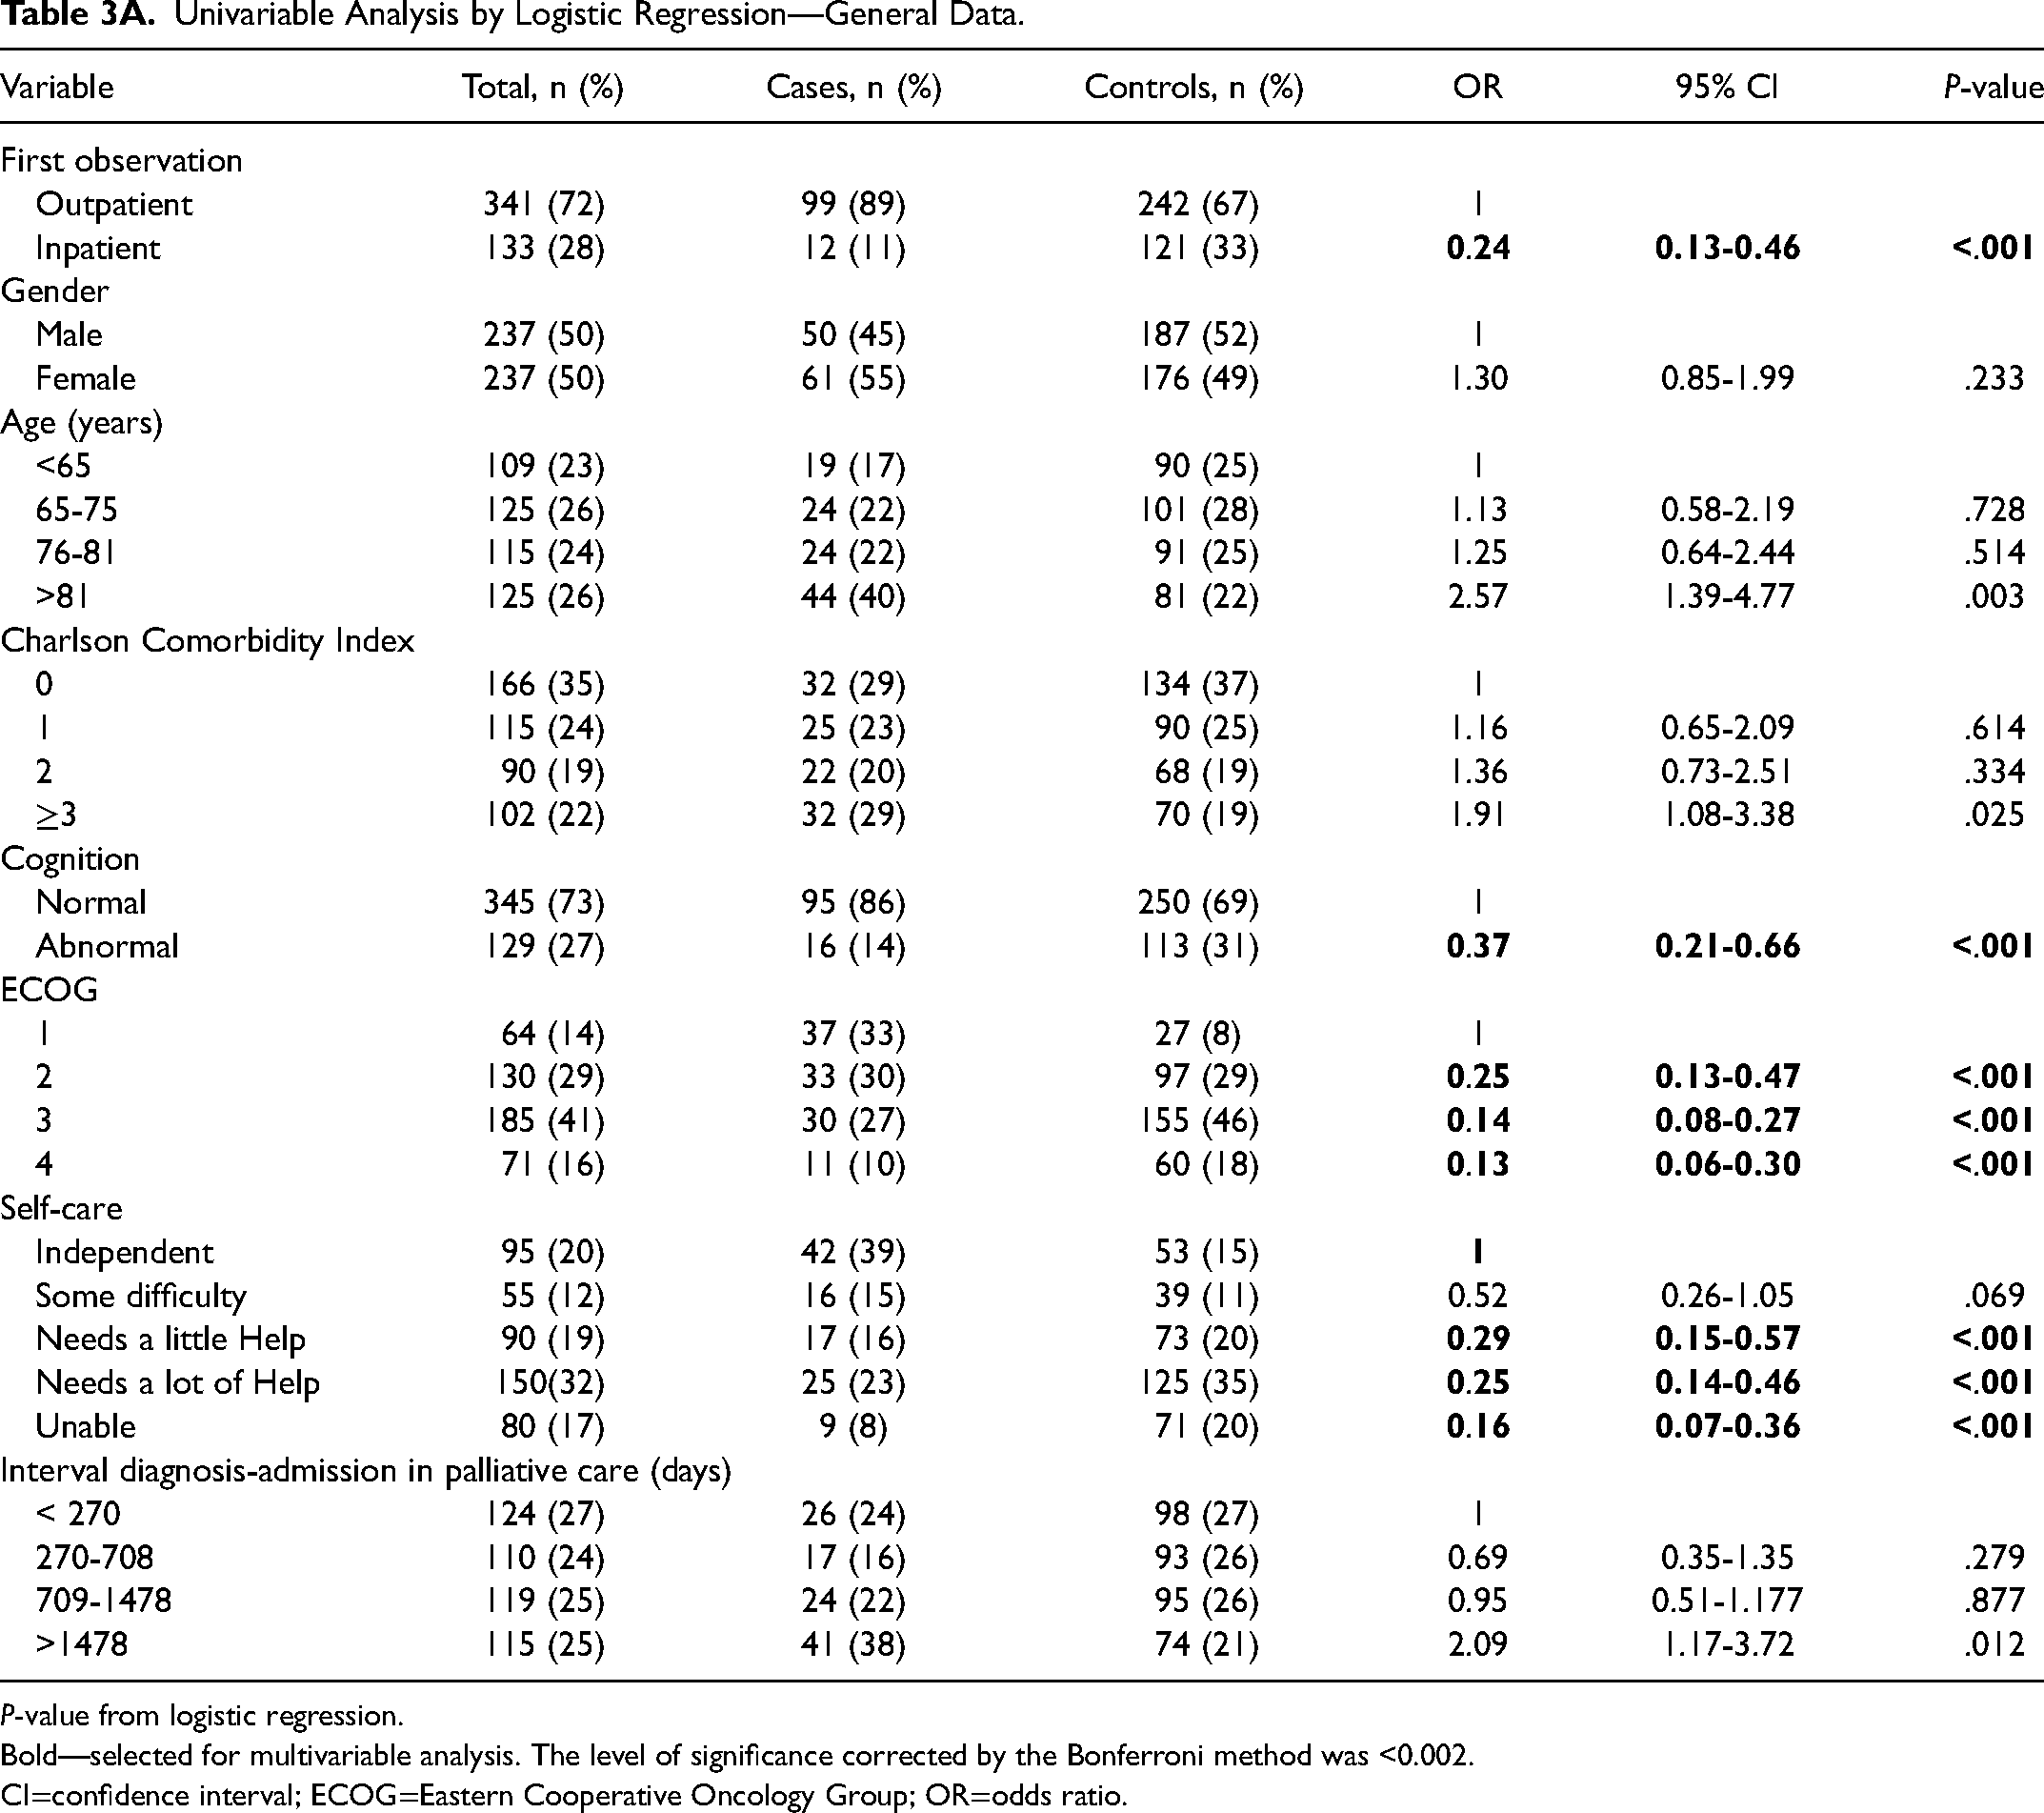
P-value from logistic regression.
Bold—selected for multivariable analysis. The level of significance corrected by the Bonferroni method was <0.002.
CI=confidence interval; ECOG=Eastern Cooperative Oncology Group; OR=odds ratio.
Univariable Analysis by Logistic Regression—Disease Extension.
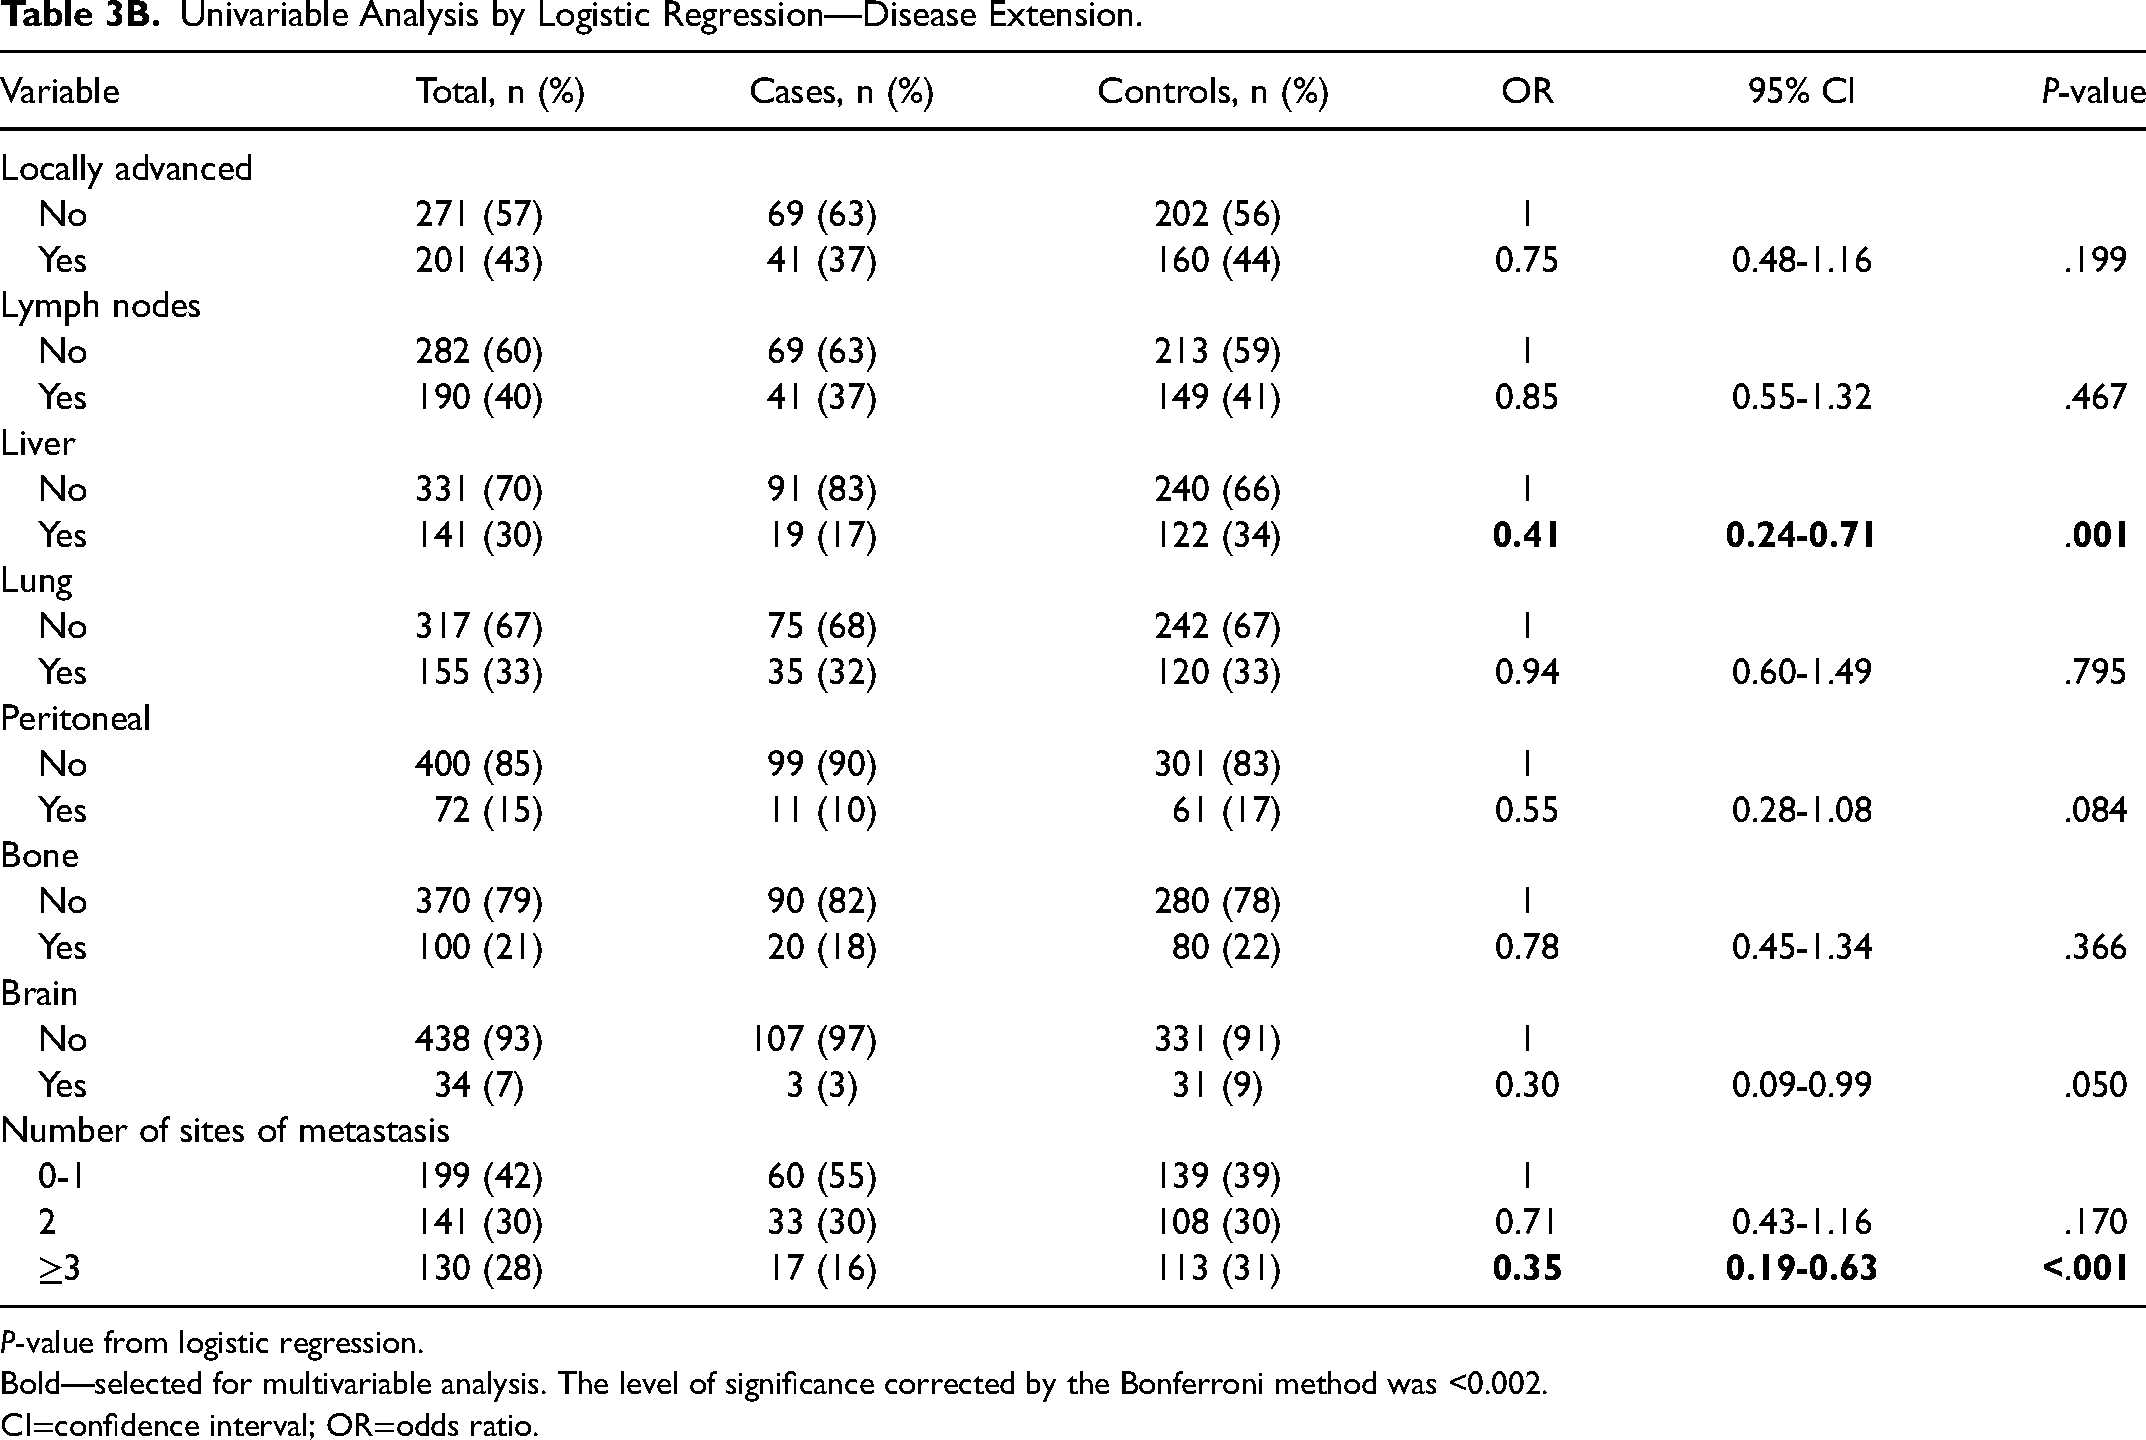
P-value from logistic regression.
Bold—selected for multivariable analysis. The level of significance corrected by the Bonferroni method was <0.002.
CI=confidence interval; OR=odds ratio.
Univariable Analysis by Logistic Regression—Symptom/Problems.
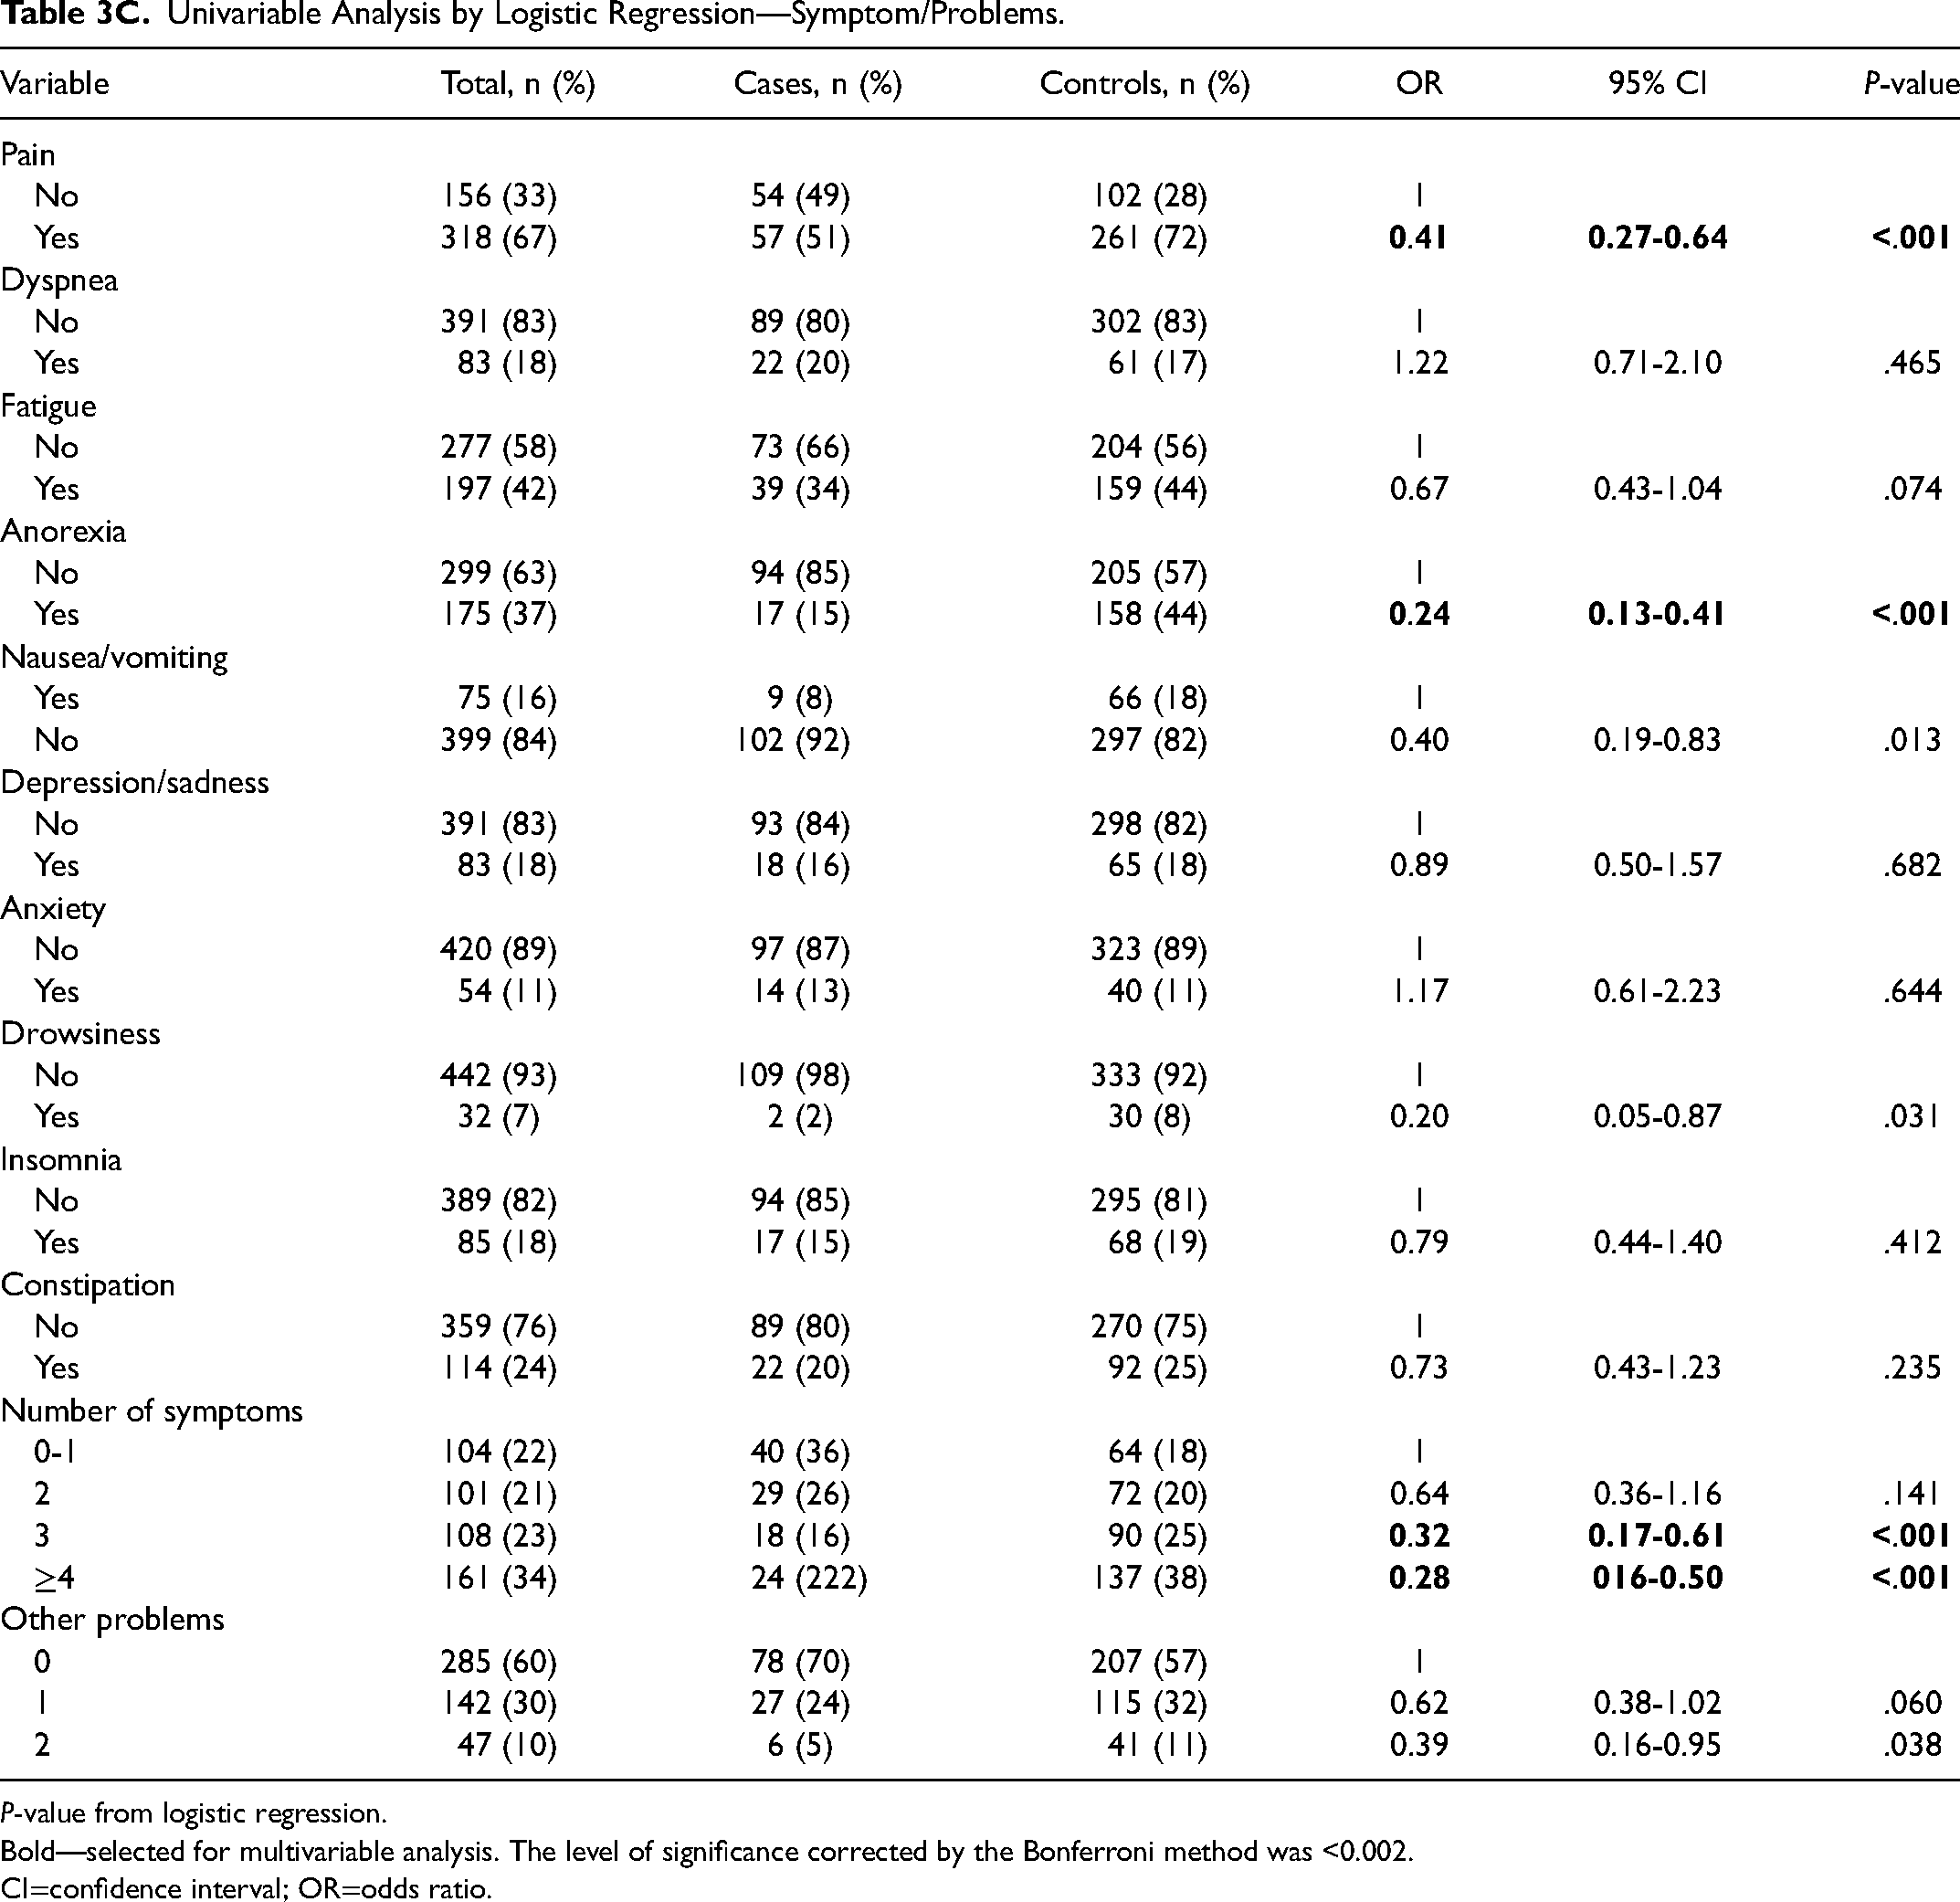
P-value from logistic regression.
Bold—selected for multivariable analysis. The level of significance corrected by the Bonferroni method was <0.002.
CI=confidence interval; OR=odds ratio.
Univariable Analysis by Logistic Regression—Serum Hematological and Biochemical Parameters.
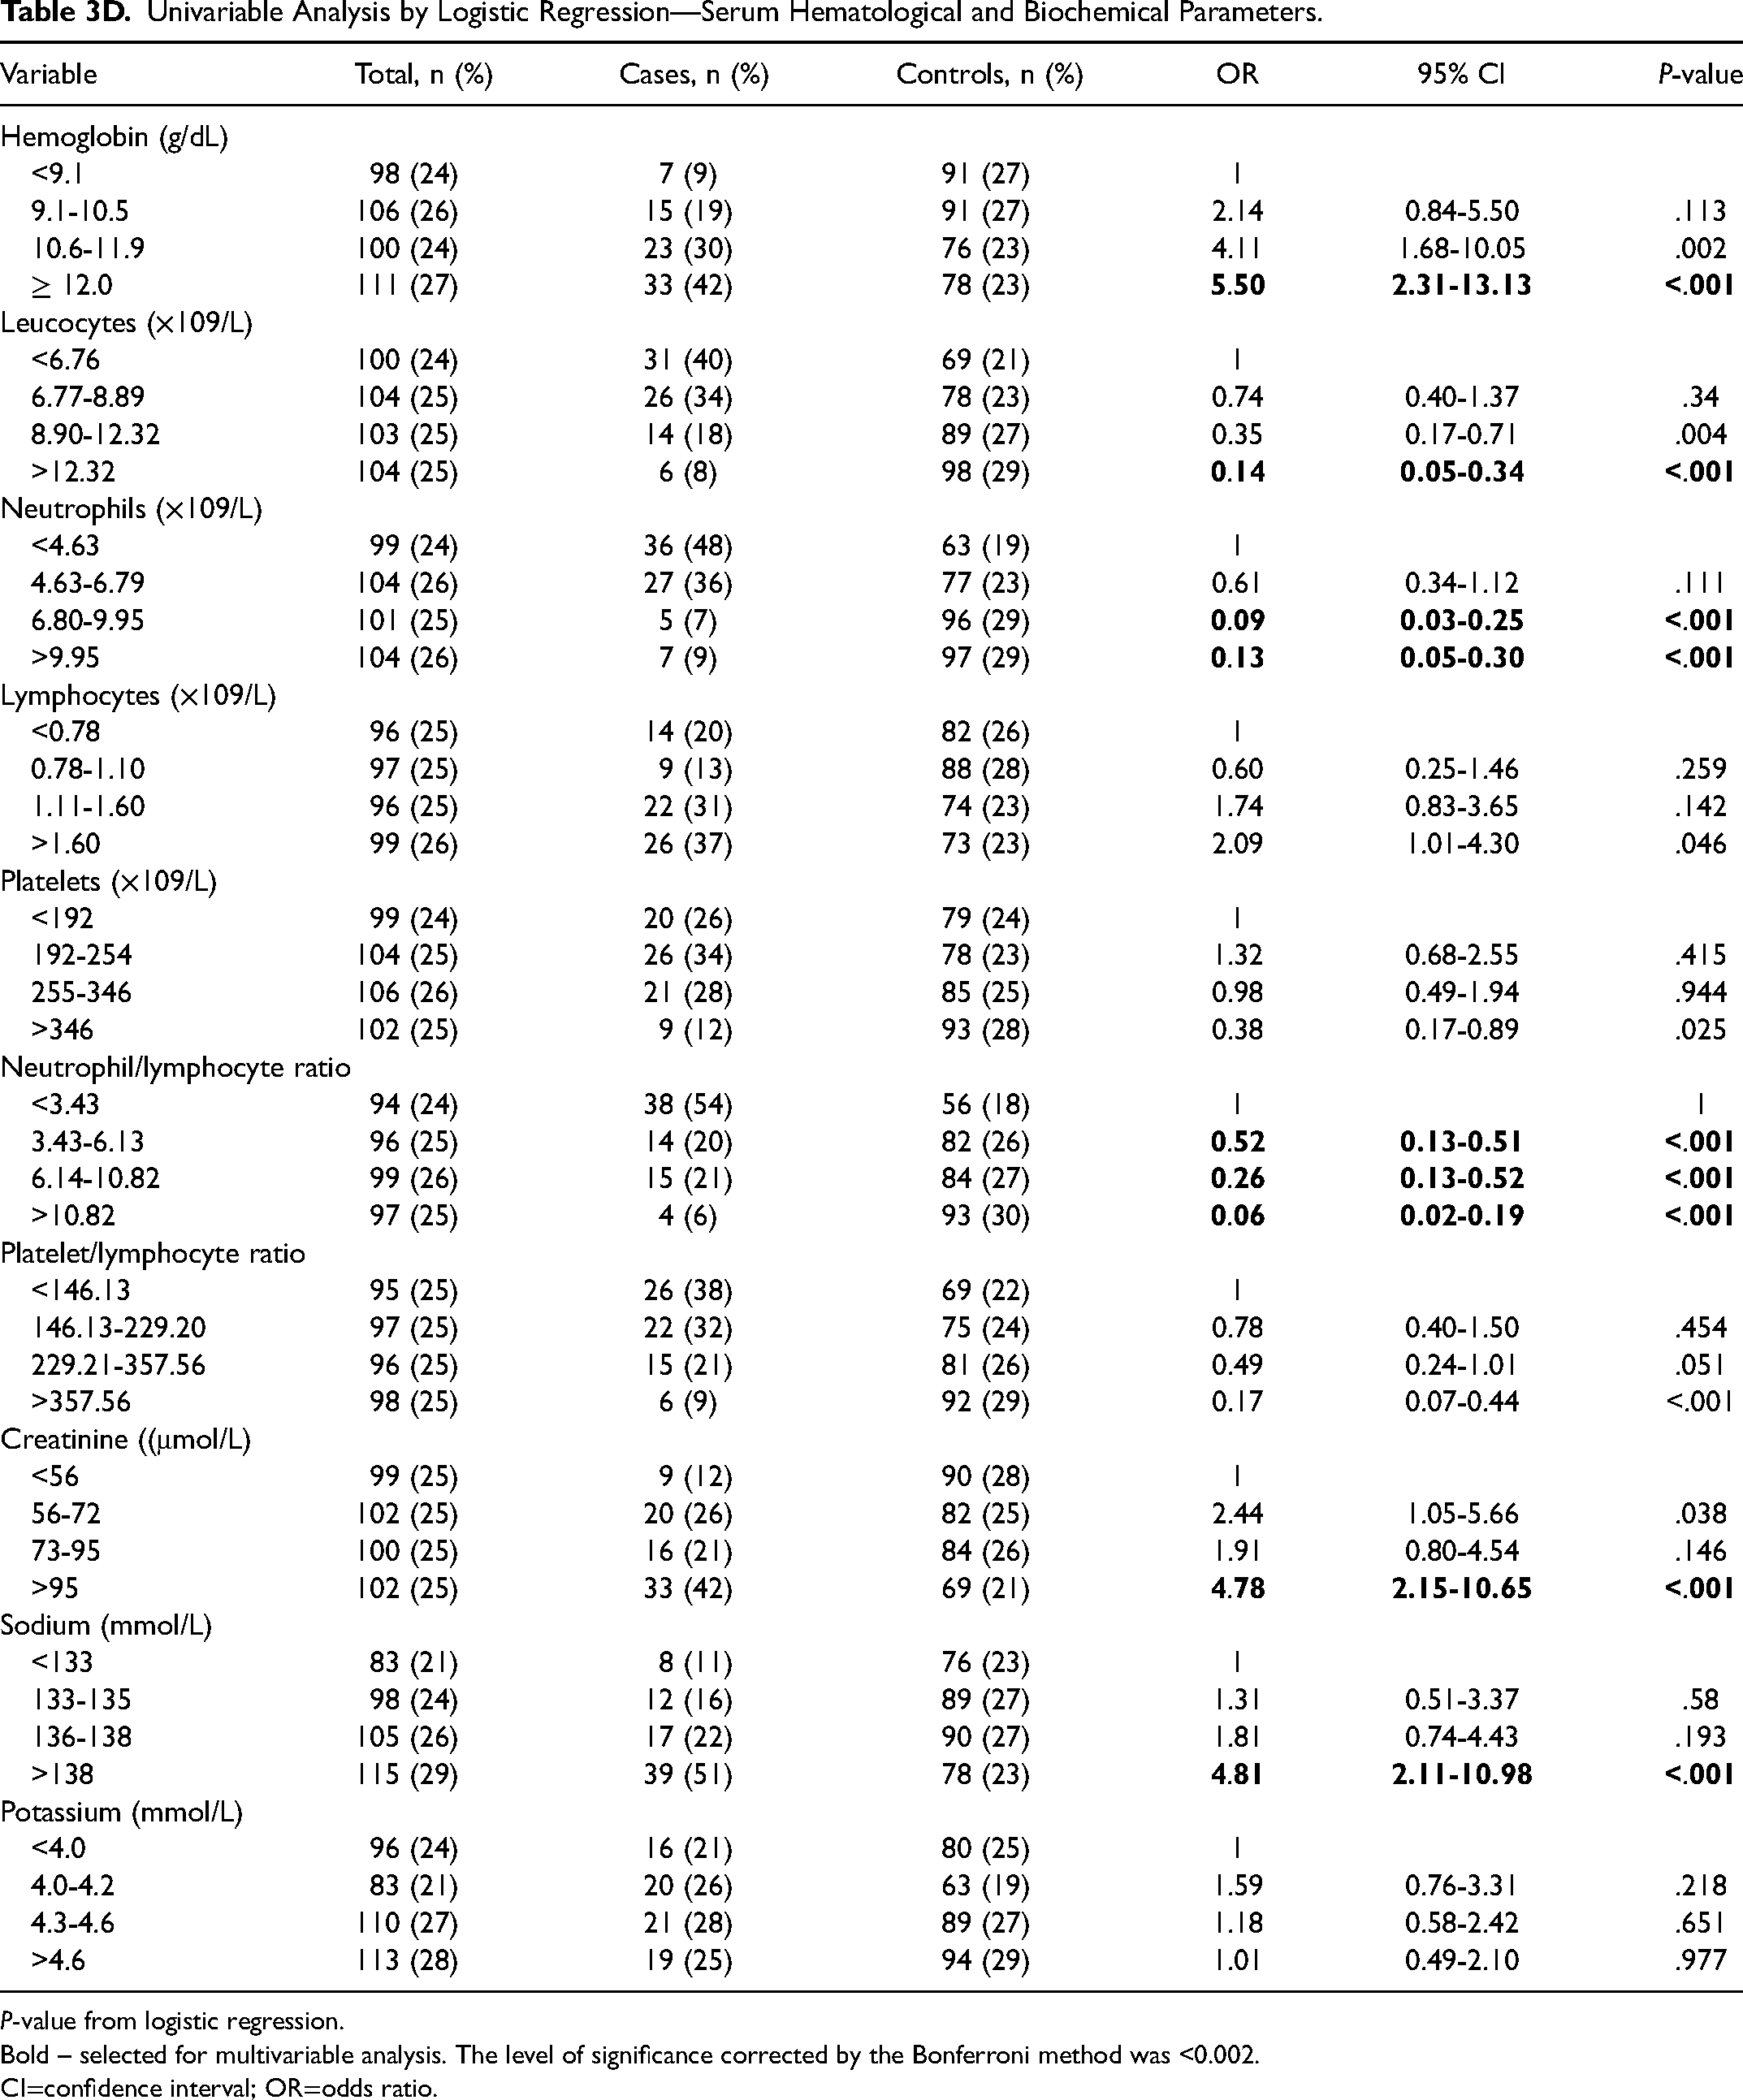
P-value from logistic regression.
Bold – selected for multivariable analysis. The level of significance corrected by the Bonferroni method was <0.002.
CI=confidence interval; OR=odds ratio.
In the multivariable analysis, by applying the Variance Inflation Factor for multicollinearity, the number of leucocytes was excluded due to the value >5. In the multivariable analysis, patients with a hemoglobin ≥ 10.6 g/dL and a creatinine level >95 µmol/L had a higher probability of living more than 1 year (Table 4). In contrast, patients with abnormal cognition, pain, anorexia, liver metastases, an ECOG performance status >1, and a neutrophil/lymphocyte ratio ≥ 3.43 had a low probability of living more than 1 year.
Multivariable Analysis by Logistic Regression.
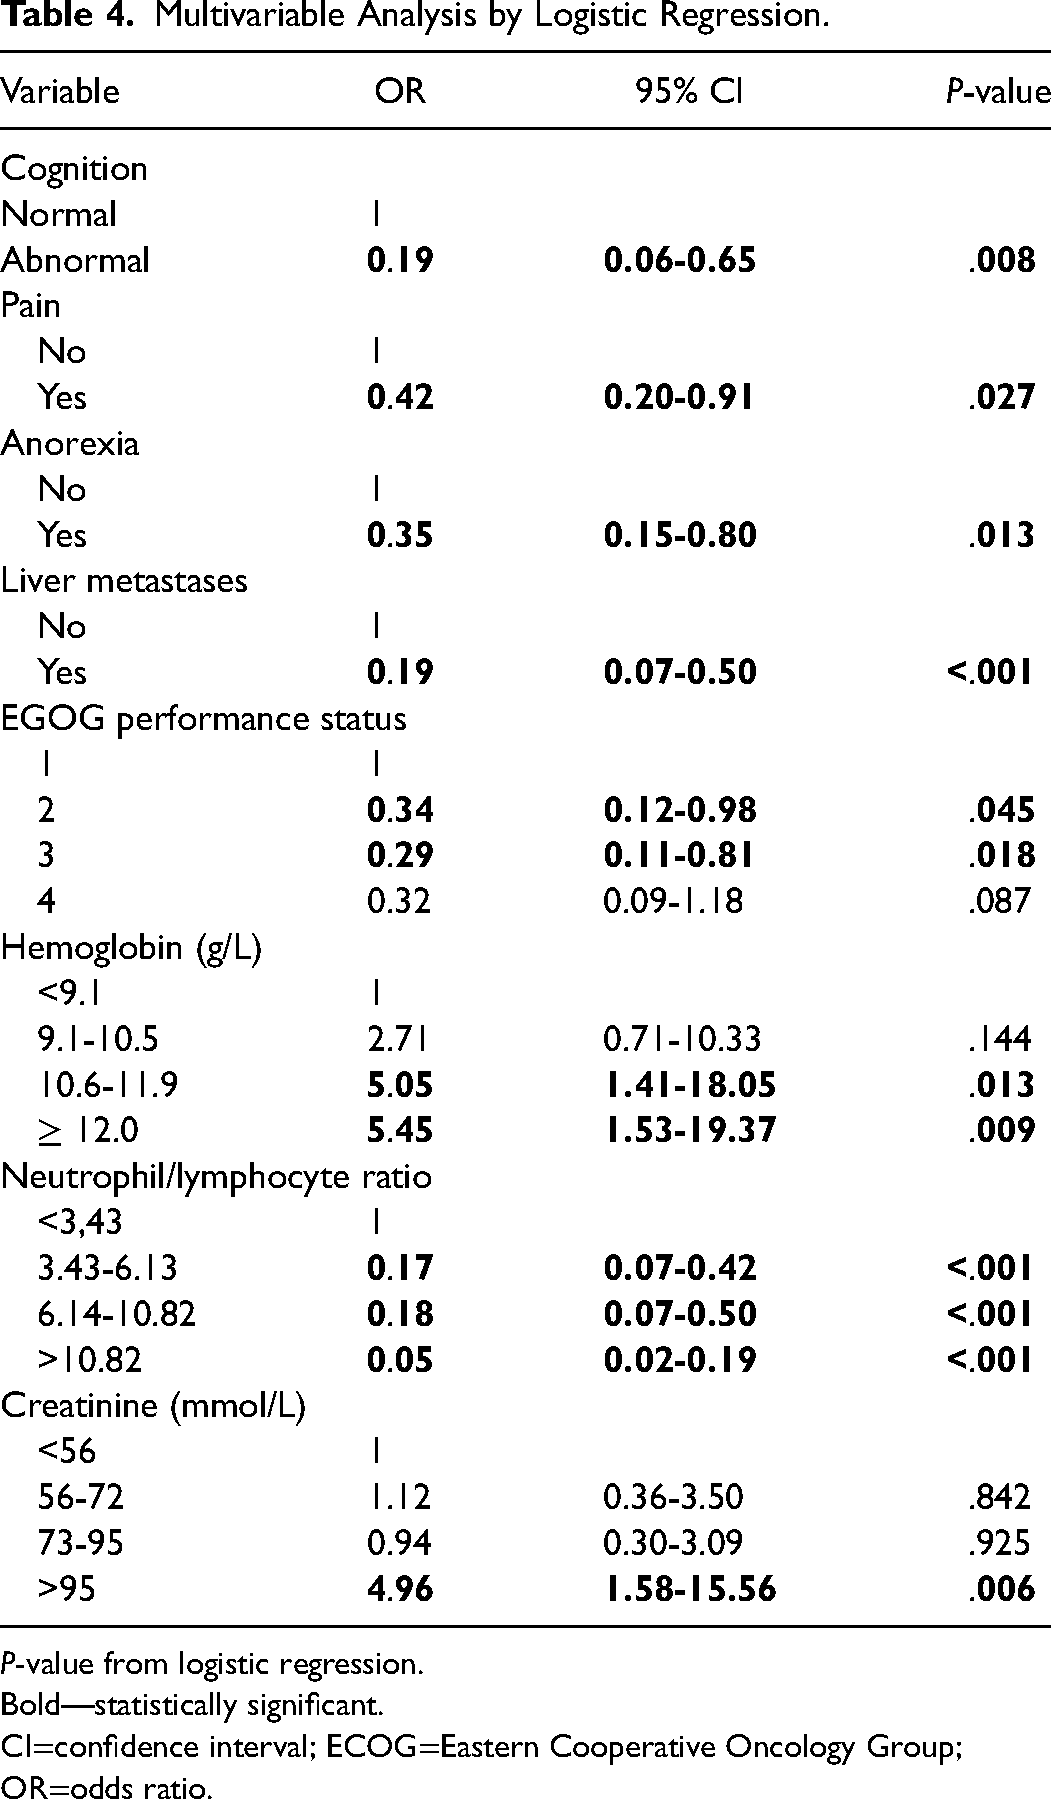
P-value from logistic regression.
Bold—statistically significant.
CI=confidence interval; ECOG=Eastern Cooperative Oncology Group; OR=odds ratio.
Discussion
Few studies report the number of patients surviving more than 1 year in palliative care, but there are a few examples, such as the study of Good et al, which reported 6.1%, 7 and the Christakis et al study, which registered 8.2%. 8 The percentage observed in this study of 6.4% was similar.
Many variables were associated with survival in the univariable analysis. The remaining elements in the multivariable analysis were cognition, pain, anorexia, liver metastases, ECOG performance status, the number of symptoms, the neutrophil count, the neutrophil/lymphocyte ratio, hemoglobin, and creatinine. Although cancer type could not be included in the multivariable analysis, it seems to be a critical factor, as some are not represented in patients with survival of more than 1 year. Therefore, the probability that a patient with one of those diagnoses survives more than 1 year after suspending antineoplastic treatments is very low.
The prognostic value of symptoms has been extensively studied in patients with advanced cancer with heterogeneous results. The most frequently evaluated symptoms were pain, anorexia, dyspnea, fatigue, nausea, and cachexia/weight loss. 9 In this study, only pain and anorexia were independent predictors of survival in the multivariable analysis. However, in most studies, pain was not a strong predictor of survival. 9 The association between symptoms and survival generally seems small (hazard ratios close to 1), except for physical function. 10
The performance status is a recognized important prognostic factor. The ECOG performance status scale is probably one of the most used in cancer, including advanced cancer.11–13 In this study, an ECOG score > 1 was negatively related to survival, as in other studies.10,11,13 The cognitive function also had a significant statistical association with survival, as patients with impaired cognition have a lower probability of living more than 1 year. The influence of cognition on prognosis is well known, 9 and cognitive failure is an independent predictor of survival, 9 as in this study.
The extension of the disease has a prognostic value. Metastases to the liver, brain, or viscera were associated with shorter survival and cancer bulk, such as the number of metastases, metastatic sites, or tumor volume. 14 In this study, liver metastases and the number of sites of metastases were associated with survival in the univariable analysis. However, only liver metastases remained statistically significant in the multivariable analysis. In a recent study that included a massive number of patients, liver metastases, even when present at the diagnosis, were associated with a median survival of only 4 months, with significant variations among different primary cancers. 15 Also, in a study on patients with cancer receiving hospice care in a hospital, liver metastases were an independent factor of poor survival. 16
A high neutrophil/lymphocyte ratio has a negative prognostic impact on survival, as tens of papers showed. However, there is also heterogeneity among the values considered as cut-offs. 17 In this study, values of 3.43 and higher were significantly associated with a lower probability of living more than 1 year than lower values. Elevated neutrophil/lymphocyte ratio is a marker of inflammation, indicating a poorer prognosis in patients with cancer. Most cases of cancer-related anemia also result from inflammation, 18 and anemia is recognized as an adverse prognostic factor in patients with cancer.19,20 According to those data, in this study, higher hemoglobin levels were associated with more prolonged survival.
A serum creatinine level >95 µmol/L was significantly associated with survival more prolonged than 1 year relative to lower values. Creatinine is generated in the skeletal muscle at a constant rate. 21 It depends on the muscle mass. Therefore, a low serum creatinine level reflects a poor nutritional status. Several studies have shown that a low creatinine level is associated with reduced survival. For example, a study showed that a low serum creatinine concentration at admission in hospitalized patients was associated with increased mortality. 22 In that study, the mortality associated with a very low creatinine value exceeded the mortality of a markedly increased creatinine value. Another study showed that low pre-operative serum creatinine is associated with poor outcomes after nonemergent inpatient surgery. 21
This study has several limitations related to its retrospective design. Only data recorded in the patients’ files could be retrieved. The data were not systematically collected, namely the symptoms. Also, some biochemical parameters that proved to have prognostic value could not be included in the analysis, such as albumin or reactive C-protein, which are markers of inflammation. Nevertheless, the statistically relevant factors make sense but should be confirmed in a prospective study. Also, the survival criterion for choosing controls may be criticized, but 6 months was considered in the definition of terminal cancer, 6 although presently, that time frame is not used anymore. 23 Nevertheless, for this study, it seemed to make sense to maintain that criterion to separate the 2 groups of patients; the intention was to define 2 groups of patients with clear survival differences, excluding possible differences of a few days in the survival of some patients.
Conclusion
The patients with cancer most likely to survive more than 1 year after admission to palliative care are those with mild or no anemia, a creatinine not low, with an ECOG performance status lower than 2, with normal cognition, without pain or anorexia nor liver metastases, and a low neutrophil/lymphocyte ratio. Cancer type may also influence survival.
Footnotes
Declaration of Conflicting Interests
The authors declared no potential conflicts of interest with respect to the research, authorship, and/or publication of this article.
Ethical Considerations
This study was approved by the hospital's Ethics Committee (Comissão de Ética para a Saúde—CES IPO: 337R/020).
Funding
The authors received no financial support for the research, authorship, and/or publication of this article.