
Abstract
In electoral sociology, the analysis of vote transfers has traditionally depended on individual data obtained from surveys. Because such data suffer from a significant amount of declaration and memory bias, replacing them with the electoral statistics available down to polling station level may be advantageous. Recent developments in models of ecological inference allow us to use these aggregated data to establish estimates of vote transfers while minimising the risk of ecological error. Nonetheless, the reliability of ecological inference models for estimating vote transfers has thus far received little attention in the form of empirical evaluations. The purpose of the present article is to cast light on this blind spot by analysing a model for predicting electoral volatility in a two-round election, namely the municipal election held in Montpellier in 2014. What makes this approach original is its use of observed information – the proportion of non-voters in both rounds – first to compare this data with the estimates produced by the model and then to integrate it as a modelling parameter to measure its impact on estimated vote allocation. This analysis reveals that the initial model's results are relatively reliable regarding the known parameter, although they slightly overestimate its amplitude and underestimate its variability. The model that integrates information regarding the proportion of consistent non-voters yields estimates close to those obtained using the “raw” model. In terms of interpretative capacity, the value added by integrating this additional information is, therefore, slight. However, integrating the information does make it possible to establish narrower density intervals, reducing the uncertainty associated with the interpretation of the other parameters, particularly proportions associated with candidates who received few votes in the first round.
Winner of the Michelat Award 2023
Introduction
In electoral analysis, studying local politics often requires working with aggregated data rather than raw polling data. Nevertheless, it is by now well-established that using aggregated data restricts the scope of the conclusions to be drawn from such analyses about the behaviour of the individuals who make up the collective units for whom data are available (Robinson, 1950). Since the risk of ecological error has been clearly established, various researchers have proposed statistical solutions that might nonetheless allow for analysis by ecological inference. Among these methods, that proposed by King (1997) and further developed by Rosen et al. (2001) has been the subject of much controversy over the past two decades and more (Freedman et al., 1998) but is now generally regarded as the most reliable method of ecological inference. However, this model has been subjected to relatively few empirical evaluations, particularly when applied to cases with numerous parameters needing estimation. Moreover, the use of this model remains relatively limited in electoral sociology, especially in France.
This article aims to implement and evaluate this method of ecological inference by analysing vote transfers in a two-round election, specifically, the 2014 municipal election held in the French city of Montpellier. Held every six years, French municipal elections in cities with more than 1,000 residents 1 use a proportional, two-round voting system, with a majority bonus for the list of candidates that comes out on top. In this system, only lists of candidates who receive at least 10% of votes cast in the first round progress to the second ballot. However, any list which receives at least 5% of votes cast in the first round can merge with one of the lists qualified for the second round. In this context, analysing electoral volatility between the first and second rounds is particularly valuable at a time when, in France as elsewhere, the proliferation of non-partisan lists and the restructuring of familiar political landscapes and divisions can sometimes result in the formation of unexpected alliances (Audemard et al., 2023).
Analysing vote transfers is crucial in electoral sociology if we wish to explore issues such as electoral volatility (Dassonneville and Hooghe, 2017), partisan identities, and the reconfiguration of divisions and systems of partisan alliances (Best, 2011; Clark and Lipset, 1991). However, such analysis is limited because it generally relies upon declarative data, whose accuracy we have every reason to question. Ecological inference raises the prospect of overcoming this declarative pitfall in so far as this method is founded upon factual data: the number of individuals choosing each of the available voting options in both rounds of the election at the polling station level. Since these data only allow to measure the quantities of interest – the number of votes transferred from one list of candidates to another between the two rounds – in an indirect and probabilistic manner, the potential of ecological inference to shed further light on inter-round vote transfers must be assessed through comparison with observed data. The first advantage of testing ecological inference on the example of a two-round election is that we can include existing information, in this case, the proportion of consistent non-voters. Such is the purpose of the present article, where I propose to compare an initial, “raw” model with a consolidated model which incorporates, for each polling station, the proportion of voters who abstained from voting in both rounds of the election. This proportion of consistent non-voters is the only data point estimated by the initial model that we can actually measure in the case of a two-round election, making it a crucial resource for assessing the accuracy of our statistical models.
The other advantage of this approach is that it allows us to observe what effect the integration of observation data into the statistical model has on the estimation of other parameters. This is another critical issue that touches upon the reliability of this ecological inference model and the value added by empirical research effort, which can be exceptionally costly. 2
This article is divided into three sections. In the first section, I introduce the problem of ecological inference and the solution proposed by King and colleagues. In the second section, I discuss the use of applied ecological inference to analyse vote transfers, then describe the specific case studied in this article, namely the municipal elections held in Montpellier in 2014. Finally, I present the results obtained using both models – a “raw” model and a model integrating the actual proportions for consistent non-voters – and discuss the quality of the estimates obtained and the impact of integrating this additional information.
The problem of ecological inference
Ecological inference is a method used in various fields of the social sciences, including demographics, public health, economics, political sociology, and history. It consists of deducing individual behaviour or, more appropriately, the relationships between individual variables, based on aggregated data. In many cases, researchers cannot access individual data, or else the individual data available are partial or unreliable. Nowadays, thanks to advances in digital technology, researchers have access to an extensive range of data from public statistics. They tend to be highly reliable and are gathered at various administrative scales. In France, they range from the “grid data” used by the INSEE to the much larger regional level, as well as “aggregated units for statistical information” (IRISes), polling stations and a multitude of administrative zoning systems (school catchment areas, priority urban development areas etc.). 3 Even when gathered at a very granular level, these data remain aggregated data: they compile information concerning multiple individuals in order to provide insight into the characteristics of collective units such as neighbourhoods, cities or electoral constituencies (Boudon and Lazarsfeld, 1966). However, it has been well known since the pioneering work of Selvin (1958), and especially since the famous article published by William Robinson (1950), that inferring individual behaviour from aggregated data can lead to significant interpretation errors. The example given by Robinson concerns the relationship between immigration and illiteracy: observation of the data from the 1930 U.S. Census revealed a negative correlation – at the state level – between the rate of illiteracy and the proportion of the population born overseas. In other words, on the basis of these results, it was possible to conclude that one's nation of birth did not determine illiteracy and, furthermore, that immigrants were less likely to be illiterate than people born in the United States. This example perfectly illustrates the mechanics of ecological inference: using aggregate data to deduce a conclusion which appears to be valid for individuals.
Nevertheless, conducting the same analysis at the individual level yielded the very opposite result: this time, the correlation between immigration and illiteracy was positive; the rate of illiteracy was higher among immigrants than it was among those born in the U.S.A. How can we account for this discrepancy? This is what we call an aggregation effect: although immigrants were indeed more proportionally prone to illiteracy, they tended to settle in the most economically developed states, where the illiteracy rate was lower than elsewhere.
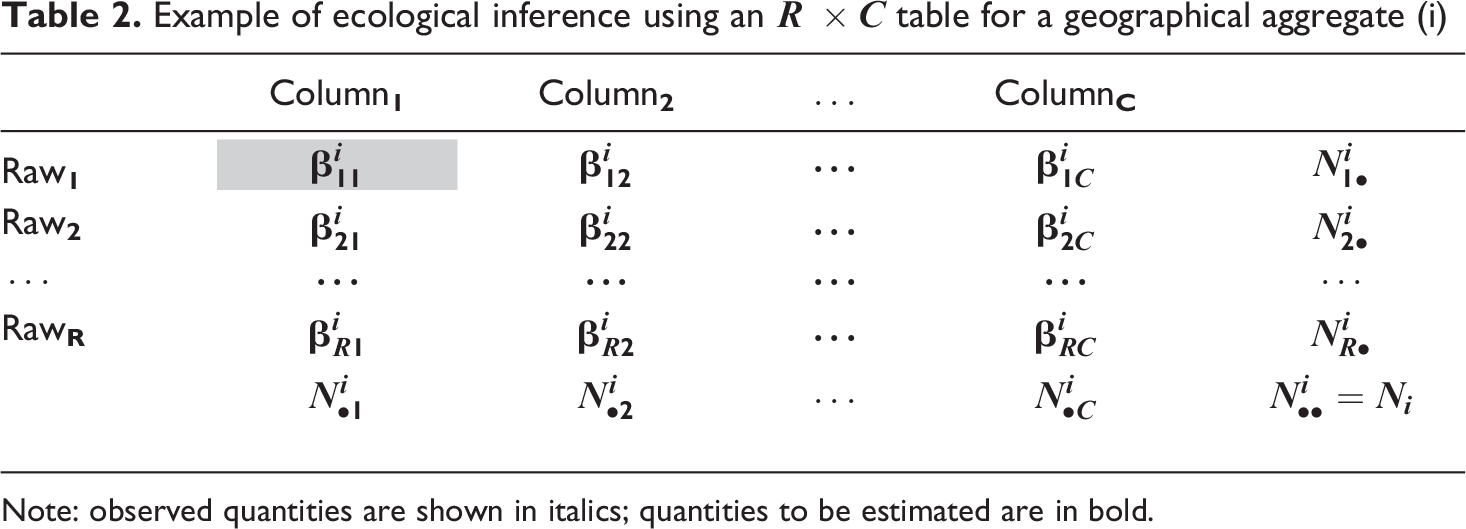
To summarise the problem of ecological inference, consider the Table I.
Ecological inference in a
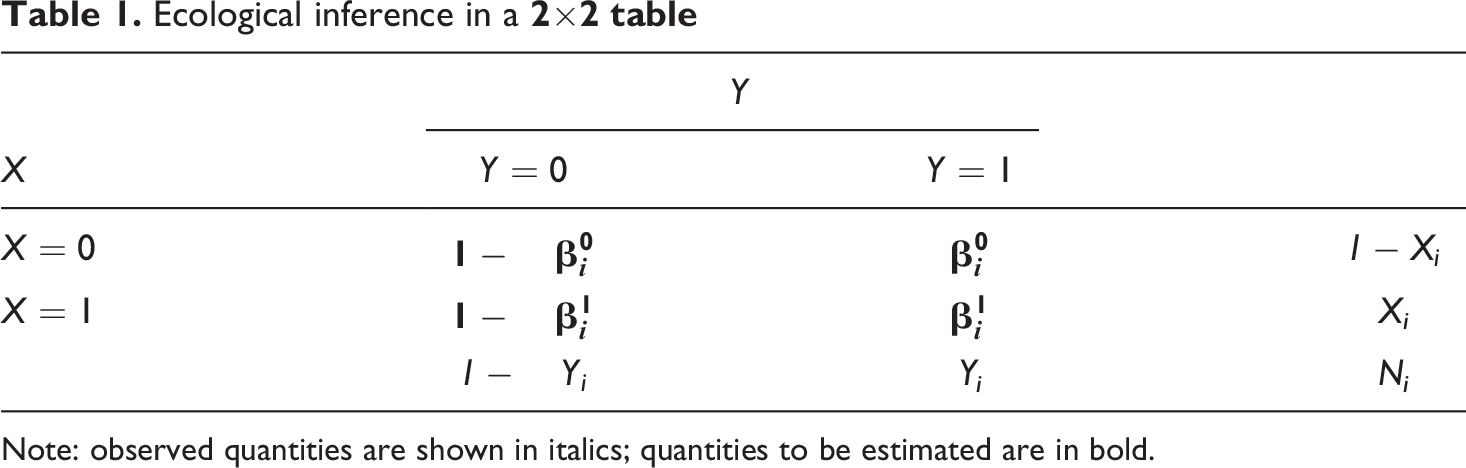
Note: observed quantities are shown in italics; quantities to be estimated are in bold.
Imagine that, for a territory i, we have two observed variables Xi
and Yi
along with a number Ni
for the population of interest within i. These observed quantities, the only ones of which we have firm knowledge, are, in fact, marginal quantities
4
derived from aggregated information: for example, the number of immigrant and illiterate people in a given American state – as in Robinson’s example – or the numbers of working-class people and the number of votes received by left-wing parties in a given constituency– to use an example which more closely resembles the subject of the present article. Parameters
Three main methods have been developed to counteract the problem of ecological error. The first is that proposed by Duncan and Davis (1953), a deterministic method usually referred to as the “method of bounds”, which allows for the simple calculation of precise intervals encompassing the quantities of interest. If we accept that
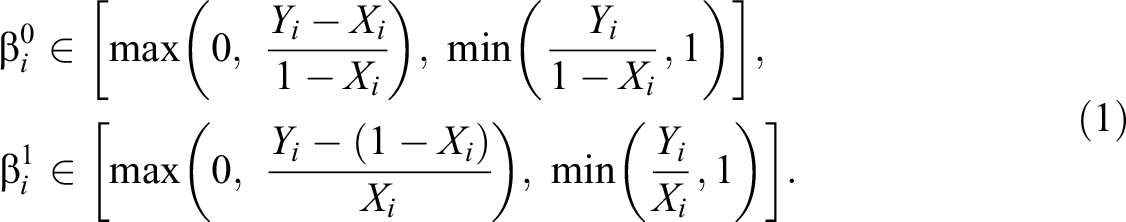
Of course, this method does not permit to directly estimate the values of the parameters we are interested to know. For example, consider the case of a neighbourhood with an adult population of 2,000, half of whom are workers (Xi
). Now imagine that we also know that, in the most recent elections, 500 voters supported a left-wing party (Yi
). Using the method of bounds, we estimate the proportion of workers voting to the left (
Goodman (1953; 1959) later developed a probabilistic estimation method, generally known as the “ecological regression” model. Goodman’s approach focuses on the variations of marginal quantities within each unit, representing the correlation between these quantities using a linear regression:

This relation holds up if the estimated parameters are independent of Xi , i.e. if they are constant in all units. In practice, this is rarely the case because of contextual effects: factors specific to the environments in which individuals live tend to influence their behaviour, especially when it comes to voting (Huckfeldt, 1986). We might suppose, for example, that workers are more likely to vote to the left in environments with a high proportion of workers (Klatzmann, 1981). Contextual factors mean that ecological regression generally yields biased estimates, which not only stray beyond the limits of the deterministic bounds but are sometimes outside the unit interval.
The solution proposed by Gary King (1997) draws upon both of these methods. Using Goodman’s equation (2), King determines that:
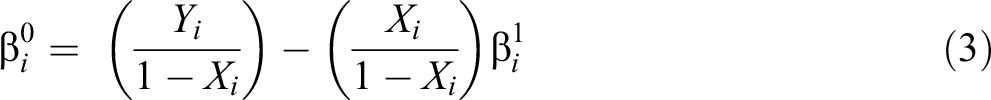
The linear relation between the two unknown quantities in this equation (3) allows us to plot “tomographic” lines representing all of the possibilities capable of containing the true values of
King’s method thus has numerous advantages not offered by either the bounds method or ecological regression, not least the fact that its flexible conditions make it applicable to a large number of cases. Furthermore, the extension of this model into a Bayesian multilevel model by King, Rosen and Tanner (1999) means that it can also be applied to
The model proposed by Rosen et al. (2001) involves two steps. In the first, we posit the hypothesis that the vector for the marginal quantities in each column Ci follows the multinomial distribution:

In step two, we posit that the vectors for the proportions

The parameters α follow a Gamma distribution:
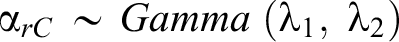
Where
Like the initial model proposed by King (1997), the model developed by Rosen et al. (2001) allows for the inclusion of covariables. The posterior distribution can be estimated for each parameter using the Markov Chain Monte Carlo method (MCMC).
Integrating additional information
Over the years, the ecological inference methods developed by King and his teams have been subjected to many empirical tests. Several studies rapidly pointed out the limitations of the approach (Anselin and Tam Cho, 2002; Herron and Shotts, 2003), highlighting the lack of information regarding the reliability of the estimates obtained or the conditions which would need to be met for considering them to be reliable (Freedman et al., 1998). These conditions have since been defined in greater detail, particularly by Voss (2004). Estimates obtained through this method, and using ecological inference more broadly, are always more reliable when 1) the groups or behaviours being studied are numerous within the units under consideration, 2) empirical data are plentiful, 3) inter-group variation is greater than intra-group variation, 4) the variations observed in group behaviour are not dependent on group density or other essential factors specific to those units, but are instead random, and 5) researchers have a sufficiently detailed understanding of the subject and spatial context they are studying, allowing them to identify contextual influence factors and anomalous results.
Nevertheless, few existing articles have tested the reliability of this method of estimation when applied to
Using data about elections of this type, Plescia and De Sio (2018) seek to evaluate the reliability of the estimates obtained from models of ecological inference – specifically, the models developed by Goodman (1953), Rosen et al. (2001) and Greiner and Quinn (2009). The authors focus on four elections held in New Zealand (2002, 2005 and 2008) and Scotland (2007), chosen for a good reason: the results of these ballots, conducted using mixed electoral methods, have been published in a form which enables us to ascertain the exact number of split tickets. This allowed Plescia and De Sio to accurately evaluate the quality of the results obtained using each model. Their analysis reveals that the method proposed by Rosen et al. (2001) is the most effective of the three, and yet, in most cases, the actual values lay outside the confidence intervals yielded by all three methods. The conclusions reached by the authors are consistent with those reached by previous studies: estimates are more accurate 1) for those parties who receive the most votes, i.e. predictions are more reliable for “big” parties than they are for “small” parties; 2) when the ratio of “number of units” by “number of parameters to be estimated” is higher, and 3) when the variance in quantities observed from one unit to the next is low.
Although Plescia and De Sio use the additional information at their disposal to assess the quality of their estimates, they do not discuss ways in which taking this information into account could improve inference. However, this possibility was built into the model by King himself (1997) since it allows for integrating additional contextual variables. On top of the contribution made by these additional variables, it is also reasonable to assume that integrating a frequency parameter whose value is known, in addition to the marginal quantities, will also impact the resulting estimates. In the model proposed by Rosen et al. (2001), the parameters to be estimated are not independent of one another but, in fact, share the same distribution. The contribution proposed by the present article is to analyse the effects of incorporating additional information into the ecological inference model developed by King and his team, with reference to a recurring theme of electoral sociology, namely the issue of vote transfers between the two rounds of polling in run-off election systems.
Vote transfers
Although electoral volatility is a longstanding preoccupation of electoral sociology (Dassonneville and Hooghe, 2017), few existing studies have used ecological inference models to vote transfers. The reason for this is fairly simple: in the English-speaking world, the most commonly employed electoral system is a single round of voting. As such, the existing English-language literature on electoral volatility has focused mainly on shifts in voting patterns between elections. It is challenging to apply ecological inference to such analyses because of fluctuations in the boundaries of electoral constituencies, and turnover on the electoral rolls. In other contexts – in France, for example – the preferred electoral system is a two-round run-off system. In such systems, the use of ecological inference is justified in so far as the units observed – polling stations, for example – are unchanged between the first and second rounds of voting, as are the electoral populations they serve. Ecological inference is all the more pertinent in such contexts because survey data capable of illuminating the issue of vote transfers are generally of very poor quality. This poor quality can be attributed not only to the fact that most surveys are conducted on a national scale – although local variables play a fundamental role in electoral volatility in all elections which are not national in their scope (Foucault and Chiche, 2015) – but also to the well-known problems of declaration (Liao, 2016) and memory biases (van Elsas et al., 2014) which affect such surveys.
In France, only recently have ecological inference models been used to investigate the phenomenon of vote transfers. 5 This is somewhat surprising since it would appear to be an ideal subject matter for ecological inference.
In Table 2, each line corresponds to a choice available to voters in the first round: to abstain, to submit a spoiled or empty ballot, or to vote for a candidate or party. Each column corresponds to one of the choices available in the second round. The published results of this election allow us to ascertain the marginal quantities for this table, more precisely the number of individuals selecting each option in the first and the second round, along with the total number of individuals Ni , i.e. the number of voters on the electoral roll for each polling station i. The parameters to be estimated correspond to the cells of the table, i.e. the proportions associated with each option. 6 These values must necessarily fall within the unit interval, and the sum of the cells in each line must be equal to 1.
Example of ecological inference using an
Note: observed quantities are shown in italics; quantities to be estimated are in bold.
Using this table, we can apply the Rosen et al. (2001) ecological inference model described above. In this model, we shall use the smallest units for which electoral data are available, i.e. polling stations.
Looking at the electoral rolls – and the records of those who actually voted on the election days – allows one to obtain a detailed picture of turn-out in both rounds. For each polling station, we are thus able to obtain four key values: the proportion of voters who voted in both rounds of the election (marked P.P.), the proportion of voters who abstained from voting in both rounds of the election (A.A.), the proportion of voters who voted in the first round but not the second (P.A.), and the proportion of voters who did not vote in the first round but did turn out for the second (A.P.). The proportion A.A. is of particular interest for ecological inference because it corresponds directly to one of the cells in Table 2, the parameter
Information regarding proportion A.A. can be directly integrated into the model developed by Rosen et al. (2001). Running this model in the R software program using the “ei” package (King and Roberts, 2012; King, 2004) allows us to define the prior distributions from which the parameters can be estimated. For example, it becomes possible to define the initial values of parameters
The example of the 2014 municipal elections in Montpellier
With a population of approximately 300,000, Montpellier is the seventh most populous city in France. It is located in the Hérault département, on the south coast. Historically, this département has been a stronghold for the left, particularly the Parti Socialiste (P.S.). Montpellier elected a socialist mayor in 1977, and since then, no right-wing candidate has ever been elected to city hall. Nevertheless, after the longstanding hegemony of Georges Frêche came to an end (Frêche was the Socialist mayor of Montpellier from 1977 until 2004, then President of the Languedoc-Roussillon Region from 2004 until he died in 2010), Montpellier’s political landscape became more fragmented.
In the municipal elections of 2014, the list of candidates led by Philippe Saurel (Non-affiliated, thereafter N.I.) emerged victorious from a four-way run-off 7 in the second round. Philippe Saurel had previously served as a deputy to the Socialist mayor Hélène Mandroux 8 and, since 1998, had sat on the Hérault departmental council as the P.S. councillor for the third canton, encompassing the eastern districts of the city of Montpellier. He declared his intention to run for mayor in 2014 as early as 2010 and declined to participate in the P.S. primaries, which nominated Jean-Pierre Moure as the official Socialist candidate. As a result, Saurel was expelled from the Socialist Party. During the 2014 campaign, he opted for a non-partisan strategy while maintaining his left-wing affiliations.
Philippe Saurel’s list finished second in the first round (22.9%), behind the official Socialist list (25.3%) but ahead of the centre-right U.M.P. (Union pour un Mouvement Populaire, the leading French right party, that became in 2016 Les Républicains) list (22.7%) led by Jacques Domergue, former member of parliament for the second (2007-2012) and first (2002-2007) constituencies of’’Hérault, and finally the F.N. (Front National, the far-right movement became in 2018 the Rassemblement National) list (13.8%) led by France Jamet, scion of a local family which has long been prominent in far-right circles. Thanks to a spectacular performance in the second round (37.5%), the list led by Saurel emerged victorious, while the other lists saw their shares of the vote stagnate or even shrink (P.S.: 27.4%; U.M.P.: 25.9%; F.N.: 9.2%).
As we can see from the results presented in Table 3, Saurel’s victory was mainly due to a spectacular increase in the number of votes he received in the second round (+78 %). The P.S. list led by Moure had, however, been regarded as the favourite to win in the months leading up to the election. J-P Moure himself had a prominent reputation locally, being the current President of the Montpellier Urban Community and Mayor of Cournonsec since 1986 (a municipality with a population of 3,000 in the suburbs of Montpellier).
Results of the 2014 municipal elections in Montpellier
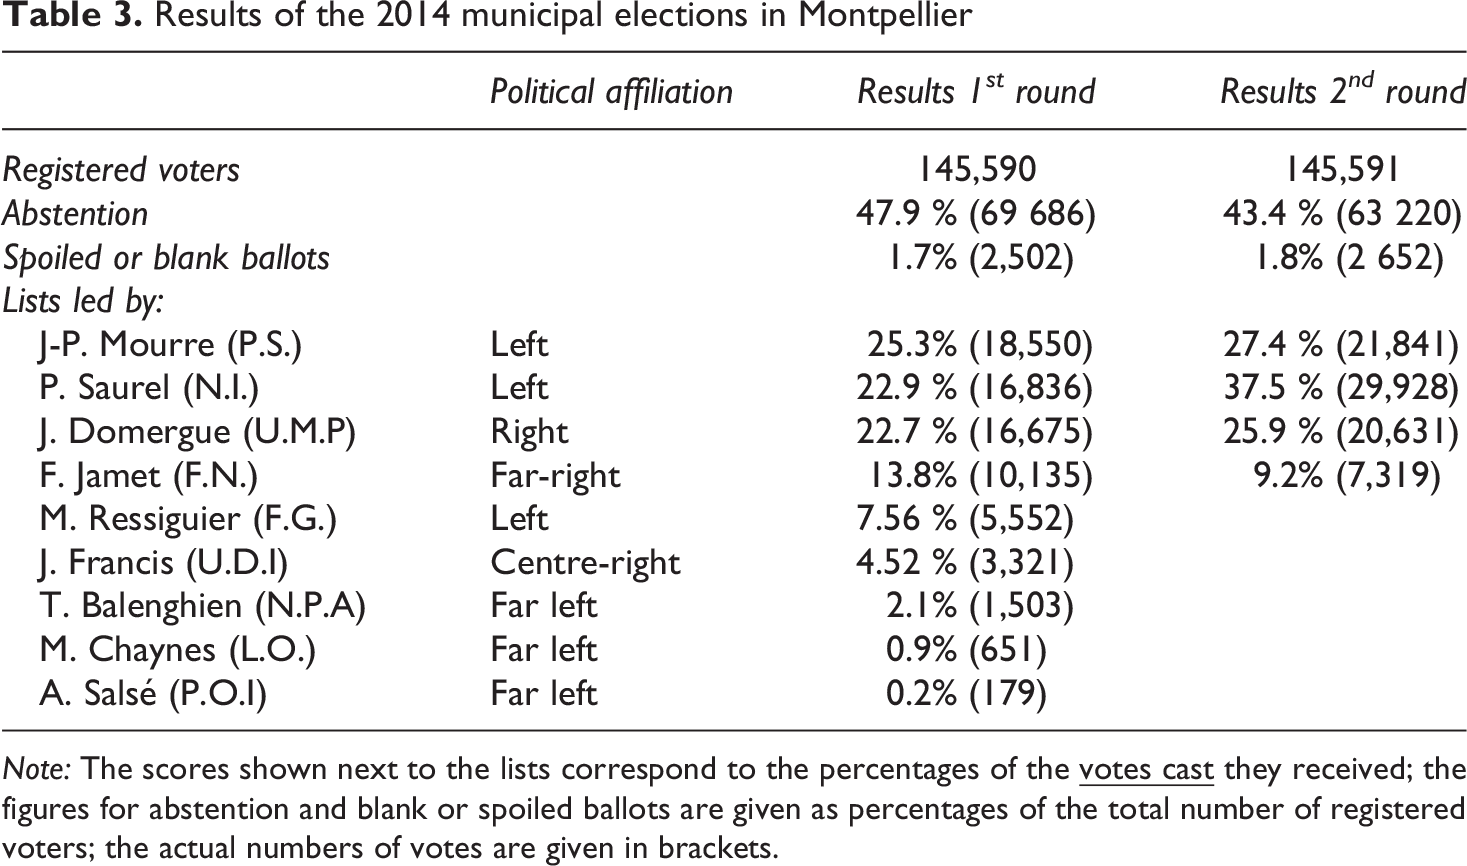
Note: The scores shown next to the lists correspond to the percentages of the
Above and beyond questions of methodology, the 2014 municipal elections in Montpellier are interesting for several reasons. Firstly because of Saurel’s victory, and the spectacular surge in his support between the first and second rounds; more broadly, this result presaged the victories secured by many “non-partisan” lists in the municipal elections of 2020 (Gourgues, Lebrou, Sainty, 2020; Audemard, Gouard, Huc, 2021), and the collapse in support for the old parties of government, heralded by the election of Emmanuel Macron as President of the French Republic (Dolez, Fretel, Lefebvre, 2019).
In 2014, the city of Montpellier was served by 131 polling stations, with an average of 1,111 registered voters for each station, although the exact numbers varied considerably: the polling station with the lowest number of registered voters had an electoral roll comprising 496 names, while the busiest station had 1,550 registered voters. This variation can be attributed to the high level of turnover seen in the electoral rolls of Montpellier: the city has been expanding steadily since the 1960s and has a large student population; the boundaries of the electoral districts served by the polling stations thus change regularly.
The contingency table to be analysed here is relatively complex, with 12 lines (nine lists of candidates in the first round, plus spoiled ballots, blank ballots and abstentions) and 7 columns (four lists qualifying for the second round, plus spoiled ballots, blank ballots and abstentions). This leaves a total of
After the second round, we visited the Prefecture of the Hérault département to consult the voting registers for these municipal elections. 9 Studying these records enabled us to calculate the numbers of abstaining voters for each polling station precisely and, by aggregating these figures, for the city as a whole (Table 4).
Voter abstention in the municipal elections of 2014 in Montpellier
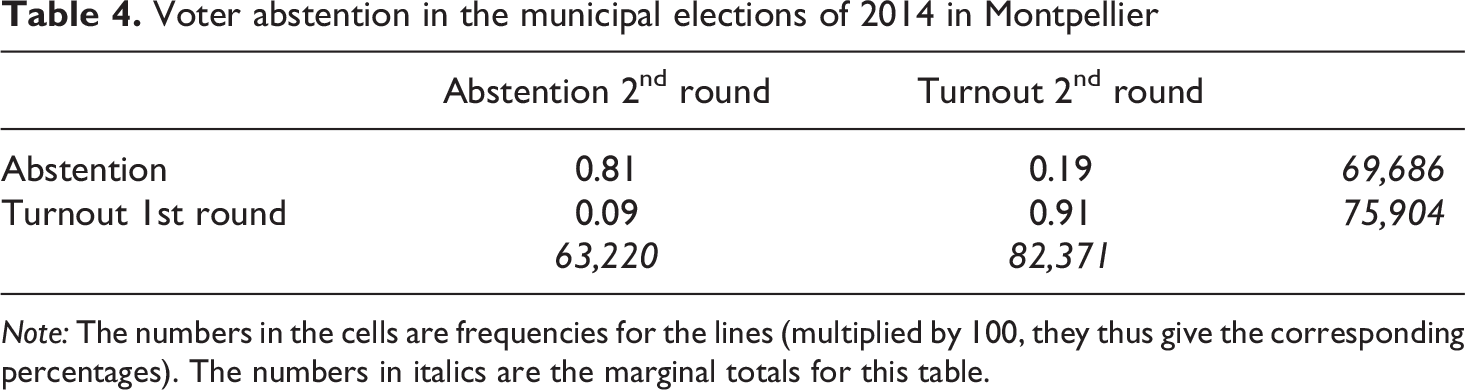
Note: The numbers in the cells are frequencies for the lines (multiplied by 100, they thus give the corresponding percentages). The numbers in italics are the marginal totals for this table.
The majority of voters were consistent in their voting practices in this election. Nevertheless, 14% of registered voters were not consistent – 5% voted in the first round but not the second, while 9% voted in the second round after sitting out the first. Variation in the make-up of the voters is thus a non-negligible factor. The most interesting percentage for our purposes is the rate of consistent abstentionists (A.A.). This percentage varies little from one polling station to the next (
Using the “ei” package available for R, the actual, observed proportions of consistent abstentionists are introduced as initial values for the Markov chains. The ei package gives us the option of setting the initial distribution values for parameters
To do this, we must incorporate a table with the dimensions
Results
In the following paragraphs, to answer the main question which inspired this article, we compare the results yielded by these two ecological inference models. The first model uses the default estimation parameters of the “ei” package. The posterior distribution is estimated with a chain of 100,000 iterations. As analysis of the density curves and plots for the different parameters revealed a certain degree of instability, this initial model was adjusted to retain only the last 40,000 iterations. Meanwhile, the second model integrates the information available regarding the proportion of consistent abstentionists for each polling station. The two models converge quickly enough, but it is interesting to note that using hyperpriors 11 in the second model significantly reduced the calculation time.
Graph 1 confirms that this procedure allows us to produce estimates extremely close to the real values. The raw model – plotted in red below – returns estimates which are higher than the real values (by two percent on average), particularly for those polling stations with the lowest proportions of consistent abstentionists. Graph 1 also shows that the raw model underestimates the variability of the parameters: the standard deviation of the estimates is just 0.02. The blue regression line, which measures how closely the actual values fit the estimates produced by the 2nd model, reveals the model to be virtually perfect, especially for those polling stations with a high proportion of consistent abstentionists.
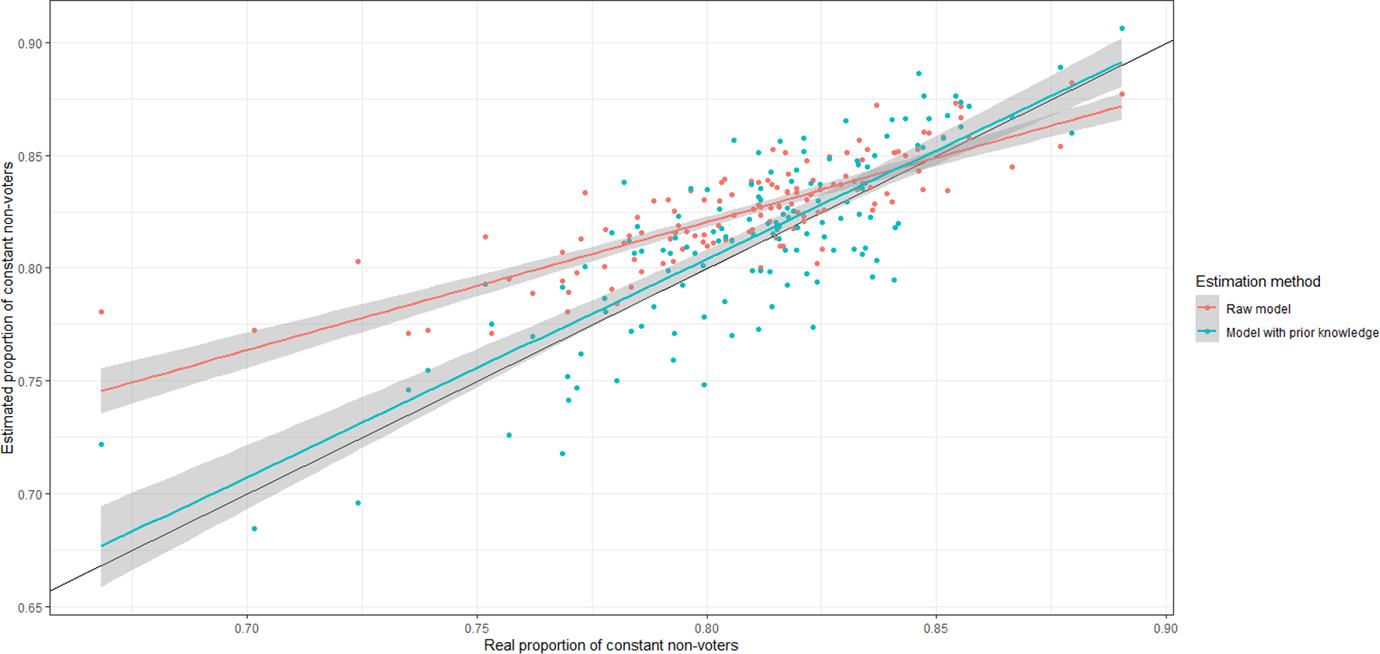
Comparing the estimates yielded by the models with the real values observed for the proportion of consistent abstentionists
Both of the tables included hereunder illustrate the extent to which incorporating information regarding consistent abstentionists – and thus improving estimates on this subject – affects the distribution of other quantities of interest. Table 5 contains the results obtained at the citywide level using the raw model. From a theoretical standpoint, what can we learn from these results? Firstly, they highlight the consistency of voters’ choices between the first and second rounds. The great majority of voters who voted for one of the lists which qualified for the second round then returned to the booth and voted the same way again at the second time of asking.
Estimates of electoral volatility at the city level (raw model)
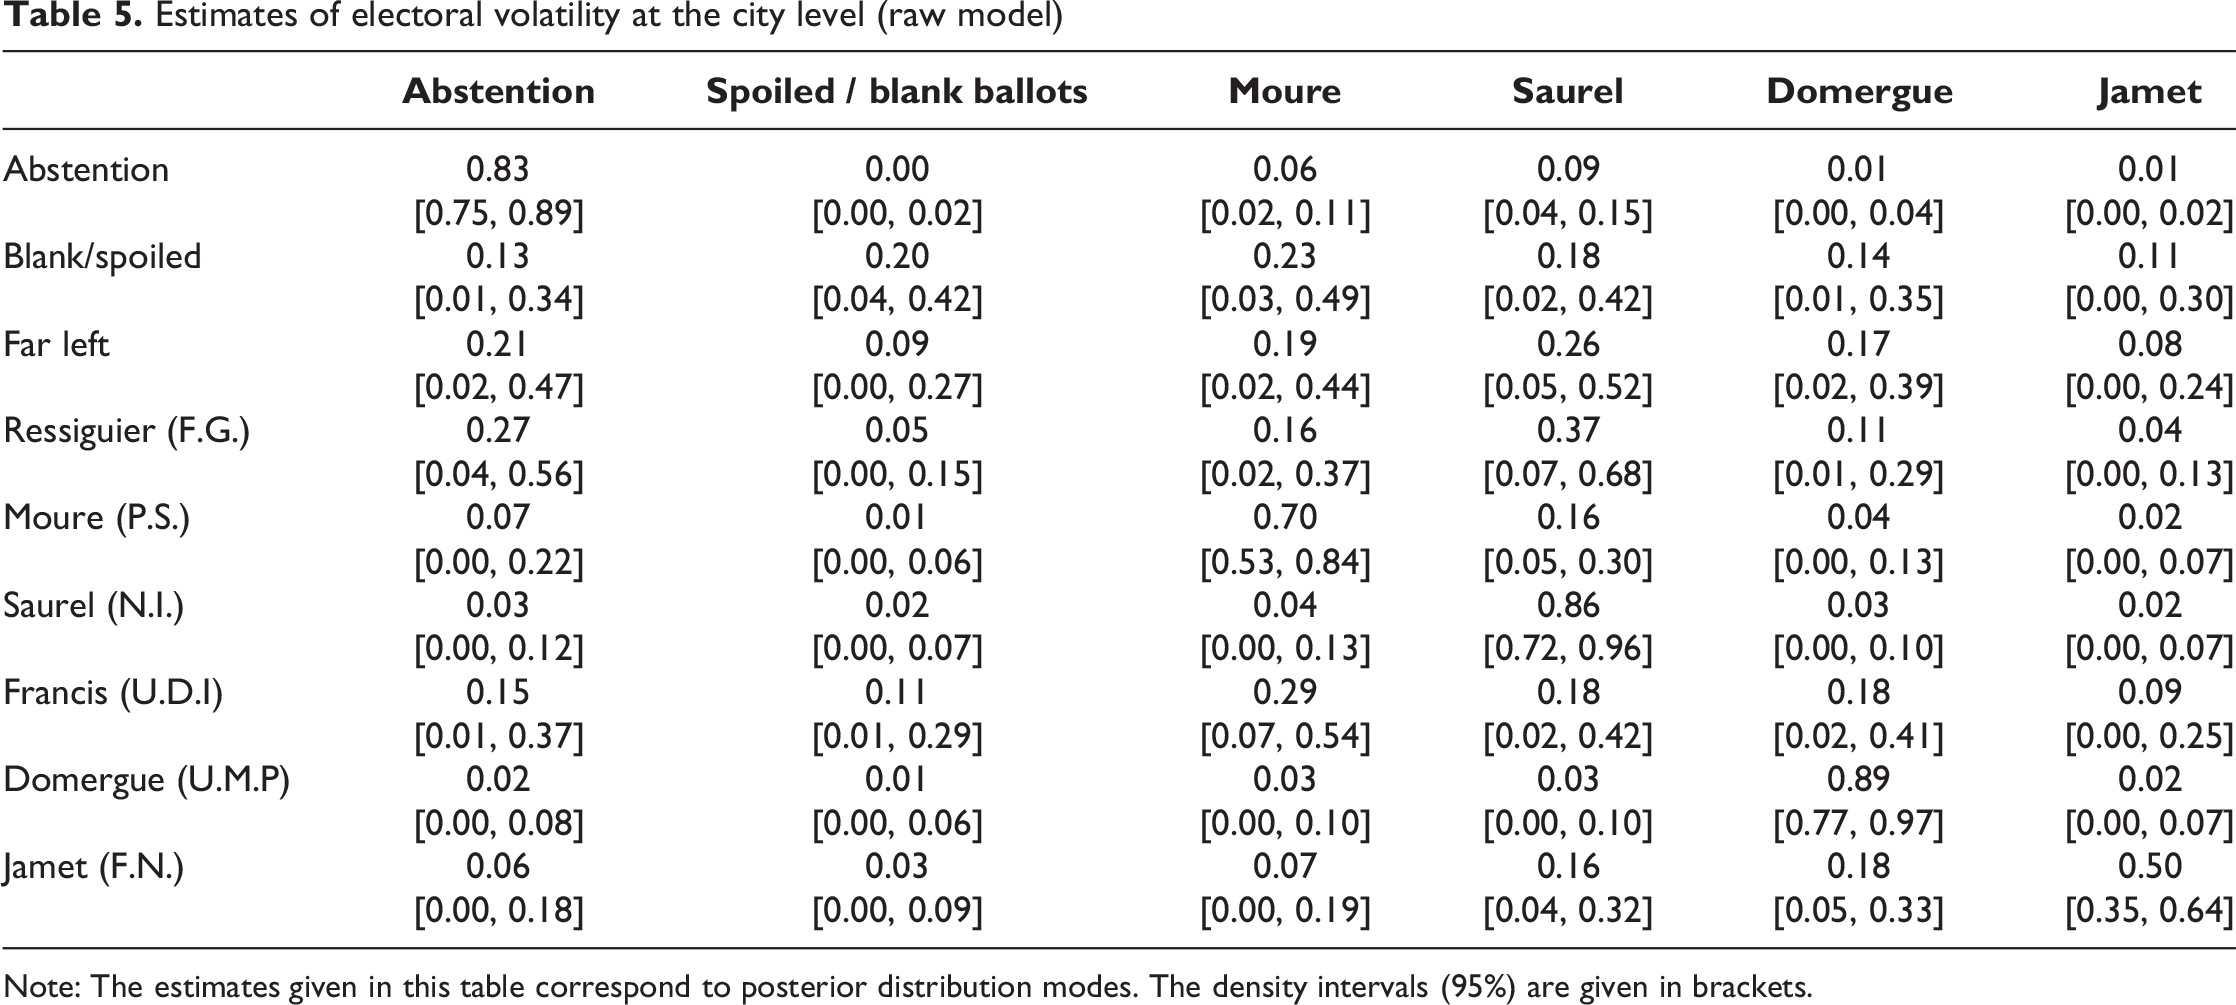
Note: The estimates given in this table correspond to posterior distribution modes. The density intervals (95%) are given in brackets.
Nevertheless, the results obtained from this model hint at a certain variability in the motivation levels among the voters who supported the four finalists. This variability may be interpreted in light of the sociological profiles of these electorates, as well as other dynamics specific to this municipal election campaign. The voters who supported Saurel (N.I.) and Domergue (U.M.P.) appear to have been more motivated for the second round than those who backed Moure (P.S.) and Jamet (F.N.). In the case of Saurel, who received the backing of outgoing mayor H. Mandroux (P.S.) between the two rounds, the stability of his electorate between the first and second rounds reflects the positive momentum of his campaign as well as his strong popularity in city-centre polling stations, where the electorate are primarily educated professionals with a certain social standing. The U.M.P. candidate also had a solid sociological base, with high scores in polling stations where the voters are mostly older and economically well-off, a demographic that traditionally turns out to vote in force. 12
The Parti Socialiste list had more trouble motivating its voters for the second round, with these voters tending to be from more modest backgrounds and perhaps won over by the dynamism of the other left-wing candidate. The model suggests that a non-negligible proportion (16%) of those who backed Moure in the first round decided to vote for Saurel’s list in the second round. The F.N. list, meanwhile, only succeeded in motivating half of its first-round voters to get out and renew their support. The results yielded by the model thus explain the shedding of voters by the F.N. list between the first and second rounds. These results are consistent with the explanations proposed by Cox (1997) and, regarding the specific context of French municipal elections, Dolez and Laurent (2017), who demonstrate that candidates who are not perceived as potential winners often suffer from a loss of motivation among their voters. The model suggests that this loss of mobilisation did not primarily take the form of voters staying away; in fact, they mainly transferred their votes either to the right-wing list still in the running or, alternatively, to the non-partisan list led by Philippe Saurel.
As well as providing insights into the behaviour of the voters who backed the four lists that made the second round, the results from the model show that the voters who supported the other lists in the first round also behaved very consistently. Thus, voters who backed these unsuccessful lists were more likely to abstain in the second round than those who had backed the four finalists. Those who turned out to vote in the second round generally transferred their votes to the list closest to their original preference, in ideological terms. The only exception to this rule is the particular case of the Francis list, whose voters primarily shifted to the socialist list and the list led by Saurel in the second round. This can be attributed to the position adopted by the eponymous head of the Francis list, an ex-U.D.I. (Union des Démocrates Indépendants) member who urged his voters to back J-P. Moure in the second round.
There is much to be learned from these estimates regarding the internal dynamics of the Montpellier electorate over the two rounds of these municipal elections. The results largely corroborate the findings of previous studies concerning the transfer of votes on rational ideological grounds (Van der Meer et al., 2015), the fact that electoral volatility concerns a minority – but not a negligible one – of voters, and the impact of short-term factors on voting decisions at a given election (Dassoneville, 2016). More specifically to the French context, these estimates cast light on the winning dynamics of a political proposition presented as being non-partisan, whose success depends on both its capacity to motivate the electorate and also its ability to attract voters from different political camps by offering a chance to repudiate current local leaders: hence the large numbers of both Front de Gauche (F.G., far left) and F.N. (far right) voters who supported Saurel in the second round.
In statistical terms, the estimates presented in Table 5 are posterior distribution means contained within intervals which become broader as the marginal numbers for the corresponding lines become smaller. As such, for those lists which received the fewest votes, the estimates retain a non-negligible degree of uncertainty. This result also corroborates the findings of previous studies that have sought to evaluate the performance of ecological inference models of this kind (Plescia and De Sio, 2018).
Table 6 shows the estimates generated by the second model, constructed with the help of real, observed values for the number of consistent abstentionists. Including this information does not alter the conclusions drawn from our analysis of Table 5. The results shown in Table 6 confirm the dynamics described above, and indeed accentuate them, particularly with regard to the struggles of the P.S. and F.N. candidates to motivate their voters for the second round. Most proportions shown in Table 6 fit within the intervals established in Table 5. Nevertheless, it is worth noting that the posterior distribution values derived from the second model fit within narrower intervals, especially those pertaining to the “smaller” parties. Incorporating additional information thus appears to reduce the uncertainty of the resulting estimates.
Estimates of electoral volatility at the city level (model integrating information regarding the proportion of consistent abstentionists)
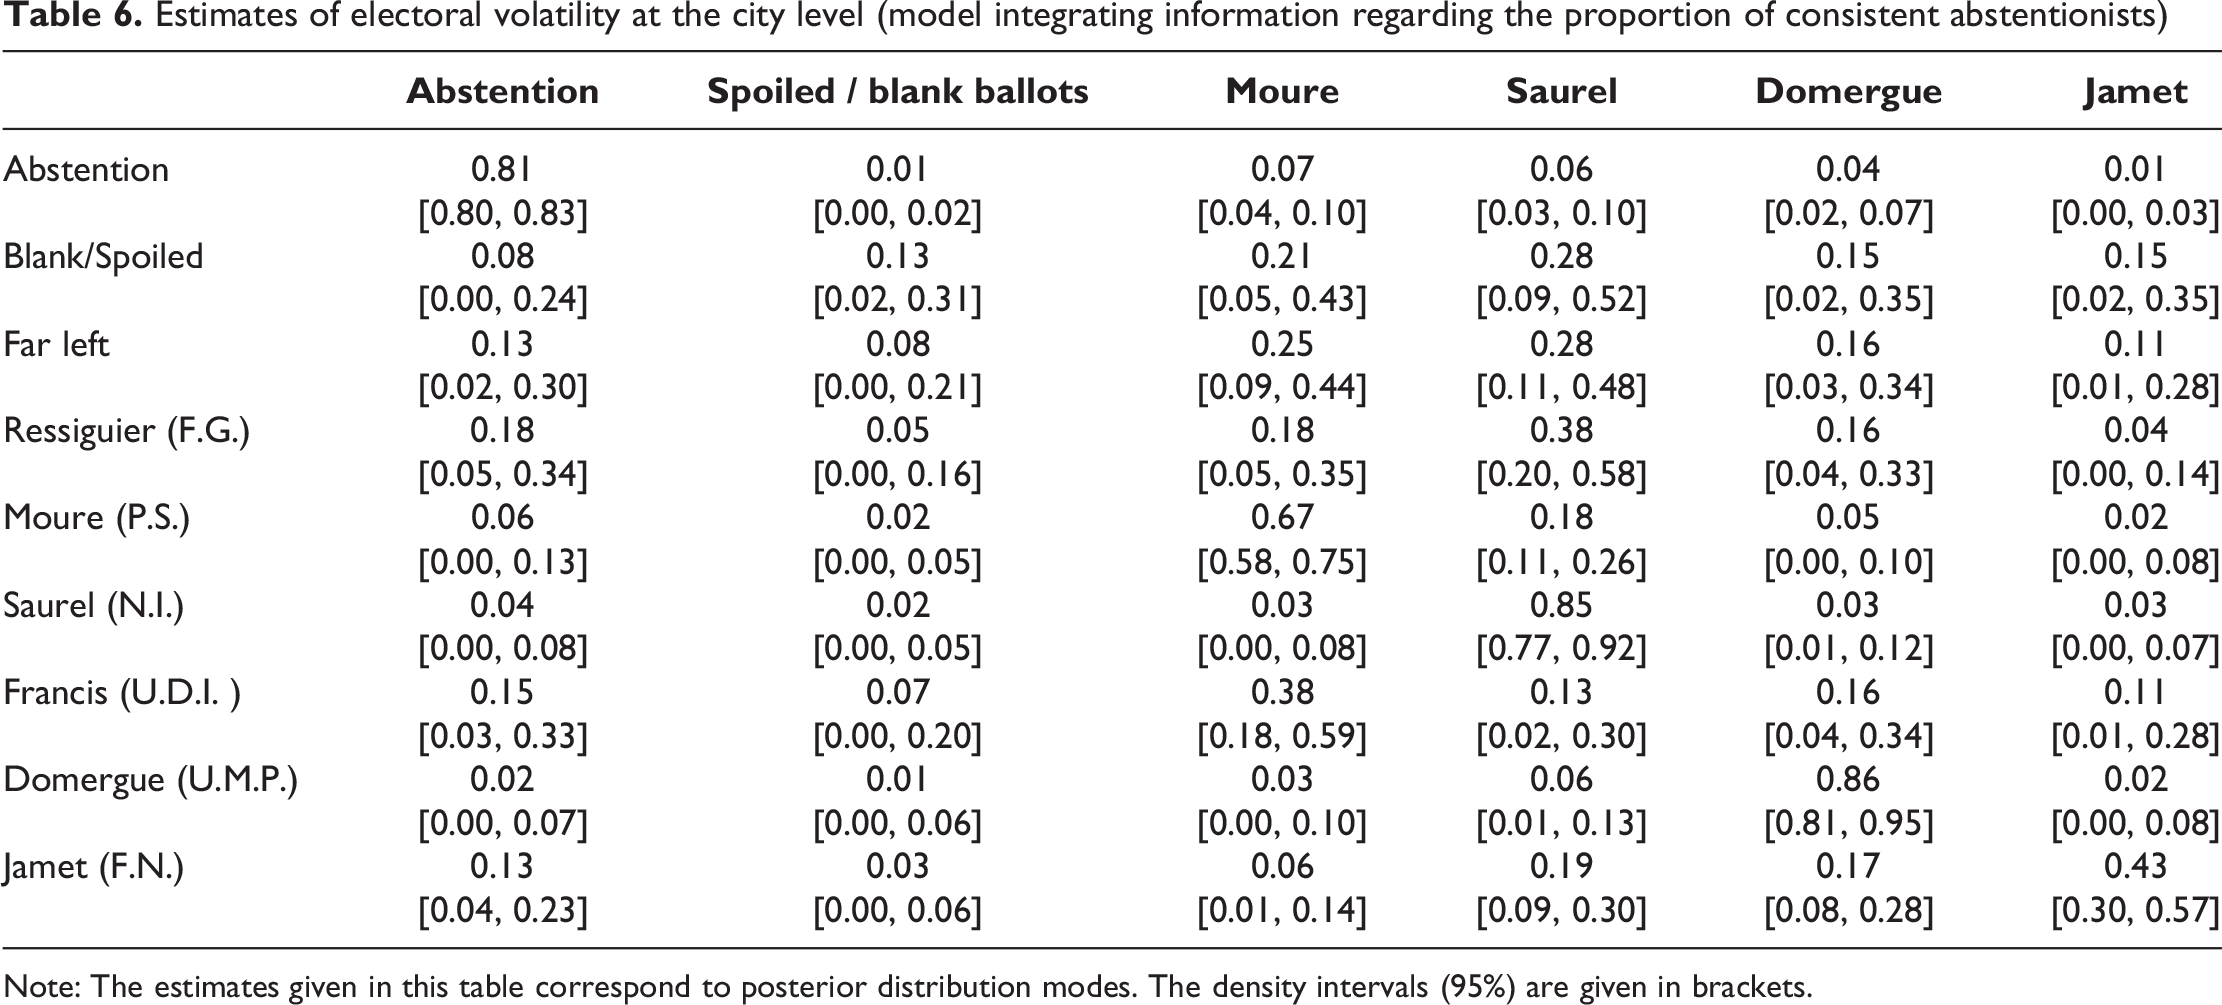
Note: The estimates given in this table correspond to posterior distribution modes. The density intervals (95%) are given in brackets.
Conclusion
The objective of this article has been to evaluate the estimates generated by the Multinomial-Dirichlet model of ecological inference proposed by Rosen et al. (2001) when used to analyse vote transfers throughout a two-round election, specifically the municipal election held in 2014 in Montpellier. To this end, the available information regarding the proportion of constant abstentionists across the city’s 131 polling stations was used to assess the quality of the estimates obtained using the original model for this parameter and then to integrate that information into the model and observe the consequences for the resulting estimates.
Comparing the results of the two models reveals that the “raw” model yields plausible results. These results are relatively reliable with regard to the known parameter - the proportion of consistent abstentionists – although they do slightly overestimate this proportion and underestimate its variability from one polling station to the next. Furthermore, the model that integrates information regarding the proportion of consistent abstentionists yields estimates that closely resemble those obtained from the “raw” model. In terms of interpretative capacity, the value added by integrating this additional information is, therefore, limited. However, the second model gives us narrower density intervals, thus reducing the uncertainty surrounding the interpretation of these parameters, in particular for those lists which received few votes in the first round.
This analysis thus offers a useful evaluation of a method of estimation which had received little attention in the literature on electoral volatility, particularly in the French context. The results of our analysis ultimately confirm the observations made by Voss (2004) and Plescia and De Sio (2018). In the case studied in this article, the low variability and constant amplitude of the phenomenon of consistent abstentionism from one polling station to the next surely help to explain the accuracy of the estimates derived from the raw model. While studying the rate of abstentionism may appear to be of limited value here, we can reasonably expect that things would be different if these conditions were not present.
These results suggest that it would be helpful to repeat the study for other cases. It would be exciting to look at two-round elections with a low proportion of voter abstention, or two different elections held close together. A study of electoral volatility between two different elections would indeed be a reasonable undertaking if the elections in question took place in the same year, with the same number of voters on the electoral roll of each polling station – as is the case with France’s presidential and legislative elections, for example. A possible next step would be to integrate the contextual information available for individual polling stations and infra-communal electoral boundaries (Jadot et al., 2010) to allow for potential aggregation bias and contextual factors liable to affect the estimates.
As matters stand, the results presented herein suggest that electoral sociology could benefit from more regular use of this method of ecological inference. It represents an alternative or complementary method to existing methods of individual data gathering, such as surveys, especially when studying elections on a local scale, where such data are either lacking or of poor quality.
Matériel supplémentaire
Supplemental Material, sj-pdf-1-bms-10.1177_07591063241236062 - Understanding vote transfers in two-round elections without resorting to declared data. The contribution of ecological inference, consolidated with factual information from a case study of the 2014 municipal elections in Montpellier
Supplemental Material, sj-pdf-1-bms-10.1177_07591063241236062 for Understanding vote transfers in two-round elections without resorting to declared data. The contribution of ecological inference, consolidated with factual information from a case study of the 2014 municipal elections in Montpellier by Julien Audemard in Bulletin of Sociological Methodology/Bulletin de Méthodologie Sociologique
Footnotes
Acknowledgements
I want to thank the editors of the Bulletin of Sociological Methodology, Viviane Le Hay and Sophie Duchesne in particular, for their expert help and advice throughout the publication process. I would also like to thank the members of the selection committee for the Prix Guy Michelat, awarded by the Association Française de Science Politique and the BMS, for their comments and suggestions, which have greatly improved the quality of this article.
Declaration of Conflicting Interests
The author declares that he has no potential conflict of interest in relation to the research described herein, copyright and/or the publication of this article.
Funding
The author has not received any particular funding relating to the research described herein, his copyright and/or the publication of this article.
Matériel supplémentaire
La version française de ce texte est disponible sur le site internet du BMS. Elle est téléchargeable en tant que ‘matériel supplémentaire' joint à l'article.
Supplemental material
The French version of this article is available on the BMS website. It can be downloaded as ‘supplementary material'from the online version of this article.
Notes
References
Supplementary Material
Please find the following supplemental material available below.
For Open Access articles published under a Creative Commons License, all supplemental material carries the same license as the article it is associated with.
For non-Open Access articles published, all supplemental material carries a non-exclusive license, and permission requests for re-use of supplemental material or any part of supplemental material shall be sent directly to the copyright owner as specified in the copyright notice associated with the article.