
Abstract
Young People are still referred to as digital natives, although numerous studies have shown differences in their access to digital devices, Internet usage and attitude towards digitalisation. Such differences can lead to digital inequalities. In higher education digital inequalities among students are scarcely researched as it is assumed that university students possess crucial digital competencies which they have acquired at school and in everyday life through the use of digital devices and applications. However, research findings suggest that students cannot directly transfer their digital skills to their study situation. The presented study aims to measure the degree of digitalisation by means of an index, the DDS-Index, which was developed in the context of a large-scale survey among first-semester students in Austria (n=4,822). The DDS-Index maps the degree of digitalisation of students on a range of 0 to 100 points. This paper outlines the development and assessment of the DDS-Index and uses it to analyse differences in the degree of digitalisation of students in order to draw conclusions about a digital divide at universities.
Introduction
The use of digital technologies has become a central cultural technique that increasingly determines educational opportunities, the possibility of upward social mobility, participation in social life and good job prospects. Thus, as a technological and social phenomenon, digitalisation affects virtually all areas of life. This also holds true for educational institutions that are under increasing pressure to keep pace with digitalisation and to provide students with appropriate and contemporary educational offers (Androsch et al., 2017; Gerholz, 2018; Kehm and Teichler, 2006; Kerres, 2016; Klafki, 2007; Kopp et al., 2019). A requirement that has been reinforced by the COVID-19 pandemic, as the crisis highlights already existing social as well as digital inequalities in the education system (Holtgrewe et al., 2021; Huber et al., 2020; Pessl and Steiner, 2021; Steiner et al., 2020). In school context, a discourse on digital inequalities is gaining importance (Drossel et al., 2019; Kutscher, 2019; Paus-Hasebrink et al., 2019; Tawfik et al., 2016) that builds on the already long-standing debate about educational inequalities (Bourdieu and Passeron, 1971, 1973). The COVID-19 pandemic has boosted this field of research and exposes digital flaws and challenges in school systems (for a summary of recent publications on the topic of school and COVID-19 see Fickermann et al., 2021). This discourse is not only about digital competencies of students, but also about their access to digital media and devices and the corresponding opportunities to participate in digital, hence social life.
In higher education, the digital competencies of university students are mainly taken for granted, which explains the predominant research focus on digital competencies of lecturers (Al Khateeb, 2017; Alarcón et al., 2020; Borthwick and Hansen, 2017; Caena and Redecker, 2019; Eichhorn and Müller, 2018; Eichhorn and Tillmann, 2018; Falloon, 2020; LeBlanc, 2018; Tondeur et al., 2017). As digital natives (Prensky, 2001), it is assumed that university students possess crucial digital skills which they have acquired at school and in everyday life through the use of digital devices and applications. However, research findings suggest that students cannot directly transfer their digital skills to their study situation (Kopp et al., 2019: 1453–1454; Persike and Friedrich, 2016: 37–39).
The presented study aims to measure the degree of digitalisation of students by means of an index, the DDS-Index. In doing so, it draws on digital divide research. This theoretical framework connects to existing research and makes a theoretical as well as methodological contribution to digital divide research. The degree of digitalisation is operationalized using a multidimensional index that maps the degree of digitalisation of students on a range of 0 to 100 points. By including different facets of digitalisation, the study not only analyses the technical equipment of students, but also provides a multi-perspective view of the degree of digitalisation among students. Existing differences in the degree of digitalisation of students are then analysed with regard to classic socio-demographic inequality dimensions such as gender and previous schooling, in order to draw conclusions about a possible digital divide at universities.
The article opens with an overview of digital divide research, focusing in particular on recent findings on adolescents and students. In a next step, the survey design is outlined, followed by a detailed description of the development and content of the DDS-Index, clarifying the construct definition, the indicator selection process, and the theoretical specification of the measurement models used. The process of index construction is also critically questioned, and the robustness of the index is challenged based on different methodological and theoretical aspects. This is to take a critical stance towards the index showing that the chosen quantification is not an ‘objective’ measurement of the degree of digitalisation but rather a consensus reached by researchers, their population and other involved groups such as experts (Caveng, 2014; Strübing, 2019). Thus, the index sensitivity to variations is shown. Next, the DDS-Index is used to segment first-semester students based on their level of digitalisation. By doing so, the student profiles are described in more detail and it is shown who the more or less digitised students are. Based on this, conclusions can be drawn about inequalities between first-semester students resulting in new insights for digital divide research.
Theoretical framework – about digital natives, digital divides and digital inequalities
In 1970, Tichenor, Donohue and Olien formulated the knowledge gap hypothesis, which postulates that media distribution of information differs among different social classes, which could lead to a deepening of already existing knowledge inequalities (Tichenor et al., 1970). This thesis found lasting impact in scientific research. With the spread of the Internet, knowledge gap research was confronted with a digital mass medium for the first time. In contrast to print media and television, which had been widely researched up to then, scientists recognized the danger of growing knowledge gaps due to the Internet at an early stage. As a result, research on the relationship between socioeconomic factors and Internet use was a strong focus of early studies on digital divide (Arnhold, 2003; Bonfadelli, 2002; Castells, 2005: 261–287; DiMaggio and Hargittai, 2001; DiMaggio et al., 2004; Marr, 2003; Norris, 2001; Van Dijk, 2005; Zillien, 2009). In general, digital divide research represents the continuation of ‘classical’ research on knowledge gap in the digital space and builds on the digital divide thesis. This thesis expresses the fear ‘that social inequalities are reinforced by the different use of new media’ (Zillien, 2009: 82).
In German-speaking areas, a distinction is made between access, use, and impact research (Marr and Zillien, 2019). In the English-speaking realm a different terminology has prevailed. The first(-level) digital divide (Attewell, 2001; Hargittai, 2002) describes the differences in digital space that are based on a differentiation between users and non-users. The focus is on access to digital devices and how these are distributed in society. The second(-level) digital divide deals with differences in Internet use and highlights the fact, that not only access to the Internet matters, but also how the Internet is used (Blank, 2013; Peter and Valkenburg, 2006; Van Dijk, 2006). The third(-level) digital divide addresses the usability of knowledge. The focus is on analysing potential benefits that individuals with higher socioeconomic status gain from the way they use the Internet, which in turn may result in advantages in the ‘analogue’ world (Scheerder et al., 2017; Van Deursen and Helsper, 2015; Van Deursen et al., 2017).
Especially young people and their digital competencies are intensively examined in the context of digital divide research. This is due to the fact that a growing number of theoretical approaches were formulated seeing a fundamental change in the socialisation of young people with the emergence of new media and technologies, since for the first time a generation was growing up with digital media from childhood on. Digital natives (Prensky, 2001) and the Net Generation (Tapscott, 1998) are probably two of the most prominent names for the age cohort socialised with digital media. Numerous studies have empirically challenged the theoretical assumptions underlying these two concepts, asking to what extent young people can actually be described as a homogeneous group of digitally competent performers. Striking is the unusually unanimous consensus that the postulated assumptions of a ‘new’ generation fundamentally different from previous generations due to early media socialisation are empirically untenable. Although age has a significant influence on the handling and use of digital media (Hargittai, 2008; Hargittai and Hinnant, 2008; Hargittai and Walejko, 2008; Peter and Valkenburg, 2006), Prensky’s (2001) assumptions disguise the diversity of adolescent Internet users, who differ from one another both in their access to digital devices as well as in their usage behaviour (Gui and Argentin, 2011; Hargittai, 2010; Jandura and Karnowski, 2015; Margaryan et al., 2011; Marshall, 2018; Scolari, 2019).
While there are already studies on young people in the context of digital divide research, the study of digital inequalities in higher education is still a young research field. The fact that universities have hardly been analysed from the perspective of digital inequalities within their student bodies is probably due to three factors. First, the thesis of students as digital natives (Prensky, 2001) still persists 20 years after its publication, both in the media and in academic discourse. Although the concept of digital natives was heavily criticised from the very beginning and is now considered empirically disproven (Schulmeister, 2012), the term continues to be used when describing young people and students. For example, Kopp, Gröblinger and Adams describe the thesis of students as digital natives and lecturers as digital immigrants (Prensky, 2001) as a myth: ‘It cannot generally be said that students are prepared for digitalization, but lecturers are not. This (wrong) generalization is probably related to the assumed dichotomy between digital natives and digital immigrants. This distinction is a myth, however’ (Kopp et al., 2019: 1453). At the same time the authors point out that this myth is perpetuated as a secure assumption and as such slows down digital transformation of universities. The assumption of students as digital natives implies that there are hardly any sufficiently large differences in students’ technical equipment, use, and digital competencies that could be analysed (Kopp et al., 2019). Although numerous studies have already concluded that digital inequalities occur even within young age cohorts (Gui and Argentin, 2011; Hargittai, 2010; Jandura and Karnowski 2015; Margaryan et al., 2011; Marshall, 2018; Scolari, 2019), few comparable studies can be found in higher education context. Only in recent years publications addressing digital inequalities in higher education have increased (Buzzetto-Hollywood et al., 2018; Lojewski and Schäfer, 2017; Nataraj, 2014; Peña-Lõpez, 2010a, 2010b; Relles and Tierney, 2013; Ricoy et al., 2013; Rohs and Ganz, 2015; Selwyn, 2010). However, studies that address structural disadvantages in the student body due to low digital competencies (Castaño-Muñoz, 2010) are still a rarity compared to descriptive analysis of students’ technical equipment, study-related habits of using new technologies, and digital competencies (Gierdowski et al., 2020; Grosch and Gidion, 2011; Janschitz et al., 2021a; Kleinmann et al., 2005, 2008; O’Brien and Verma, 2019; Persike and Friedrich, 2016).
Second, studies address digitalisation in higher education predominantly at a general level or in terms of higher education development (Androsch et al., 2017; Bedenlier and Deimann, 2020; Gerholz, 2018; Kerres, 2016; Marshall, 2018). The theoretical framing within digital divide research is hardly done. Third, research focuses primarily on lecturers as well as infrastructure and technical equipment of higher education institutions. As supposed digital immigrants, it is deemed necessary to make lecturers digitally (more) competent and to invest in technology-supported teaching and learning settings (Caena and Redecker, 2019; Eichhorn and Tillmann, 2018; Falloon, 2020; Galanek and Gierdowski, 2019; Kopp et al., 2019).
The fact that digital inequalities within the student body have hardly been researched so far is understandable against the background of the three factors explained, but at the same time highlights the prevailing research gap, which Selwyn already pointed out in 2010: ‘[T]he notion of the digital divide in HE [higher education] is now notable only by its absence in contemporary education debate’ (Selwyn, 2010: 34). This gap is to be addressed with the DDS-Index for measuring the degree of digitalisation, which we use as basis for analysing the digital divide in higher education.
Survey design
Based upon the assumption that students as digital natives already possess sufficient digital competencies, a large-scale survey has been initiated in Styria, Austria. The project DiKoS – Analysis and Development of Digital Competencies of Students (in German: DiKoS –
The decision to conduct the survey using paper-pencil is based on several – mainly methodological – arguments. In order to avoid a selective bias in the sample composition (coverage error), an online survey was excluded (Diekmann, 2012: 521). If the questionnaire was sent out online, it would be likely that especially digital savvy students with an interest in the topic would participate, while students who are less concerned with digital devices and their applications or even consciously decide against their usage would be much more difficult or even impossible to reach by means of an online survey. In addition, the low response rates of online surveys pose a problem. These are generally much lower than for paper-based surveys (Nulty, 2008: 303; Weigold et al., 2019). For example, in the university context, response rates for student teaching evaluations are at most around 20% (Kelle et al., 2009: 185).
Therefore, we decided to conduct a paper-pencil survey in face-to-face courses at the beginning of the 2019/2020 winter semester. This made it possible for students who do not own the digital media required to complete a questionnaire, such as tablets, smartphones or laptops, or who did not have them with them during the course, to participate. Although it can be assumed that the proportion of non-owners of new media within the student body is very small, Hargittai (2010: 97) points out that in studies on Internet use and/or other digital topics, a survey method should be chosen that does not exclude those who do not have Internet access and are less digitally or technologically savvy.
Expert group
The main challenge of the project was to create an index that allows to measure the degree of digitalisation of students. It is important to highlight that our index does not measure digital competencies but the degree of digitalisation. However, the degree of digitalisation is not a fixed, objectively measurable quantity, but is rather defined by us researchers. In this sense, the compilation of an index is a negotiation process that constantly demands decisions, which influence the index and thus the outcome. How ‘digital’ students are is therefore conditioned by the construction of the index and requires an ongoing critical reflection of decisions made. In this sense, an index represents an ‘agreement of quantification’ (Caveng, 2014) made by the people involved in the research process.
To take this into account, we decided to have the research process accompanied by a group of experts. This approach has already been used in other studies in which experts were involved in the process of index creation (e.g. Chowdhury and Squire, 2006; Mascherini and Hoskins, 2009). Hence, we decided to use an already existing expert group named Technology Enhanced Learning Styria (short: TELS). The TELS-group consists of eleven representatives of the nine Styrian higher education institutions, who are highly qualified people from research, higher education teaching and administration. The members of the TELS-group are appointed as representatives by their respective institution due to their long-standing experience with digitalisation topics in higher education. In addition to the professional expertise, the TELS-group offers the advantage of mapping the diversity of the Austrian higher education landscape. There are three types of higher education institutions in Austria, which differ from each other in their requirement profiles and organisational structure: universities of applied sciences, university colleges of teacher education and universities. The TELS-group includes members from all three types of higher education institutions.
The experts have continuously supported us in the research process; they were involved in the creation of the questionnaire and made central decisions in the context of the index creation, for example, the specification of indicators used. It is important to emphasise that the TELS-group contributed their expertise in terms of content and that recommendations as well as decisions were not methodologically but content-based argued and justified by them. The methodological expertise was provided by us and partly framed the discussion and decision-making process of the experts. The specific role of the TELS-group is explained in the individual steps of the index development.
Sample
The population was defined as first-time admitted students in the Styrian higher education area in winter semester 2019/2020. Our assumption is that a digital divide can already be found among first-year students, which in turn might be ascribed to different aspects such as previous schooling, social background and gender, which are then perpetuated during the course of studies. According to this assumption, a different degree of digitalisation should be evident among first-year students, as previous studies have already shown (O’Brien and Verma, 2019; Ricoy et al., 2013). The aim of the DDS-Index is to map this digital divide. According to official figures from the nine Styrian higher education institutions, in winter semester 2019/2020, a total of 5,866 students received a matriculation number for the first time in Austria. Of these 5,866 first-year students, 4,822 could be questioned, which corresponds to a response rate of 82.2%. This high response rate was possible through the paper-pencil survey mode in face-to-face courses. Since our sample includes all higher education institutions in the Styrian higher education area – including universities, universities of applied sciences and university colleges of teacher education – a good comparability with the broader student population in Austria can be anticipated.
In order to test the suitability of the DDS-Index for measuring the degree of digitalisation of students, 1,918 higher-semester students were also surveyed. They were surveyed in the same survey mode (paper-pencil questionnaire in face-to-face courses) as the first-year students. We used the higher-semester students as a reference group to test the robustness of the index. Our assumption is that the degree of digitalisation of students increases as their studies progress. For example, Persike and Friedrich show in a survey of over 27,000 German students that the concrete teaching practice of a university has a great influence on the diversity of use of digital media. Insofar as lecturers use a wide range of digital media in their teaching and have a positive attitude towards digitalisation of university teaching, this has a positive effect on the study-related use of digital media by students (Persike and Friedrich, 2016: 37–38). This finding supports our assumption that the DDS-Index should be higher for higher-semester students indicating a more advanced level of digitalisation.
Methodological approach
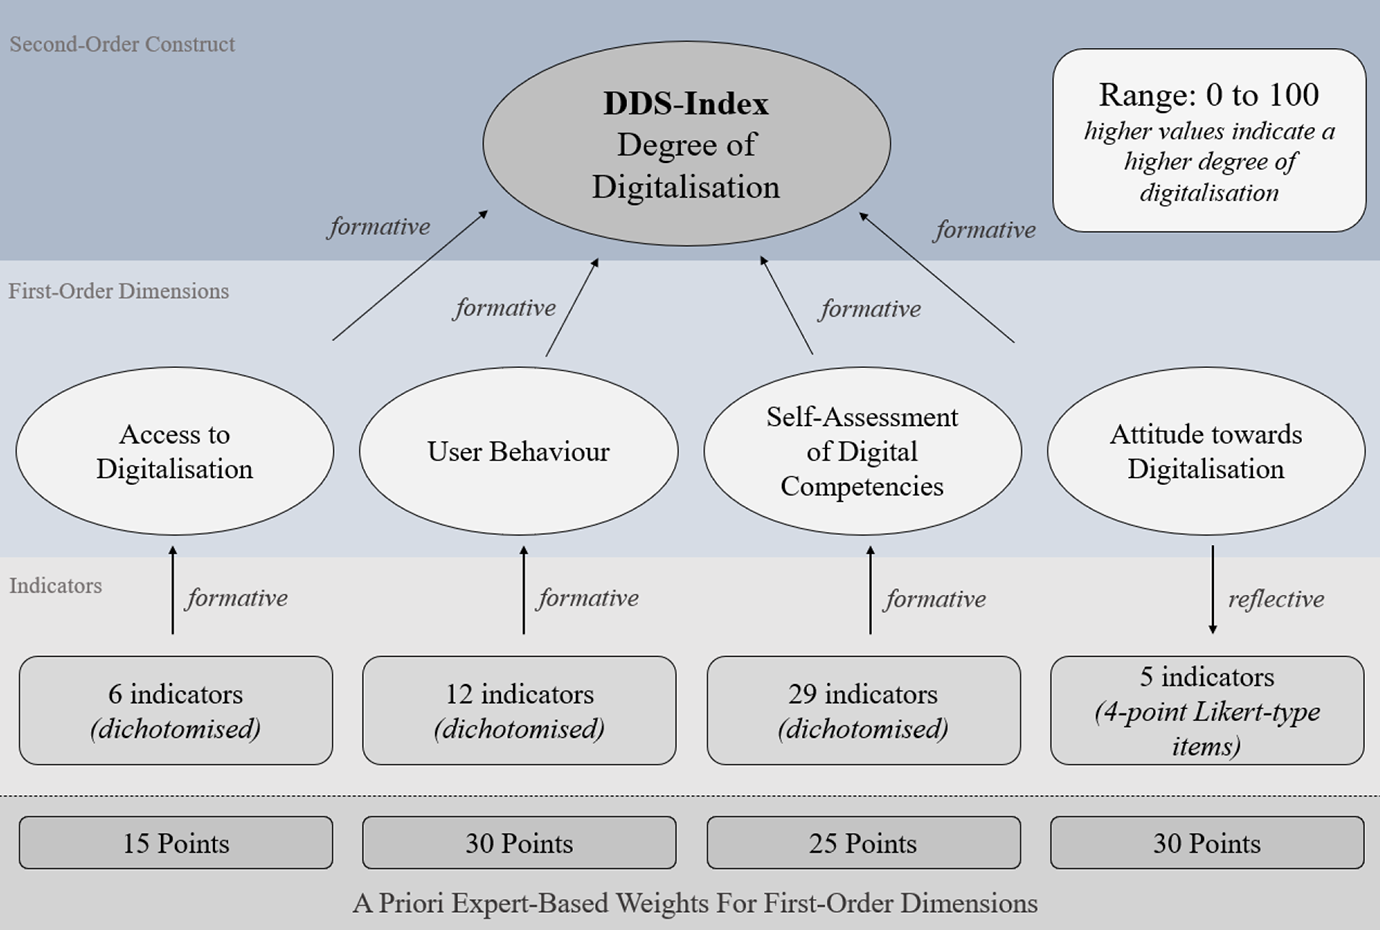
The DDS-Index is conceptualized as a multidimensional measurement model. Such models usually consist of a second-order construct and at least two first-order constructs, which are in turn measured by several indicators themselves. As a multidimensional construct cannot exist without its dimensions it is necessary to ‘clearly define the relations between a multidimensional construct and its dimensions’ (Edwards, 2001: 145–146). The two common operationalisation approaches are reflective and formative measurement models that can be differentiated according to the role of their indicators (Bühner, 2011: 32–36). Reflective measurement models assume that the variance of observed variables arises from a single underlying latent variable and the corresponding measurement error. As the indicators thus reflect the latent variable, they are called reflective or effect indicators (Bollen, 2011: 363; Bühner, 2011: 32; Kline, 2011: 280). In contrast to reflective indicators, which reflect the effect of the underlying latent construct, formative indicators determine it. Therefore, they are also referred to as cause indicators (Diamantopoulos and Winklhofer, 2001: 269). While reflective models represent the logic for the construction of multi-item scales, formative models correspond to the logic for the formation of indices (Bühner, 2011: 34; Diamantopoulos and Winklhofer, 2001: 269).
The two measurement approaches also differ in the quality criteria relevant to them. Thus, covariance-based methods such as reliability estimation using Cronbach’s Alpha (Bollen and Lennox, 1991: 307) and covariance-based factor analysis are used to validate reflective measurement models (Bühner, 2011: 64). In contrast, the literature on formative models emphasizes the importance of a comprehensive construct definition, low multicollinearity between indicators, and validation by external (validity) criteria (Diamantopoulos and Winklhofer, 2001: 271–273). We consider a person’s level of digitalisation as a complex construct, and therefore use a multidimensional model – the DDS-Index – to measure it.
Development and assessment of the DDS-Index
In the following, we provide an overview of the conceptualisation of the DDS-Index. Figure 1 contains a visual representation of all relevant work steps.
Conceptualisation of the DDS-Index.
In order to construct our multidimensional index, we oriented ourselves towards the D21 Digital Index (Initiative D21, 2020) that has been used to survey the digital competencies of German society annually since 2013, using a multidimensional index consisting of four dimensions: access to digitalisation, digital competencies, user behaviour and openness to digitalisation. According to the researchers, the four dimensions used best reflect the central components of digital live and thus form the foundation of the D21 Digital Index (Initiative D21, 2013: 15). Concerning the structure of our DDS-Index, we follow the definition of the D21 Digital Index and understand the individual degree of digitalisation as a multidimensional construct which we describe in detail below.
Indicator specification at the dimensional level
Like the D21 Digital Index, we used four first-order dimensions: (1) access to digitalisation, (2) user behaviour, (3) self-assessment of digital competencies, and (4) attitude towards digitalisation. Except for the proximity in naming the dimensions, the DDS-Index differs from the D21 Digital Index in its content, as we used different indicators for the construction of the first-order dimensions (Appendix A provides a discussion on the differences between the DDS-Index and the D21 Digital Index).
In a first step, possible indicators for each dimension have been collected by means of an extensive research study (for an overview see Janschitz et al., 2019). In this way, a total of 390 items were pre-selected that could potentially be considered for the index construction. In a second step, the pre-selection of indicators was discussed in detail with the TELS-experts leading to a decision regarding which indicators to use. This means that our indicator selection for the respective first-order dimensions was not empirically based on e.g. structural equation modelling, but instead an expert-based decision was made with the main objective of mapping the respective dimensions as comprehensively as possible through the indicators. Although other studies also relied on experts in the process of index creation (e.g. Chowdhury and Squire, 2006; Mascherini and Hoskins, 2009), no comparable study could be found that included experts in indicator selection. Nevertheless, we deliberately decided on a dialogue procedure for the selection of indicators (Appendix B presents the indicators used), as this approach takes into account that the creation of an index should not only be based on statistical figures, but should also be theoretically well discussed and argued in terms of content. Due to this procedure, the number of items per dimension varies, as the experts were not guided by measurement-theoretical, but rather by content-related aspects when selecting items. In a fourth step, we checked from a measurement-theoretical point of view whether the selected items were statistically suitable for measuring the respective dimensions (explained below).
Theoretical specification of measurement models
In order to determine whether our four first-order measurement models depicting the first-order dimensions are reflective or formative, we used a scheme constructed by Jarvis et al. (2003) allowing researchers to decide which measurement characteristics apply. The authors included three sets of questions within the scheme: questions on the causality relationship between latent variable and indicators, questions on the interchangeability of indicators, and questions on the (non)existing covariation between indicators (Jarvis et al., 2003: 203). By using this scheme, three of our four first-order models (access to digitalisation, user behaviour and self-assessment of digital competencies) could be identified as formative models. Attitude towards digitalisation, on the other hand, clearly corresponds to the logic of a reflective model (Appendix C shows the measurement theoretical specification according to Jarvis et al., 2003). Jarvis et al. (2003: 204) call such a constellation, where at the first-order both formative and reflective models occur, ‘mixed model’.
After specifying the first-order measurement models, the scheme created by Jarvis et al. (2003: 203) was applied to the relationships between the first-order models and the second-order model (Appendix C). In this way it could be concluded that our four first-order models are in a formative relationship to the second-order model. These theoretical and methodological considerations concerning first-order and second-order models, as well as the difference between formative and reflective models, is a necessary prerequisite for the index construction, since the applied measurement characteristic decides which quality criteria have to be used to assess a model.
First-order measurement models
The expert-selected indicators used for the four first-order models have been equally weighted and aggregated to form the respective first-order dimension. In order to do that, we have dichotomised the used indicators for three formative dimensions (access to digitalisation, user behaviour and self-assessment of digital competencies). According to the dichotomised logic, a value is counted if it applies. The higher the values, the higher the degree of digitalisation. The same holds true for the reflective dimension attitude towards digitalisation, whereby in this case the five four-point Likert-type items were first rescaled (so that high values mean a high degree of digitalisation) and then averaged.
Quality criteria of the formative first-order models
- Content and indicator specification: Three of our four first-order models are formative: access to digitalisation, user behaviour and self-assessment of digital competencies. Since formative constructs are determined by their indicators, it is of central importance to integrate all necessary indicators into the model in order to capture the construct in its entirety (Diamantopoulos and Winklhofer, 2001: 270–271). We have met this requirement with our expert-based item selection, as the main objective of the selection process by experts was to map the respective dimensions as comprehensively as possible through the indicators.
- Multicollinearity: Multicollinearity between indicators leads to (a) estimation of unstable coefficients and (b) the inclusion of redundant information (Diamantopoulos and Winklhofer, 2001: 272). Point (a) is negligible, as we did not estimate indicator coefficients. Point (b) was checked for all three dimensions by using the variance inflation factor (VIF). Within the research on formative measurement models, it is common practice to eliminate indicators with a VIF higher than 10, provided the conceptual definition allows this (Diamantopoulos et al., 2008: 1212). None of the used indicators had a VIF higher than 3.6, so we concluded that no redundant information was included in our formative first-order models.
Quality criteria of the reflective first-order model
- Content and indicator specification: For the reflective first-order model attitude towards digitalisation, an expert-based decision was made regarding the used indicators. For this, the experts were confronted with the results of an exploratory factor analysis (principal axis with varimax rotation) that was conducted in SPSS 25.0 (IBM, 2017) based on a pool of twelve items surveyed in the pre-test (n=176). The three factors extracted reflect different facets of attitude towards digitalisation: digital fixation, digital scepticism, and proactive aspects of digitalisation. These three factors were discussed in detail with our experts. Based on our aim to create a multidimensional index measuring the degree of digitalisation of students, the experts considered the factor digital fixation as most appropriate to represent the dimension attitude towards digitalisation. This factor consists of five items that represent digital openness and fixation, which have been combined to form our reflective first-order model attitude towards digitalisation.
- Factorial validity and reliability: Since the dimension attitude towards digitalisation is based upon a reflective measurement logic, we used classical methods of scale development for its validation (Diamantopoulos and Siguaw, 2006: 269). To investigate the factorial validity a two-step procedure was conducted. In a first step, the above-mentioned exploratory factor analysis was carried out, extracting amongst others, one factor consisting of five items that represent digital fixation. This factor was chosen by our experts to represent the dimension attitude towards digitalisation. In a second step, a confirmatory factor analysis with these five items was carried out using the R lavaan package (Rosseel, 2012). Parameter estimation was performed using maximum likelihood in combination with robust standard errors. 321 missing values were imputed using full information maximum likelihood (Rosseel, 2012: 28). The model is thus based on 4,816 observations. All path coefficients were significant (p ≤ .001) with magnitudes ranging from [0.32–0.74]. As far as the fit of the model is concerned, all (robust-) fit indices (χ2=58.5, df=5, RMSEA=0.049 [0.038; 0.061], CFI=0.98, SRMR=0.022) – except of the chi-square test statistic 2 , whose p-value is below .05 – are below or above their established thresholds (Hu and Bentler, 1999: 28). Additionally, the reliability in terms of internal consistency was assessed using Cronbach’s Alpha (Bühner, 2011: 166–167). This led to a Cronbach’s Alpha of 0.63, which according to literature is either just acceptable or unacceptable (there is no general cut-off value; see Taber, 2018). Nevertheless, as the relatively low coefficient is confronted with an overall good model fit, the alpha value gave us no reason to reconsider the item selection. This decision was also made on the grounds that removing one item would not have improved the Cronbach’s Alpha value.
Second-order construct: the DDS-Index
The multidimensional index consists of four first-order dimensions and represents on a scale from 0 to 100 the degree of digitalisation of university students, whereby high values represent a high degree of digitalisation. The different scaling of the first-order models, resulting from the varying number of used indicators, made it necessary to adjust the value ranges (Mazziotta and Pareto, 2013: 70). Therefore min-max rescaling was applied (Albon, 2018: 62). By using this technique all first-order models were assigned to the value range [0; 1].
Specification of weightings
For the final calculation of the index, weights are necessary to determine the impact each first-order dimension has on the second-order index. These weights can either be estimated empirically or determined a priori (Bollen and Diamantopoulos, 2017: 585–586). We follow the suggestion of Lee and Cadogan (2013) according to whom the weights of formative indicators should be specified a priori as part of the construct definition, since statistical estimation can cause the individual weights to differ from study to study. Hence, in order to ensure the reproducibility of the index – at least for studies sampling university students – we also chose an a priori weighting process by using the experts of TELS-group. In a first step, the content of the index was outlined to the TELS-experts. In a second step, they were asked to individually allocate 100 points to the four first-order dimensions according to their estimated importance for the multidimensional index. This method, also known as ‘budget allocation’ (Decancq and Lugo, 2013: 24), was used by Mascherini and Hoskins (2009), among others, to determine the importance of individual dimensions for the Active Citizen Index. Furthermore, Chowdhury and Squire (2006) use expert knowledge of development researchers to validate the weighting scheme applied to the dimensions of the Human Development Index. In a third step, the individual expert weights were added up and averaged so that an average weighting was available for each dimension. Finally, in a fourth step, these average weightings were discussed extensively in the entire TELS-group and a joint final weighting of the respective dimensions was made. The min-max-scaled first-order dimensions have then been weighted accordingly: access to digitalisation 15 points, user behaviour 30 points, self-assessment of digital competencies 25 points and attitude towards digitalisation 30 points.
Quality criteria and validation of the DDS-Index
- Multicollinearity: Since the second-order measurement model is formative, multicollinearity between the four first-order models must be ruled out. Once again, the VIF was used for this purpose. The maximum VIF is 1.1, multicollinearity can thus be excluded.
- External validity of indicators: To statistically underline the suitability of the first-order dimensions to serve as formative indicators for the second-order construct, we used an external criterion summarising the content of the second-order index (Diamantopoulos and Winklhofer, 2001: 272). Therefore, the questionnaire includes a bipolar labelled and tenfold graded scale, where respondents were asked to classify themselves as analogue or digital. Table 1 illustrates the correlations between the scores of the first-order dimensions, the DDS-Index and the external validity criterion. Although the correlation coefficients vary in size, they are all practically and statistically significant and are therefore suitable to represent the index measuring the degree of digitalisation of students. In addition, the correlation between the DDS-Index and the external validity criterion shows that higher index values (i.e. a higher degree of digitalisation) also tend to be associated with higher self-assessments. This underlines the validity of the DDS-Index.
Correlation matrix of first-order dimensions, the DDS-Index and the external validity criterion
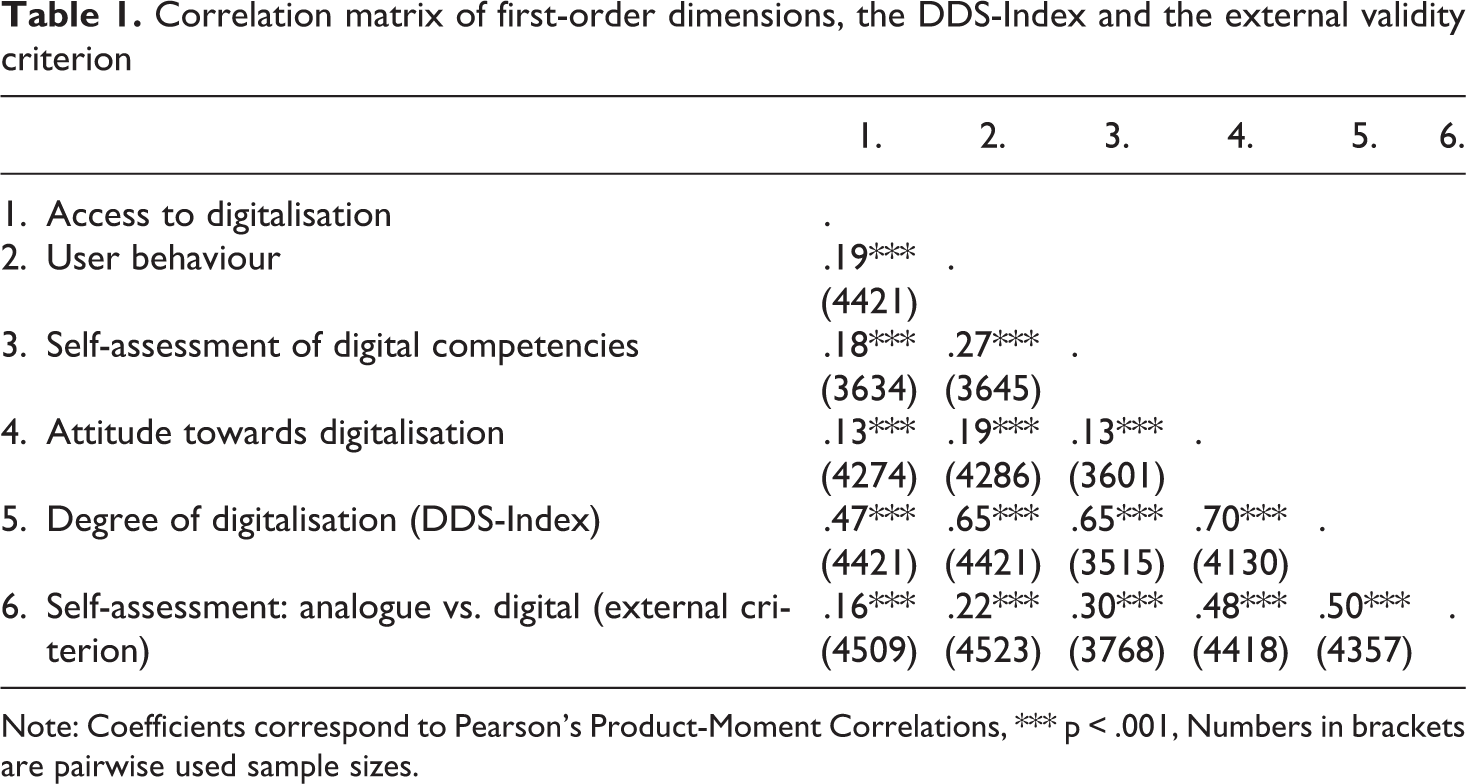
Note: Coefficients correspond to Pearson’s Product-Moment Correlations, *** p < .001, Numbers in brackets are pairwise used sample sizes.
- Concurrent validity: In order to shed light on the validity of the second-order index from a different perspective, six knowledge questions were included in the survey (for an overview see Janschitz and Monitzer, 2020a: 12–13). These questions were used to form a score reflecting the level of knowledge of a person (Appendix D). We make the following assumption: the higher the level of digitalisation of a person, the more knowledge a person has. This assumption is made based upon the indicators used for the first-order dimensions. We assume, that a person who owns more digital devices, uses more online media and digital services, rates her digital competencies highly and is more digitally open in her attitude than others, also performs better in terms of knowledge. Thus, we conclude that persons with a higher value on the DDS-Index should also have a higher value on the knowledge score. Based on this assumption, we interpret the resulting correlation as a validity coefficient that thus describes the concurrent validity of the DDS-Index due to simultaneous collection of the criterion (Cohen and Swerdlik, 2009: 182–183). Using Pearson Product-Moment Correlation based on 4,279 observations, a coefficient of .261 (p ≤ .001, t=16.1) was determined. Even though this is a small effect size (Cohen, 1992: 99), we consider the validity coefficient as support for the concurrent validity of the DDS-Index.
Imputation, distribution and sensitivity analysis
Due to the paper-pencil survey mode, we had to deal with missing values, as the respondents could easily skip questions, end the survey earlier and ignore or overlook single items. As our main goal for the index construction is to assign an index value to as many respondents as possible in order to get a comprehensive picture of the degree of digitalisation of students, we analysed the four first-order dimensions with regard to missing values, as only respondents with values in all four dimensions are assigned a value on the DDS-Index. Checking for missing values revealed that two dimensions (access to digitalisation and user behaviour) only had minor proportions of missing values, while the dimension attitude towards digitalisation showed 6.7%, and the dimension self-assessment of digital competencies 20.9% of missing values indicating that respondents had at least one missing value in the used indicators and hence, did not obtain a value in the respective first-order dimension. Therefore, we decided to impute the missing values for these two first-order dimensions using multiple imputation (Rubin, 1976). Before the imputation was executed, an analysis of missing patterns was carried out in R using the packages mice (Van Buuren and Groothuis-Oudshoorn, 2020) and VIM (Templ et al., 2020). A number of sociodemographic variables (among others: type of school, gender, enrolled university) was used to differentiate between missing and non-missing values. Furthermore, based on Little’s MCAR (p ≤ .05), we conclude that our missing values are not missing completely at random. Therefore, we consider the missing at random condition sufficiently satisfied to perform multiple imputation. Imputation was carried out using the fully conditional specification algorithm implemented in SPSS 25.0 3 (IBM, 2017). Finally, 4,421 first-semester students were assigned a DDS-Index value.
The distribution of the DDS-Index approximates a normal distribution with a mean of 59.2 (standard deviation: 10.1) on a range of 0 to 100, whereby high values represent a high degree of digitalisation (Appendix E). We expected a mean above 50 considering the survey population of first-semester students, but in consideration of the minimum and maximum values (10 and 98) the degree of digitalisation in the group of supposed digital natives is widespread. This speaks for the differentiability of the measuring instrument. Thus, by using the DDS-Index, first-semester students can be differentiated according to their degree of digitalisation.
To check robustness and suitability of the DDS-Index within populations besides from first-semester students we use another sample of 1,918 students from higher semesters. The arithmetic mean and median are slightly higher than those of first-year students. This result corresponds to our preliminary assumption that the degree of digitalisation of students increases as their studies progress and is consistent with previous study results (Persike and Friedrich, 2016). A visual comparison of both distributions can be found in the upper part of Figure 2.
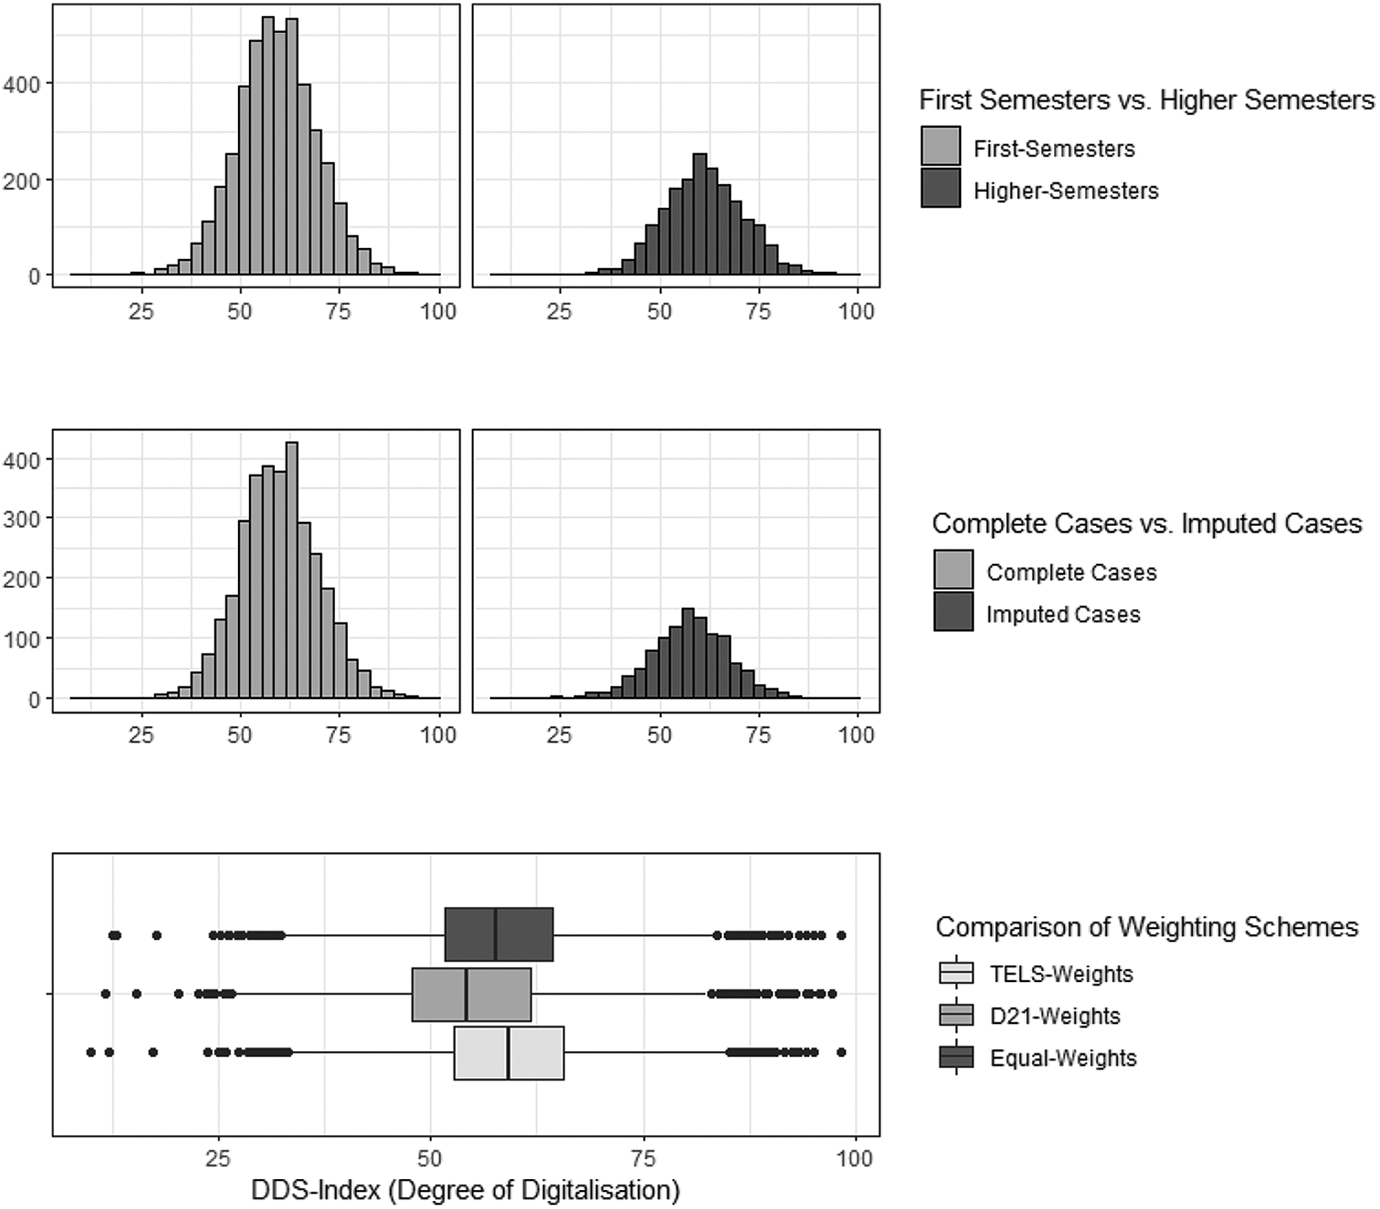
Distribution of the DDS-Index: Robustness and Sensitivity Analysis.
In addition, the distribution of complete cases was compared with the distribution of respondents for whom at least one value was imputed. While the distribution of complete cases matches with the joint distribution (complete and imputed cases), there are certain differences compared to the distribution of imputed cases. Thus, mean and median are lower than in the joint distribution as well as both minimum and maximum were over- and underestimated (Appendix E). Nevertheless, due to the approximate congruence between complete cases and the joint distribution, we see no substantial bias attributable to the imputation process.
To estimate the sensitivity of the DDS-Index, we examined the influence of different weighting schemes at the dimension level. We compared the weights determined by the TELS-experts with weights of the D21 Digital Index and equal-weights (Figure 2 and Appendix E). The distribution resulting from TELS-weighting scheme is mostly in accordance with equal-weights distribution. In case of the general-population based D21-weights, measures of dispersion such as standard distribution, minimum and maximum values remain similar, but this weighting scheme results in a lower mean level of digitalisation. Additionally, we examined bivariate relationships between the three index variations using Pearson Product-Moment Correlation. The coefficients range from .92 to .96, which underlines the stability of measurements.
In terms of a comparison with the general population of Austria, it can be assumed that students – both first-year students and students in advanced semesters – have a higher degree of digitalisation. Castaño-Muñoz (2010: 46–47) shows for Catalan students that the internet skills of students are, as expected, above average compared to the population as a whole. Although the DDS-Index has not yet been applied to general population, it can be considered a suitable tool to measure the degree of digitalisation also within broader population groups regarding the indicators used. Nevertheless, the weighting was done by the experts specifically for university students. Therefore, the weights for the four first-order dimensions should be adjusted if the DDS-Index is applied to general population. This was underlined by the sensitivity analysis, as the general population-based weighting scheme of the D21 Digital Index leads to a lower average level of digitalisation.
Since the weighting as well as all other aspects of the construction process cannot be located on a continuum between ‘right’ and ‘wrong’, we do not see the validity of the measurement endangered by this. Rather, our measurement should be understood as an ‘agreement of quantification’ (Caveng, 2014) between us, our experts and the relation to our study population. According to Strübing (2019: 529) early pragmatists such as Georg Herbert Mead already emphasized that data do not simply exist and are found, collected, and subsequently analysed by us researchers. Rather, any process of data collection (measurement) is an interactive process in which researchers, population, sample but also experts and reviewers participate. This process is always characterized by a multitude of subjective decisions despite the application of rigorous statistical methods and measurement theoretical approaches. Whether it is the definition of our construct, the selection of indicators, or the weighting determined by our experts, all of these steps are part of the process, which we consider an ‘agreement of quantification’ which has shaped our results. We therefore distance ourselves from the claim of an ‘objective’ measurement and refer to Gelman and Hennig (2017) who abandon the notion of objectivity in quantitative research in favour of transparency, consensus, impartiality, and correspondence to observable reality – an approach we applied throughout the development and assessment of the DDS-Index.
Using the DDS-Index to map the digital divide in higher education
In order to check whether there is a digital divide in higher education, three groups were formed based on the DDS-Index: low (0 to 49 points), average (50 to 69 points) and highly (70 to 100 points) digitised students 4 . In a first step, general differences between the groups with regard to different digitalisation aspects are shown. In a second step, the groups formed are analysed socio-demographically to describe the profiles of highly and low-digitised students.
A closer look at the three groups shows differences in terms of access, user behaviour, self-assessed digital competencies and attitude towards digitalisation (Figure 3). Highly digitised students own four out of six devices, while those with a comparatively low degree of digitalisation own only 2.5 devices. The middle group, which represents 70% of students, owns three devices. The differences in user behaviour are similar. Of the 12 online services surveyed, low-digitised students use 6.1 and highly digitised students 9.1. The middle uses 7.7 online services. Differences can also be found along the degree of digitalisation regarding the self-assessment of one’s own competencies. In total, this dimension comprises 25 possible points. The low-digitised students only achieve nine points, while the highly digitised students achieve an average of 17 points. The attitude dimension, with a maximum of 30 points, shows a similar result. Here too, low-digitised students (13 points) score fewer points than average (20 points) and highly digitised students (25 points). Overall, the low-digitised students score 43 out of possible 100 points. The average group scores 59 points and the highly digitised group 75 points.
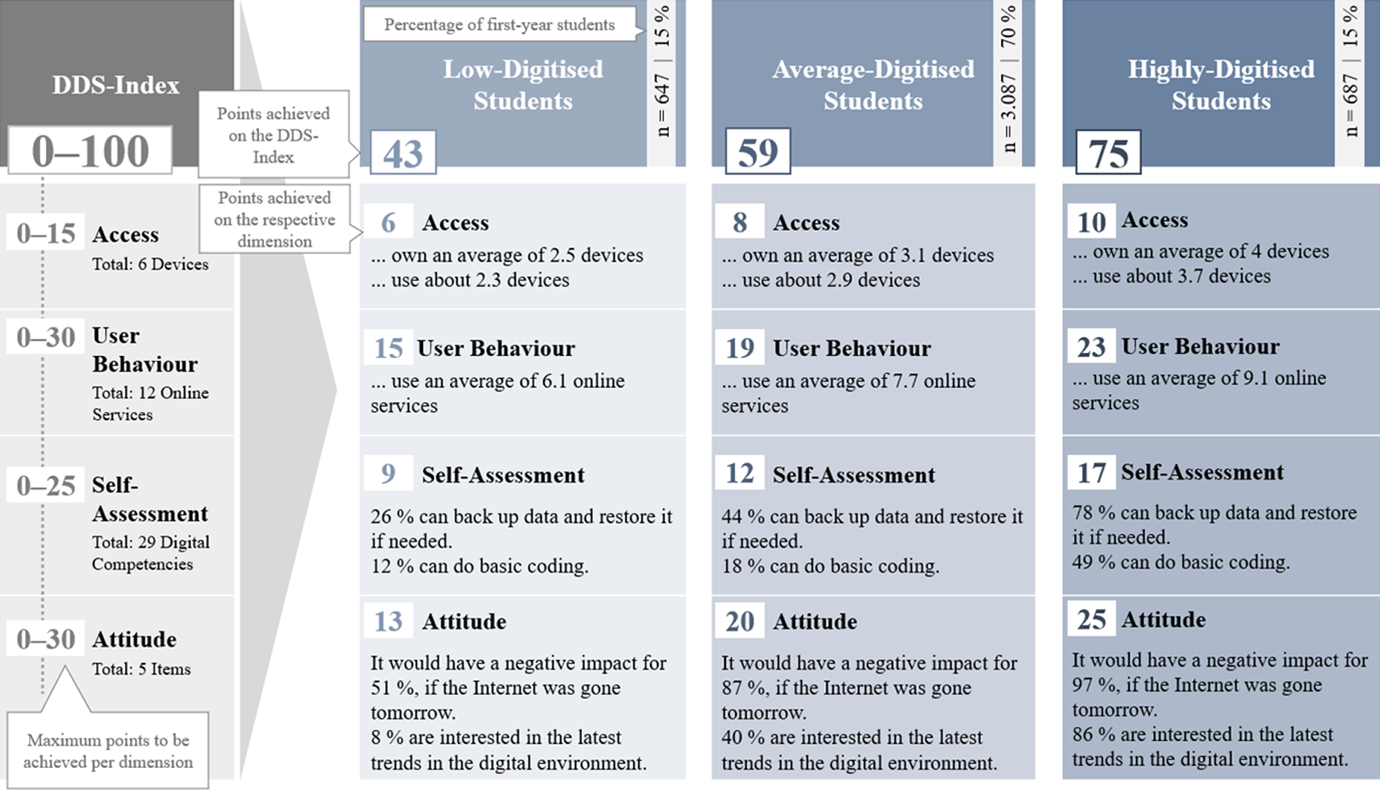
Differences in the degree of digitalisation of first-semester students (n=4,421).
To see whether there are differences in the socio-demographic composition of the groups, six variables are included in the analysis: gender, age, provenance, acquisition of university entrance qualification, type of school attended and (non-)attendance of a laptop or tablet class during schooling (Figure 4). With regard to gender, there is a clear difference between groups. Thus, the proportion of men in the group of low-digitised students is 35%, in the average group 41% and in the group of highly digitised students 66%. Exactly the opposite can be seen among women. Accordingly, there is a gender gap in the degree of digitalisation, insofar as male students are more digitised than female students. No significant differences in the degree of digitalisation can be seen in age and provenance of the students. However, the lack of an age effect should be interpreted with caution, as the majority of students surveyed are only at the beginning of their studies. Thus, 91% of the students are 23 years or younger.
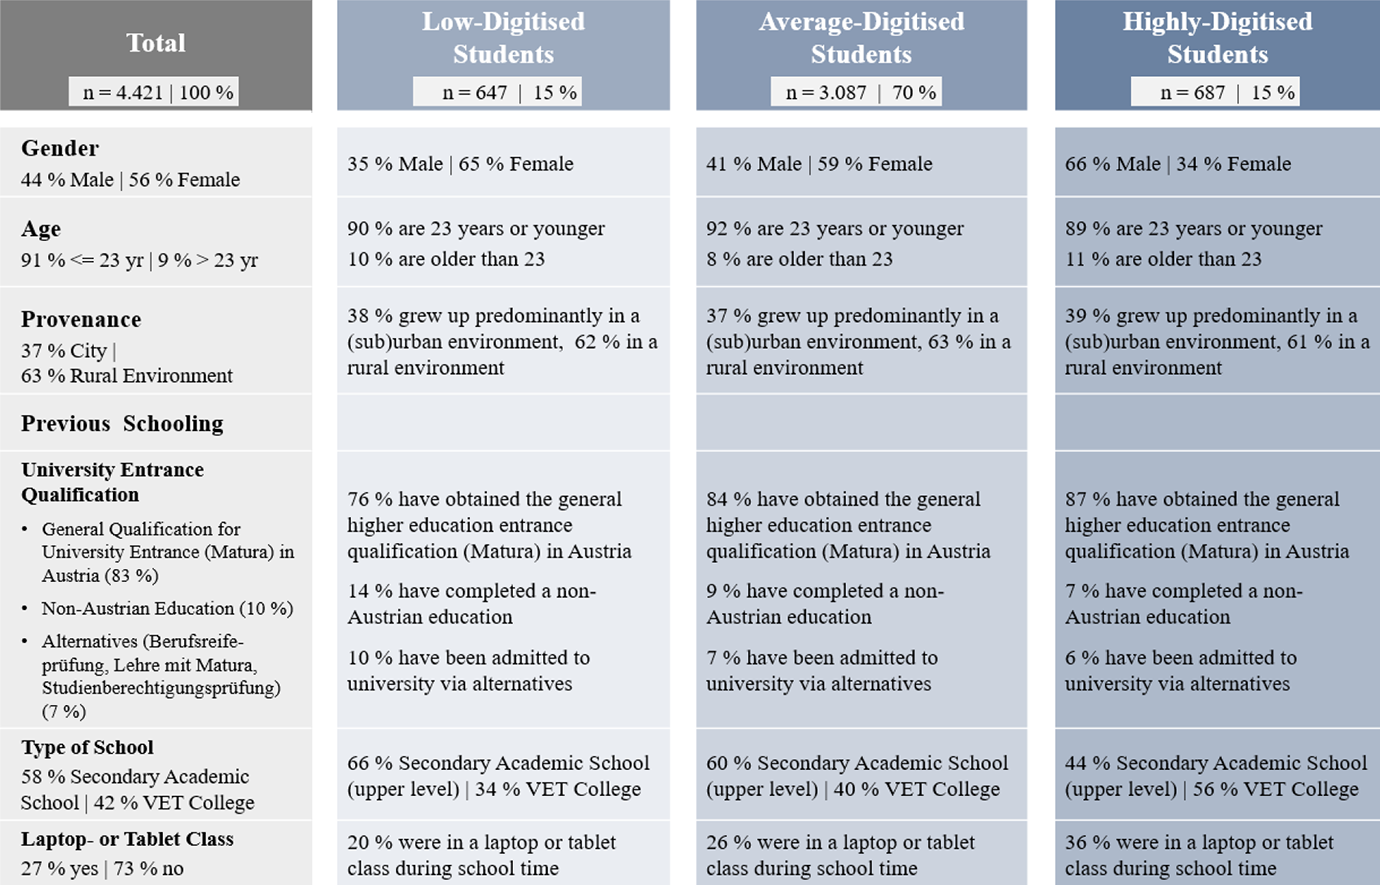
Socio-demographics and degree of digitalisation (n=4,421).
In turn, previous schooling shows an influence on the degree of digitalisation. The proportion of students who were admitted to higher education via acquisition of the general qualification for university entrance (known as Matura in Austria) is higher as the degree of digitalisation increases. Alternative access options such as the apprenticeship with Matura offered in Austria are generally only taken up by very few (7%). However, their share is higher in the group of low-digitised students (10%) than in those with a high degree of digitalisation (6%). There are also differences regarding the type of school attended. In Austria, students can choose between a secondary academic school (Allgemeinbildende Höhere Schule, AHS) and a VET college (Berufsbildende Höhere Schule, BHS) after lower secondary school. As expected (Mayrhofer et al., 2019: 140–141), the proportion of secondary academic school graduates in the sample is higher than that of VET college graduates (58% vs. 42%). A comparison between the three groups shows that VET graduates are overrepresented in the group of highly digitised students and are thus more digitised than graduates of secondary academic schools.
Attending a laptop or tablet class also has an influence on the degree of digitalisation. Overall, only about a quarter (27%) of the students attended a laptop or tablet class for at least one year during schooling. In the group of low-digitised students, the proportion drops to 20%. In the middle group it amounts to 26% and in the group of highly digitised students it is as high as 36%. Accordingly, students who have attended a laptop or tablet class during schooling are more digitised than those without laptop or tablet class experience.
The impact of gender and previous schooling on the degree of digitalisation indicates a digital divide in the higher education context. For instance, women have a lower degree of digitalisation than men. It is also evident that students who were not admitted to higher education via the general qualification for university entrance (Matura), but via alternatives, fall comparatively more frequently into the group of students with a low level of digitalisation than those who have done so. Similarly, attending a higher vocational school (VET college) and a laptop or tablet class during school time have a positive effect on the degree of digitalisation.
Discussion and conclusion
The discussion on digital competencies and their relevance in professional and personal everyday life in the 21st century is omnipresent. One of the most influencing time diagnoses concerning the digital world is the distinction between digital natives and digital immigrants (Prensky, 2001). Based on this distinction, the term digital divide emerged differentiating between people who are perceived as digitally competent and those who are perceived as less competent, whereby age is considered to be a major characteristic determining the digital competencies of a person. Hence, it is assumed that especially young people belong to the group of digital natives. In this sense, university students are also perceived as so-called digital natives and expected to be competent in the use of digital technologies. However, research finding show that students cannot necessarily transfer their personal digital competencies to their study situation and might not be as digitally competent as expected (Kopp et al., 2019: 1453–1454; Persike and Friedrich, 2016: 37–39).
Based on data from a large-scale survey among first-semester students (n=4,822), a multidimensional index has been presented measuring the degree of digitalisation of university students and thus makes it possible to analyse to what degree the assumption of students as digital natives holds true empirically. By using the DDS-Index, it can be shown – in line with digital divide research – that digital inequalities exist in higher education and need to be addressed. Not only are there differences in the student body with regard to technical equipment (first-level digital divide) and the use of online services (second-level digital divide), but differences can also be found with regard to digital competencies. In addition, it could be shown that existing differences in access, use and digital competencies are not random, but are systematically influenced by socio-demographic factors. Comparatively low-digitised students are predominantly female, tend to come from secondary academic schools and did not attend a laptop or tablet class during schooling. A contrary picture appears in the group of highly digitised students. Here, the male share dominates. In addition, it has a positive effect on the degree of digitalisation if students have attended a VET college and a laptop or tablet class during schooling, and if they have been admitted to higher education by obtaining the general qualification for university entrance (Matura).
Although some authors have already empirically challenged the assumption of digital natives (for an overview see Marshall, 2018: 197–211), their surveys lack comparability. For example, the question of whether digital natives are a myth or reality is mapped by Scolari (2019) using the concept and survey of transmedia skills and literacy, while Margaryan et al. (2011) argue on the basis of university students’ usage of digital technologies. Depending on the operationalisation of digital competencies, the results vary, while re-testing is hardly possible as applied survey instruments are not available. These shortcomings were taken into account in the construction of the DDS-Index. Thus, the transparent approach, the available questionnaire (Janschitz and Monitzer, 2020a, 2020b), as well as the construction and validation process outlined in this paper, guarantee the reproducibility of the DDS-Index. Hence, it is possible to use the DDS-Index at higher education institutions that are interested in the digitalisation level of their students.
Furthermore, the results not only provide a picture of the digital student body, but also allow the development of recommendations for teaching, research and administration in higher education (Kopp et al., 2021). In this way, the use of new digital media and technologies for the organisation and implementation of digital teaching and learning settings can be modelled in the best possible way based on empirical results. The COVID-19 pandemic and its impact on higher education teaching show the relevance and need for an evidence-based adaptation of teaching that corresponds to the knowledge and competencies of students. In this sense, the index is a valuable tool to study the effects of the pandemic context on digital competencies. Our study was conducted in winter semester 2019/2020 and thus offers results for pre-COVID-19 times. Reconducting the study after almost two years of COVID-19, and consequently different teaching settings (e.g. complete distance learning, hybrid teaching), would reveal the effects of the pandemic on digital usage. Besides researching pandemic effects, the DDS-Index can be used to analyse the effects of a university curriculum on the degree of digitalisation of students by measuring at the beginning and end of a curriculum. Also, conducting a panel study that surveys the same sample over a period of years is feasible with the DDS-Index. Such a panel design would provide new perspectives on digital trends within a cohort of presumed digital natives.
Footnotes
Acknowledgements
We would like to thank the anonymous peer reviewers and the editors of BMS for their helpful feedback and their insightful comments.
Declaration of Conflicting Interests
The authors declared no potential conflicts of interest with respect to the research, authorship, and/or publication of this article.
Funding
The authors disclosed receipt of the following financial support for the research, authorship, and/or publication of this article: The research project, within the framework of which the DDS-Index was developed, is funded by the State of Styria, Austria.
Notes
Appendix
A: Discussion on the differences between the DDS-Index and the D21 Digital Index
Despite the proximity in terms of structure, there are three main aspects in which our DDS-Index differs from the D21 Digital Index:
Content and Transparency: The D21 Digital Index does not provide any detailed explanation of the creation of the index. Neither the questionnaire, nor the used indicators for measuring the degree of digitalisation, are provided by the D21 Digital Index. In project reports, the information on the index remains at a vague level and is limited to a short general description of the index and a brief description of the content of the four dimensions (e.g. Initiative D21, 2013: 14–15 and 32–33; Initiative D21, 2016: 7 and 23; Initiative D21, 2020: 10–11). Hence, it is not possible for scholars to replicate the D21 Digital Index, as the indicators used for the construction of the four dimensions are unknown. Here we choose a more transparent approach. Both, the questionnaire (Janschitz and Monitzer, 2020a, 2020b) and the indicators used for the DDS-Index are made available, including a description of the indicator selection process by experts.
Methodological Procedure: Since the annual reports of the D21 Digital Index are published in a science-to-public style, there is hardly any information about the methodological approach of the study nor about the applied statistical procedures used for the validation of the first- and second-order measurement models depicting the defined dimensions and the multidimensional index. Nevertheless, in order to apply the correct quality criteria for the assessment of first-order and second-order models, a specification of the measurement models underlying the dimensions and the index must be made. We defined our dimensions and construct conceptually, specified their underlying measurement models in terms of formative and reflective and assessed these models with the appropriate quality criteria.
Field of Application: The D21 Digital Index serves to measure the degree of digitalisation of German society. According to this definition, the four dimensions used were also weighted by the experts of the Initiative D21: digital competencies are included in the D21 Digital Index with 40%, access to digitalisation with 30%, openness to digitalisation with 20% and user behaviour with 10% (Initiative D21, 2020: 11). Since our index measures the digitalisation of university students, the weighting had to be adjusted accordingly, which was done by experts of the TELS-group. As a result of the weighting process and the selection of indicators by experts, the DDS-Index is capable of measuring the degree of digitalisation in the student body.
B: Used indicators for first-order dimensions (Janschitz and Monitzer, 2020a)
C: Measurement theoretical specification of the first-order and second-order models (Jarvis et al., 2003: 203)
D: Knowledge-Score (Distribution, Measures of Location and Dispersion)
Note: n=4,822, a SD=standard deviation. Value 0 indicates that none of the six knowledge questions was answered correctly.
E: DDS-Index (Measures of Location and Dispersion)