
Abstract
Sociological practitioners often face considerable methodological uncertainty when undertaking a quantitative analysis. This methodological uncertainty encompasses both data construction (e.g. defining variables) and analysis (e.g. selecting and specifying a modelling procedure). Methodological uncertainty can lead to results that are fragile and arbitrary. Yet, many practitioners may be unaware of the potential scale of methodological uncertainty in quantitative analysis, and the recent emergence of techniques for addressing it. Recent proposals for ‘multi-strategy’ approaches seek to identify and manage methodological uncertainty in quantitative analysis. We present a case-study of a multi-strategy analysis, applied to the problem of estimating the long-term impact of 1980s UK government-sponsored youth training. We use this case study to further highlight the problem of cumulative methodological fragilities in applied quantitative sociology and to discuss and help develop multi-strategy analysis as a tool to address them.
Keywords
Introduction
Sociological practitioners may face considerable methodological uncertainty when undertaking quantitative analyses. Crucially, they may be uncertain about how the decisions they make in their analysis will affect their conclusions. Over the course of an analysis, practitioners may be required to make a large number of uncertain decisions, beginning when they prepare a dataset and continuing with efforts to estimate important quantities from those data (Leamer, 1983; Muñoz and Young, 2018; Silberzahn et al., 2018; Simmons et al., 2011; Simonsohn et al., 2015; Steegen et al., 2016; Young and Holsteen, 2017; Young, 2018).
It is helpful to refer to the set of decisions made in the course of producing a particular estimate as an analytical strategy (Silberzahn et al., 2018). The problem of methodological uncertainty is that particular analytical strategies frequently have a subjective component. They include the choices of particular methodological ‘options’ out of a range of other defensible and plausible alternatives. Such choices can include the definition of key variables, the selection of ‘control’ variables and the selection of particular estimation procedures (Steegen et al., 2016; Young and Holsteen, 2017).
Choices of this kind are goal-directed, they aim to properly define constructs, produce unbiased estimates of causal effects, and so on. However, it is often difficult to unambiguously select an optimal choice before an analysis or to test after an analysis whether a particular estimate is accurate. This uncertainty creates a risk that researchers’ conclusions may depend on methodological choices that are made in good faith but are ultimately subjective or arbitrary (Silberzahn et al., 2018). It also raises the possibility that researchers will make choices that (arbitrarily) lead to their preferred result (Simmons et al., 2011).
Uncertain choices introduce uncertainty into the conclusions of an analysis wherever such conclusions depend on them (or combinations of them). This uncertainty can affect both research practitioners - who may be unaware of the particular decisions on which their results depend, and research consumers - who may be blind to the potentially contradictory results that the analyst would have arrived at using alternative (but defensible) strategies (Steegen et al., 2016; Young and Holsteen, 2017).
The Scale of Methodological Uncertainty
Consider, the (not implausible) situation in which an analyst must make ten choices in order to conduct their analysis (e.g. in preparing data and specifying a model) each of which corresponds to a decision between two options, both of which are reasonable. This situation defines a space of 210, or 1024, unique and defensible analytical strategies (Young, 2018: 4). With 20 decisions, this rises to more than 1 million unique analytical strategies.
The consequences of this uncertainty in practice are evidenced by applied methods research. In the ‘Many Analysts, One Data Set’ study (Silberzahn et al., 2018), independent research teams were shown to produce widely divergent estimates of the relationship between player skin-tone and referee red-card decisions in soccer, using the same dataset and a relatively simple shared research question. This kinds of divergence may be even greater in the case of complex data and harder-to-define research questions (Silberzahn et al., 2018).
Methodological uncertainty is also not, necessarily, eliminated by statistical expertise, since in an applied setting there can be irreducible uncertainties that make a range of analytical choices potentially justifiable (Simonsohn et al., 2015; Young and Holsteen, 2017), especially in the choice of control variables (Clarke, 2005, 2009; Clarke et al., 2018). Neither is the problem eliminated by reference to principles such as selecting the best predictive model (e.g. through model fit or cross-validation). The model features optimized by predictive modelling are not necessarily those which best estimate causal effects for particular variables (Young, 2019) – which is frequently the goal of quantitative sociological research. Silberzahn et al. (2018) found that researchers with high levels of experience and expertise still varied considerably in their methodological choices, with correspondingly substantial variation in estimates for a single research question.
Despite the scale of the threat that methodological uncertainty may pose for quantitative sociological practitioners, reliance on a small number of (potentially arbitrary) analytical strategy (perhaps with a small ‘curated’, Young and Holsteen, 2017: 6, set of robustness checks alongside) remains standard in the quantitative sociological literature. This, combined with the relative novelty of general methodological proposals seeking to address methodological uncertainty (see below), suggests that many practitioners may remain unaware of the extent of the threat of methodological uncertainty, or unsure how to integrate this awareness into their research practice.
A Case-Study Addressing Methodological Uncertainty Through a ‘ Multi-Strategy’ Approach
A number of proposals have recently emerged which seek to address methodological uncertainty through a type of approach that we refer to as ‘multi-strategy’ analysis (Patel et al., 2015; Simonsohn et al., 2015; Steegen et al., 2016; Young and Holsteen, 2017) 1 . A multi-strategy analysis is broadly defined by a set of procedures that address methodological uncertainty by exploring a wide range of plausible analytical strategies, defined in terms of the different combinations of methodological choices that are considered reasonable.
Briefly (details below), a large set of plausible and defensible analytical strategies are identified, including uncertain choices about data construction (e.g. variable definition) and modelling (e.g. control variable selection). Typically, this set of strategies will be ‘orders of magnitude’ (Simonsohn et al., 2015: 18) larger than the set of possibilities covered by traditional robustness checks. Each of the strategies in this large set is then ‘executed’ (i.e. run by a computer to produce an estimate), and then the results are collated to assess the overall robustness or fragility of findings, and to identify methodological choices that play a key role in determining the results. One might find, for example, that one’s estimates vary substantively across different strategies, and are particularly sensitive to how one defines a particular variable.
As discussed further below, multi-strategy analyses offer a way for practitioners to identify and manage problematic sources of methodological uncertainty in their analyses. They also allow practitioners to assess the methodological robustness or fragility of particular quantitative conclusions. Yet, despite the potential benefits of the approach, applications of multi-strategy analysis remain rare within the applied sociological literature.
This situation may partly reflect both the relative novelty of the multi-strategy approach and the conceptual fragmentation of its description across different proposals. Despite sharing a core ‘logic’, existing proposals:
– appear under a variety of names (including vibration of effects, Patel et al., 2015; multiverse analysis, Steegen et al., 2016, and specification curve analysis, Simonsohn et al., 2015),
– use different labels for the underlying problem of methodological uncertainty (including instability, Patel et al., 2015; model uncertainty, Young and Holsteen, 2017, and arbitrary decisions, Simonsohn et al., 2015),
– are associated with different disciplines (including sociology, Young and Holsteen, 2017; psychology, Steegen et al., 2016, and epidemiology, Patel et al., 2015),
– emphasise different areas of methodological uncertainty (e.g. data construction, Steegen et al., 2016, vs. control variable selection, Patel et al., 2015),
– focus on different kinds of data (e.g. experimental, Simonsohn et al., 2015 vs. observational, Young and Holsteen, 2017),
– and differ in the way that they evaluate and investigate the results of the multi-strategy analysis (e.g. Simonsohn et al.’s, 2015 specification curve visualization, vs. Young and Holsteen’s, 2017, influence regression).
In this article, we aim to further promote sociological practitioners’ awareness of the general problem of methodological uncertainty and the capacity of multi-strategy approach(es) to help address it. We also aim to contribute to the ongoing development and critical discussion of this class of approach, and its integration into sociological research practice.
We employ a case study of the multi-strategy approach, applied to a substantive sociological research problem at the intersection of class, social mobility and social policy: estimating the long term effects of the UK government’s 1980s Youth Training Schemes on occupational mobility.
We identify key areas of methodological uncertainty in our research problem that are common in sociological analyses of this kind, and we highlight the associated accumulation of analytical possibilities and uncertainty in the results. We employ generic terminology to describe the multi-strategy approach, and we emphasise the core elements of its logic and structure. This structure and logic broadly apply across existing proposals. Our focus on the core structure of the approach also allows us to critically discuss the range of implementation options available to practitioners at different stages of a multi-strategy analysis. Furthermore, we aim to contribute to the ongoing development of multi-strategy analysis, by proposing new techniques for various stages of the approach, such as the use of the RPART algorithm for the sensitivity analysis stage.
In the following section, we outline the general structure of the multi-strategy approach. Then, we outline the background of our case-study topic and research problem. Subsequently, we demonstrate (and discuss) the application of multi-strategy analysis to this research problem. This demonstration is divided into stages reflecting the structure of a multi-strategy analysis (see below): designing the strategy space, producing estimates at each point in the strategy space, assessing the robustness of the results, and sensitivity analysis of the strategy space.
At the end of the article, we discuss general issues likely to be of key interest to practitioners unfamiliar with multi-strategy approaches (including some queried by reviewers of early versions of this manuscript). These include the risk that methodological fragility poses for sociological practice, as well as the role that multi-strategy analysis might play in reducing (rather than simply identifying) that fragility. We also highlight the limitations of the approach, including its inability to remove other kinds of uncertainty (e.g. sampling uncertainty) and the difficulty of exhaustively establishing methodological robustness for a given analysis.
Multi-Strategy Analysis
As noted above, recent proposals advocating for a multi-strategy approach vary in the details of their implementation, and in their terminology. However, the following four activities arguably constitute the core structure of the approach.
First, there is the design of the strategy space. 2 This is the selection of a set of alternative analytical strategies to be considered. Here, the analyst identifies a set of decisions that need to be made in the course of an analysis. This may include decisions about the definition of key variables, the selection of control variables, and so on. Then, for each of these decisions, the analyst considers whether there is more than one plausible (and theory congruent) choice that could be made. In other words, they consider whether they are uncertain about the decision in question. Where there is more than one plausible choice available for a given decision, this set of alternatives is incorporated as an ‘ingredient’ in the strategy-space (Young and Holsteen, 2017: 10). A single analytical strategy within the strategy space is, therefore, defined by the selection of one option for each of the uncertain decisions that were identified. The overall strategy space will then be the set of all possible combinations of the uncertain alternatives considered by the analyst (less any combinations that are implausible, incoherent or redundant).
Second, there is the estimation of the quantity of interest (such as the causal effect of a variable) at each point in the strategy space. In other words, an analysis is run for each analytical strategy, producing a (large) set of alternative estimates. In practice, this step requires computational tools to automate the estimation, because (as we demonstrate below) even with a limited number of uncertain decisions, the size of the strategy space quickly grows to many thousands of estimates.
Third, there is the examination of the set of estimates produced by the strategy space, and an assessment of the robustness or fragility of the results found. As we discuss later in this article, it is not obvious how this assessment should be carried out, and indeed it may depend on the specific goals of the research. However, it will certainly involve an examination of the spread and location of the set of results estimated (i.e. their distribution). Crucially, the analyst will need to decide whether there is a meaningful interval of estimates that is robust across the different analytical strategies that they considered. If there isn’t, or if the analyst still considers the divergence between estimates to be unacceptably high, then, they will move to the fourth step: a sensitivity analysis.
The sensitivity analysis stage of a multi-strategy analysis involves examining how estimates differ across different analytical strategies (in the strategy space), and trying to attribute these differences to particular decisions (or combinations of them). As we discuss later in the article, making these attributions can be challenging, especially when the number of decisions (and alternatives) to be considered is very large. Notwithstanding, the aim of the analysis at this stage is to identify decisions which are responsible for the fragility in the results. It is these decisions which require particular attention, and potentially, adjudication. 3
Case Study Background: Estimate the Long-Term Impact of 1980s UK Government-Sponsored Youth Training
Large-scale government intervention in the British youth employment market occurred in the 1980s in the context of recent economic recession and high youth unemployment (Furlong et al., 2018). The largest and most prominent of these initiatives: the Youth Training Scheme (YTS), was implemented in 1983 and ended in 1990 (Lourie, 1996, replaced by ‘Youth Training’). The scheme placed school-leavers and unemployed youth into placements involving (typically) work-experience, on-the-job training and off-the-job training (Lee et al., 1990). The UK government subsided the training and work experience of participants, including by providing them with a small living allowance (Bradley, 1995). However, the scheme itself was typically implemented by local third-party for-profit agencies (who sourced work experience and training) or local businesses (who provided work-experience and on-the-job training in-house) (Lee et al., 1990).
Of particular interest, from a sociological perspective, is the impact of the YTS on the occupational mobility of youth that participated in it. Providing training and work experience for unemployed youth was considered both a strategy for unemployment relief and a strategy for providing vocational education. These concepts intersect at the idea of providing opportunities for young people to gain marketable skills (Lee et al., 1990) that would provide access to skilled work (Roberts, 2005). Furthermore, positive claims about schemes like YTS emphasize that it provided opportunities to young people that they otherwise would not have had. Yet, while there have been a number of attempts to estimate the impact of 1980s youth training on the employment and earnings of youth, there has been no attempt to estimate its long-term impact on occupational mobility (to the best of our knowledge).
We targeted this (hitherto neglected) research question for our case-study. Specifically, we sought to examine the long-term impact of participation in 1980s youth training on the likelihood that youth from a skilled-manual, low-skilled or unskilled parental occupational background would enter an occupational class that was skilled (or above). For our analysis, we relied on publicly available data from the 1970 British Cohort Study. This survey is primarily a longitudinal study of all babies born in England, Scotland and Wales in a particular week in April of 1970. We relied on information collected up to age 16 about cohort-members’ educational attainment and socio-economic background (sweeps in 1970, 1975, 1980 and 1986), as well as information about cohort-members’ later career outcomes, as measured in subsequent surveys. For the latter, we used the Activity History Dataset 2013, derived from BCS70 surveys, which details participants’ labour market status in each calendar month from April 1986 up to April 2013.
Prior Uncertainty About the Impact of the YTS
There is considerable uncertainty about the long-term impact of the UK’s 1980s youth training schemes.
Supporters of the YTS saw it as reforming and legitimizing vocational education in a way that would offer a ‘bridge’ to skilled-work for its participants. However, critics cite the poor quality of training provided to many participants, especially in low-skilled sectors (Lee et al., 1990; Roberts and Parsell, 1992). They argue that the nature of placements was highly stratified, such that only those with pre-existing educational and social advantages were likely to obtain placements which generated employment opportunities or provided marketable skills (Furlong, 1993). According to this characterization, participation in the scheme may have harmed the employment prospects of disadvantaged participants: by confining them to poor-quality employment sectors, or because of the stigma associated with failing to secure continued employment with a placement provider.
Past analyses of the effects of the schemes on employment and earnings have produced somewhat diverse and even contradictory estimates. Main and Shelly (1990), for instance, found that YTS participation improved the probability of finding employment, while Dolton et al. (1994) and Dolton et al. (2004) found some evidence of negative effects on men’s employment, and Dolton et al. (2001: 409) concluded that YTS might have had no effect on the probability of employment at age 23-24. There is also some evidence that effects were heterogeneous across different subpopulations (O’Higgins, 1994), including between men and women (Dolton et al., 1994, 2004).
These considerations indicate that a wide spectrum of estimates of the long-term impact of youth training are conceivable, including negative and positive effects, as well as no effect. In turn, this highlights the importance of considering the role that methodological fragility might play in attempts to estimate that impact using quantitative methods – since few estimates can be ruled out prior to analysis.
Part One: Designing the Strategy Space
The first step in applying the multi-strategy approach is to identify the set of uncertain decisions that should be included in the strategy space. For our case study, we didn’t try to exhaustively identify every single area of potential uncertainty in the analysis (see Discussion). For instance, we didn’t consider alternative occupational classification schemes. Rather, we focused the case-study on the discussion of key areas of uncertainty that are ubiquitous in quantitative sociological research. In particular, we focused on uncertainty around selecting an estimation procedure, selecting control variables, defining key variables, missing data, and heterogeneity of effects across subpopulations.
Selecting an Estimation Procedure
The quantity of interest in our analysis was the (average) effect of government-sponsored youth training on the occupational mobility of young people from a working-class background. More specifically, we sought to estimate a causal risk difference, representing the effect of participation on the probability that a young person would work predominantly at a skilled level or above during a specific period later in their career. Since our analysis was focused on the effect of participation on those who participated, we sought to estimate the average treatment effect on the treated, or ATT.
When estimating the causal effect of an intervention or policy of this kind, it is common to employ a regression model, which includes a dummy-variable representing participation (alongside control variable, see below). For a binary outcome like ours (see below), logistic regression would be the standard choice 4 . A number of past studies of the effects of the 1980s Youth Training Schemes on other outcomes (e.g. earnings and basic employment status) have estimated its effect in a regression framework, after controlling for a number of potential economic or socio-demographic confounds (Dolton et al., 1994, 2001; Furlong, 1993; Main, 1991; Main and Shelly, 1990; Whitfield and Bourlakis, 1991).
However, procedures other than regression are available. Comparison of matched groups, known as matching, represents a distinctive option in which participants are systematically paired with non-participants who have similar characteristics (especially on potential confounding variables, Sekhon, 2011; Stuart, 2010). Through this approach, a ‘treatment’ and ‘control’ group (e.g. based on the matched pairs) are formed. These groups are intended to be ‘balanced’ on relevant covariates, such that average differences between them can be attributed to the effects of the ‘treatment’ (e.g. intervention participation). This procedure has close analogies with a randomized control trial (RCT), which aims to achieve balance through the randomization procedure itself (Imai et al., 2008). Some methodologists have also recommended combining regression and matching, by conducting regression on matched datasets, to adjust for remaining imbalances between treatment and control groups (Stuart, 2010). Although past studies estimating the impact of Youth Training Schemes have typically used some form of regression, at-least one past study has used a matching approach (Dolton et al., 2004).
The availability of multiple plausible estimation procedures creates an immediate source of methodological uncertainty. There is no guarantee that procedures based on comparisons of matched groups will arrive at the same estimate as those produced through regression analysis, or that estimates produced by one procedure will be universally superior to those produced by another. As such, the potential dependence of the results of the analysis on a choice between these procedures is a cause for concern. To complicate matters further, there are a great many matching procedures available. Many of these come with multiple implementation options that may also affect their conclusions – creating further methodological uncertainty 5 .
Within a multi-strategy approach, one can seek to manage uncertainty of this kind, by incorporating a selection of plausible estimation procedures into our strategy space. Yet, to the best of our knowledge, ours is the first demonstration of the integration of both regression and matching estimation procedures into the strategy space of an explicit multi-strategy analysis (but see Brand and Halaby, 2006, for a past comparison of matching and regression on a shared research question).
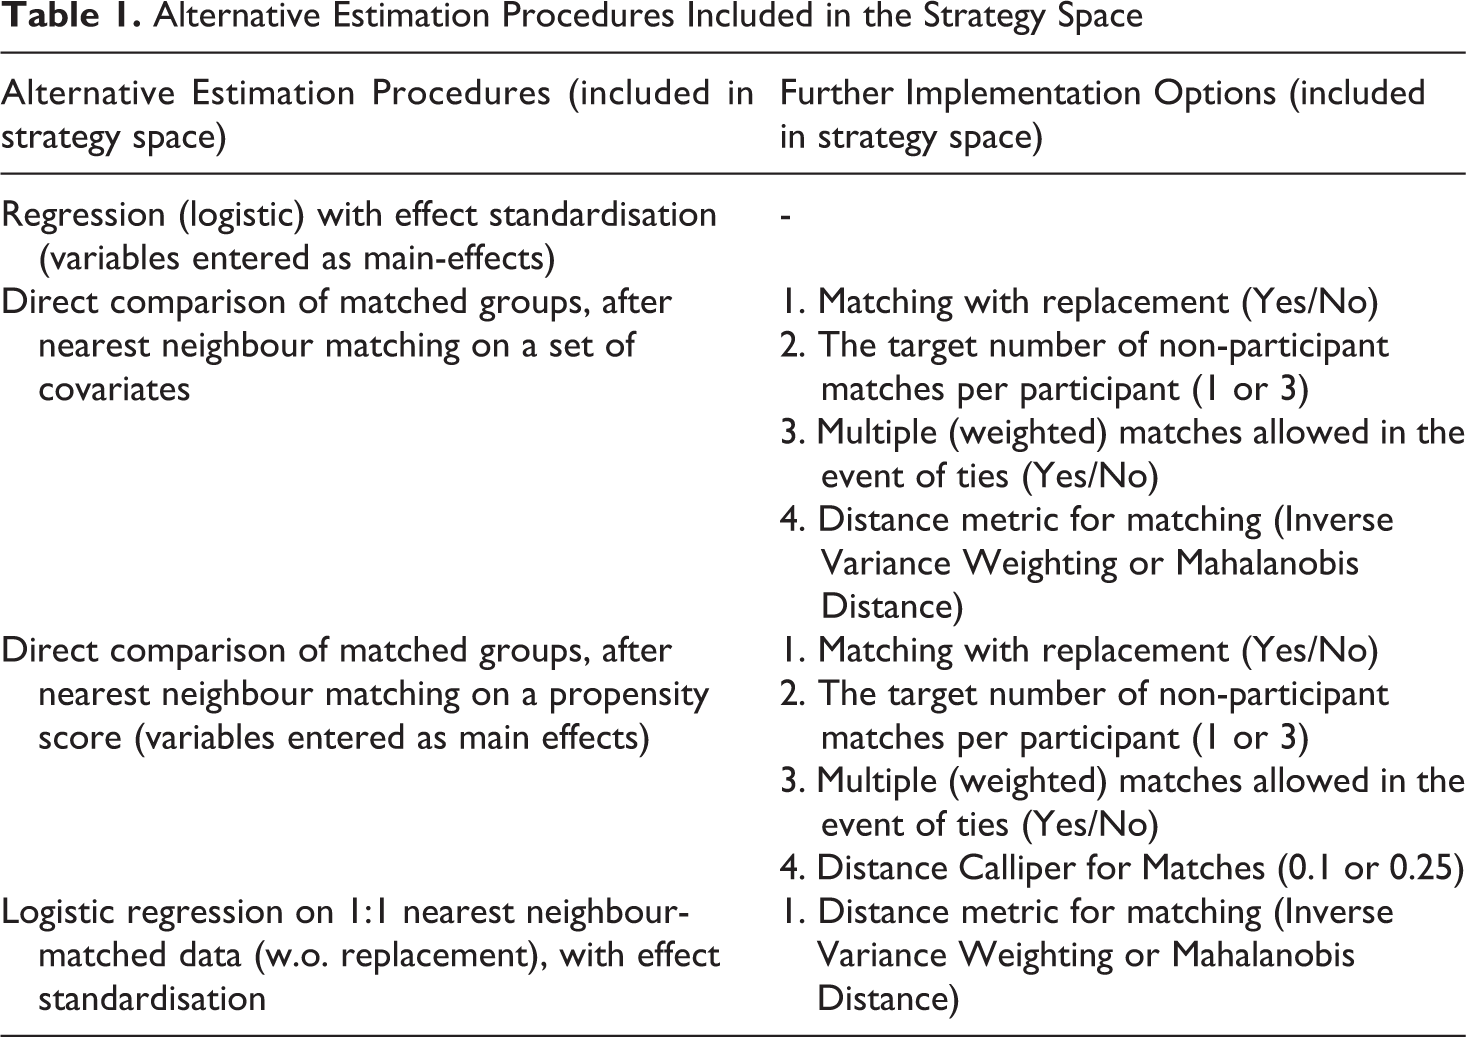
For our case-study analysis, we included four general procedures to estimate our causal effect of interest. We also included a range of implementation options, as summarized in Table 1. Further details of the procedures used are given in Appendix C1. 6 These selections added 35 distinct plausible estimation procedures to our strategy space.
Alternative Estimation Procedures Included in the Strategy Space
Selecting Control Variables
In any causal analysis of observational data, choosing control variables is a crucial and contested activity. As noted above, the general aim is to adjust/control for confounding influences: variables which influence both intervention participation and the potential outcomes of interest. If all relevant confounding variables are known and available in the dataset, then this adjustment can be achieved by including the relevant variables in the estimation procedure (regression model, matching algorithm, etc.). However, the situation more commonly facing the analyst is that it is not known what all the relevant confounds are, nor whether they are all observed in the data (Clarke, 2005). Faced with this uncertainty, there are few unambiguously safe strategies for the selection of control variables.
Traditional methodological advice has been to do as well as possible by including all potentially relevant controls in the dataset. However, Clarke (2005), Clarke (2009), York (2018) and Young (2019) argue that this is not a safe strategy. In the case in which some but not all of the relevant confounds are observed in the data, adding even a ‘relevant’ control to the analysis may actually increase rather than decrease bias in the causal effect estimate. Clarke et al. (2015, 2018) show that this problem carries over from traditional regression analysis to matching as-well.
Certain proponents of multi-strategy analyses have de-emphasised alternative sets of control variables as an ingredient in the strategy space (Simonsohn et al., 2015: 6), arguing that this reflects a substantive theoretical commitment, not an ‘arbitrary operationalisation’. Others have emphasized the selection of control variables as a crucial (Young, 2019; Young and Holsteen, 2017), or even primary (Patel et al., 2015) elements of the strategy space. We favour these latter perspectives, at least as a starting point for practitioners. Arguments presented by Clarke (2005) and others (see above) support the notion that in practice, there are uncertainties about control variable selection that are not easily resolved by prior theory.
Young (2019: 8) proposes that uncertainty about control variable selection should be addressed in a multi-strategy context as follows: only ‘the most compelling and best understood controls’ should be considered indispensable (always included). Other merely plausible controls should be considered to be uncertain (and therefore varied within a multi-strategy analysis). A similar approach is associated with extreme bounds analysis (Leamer, 1985), in which a certain set of controls are considered fixed, whilst others are varied across different possible model specifications. Patel et al. (2015) follow a similar approach.
We believe that this is a reasonable approach, at least as a starting point for the analyst. Given the potential for ‘unknown unknown’ (Clarke et al., 2018: 10–11) confounders in an observational setting (variables which are not measured, and whose confounding influence is not anticipated by the analyst), Young’s (2019) approach may strike a pragmatic balance between considering all possible sets of controls (which would involve implausible analyses in which known important controls are deliberately excluded) and a traditional analysis which includes all possible controls (but which fails to consider plausible alternative specifications which omit certain controls).
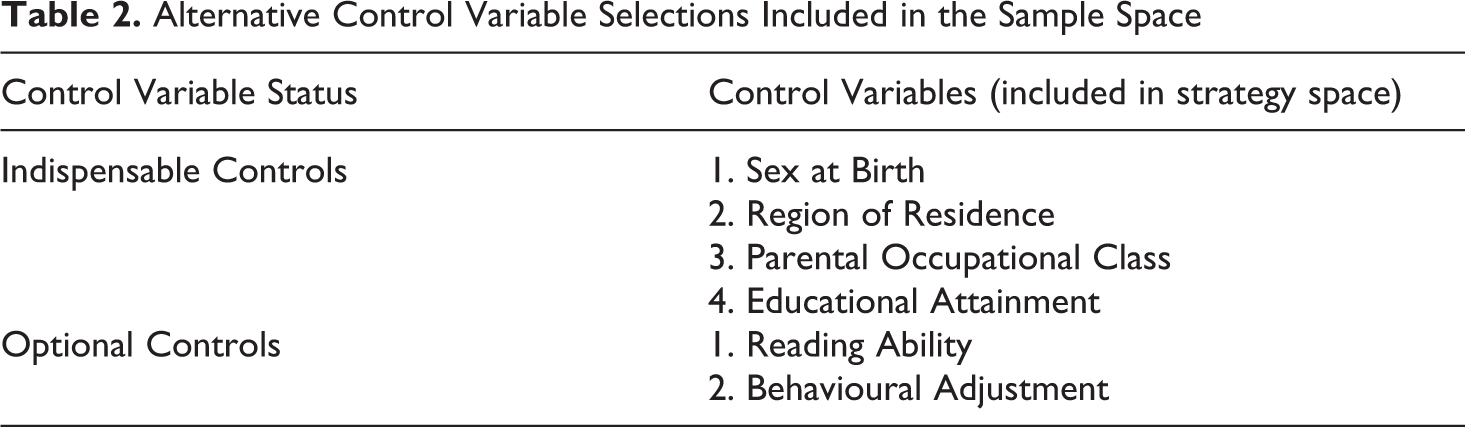
For our case-study analysis, we chose four control variables that could be considered indispensable because of their direct connection to both youth training participation and subsequent employment (see further discussion in Appendix C2A). These indispensable controls were regional location, gender, prior educational attainment and parental occupational class. These four controls were included in all of the analyses (i.e. as matching covariates, or regression controls, or both). Two other variables were identified as merely optional plausible controls, because their role as confounders is much less clear, although similar constructs have been selected as controls in previous evaluations of the YTS schemes. These plausible controls were numerical scales indicating reading ability and behavioral adjustment (see Appendix C2B). These selections are summarized in Table 2. These optional controls added four additional ‘conceptual’ sets of alternative controls to the strategy space. However, as we discuss in the next section, the actual range of alternative control variable sets to be considered was much larger after one takes into account plausible alternative definitions (i.e. operationalizations) of the variables in question.
Alternative Control Variable Selections Included in the Sample Space
Defining/Operationalizing Variables
In a given analysis, there may be considerable uncertainty about how key variables are to be defined. The analyst may have to decide whether to treat a variable as continuous or categorical, what relevant cut-offs or thresholds are, which observed values fall within particular theoretically-informed classifications, and so on. Also, as was the case in our analysis, more than one conceptually similar alternative measure may exist in the data.
Choices between these alternatives can also be complicated considerably by uneven item non-response. When particular measures in a data-set have high non-response, then the analyst’s choice to include them may significantly alter (i.e. reduce) the available sample – creating further questions about whether missing values should be imputed, and so on. All such choices are potential sources of methodological uncertainty for the practitioner, that can be incorporated into the strategy space.
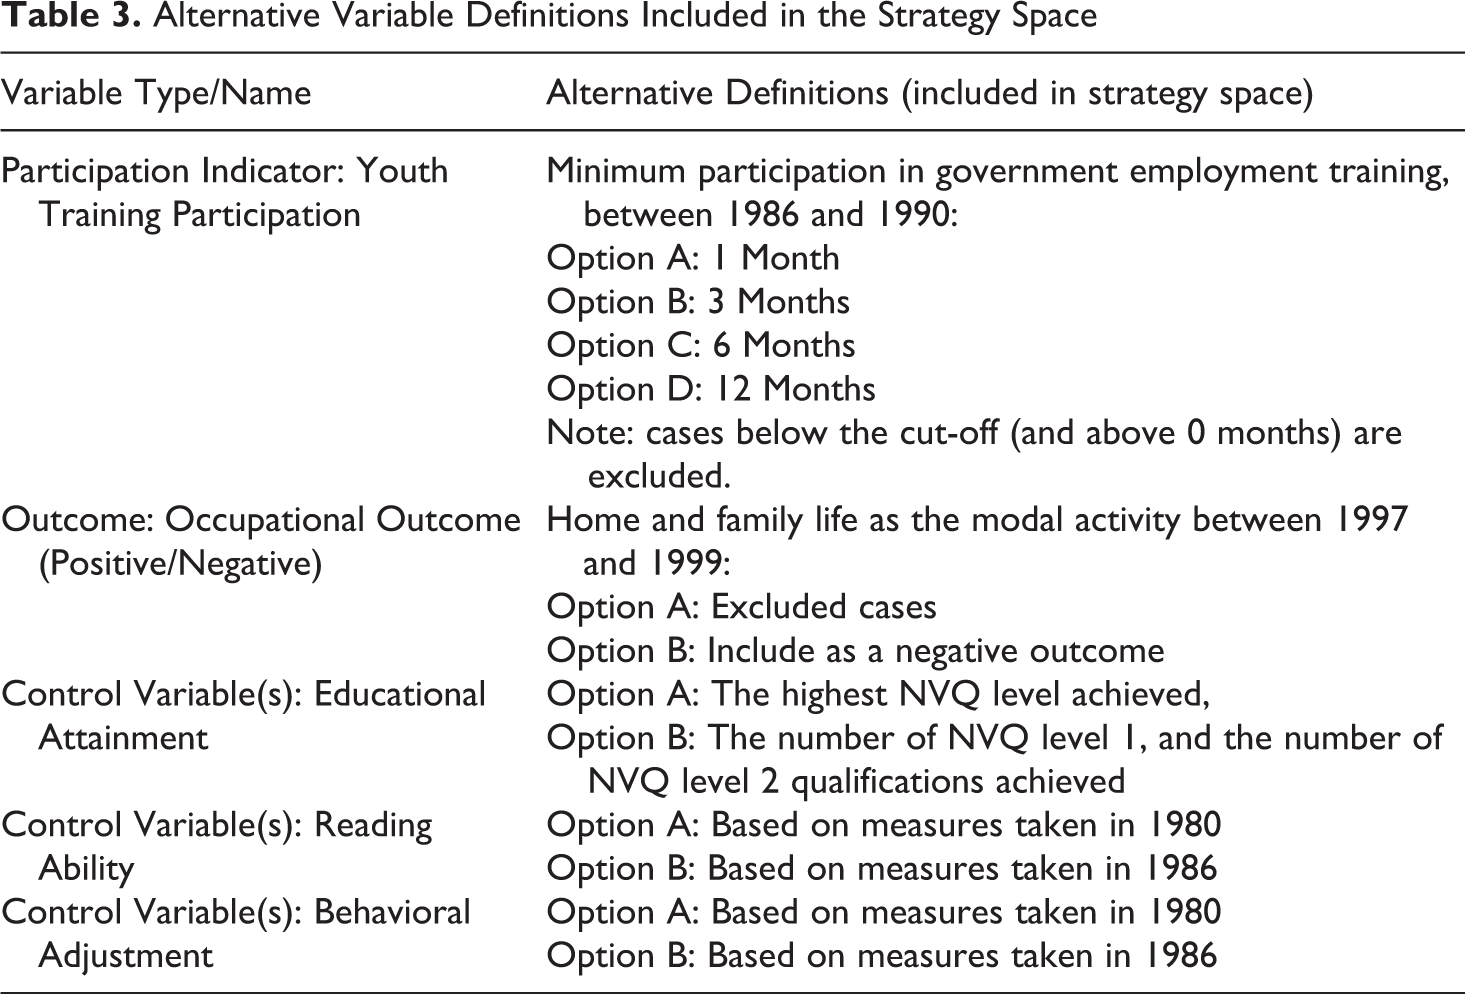
For our case study, we considered uncertainties that arose in the definition of the treatment indicator, the outcome variable and control variables. The latter was entangled with problems of item non-response (see Missing Data). The alternatives that we included our strategy space are summarized in Table 3, with further discussion of the relevant issues in subsequent sections.
Alternative Variable Definitions Included in the Strategy Space
Defining Career Outcomes
Our outcome of interest was long-term occupational mobility. 7 This implies a need to classify the occupational class of the later careers of the participants and non-participants in our dataset. The available data included monthly activity statuses for BCS70 cohort members from 1986 to 2013, including information on the occupational class of that activity (where applicable).
We made a number of fixed assumptions (although these might be varied in more comprehensive multi-strategy analysis, see also Discussion and Conclusions): To avoid the potential sensitivity of career-outcome classification to short-term fluctuations in respondents’ labour-market status, we focused on characterizing career outcomes in terms of at least two years of labour-market activity (24 monthly activity statuses). Given our interest in long-term outcomes, we only considered temporal intervals that started at least ten-years after participants finished compulsory schooling (aged 16). We chose the period between December 1997 and November 1999 because a large number of cases had labour market activities for all of these months recorded in the 2013 BCS70 Activity Histories dataset, for this period. Cases were classified in terms of their modal activity during the two years, which reflected the relative homogeneity of participants’ activity statuses in the data for this period. Cases were further classified as either
One assumption about defining career outcomes was identified as a particular source of methodological uncertainty: the classification of participants for whom ‘home and family life’ was the modal activity later in their careers.
Looking after home and family was a modal activity for quite a substantive minority (mostly women) of our available sample (n=316, see Appendix B). On the one hand, this might be considered a freely chosen alternative to employment which is outside the scope of either the failure or success of government employment training initiatives (meaning that such cases should be excluded). On the other hand, this outcome might mask employment difficulty—including difficulty faced by mothers who have been unable to return to the labour market after child-care. Ignoring this outcome might, therefore, neglect the meaningful effects of the government training schemes on participants career outcomes. In order to address this uncertainty, we included alternative definitions of career outcomes in our strategy space. One definition excluded home-and-family cases; another classified this as a negative outcome.
Defining Government Training Scheme Participation (Treatment)
We faced additional uncertainty in our definition of ‘treatment’ participation. Dolton et al. (2004: 14) defined a young person as a participant in government-sponsored youth training if they were recorded as participating for at least one month. 10 However, alternatives to this strategy are defensible. One might argue, for instance, that one month of activity is insufficient to consider a person as ‘participant’ in a government training scheme (which were intended to last one or two years). On the other hand, from an ‘intention to treat’ perspective, early drop-outs are a feature of such schemes, potentially representing a failure by the state to render tolerable assistance to young people (in other words, outcomes for early drop-out participants arguably still ‘count’, for or against such programs).
To manage this uncertainty associated with ‘treatment’ definition, we included possible cut-offs at one month, three months, six months and 12 months in our strategy space, with participants below the cut-off excluded from the analysis. We counted any government-sponsored training of BCS70 members between September 1986 and May 1990 (aged 20).
Defining Control Variables
We identified a number of uncertainties associated with the definition of control variables in our analysis.
Dolton et al. (2004) classified the educational attainment of youth training participants in terms of the highest NVQ level that they had achieved. This was either no qualification, Level 1 qualification (CSE grade 2 and below, or equivalent), or Level 2 qualification (CSE grade 1 and O-Level, or equivalent). This may reflect the key features of educational attainment, from the perspective of intervention participation and career outcomes. However, one clear alternative would be to control for the number of qualifications (at each level) that participants achieved. To address this uncertainty, we included both definitions of educational attainment in our strategy space.
When assessing our definitions of reading ability and behavioural adjustment, there were two measures available, one taken in 1980, and another in 1986. In principle, the 1986 measures were more desirable. They represented the characteristics of respondents around the time they became eligible to participate in government training. However, the 1986 sweep of the British Cohort Study had particular problems of non-response, limiting the availability of the 1986 measures in our sample to a greater extent than the 1980 measures. This created uncertainty about the choice between substantial restriction of the available sample (when using the 1986 measure), and the use of a potentially inferior measure (the 1980 measure). To ensure that our analysis managed the potential dependency of estimates on the choice between these two possibilities, we included both the 1980 measures and 1986 measures as alternatives in our strategy space.
Missing Data (and Entanglement with Variable Selection)
Sociological practitioners frequently work with datasets in which there are high levels of missing data (e.g. due to survey nonresponse, attrition, etc.). Surveys of other fields suggest that the response from practitioners is typically to exclude cases which have missing data on one or more of the variables needed for the analysis (Eekhout et al., 2012; Peugh and Enders, 2004), sometimes called list-wise deletion, or complete-case analysis (if completeness is defined with respect to the desired variables). This exclusion may be explicit, or it may be implicit (i.e. performed automatically by the software tool being used). In the common scenario of estimating the causal effect of a particular variable, given an adequate set of control variables, this practice will be more or less justified depending on the structure of the data-generating process, the missingness mechanism and the target of inference (see Daniel et al., 2012, and Kohler et al., 2019, for a discussion of some of the subtleties).
The general problem of missing data is complex and beyond the scope of this paper. It has also, surprisingly, seen little discussion in recent proposals for multi-strategy analyses. One of the reasons that we highlight the missing data problem here is because of its potential entanglement with other aspects of methodological fragility. In practice, item non-response is often unevenly distributed across variables in a dataset. This means that including a particular control variable can mean restricting the number of complete cases available for the analysis. This can place the analyst in the unfortunate position of choosing between altering the composition of their sample (and discarding data) or excluding the desired control. This was the case in our dataset, where a number of variables, including educational attainment and reading ability, had high levels of item non-response. In fact, under complete case analysis, our available sample of youth training participants could vary from over 400 cases to well below 100, depending on which controls were selected, and how variables were defined (see above).
For our case study analysis, we considered two possible strategies for handling missing data in our strategy space. One was to proceed with complete case analysis. Another was to use random-forest imputation (Stekhoven and Bühlmann, 2011) of missing values on the control variables, such that all cases for which treatment and outcome variables were observed (and met inclusion criteria) could be included in the analysis (see Appendix C5).
Potential Heterogeneity of Effects
If the average causal effect of an intervention is estimated across a whole sample, then this will represent (an estimate of) the average effect across the units in the sample (Kohler et al., 2019). However, this aggregate indicator may be misleading if the average effect is relatively heterogeneous across different meaningful subpopulations represented in the sample (e.g. men or women). It is possible (for instance) that intervention (on average) helped some subpopulations represented in the sample, whilst hurting others. Furthermore, the analyst may be uncertain about whether such non-uniformity exists, and if so, what the relevant subpopulation distinctions are.
This uncertainty can be managed to some extent within a multi-strategy analysis by repeating all analyses for each one of a variety of potentially relevant subpopulations represented in the data 11 . In our analysis, we had reasons to suspect (noted previously) that the effect of government-sponsored youth training might vary between the sexes or between participants of different prior educational attainment. In order to address this uncertainty in the analysis, we repeated all analyses (i.e. the entire strategy space) across subpopulations defined by these characteristics (alongside analysis for the whole sample). We distinguished between Men, Women, those with no-qualifications recorded at 16, those with an NVQ Level 1 qualification (but no NVQ Level 2) and those with at least one NVQ Level 2 qualification.
Summary of the Strategy Space
After identifying key alternative options for selecting an estimation procedure, control variable selection, variable definition/operationalization, missing-data handling, and sub-population distinctions, we defined a strategy space in terms of the possible combinations of these options. Certain combinations were redundant (e.g. different definitions of educational attainment among the sub-population with no-qualifications). After removing these combinations, we were left with a set of 45,360 unique analytical strategies for estimating our causal effect of interest. Readers may be surprised by the large size of this space, given that we are still far from an exhaustive list of plausible options. However, this reflects the rapid way in which analytical possibilities scale with the number of choices considered, as Table 4 illustrates.
Summary of the Strategy Space
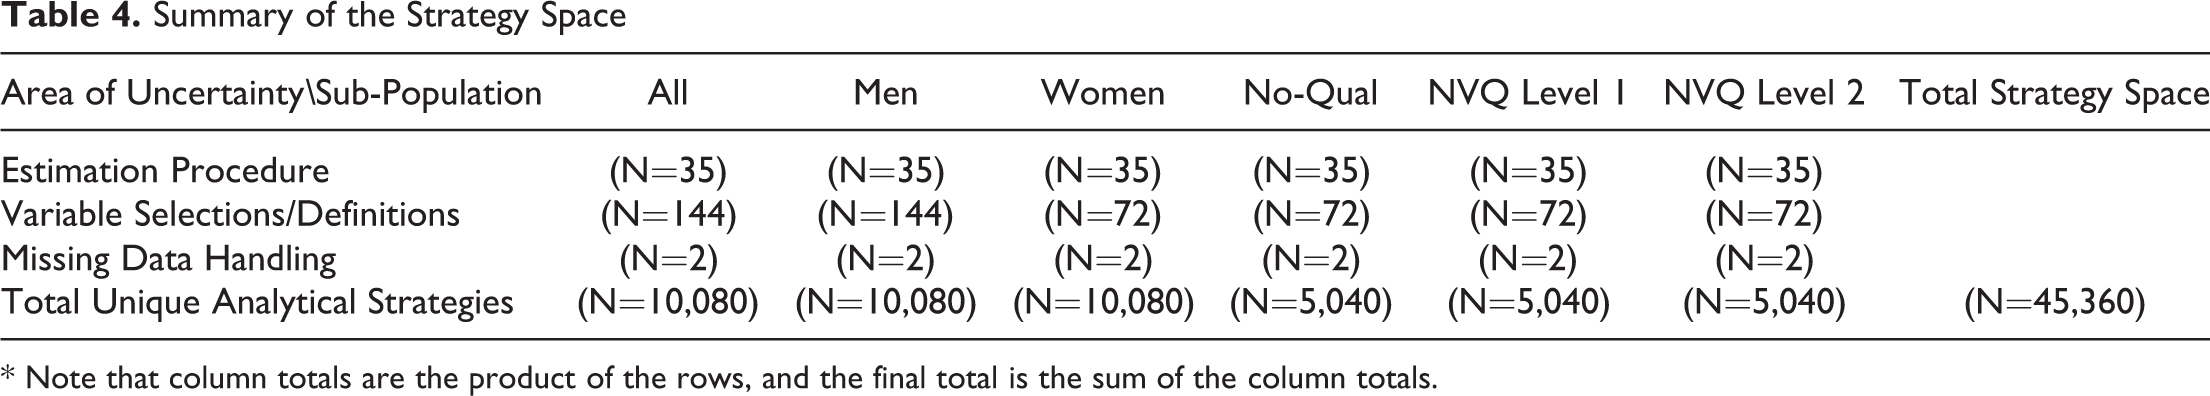
* Note that column totals are the product of the rows, and the final total is the sum of the column totals.
Part Two: Estimation at Each Point in the Strategy Space
To estimate the quantity of interest (the long-term impact of youth training on occupational mobility) using each analytical strategy defined in our strategy space, we developed a custom R script. This script iterated over each alternative analytical strategy (defined in terms of the set of options chosen) and recorded the estimate (a causal risk difference) produced by this strategy. Further details of the relevant software libraries that we employed (e.g. for matching) are given in the Appendix C. Out of the 45,360 analyses run, 80 estimates had to be dropped because of rank-deficiency of the relevant regression fit.
A smoothed kernel density plot of the raw distribution of estimates produced for each sub-population group (across all of the analytical strategies), is displayed in Figure 1. There is some visual ‘convergence’ of sets of estimates for certain subpopulations (e.g. those with no qualifications) around a negative effect. However, as we discuss in the next section, an assessment of whether this suggests a methodologically ‘robust’ result is not trivial.
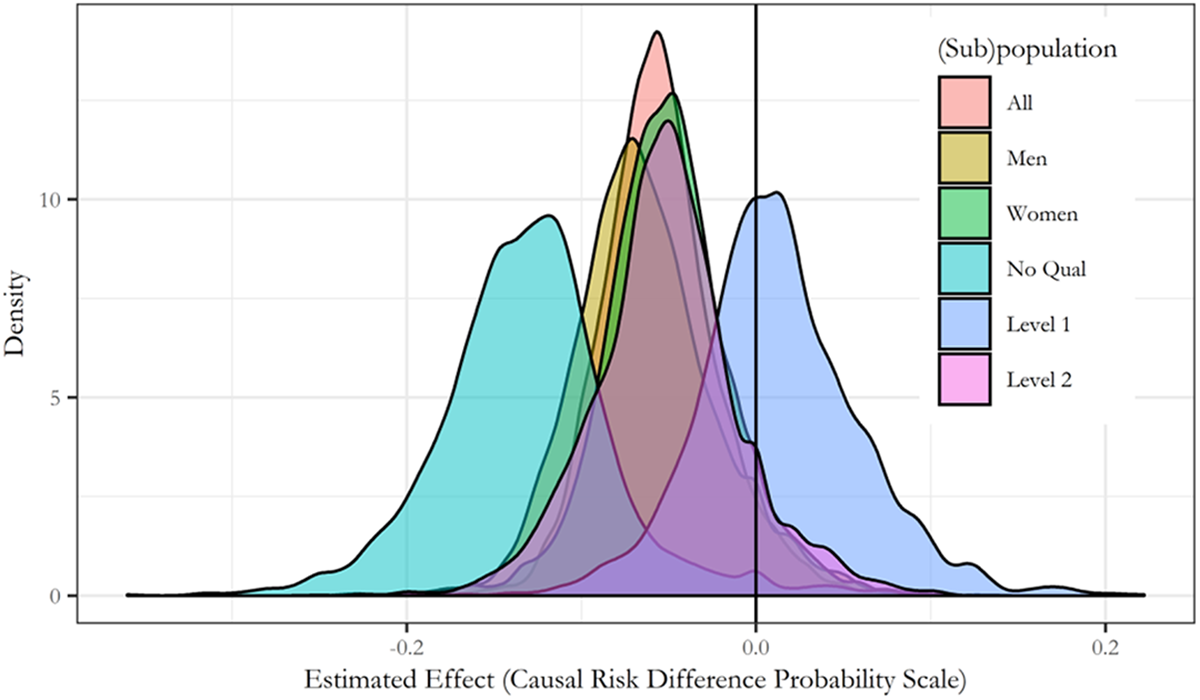
Raw Distribution of Estimates Across the Strategy Space (Kernel-Smoothed Density)*. *Estimates of the average treatment effect on the treated (ATT) of YTS participation on occupational mobility. Effect estimates are casual risk differences on the probability scale (e.g. -0.2 corresponds to an estimated 0.2 decrease in the probability of positive occupational outcome caused by YTS participation)
Part Three: Assessment of Methodological Robustness
Having estimated our effect of interest at each point in the strategy space, we turn to the question of assessing the robustness of our estimates across that space. Heuristically, there were two possibilities to be evaluated here.
One possibility was that our estimates would not depend substantively on the methodological choices considered in our strategy space. In other words, the different analytical strategies could have converged to a narrow interval of results, regardless of the methodological alternatives considered. If this were the case, then we might conclude that methodological uncertainties considered in our analysis are of limited concern – i.e. our results do not appear to depend on them and are methodologically ‘robust’ (with respect to the alternatives considered).
Another possibility was that our estimates would depend strongly on the particular methodological choices considered in the strategy space. Rather than converging on a particular estimate, our results could have diverged across the different strategies – potentially resulting in contradictory estimates under different plausible analytical strategies. In this case, the results of our analysis would have been shown to be methodologically fragile – i.e. strongly dependent on choices about which we expressed uncertainty. In cases of this kind, the source of this fragility would need to be identified (see Part Four) and addressed for the analysis to proceed to a conclusion – if appropriate (see Discussion and Conclusions).
While this conceptual goal (to assess robustness/fragility) is straightforward to articulate, operationalizing that assessment is less simple. A range of different assessments is conceivable. A first impulse might be to take a simple (or weighted) average of the estimates for each subpopulation (e.g. Steegen et al., 2016: 710). 12 However, such a calculation may lack justification. There is no particular reason to expect that the estimation errors associated with different analytical strategies are cancelling, nor is an adequate justification for different weighting schemes easy to find (c.f. Young, 2019). Nor will the calculation of an average discriminate between a diverging and converging set of estimates.
Instead, any assessment of methodological robustness must take into account the spread of estimates produced across the strategy space. Here, there are at least three possible kinds of metric available.
One could: Assess the magnitude of variation across different analytical strategies (representing a kind of margin of uncertainty associated with the alternatives considered). Construct an interval within which a certain proportion of estimates fall (representing a range which is robustly supported across the strategy space). Assess the proportion of estimates which meet a theoretically-defined criterion. Selection of a metric (or metrics) is likely to be a context-specific decision. It will depend on the kinds of insights that the analyst is seeking. If the aim of the research is to produce a precise estimate of a particular effect, then (1.) will likely be appropriate – with the results considered unacceptably fragile if the magnitude of variation of estimates is too large (Patel et al., 2015, for example, include a number of metrics of this kind). Approach (2.) asks whether the set of estimates considered converge on a usefully narrow interval (in the style of Leamer, 1985: 311). Approach (3.) might be appropriate if the researcher wants to evaluate the methodological robustness of a particular conclusion: such as that an effect is positive or negative (Young and Holsteen’s, 2017, sign stability and significance rate metrics fall into this category). As our results (below) illustrate, these different assessments may lead to contradictory conclusions, and so it may be advisable to consider them in tandem.
The most conservative approach to quantifying variation, or constructing intervals, would be to focus on the complete range of estimates (i.e. the interval within which 100% of estimates fall). However, proponents of multi-strategy analysis have typically not emphasized this approach. Such assessments are likely to be highly sensitive to the presence of a small number of highly idiosyncratic (‘knife-edge’ Young and Holsteen, 2017) analytical strategies that are argued to be anomalous. Young and Holsteen (2017) suggest that a heuristic cutoff set at less than 100% may be reasonable, with 95% representing ‘very strong’ robustness.
We employ a heuristic cutoff here, set at 90% of estimates, and use it to construct a table of results (Table 5), based on the three general strategies discussed above.
Assessment of Methodological Robustness
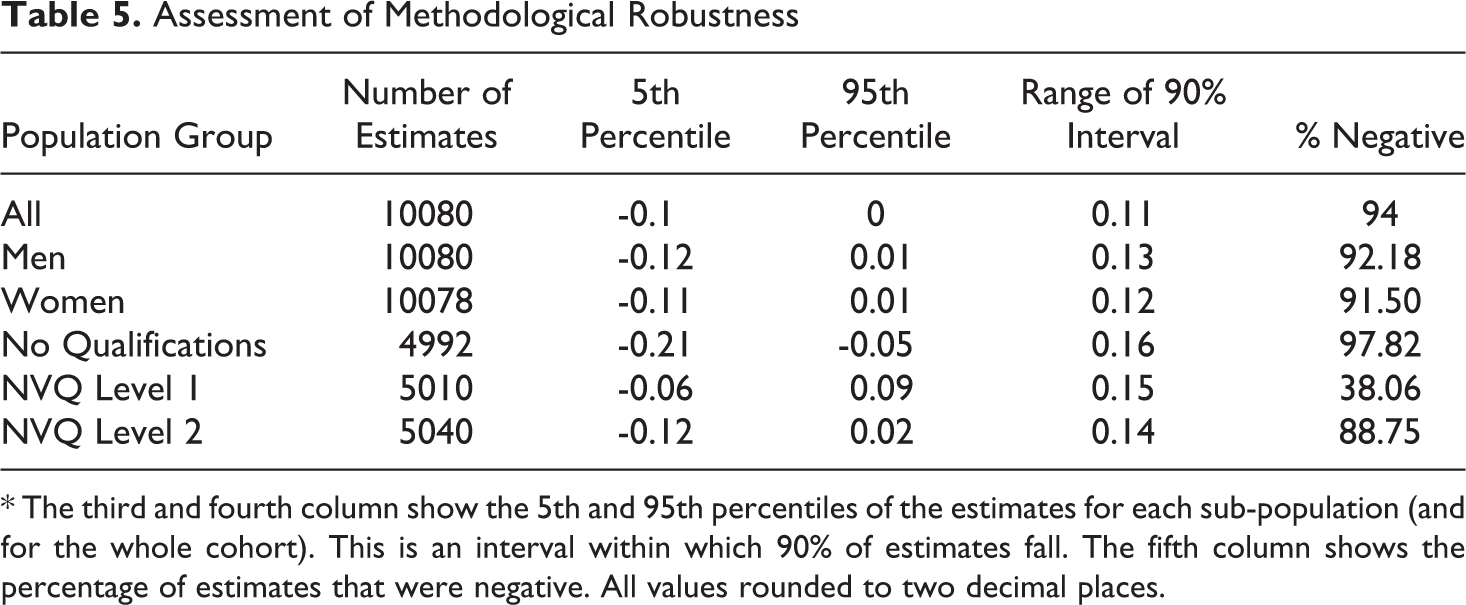
* The third and fourth column show the 5th and 95th percentiles of the estimates for each sub-population (and for the whole cohort). This is an interval within which 90% of estimates fall. The fifth column shows the percentage of estimates that were negative. All values rounded to two decimal places.
A consideration based on metric (1.), the magnitude of variation in the results (Column 5, Table 5), would likely indicate substantial fragility across analytical strategies. Across all sub-population groups, there was at least a 0.1 (probability) range in causal-risk difference estimates between the 95th and 5th percentile estimate.
However, if instead, we were more concerned with establishing the presence of an effect, and its direction, we would arrive at a mixed assessment. In four of the subpopulation groups, the 5th–95th interval (metric 2.) included positive effect estimates (or zero effect). However, for the subpopulation group with no-qualifications, the 90% interval ranged from a strong negative effect (-0.21 reduction in the probability of positive occupational outcome) to a moderate negative effect (-0.05). Thus, we might conclude that an estimate that government youth training had a negative impact on this sub-population is methodologically robust. Notably, this assessment conflicts with an assessment of the magnitude of variation. The no-qualification group actually had the largest range of estimates across the 5th–95th percentile interval.
Finally, if we were primarily concerned with the question of whether or not the 1980s youth training schemes had a substantial positive impact on the occupational mobility of participants, we might also ascribe methodological robustness to the estimates for the Men, Women and No-Qual subpopulation groups. For each of these subpopulation groups, more than 90% of estimates were negative, suggesting that an estimate that there were not substantial positive effects on occupational mobility is methodologically robust (given the alternative considered).
It is tempting to employ a theoretical criterion (as in 3.) to assess methodological robustness that is based on the proportion of estimates which share the same sign, and meet a critical threshold for statistical significance (which Young and Holsteen, 2017 refer to as the significance rate). However, a note of caution is needed here. Arguably, since multi-strategy analysis addresses methodological robustness or fragility, initial assessments of robustness should not depend on considerations of statistical significance. Multi-strategy analysis can tell us whether a meaningful estimate (broadly defined) is robust to a range of alternative analytical strategies. It cannot per-se tell us about the influence of sampling error in those estimates (see Discussion and Conclusions). One can imagine a set of effect estimates which are highly methodologically robust (converge on a very narrow interval), but which are below (or even straddle) an arbitrary significance threshold. That is not to say that cumulative uncertainty associated with sampling and methodology cannot be assessed in conjunction (see Discussion and Conclusions). But it may be more appropriate to consider this to be part of a larger task of drawing final conclusions from a multi-strategy analysis (rather than assessing methodological fragility).
Part Four: Sensitivity Analysis
Based on an assessment of the distribution of results in our strategy space, there are good grounds for us to be dissatisfied with the methodological robustness of our analysis. Any attempt to precisely estimate the effect of interest has been shown to be highly fragile with respect to particular methodological choices, about which we are uncertain. The key advantage of a multi-strategy analysis, however, is that we can use the information in our strategy space to identify the decisions (or combinations of decisions) which are creating this fragility. This is known as a sensitivity analysis.
A range of methods has been applied at this stage of the analysis by proponents of multi-strategy approaches. Simonsohn et al. (2015) and Steegen et al. (2016) used bespoke visualizations to directly examine the relationship between analytical choices and estimates in their multi-strategy analyses. However, neither of their approaches can easily generalise to situations where there is high-dimensionality in the strategy space. Steegen et al. (2016) only visualized five sets of analytical choices in a single figure. Simonsohn et al.’s (2015) approach visualizes a large number of analytical choices but requires the analyst to compare the full sets of assumptions associated with different estimates, which may be cognitively intractable for many thousands of estimates.
Young and Holsteen (2017) employed a meta-modelling approach. Their approach addresses the high-dimensionality problem by only estimating one effect for each analytical choice. However, their approach faces other difficulties. Young and Holsteen (2017: 20–22) regressed their effect estimates on analytical choices in their strategy space using main-effect regression. However, this influence regression only estimates the main effect of each assumption. This ignores any interactions between assumptions. We would expect such interactions to be commonplace, and we found that interactions played an important role in the variation in estimates across our strategy space (see below).
These considerations lead naturally to an alternative approach to sensitivity analysis that uses the recursive partitioning algorithm (RPART) as a meta-model. Recursive partitioning works by repeatedly splitting a dataset using key independent variables until the remaining partitions of the data are relatively ‘pure’ with respect to some dependent variable of interest (Strobl et al., 2009; Therneau and Atkinson, 2019). In the context of sensitivity analysis of a strategy space, RPART can be used to repeatedly split the strategy space based on the most relevant decisions, until the partitions (defined on sets of decisions) in which a particular kind of result is universal (or close to universal) are revealed. The model can be visualised as a decision-tree, directly showing the sequence of assumptions needed before a particular kind of result (e.g. a positive or negative effect estimate) becomes ‘locally’ robust (i.e. robust given the preceding decisions). The key advantage of this algorithmic approach is that it can automatically discover interactions in the strategy space, and it can be applied to identify important decisions (or combinations of them) even when the strategy space is too large for the full set of dependencies to be usefully visualised.
We employed the RPART algorithm as a meta-model to help to identify the sources of methodological fragility in our analysis. We targeted the algorithm toward discriminating between positive and negative estimates in our strategy space, based on (combinations of) the methodological alternatives considered (which were entered as predictors). Space constraints prevent inclusion of the (large) decision-trees produced in the body. However, they are included in Appendix D, with a summary of the key results provided here.
Sensitivity analysis using RPART revealed a strong dependence of the results of the analysis on the decision to use a complete case approach (i.e. listwise deletion), versus a single imputation approach. In the Men (Figure D1), Women (Figure D2), and NVQ Level 2 (Figure D5) subgroups, the vast majority of estimates became negative (98%-100%), conditional on using a single imputation approach (rather than complete-case analysis). In other words, our set of estimates (in these groups) became robustly negative, conditional only on a single assumption in our strategy space 13 .
However, the reverse was not true, conditional on complete-case analysis, the combinations of assumptions needed before the set of estimates became (or approached) robustly positive, were varied and involved large combinations of assumptions. As an example, in the women subpopulation group, the results were 98% negative, conditional on the imputation of the control variables. However, finding a set of results which were only 11% negative depended on choosing a relatively idiosyncratic combination of 6 assumptions including outcome-definition, treatment-definition, control-variable definition, and estimation procedure (see Appendix D, Figure D2) – that have little clear theoretical interpretation.
This pattern of results is entirely consistent with Young and Holsteen’s (2017) concept of a knife-edge specification – whereby particular estimates are dependent on an idiosyncratic combination of uncertain assumptions – suggesting that significant caution is needed in the interpretation of such estimates (see Discussion and Conclusions for consideration of the wider implications of idiosyncratic analytical strategies for practitioners). A plausible explanation for the existence of these ‘knife-edge’ results among our complete-case analyses, was the entanglement of sample composition with different analytical assumptions. Under complete case analysis, the available sample changes systematically with variable definition, control variable selection, and so on. As such, the ‘theoretical’ interpretation of these choices was entangled with the way they change the sets of cases actually used to produce an estimate – increasing the methodological fragility of the analysis.
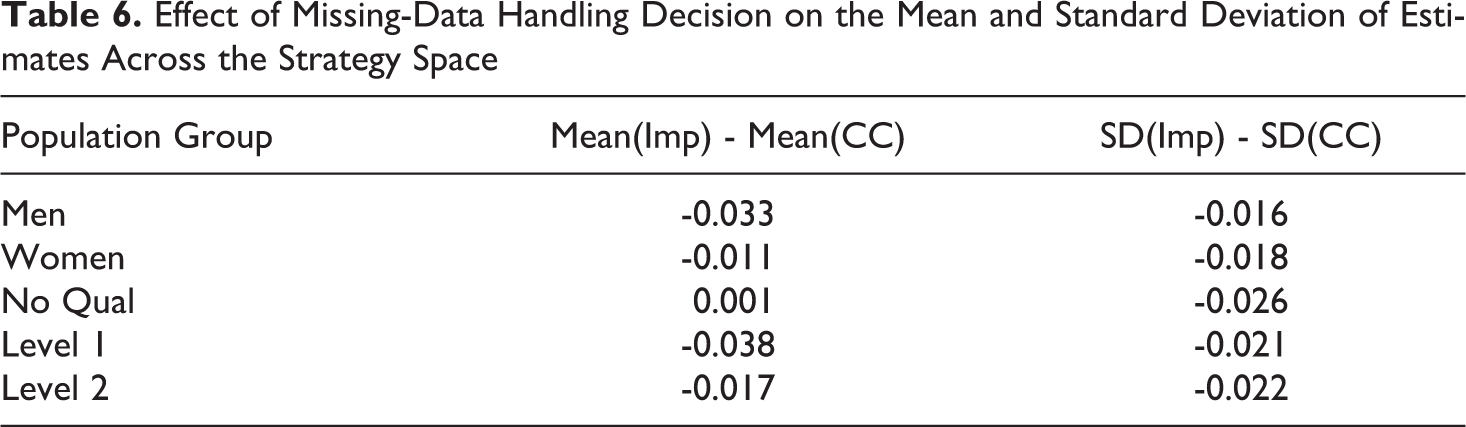
These results illustrate the potential distinctive contribution of the RPART algorithm as tools for multi-strategy sensitivity analysis. Examination of the decision trees produced by the algorithm clearly indicates a strong direct effect of the choice to use imputation: that results become more negative. However, it also suggested a potential interaction between this choice and other choices. Namely, conditional on the use of single imputation, estimates became less sensitive to other choices (or conversely, became more sensitive using complete case analysis). Comparison of the mean and standard deviation of estimates among strategies using a complete case, versus imputation strategy, supports this interpretation (Table 6). Estimates based on single-imputed data were typically more negative on average and varied less across different analytical strategies.
Effect of Missing-Data Handling Decision on the Mean and Standard Deviation of Estimates Across the Strategy Space
This result raises an important general question about the relationship between missing-data handling and methodological uncertainty. Judgements about how missing-data might affect results (and what kind of correction to use) are complex, and we do not discuss them further here (except to note them as a common source of methodological uncertainty). However, such considerations typically centre on the question of potential bias in estimates. Our results may point to another issue that practitioners should consider when dealing with missing data: fragility. The use of complete case analysis may introduce unnecessary fragility into quantitative analysis because the sample composition becomes closely entangled with analytical choices. In turn, this might increase the risk of ‘knife-edge’ findings and limit the theoretical interpretability of the sample space. The possibility that this could occur even if the use of complete case analysis is otherwise justified (i.e. does not bias the estimates per-se), should be a significant concern to analysts. This issue, which is made more ‘visible’ by multi-strategy analysis, warrants further general investigation.
This final stage of the multi-strategy approach: sensitivity analysis, provided considerable insight into the sources of fragility in our analysis. The treatment of missing data was shown to have a disproportionate impact on the estimates themselves and on the sensitivity of the analysis to other choices.
However, all of this raises the question of what, having identified key sources of fragility in the analysis, an analyst should do with this information. As we discuss shortly, this largely a theoretical consideration – it depends on the further assumptions and commitments that the analyst is willing to make. Nevertheless, as we discuss below, multi-strategy analysis makes a key contribution in informing analysts about the consequences of these commitments and making them transparent to research consumers.
Discussion and Conclusions
The Risk that Methodological ‘ Fragility’ Poses for Quantitative Analysis
The results of our multi-strategy analysis support the concerns raised by other authors about the risks that methodological fragility poses for quantitative analysis, and demonstrations thereof (Simmons et al., 2011; Simonsohn et al., 2015; Steegen et al., 2016; Young and Holsteen, 2017). We found that our estimates varied widely across our strategy space. Certain estimates were highly idiosyncratic. They diverged strongly from the majority of other estimates in the strategy space. Also, they depended on a specific combination of methodological decisions which had no clear theoretical interpretation. It is disturbing to observe, for instance, that while the vast majority of estimates (more than 97%) for the no-qualification group in our analysis were negative, a small number indicated a positive effect, some as high as 0.08.
An analyst considering only a single analytical strategy runs the risk that they will stumble upon an idiosyncratic ‘knife-edge’ estimate of this kind. In this case, neither they nor their audience will necessarily be aware of that they would have gotten a contradictory result with apparently minor modifications of their strategy.
Although we do not attempt this analysis here, it would be of significant interest to explore the possibility that apparently contradictory results among past studies of the Youth Training Schemes are the result of ‘knife-edge’ analytical strategies employed by particular studies.
The general lesson for practitioners is that when designing a quantitative analysis, it is important not only to consider whether the strategy chosen is plausible and defensible, but also whether other similarly plausible strategies might produce contradictory results. The results of our case study support the notion that such judgements are difficult to make without the aid of a tool like multi-strategy analysis.
Reducing Methodological Uncertainty: Prioritization, Theoretical Commitment and Transparency
Having been alerted to methodological fragility through a multi-strategy analysis, what should an analyst then do to redress this uncertainty? In some cases, it may be scientifically appropriate to do nothing (Steegen et al., 2016). By definition, the alternatives that an analyst considers in their strategy space represent methodological decisions about which they are uncertain. If these uncertainties cannot be satisfactorily resolved, it may be appropriate to conclude that the quantity of interest cannot be estimated robustly from the data at hand–or at-least that a wide range of estimates is plausible.
However, a multi-strategy analysis may also play a different role. It may help the analyst to focus their attention on key methodological uncertainties that need to be resolved in order to proceed with their analysis. Our case-study analysis, for example, showed that particular attention needs to be paid to the handling of missing in order to proceed toward a meaningful estimate for our research question. Here, a multi-strategy analysis would play the role of prioritizing key methodological issues in the analysis, prior to further decisions being made.
In some cases, it may be possible to resolve such key uncertainties empirically. Often, however, we suspect that methodological uncertainties in quantitative analyses will need to be constrained through theoretical commitments. If one, for example, is willing to assume a particular causal structural model (i.e. a graphical model, Rohrer, 2018) associated with the phenomenon of interest, including both observed and unobserved causal variables, then the appropriate set of control variables for estimating a particular effect may be clearly defined, and no longer ‘uncertain’.
This raises the following question. Why should one do a multi-strategy analysis at all, if one plans to then constrain one’s choices through theoretical commitments which are themselves uncertain? The answer is that a multi-strategy analysis allows those decisions to be informed and transparent (Steegen et al., 2016; Young and Holsteen, 2017). Having performed a multi-strategy analysis, the analyst can make key theoretical commitments in the full knowledge that their conclusions strongly depend on them. This is quite unlike a traditional analysis, in which the analyst may have limited foreknowledge about which, if any, of their methodological choices are driving their results. Likewise, rather than being unaware of potential fragility in the analyst’s results, the audience for the research is in a position to properly evaluate the strength of the analysis, by considering the credibility of the key theoretical commitments upon which its results have been shown to depend.
Here the importance of not only conducting but also reporting multi-strategy analyses becomes salient. If misused, a multi-strategy analysis could be a tool for ‘result-hacking’ (or ‘p-hacking’) in which the analyst finds and selects an idiosyncratic strategy that produces their desired result, and presents this as a ‘traditional’ analysis (Simmons et al., 2011). Reporting the results of the multi-strategy analysis eliminates this concern. Indeed, concern about false-positive results and questionable research practices has been a key motivation for multi-strategy proposals (Steegen et al., 2016; Young and Holsteen, 2017). Even if the analyst does wish to argue in favour of a particular idiosyncratic result, this does not present a problem as long as this is reported alongside the results of the multi-strategy analysis. If so reported, then the audience of the research will be able to apply appropriate scrutiny to the particular set of assumptions that the analyst wishes to defend.
Methodology as an Additional (Not Alternative) Source of Uncertainty
It is important to stress that consideration of methodological uncertainty and the use of multi-strategy analysis is inherently conservative. It constitutes the recognition of an additional form of uncertainty: methodological uncertainty, in quantitative research. It is motivated by a concern that this kind of uncertainty may undermine the trustworthiness of an analysis. It does not eliminate the need to consider other additional forms of uncertainty when conducting quantitative research.
It does not, for example, remove the need to consider uncertainty associated with sampling. Multi-strategy analysis can inform us about methodological uncertainty associated with a particular research question, analyzed using a particular collection of data. It cannot itself tell us how our results might differ between samples, nor whether our sample is representative, and so on. It does not, therefore, remove the need for consideration of data quality, nor for results to be replicated through repeated data collection or experiment, etc. Young and Holsteen (2017), for instance, distinguish conceptually between ‘model’ error and ‘sampling’ error and refer to ‘total’ error as the combined uncertainty pertaining to the conclusions of an analysis.
How a practitioner chooses to incorporate other sources of uncertainty into an assessment of their final conclusions, may depend on whether they wish to consider a range of plausible estimates (i.e. leave some methodological possibilities unconstrained) or only a single one.
If the analyst wishes to argue in favour of a single analytical strategy (and therefore a single estimate) then it may be appropriate for considerations of other sources of uncertainty to proceed as in a traditional analysis: e.g. confidence intervals calculated for the chosen estimate (although the other methods discussed below could be employed to add ‘context’ to this result, Young and Holsteen, 2017).
However, if the analyst wishes to consider a distribution of plausible estimates, then they will need to find a way to combine methodological and sampling uncertainties as part of assessing the strength of a particular conclusion.
One simple approach may be to assess the statistical significance of estimates (given a particular null-hypothesis) in the strategy space and to judge conclusions against the proportion of estimates which support a shared conclusion (e.g. a negative effect) and are significant, known as the significance rate (Young and Holsteen, 2017).
We propose that the following could also be used to produce a similarily straightforward interval of estimates, incorporating sampling and methodological uncertainty 14 . This alternative approach begins by calculating confidence intervals for each of the estimates (remaining) in the strategy space. This produces two new sets of estimates. One set contains the upper limits of the confidence intervals calculated for all plausible analytical strategies (the ‘upper limits’ set). The set other contains all of the lower-limits (the ‘lower limits’ set).
The interval between the lowest values of the ‘lower limits’ set and the highest values of the ‘upper limits’ set has the advantage of containing all of the estimates considered plausible and all of the estimates contained within the confidence intervals for those estimates. Figure 2 provides an example of this approach applied to the estimates for our no-qualification subpopulation, using 95% confidence intervals. The interval between the outer edges of each distribution could be considered robust to both methodological and sampling uncertainty (at least with respect to the uncertain choices considered).
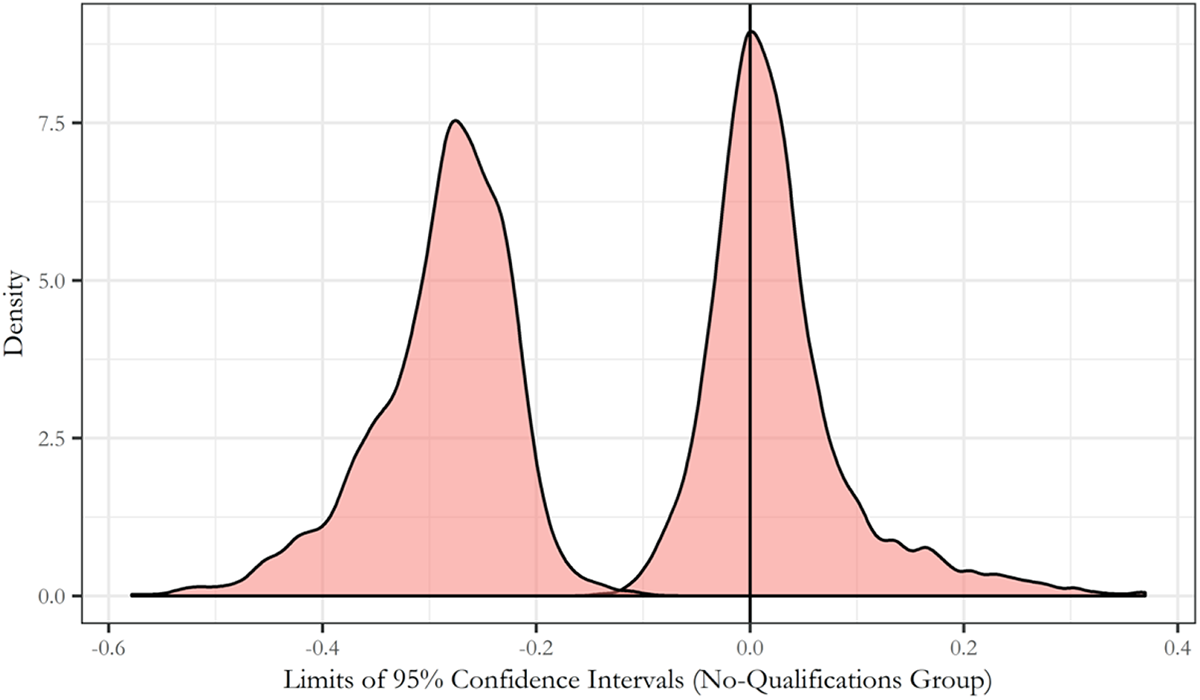
Distribution of Upper (Right-Hand Distribution) and Lower (Left-Hand Distribution) 95% Confidence Interval Limits for Estimates for the No-Qualification Subpopulation Group.
While our use of this technique is clearly highly conservative (i.e. we have made no attempt to further constrain our strategy space), it is useful to note that the resulting interval of estimates is not meaningless. The claim that youth training did not have a large positive effect (e.g. greater than 0.2 increase in the probability of occupational mobility) is shown to be quite robust to both the methodological alternatives considered in our analysis and to estimates of sampling uncertainty based on confidence intervals for those estimates.
More sophisticated approaches to combining methodological and sampling uncertainty have been proposed which provide a single joint test of the distribution of estimates across the strategy space. However, these currently face several potential difficulties. Young and Holsteen, (2017: 13) propose calculating a ‘robustness ratio’ using all estimates in the strategy space. This ratio seeks to combine methodological and sampling uncertainty, and to compare this to the size of a single ‘preferred’ effect estimate (analogous to a test-statistic). However, they acknowledge that the statistical properties of this quantity are unknown (ruling out formal hypothesis testing). Simonsohn et al. (2015) propose a formal hypothesis test for multi-strategy analyses of experimental data, based on permutation testing. Potential issues with this approach include the sensitivity (shown in their results, 2015: 16, Table 2) of the estimated joint ‘p-value’ to the particular metric compared to the null distribution(s) (e.g. the sign stability versus the significance rate), as well as the computational burden of re-estimating the strategy space thousands of times for permutation analysis (1000 permutations would have required us to compute more than 45 million estimates, for example).
Exhaustiveness and the Limits of the Multi-Strategy Approach
The issue of exhaustiveness is an important consideration when assessing the merits of the multi-strategy approach (Simonsohn et al., 2015; Young and Holsteen, 2017). While the multi-strategy approach can accommodate an arbitrarily large number of plausible analyses, it is unlikely that any given analysis will manage to be exhaustive, i.e. to incorporate all plausible analytical choices. Putting aside finite computing power, practitioners cannot be expected to anticipate all plausible alternative strategies, and indeed software implementations of all plausible approaches may not be available.
This raises an important question. If, for a given multi-strategy analysis, there are likely to be plausible analytical strategies which are not included in the strategy space, does this undermine the approach? We agree with other proponents of multi-strategy approaches (e.g. Simonsohn et al., 2015) that it does not. Rather it simply highlights the fact that a multi-strategy analysis still relies on the judgement of the practitioner. It is up to the practitioner to select the methodological decisions and possible alternatives that they wish to consider. Thus, methodological robustness (or fragility) is always defined relative to the set of alternatives that the analyst wishes to consider. The question of whether a given multi-strategy analysis omits important alternatives, or indeed whether some (or all) of the chosen strategies should be rejected on theoretical grounds, is a matter for the judgement of the practitioner and their peers (and for further analysis).
Furthermore, while the multi-strategy approach cannot exhaustively establish methodological robustness, it can immediately establish methodological fragility and thus alert the analyst to particular sources of uncertainty. Ultimately the most important question is not whether a multi-strategy analysis is a perfect solution to problems of methodological uncertainty. Rather, the question is whether it enhances the current capacity of practitioners to deal with this problem. Even an ‘imperfect’ (Simonsohn et al., 2015: 18) multi-strategy analysis provides practitioners with a much greater capacity to detect and address methodological fragility than they would have following a traditional approach.
Supplemental material
Supplemental Material, sj-pdf-1-bms-10.1177_0759106320939893 - Methodological Uncertainty and Multi-Strategy Analysis: Case Study of the Long-Term Effects of Government Sponsored Youth Training on Occupational Mobility
Supplemental Material, sj-pdf-1-bms-10.1177_0759106320939893 for Methodological Uncertainty and Multi-Strategy Analysis: Case Study of the Long-Term Effects of Government Sponsored Youth Training on Occupational Mobility by Laurence T. Droy, John Goodwin and Henrietta O’Connor in Bulletin de Méthodologie Sociologique
Footnotes
Supplemental material
The appendices cited in this article are available on the BMS website. They can be downloaded as ‘Supplementary Material’ from the online version of this article.
Acknowledgements
We are deeply grateful to Jérémy Dodeigne for detailed comments and advice on multiple drafts of the manuscript. This greatly helped to improve the clarity and focus of the article. We are likewise grateful to editors Viviane Le Hay and Sophie Duchesne of the Bulletin of Sociological Methodology for their support and helpful advice on the development of the manuscript. We would also like to thank three anonymous reviewers for their thoughtful and stimulating comments.
Declaration of Conflicting Interests
The author declared no potential conflicts of interest with respect to the research, authorship, and/or publication of this article. The analyses in this work are based wholly or in part on analysis of data from the 1970 British Cohort Study (BCS70). The data was deposited at the UK Data Archive by the Centre for Longitudinal Studies at the UCL Institute of Education, University of London. BCS70 is funded by the Economic and Social Research Council (ESRC).
Funding
This research was funded wholly or in part by the British Academy as part of the grant SG153070.
Notes
References
Supplementary Material
Please find the following supplemental material available below.
For Open Access articles published under a Creative Commons License, all supplemental material carries the same license as the article it is associated with.
For non-Open Access articles published, all supplemental material carries a non-exclusive license, and permission requests for re-use of supplemental material or any part of supplemental material shall be sent directly to the copyright owner as specified in the copyright notice associated with the article.