
Abstract
In early childhood, consolidation of sleep from a biphasic to a monophasic sleep-wake pattern, that is, the transition from sleeping during an afternoon nap and at night to sleeping only during the night, represents a major developmental milestone. Reduced napping behavior is associated with an advance in the timing of the circadian system; however, it is unknown if this advance represents a standard response of the circadian clock to altered patterns of light exposure or if it additionally reflects features of the developing circadian system. Using a mathematical model of the human circadian pacemaker, we investigated the impact of napping and non-napping patterns of light exposure on entrained circadian phases. Simulated light schedules were based on published data from 20 children (34.2 ± 2.0 months) with habitual napping or non-napping sleep patterns (15 nappers). We found the model predicted different circadian phases for napping and non-napping light patterns: both the decrease in afternoon light during the nap and the increase in evening light associated with napping toddlers’ later bedtimes contributed to the observed circadian phase difference produced between napping and non-napping light schedules. We systematically quantified the effects on phase shifting of nap duration, timing, and light intensity, finding larger phase delays occurred for longer and earlier naps. In addition, we simulated phase response curves to a 1-h light pulse and 1-h dark pulse to predict phase and intensity dependence of these changes in light exposure. We found the light pulse produced larger shifts compared with the dark pulse, and we analyzed the model dynamics to identify the features contributing to this asymmetry. These findings suggest that napping status affects circadian timing due to altered patterns of light exposure, with the dynamics of the circadian clock and light processing mediating the effects of the dark pulse associated with a daytime nap.
The approximately 24-h cycles known as circadian rhythms represent a physiological feature of nearly all living organisms and are observed in humans as early as 9-12 weeks of age (Kennaway et al., 1992, 1996). Circadian rhythms are produced by an intracellular molecular clock that is mediated through genetic feedback loops (Hardin et al., 1990; Welsh et al., 1995; Price et al., 1998; Dunlap, 1999; Gachon et al., 2004; Oster, 2006). The circadian system requires external time cues, known as zeitgebers, to maintain alignment with the 24-h solar day. Many aspects of daily life act as zeitgebers, but the primary stimulus to the circadian system is the 24-h light:dark cycle (Czeisler et al., 1981; Roenneberg and Foster, 1997; Duffy and Wright, 2005). Light affects the circadian system through photoreceptors, cells in the retina that are responsive to light (Foster et al., 1991; Provencio et al., 2000; Hattar et al., 2002). Light exposure causes intrinsically photosensitive retinal ganglion cells (ipRGCs) to fire action potentials (Berson et al., 2002), sending signals to the hypothalamus via the retinohypothalamic tract (Moore et al., 1995). These signals are received by cells in the master clock of the circadian system, the suprachiasmatic nuclei (SCN) (Moore and Eichler, 1972; Stephan and Zucker, 1972; Ralph et al., 1990; Welsh et al., 2010), and entrain the SCN to the 24-h day (Czeisler et al., 1999; Duffy and Wright, 2005). Signaling from the SCN coordinates other circadian rhythms in the body, thus enabling the circadian system to align with its environment (Yamazaki et al., 2000; Dibner et al., 2010; Mohawk et al., 2012).
Light exposure is gated by sleep-wake patterns, which change across the lifespan (Iglowstein et al., 2003; Crowley et al., 2014; Duffy et al., 2015). In early childhood, the consolidation of sleep into a single nighttime episode is a major developmental milestone, and changes in sleep timing, duration, and circadian phase occur with this transition (Iglowstein et al., 2003; Crosby, 2005; Jenni and LeBourgeois, 2006; Akacem et al., 2015). Longitudinal data indicate a decrease in total 24-h sleep duration from an average of 13 h at 2 years to 11 h at 6 years of age (Iglowstein et al., 2003). This decrease in total sleep time is primarily attributed to the transition from a biphasic to monophasic sleep-wake pattern, with napping frequency and duration gradually declining with age (Crosby, 2005; Jenni and LeBourgeois, 2006). The change in the timing of sleep may be associated with altered patterns of light exposure. In preschool-aged children, decreased napping frequency may increase light exposure in the afternoon, earlier bedtime may decrease light exposure in the evening, and decreased total time in bed may increase daily light exposure (Iglowstein et al., 2003; Crosby, 2005; Jenni and LeBourgeois, 2006; Dumont and Beaulieu, 2007; Akacem et al., 2015). In addition to changes in patterns of light exposure that are associated with increasing age, eye physiology and light sensitivity of the circadian clock may also experience nonlinear changes across the lifespan (Turner and Mainster, 2008; Higuchi et al., 2014).
Experimental work has determined that the phase of the human circadian clock is affected by photoperiod (Sumová et al., 2004; Meijer et al., 2007; Coomans et al., 2015) as well as the timing, duration, and intensity of acute light exposure (Honma and Honma, 1988; Czeisler et al., 1989; Zeitzer et al., 2000; Burgess and Eastman, 2004; Duffy and Wright, 2005; Wright et al., 2005). Phase response curves (PRCs) summarize the response of the circadian oscillator to a stimulus given at different circadian phases. PRCs to various light levels and durations have been established in adults (Honma and Honma, 1988; Czeisler et al., 1989; Minors et al., 1991; Jewett et al., 1994; Van Cauter et al., 1994; Khalsa et al., 2003; St Hilaire et al., 2012) and adolescents (Crowley and Eastman, 2017). These PRCs demonstrate that the sensitivity of the circadian system to light varies across the 24-h day, causing phase delays in the hours around bedtime (early in the subjective night) and phase advances in the hours around wake time (late in the subjective night and early in the subjective day). Similarly, data from experimental studies in rodents show that dark pulses produce phase shifts in opposite directions compared with light pulses, but both dark and light pulse PRCs show similar phase dependence (Boulos and Rusak, 1982; Dwyer and Rosenwasser, 2000; Rosenwasser and Dwyer, 2002). However, in rodents, dark pulses also induce locomotor activity which can contribute to these effects (Dwyer and Rosenwasser, 2000; Rosenwasser and Dwyer, 2002). In humans, experimental data suggest that dark exposure in the morning can delay circadian phase and dark exposure in the evening can advance circadian phase, producing phase shifts opposite to those due to light exposure (Buxton et al., 2000).
The circadian system’s response to light exposure across all circadian phases has yet to be determined in early childhood; however, recent findings from fundamental childhood circadian studies suggest that the central clock is highly sensitive to light exposure around bedtime (Higuchi et al., 2014; Akacem et al., 2016, 2018; Hartstein et al., 2022a, 2022b). In preschool children, an approximately 40 min advance in circadian timing and earlier bedtime has been associated with decreased napping frequency (Akacem et al., 2015). However, it is unknown if this advance represents a standard response of the circadian clock to altered patterns of light exposure driven by changes in sleep need, or if it additionally reflects features of the developing circadian system. In this study, we use a mathematical model of the human circadian oscillator (Forger et al., 1999) to investigate the effects of napping and non-napping patterns of light exposure on circadian phase.
Mathematical modeling of human circadian rhythms is well established and includes models of the molecular clock (Forger and Peskin, 2003; Mirsky et al., 2009; Kim and Forger, 2012), phenomenological models based on sinusoids (Borbély, 1982; Daan et al., 1984) or modified van der Pol limit cycle oscillators (Kronauer et al., 1982; Forger et al., 1999; St Hilaire et al., 2007), and models reflecting SCN physiology (Abraham et al., 2010; Hannay et al., 2018, 2019). Light plays a major role in some of these circadian models, with the modeled dynamics of light processing enabling the simulation of experimentally observed light responses (Forger et al., 1999; Kronauer et al., 1999). In addition, analysis of these models provides insight into circadian entrainment to light:dark cycles and responses to perturbations in light exposure (Forger et al., 1999; Skeldon et al., 2016; Diekman and Bose, 2018; Piltz et al., 2020; Stack et al., 2020; Diekman and Bose, 2022). Light input is often modeled with a direct forcing term, but additional dynamics reflecting the physiology of light processing may also be considered. In a modified van der Pol-type clock model, Kronauer and colleagues introduced an additional variable to account for putative photoreceptor dynamics (Kronauer et al., 1999). This approach enabled their model to respond appropriately to both extended (7 h) and brief (15 min) light stimuli while also incorporating intensity dependence, and these dynamics were incorporated into subsequent models (Forger et al., 1999; St Hilaire et al., 2007; Gleit et al., 2013; Hannay et al., 2019). We considered several circadian pacemaker models, and we focus on a van der Pol-type circadian clock model introduced by Forger and colleagues that includes these photoreceptor dynamics (Forger et al., 1999). This model has been fit to and validated on data from multiple experimental protocols with adult participants (Jewett et al., 1991; Khalsa et al., 1997; Forger et al., 1999; Stack et al., 2020), but it has not been tested in young children.
To analyze the effects of different patterns of light exposure on predicted circadian phase, we entrained the model to the light schedules of napping and non-napping preschool children (Akacem et al., 2015) and investigated the effects of napping and later bedtimes on circadian phase. We also systematically studied the contributions of nap timing, duration, and light intensity on phase shifting of the circadian clock. We simulated a modified PRC protocol to a 1-h light and 1-h dark stimulus to quantify and compare the effects of light and dark pulses at different phases under different lighting conditions. We analyzed the dynamical features of the model to identify the model mechanisms that produce these responses and investigated the role of light processing dynamics on the responses of the circadian system to light and dark pulses in preschool-aged children.
Methods
The Mathematical Model
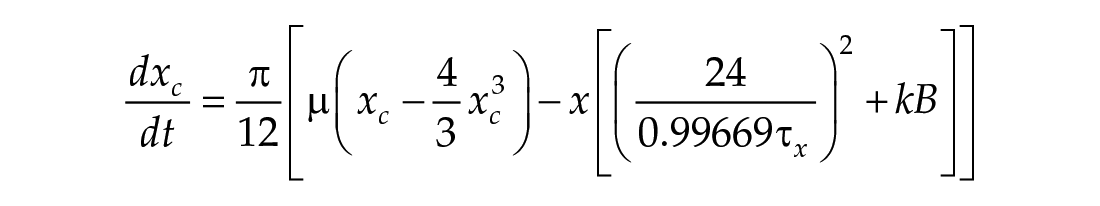
In this study, we considered three models of the human circadian pacemaker (Forger et al., 1999; Kronauer et al., 1999; St Hilaire et al., 2007). We show results for all three models in response to napping and non-napping light schedules; however, we focus primarily on the human circadian clock model proposed by Forger et al. because it is the simplest model that produces phase differences consistent with observational data in napping and non-napping preschool children. Therefore, we refer the reader to published detailed descriptions of the other models (Kronauer et al., 1999; St Hilaire et al., 2007) and briefly summarize the details of the model proposed by Forger and colleagues (Forger et al., 1999). The three-dimensional (3D), deterministic model is defined by the following equations:

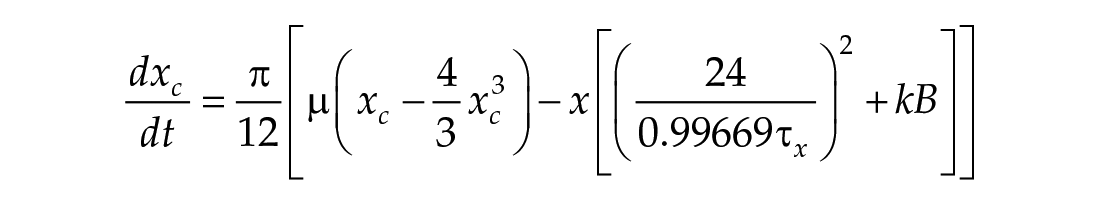


The variable
The third dimension of the model is introduced in Process L, the effect of light exposure on the circadian pacemaker. Process L assumes photoreceptors can be in either an activated or deactivated state with the proportion of activated photoreceptors,
Process L accounts for both the differential effects of light due to different intensities of light exposure, as well as the timing of light exposure with respect to circadian phase. These effects of light are incorporated through the final two equations,
The model equations were simulated in MATLAB (Mathworks, Natick, MA) and solved numerically using the built-in MATLAB solver
Simulating Napping Versus Non-napping Light Schedules
We simulated napping and non-napping patterns of light exposure based on published physiological and behavioral data from 20 healthy children (34.2 ± 2.0 months; 11 females; 18 Caucasian, 1 African American, 1 mixed race) following their habitual sleep patterns, either habitually napping or non-napping (15 nappers, 5 non-nappers) (Akacem et al., 2015). Napping children had a biphasic sleep pattern and fell asleep during their nap opportunity at least one of the 5 days (mean ± SD of napping days: 3.6 ± 1.2) preceding an in-home dim light melatonin onset (DLMO) assessment, the marker used to determine circadian phase. In simulations of the human circadian pacemaker, we entrained the model to fixed light schedules and assessed circadian phase using the minimum of the
Simulated napping and non-napping patterns of light exposure were developed based on mean sleep timing data reported by Akacem and colleagues (Akacem et al., 2015) (Figure 1a). Mean morning wake time was similar for both napping and non-napping children (0700 h), but mean bedtime varied between groups; bedtime occurred approximately 45 min earlier in the non-napping (1933 h) than in the napping children (2020 h). For both groups, the waking light intensity was set to 2241 lux and sleeping light intensity was set to 0 lux based on reported average light levels of preschool-aged children (Hartstein et al., 2022a). However, given the variability of light exposure (Bajaj et al., 2011), we additionally considered the effect of waking light intensity on our findings by simulating patterns with various levels of light intensity during wake (100, 200, 1000, 5000 lux). We also simulated napping and non-napping patterns with reduced light in the evening (setting the light to 200 lux the hour before bedtime to represent a lower indoor light level) to represent more realistic patterns of light exposure. Akacem and colleagues reported the mean nap duration to be 102.6 min centered around 1443 h. This mean nap timing and duration was captured in the simulated napping light schedule by setting the light to a dim (2 lux) level for 102 min starting at 1354 h to account for an afternoon nap lighting environment. The low light level for the nap reflects the light intensities reaching the retina through the closed eyelid during the nap when the child is placed in a dim room for a nap opportunity (Beirman et al., 2011). We assume a dim lighting environment because, although light to the retina is reduced when eyes are closed, there is evidence that sufficient light intensities can penetrate through the eyelids and cause circadian phase shifting (Figueiro and Rea, 2012). We calculated the phase difference between the oscillators for the napping and non-napping groups by first entraining the model to the respective light patterns. To entrain the model, we simulated the model under each (napping and non-napping) light pattern for a minimum of 38 days, at which point the daily CBTmin prediction was consistent. We consider these to be the entrained solutions to the periodic forcing of the light patterns. We additionally simulated the model under a typical light pattern for adults: 16:8 h light:dark cycle with lights on (2241 lux) beginning at 0700 h and lights off (0 lux) beginning at 1100 h to compare the effect of the light schedules on the model response.
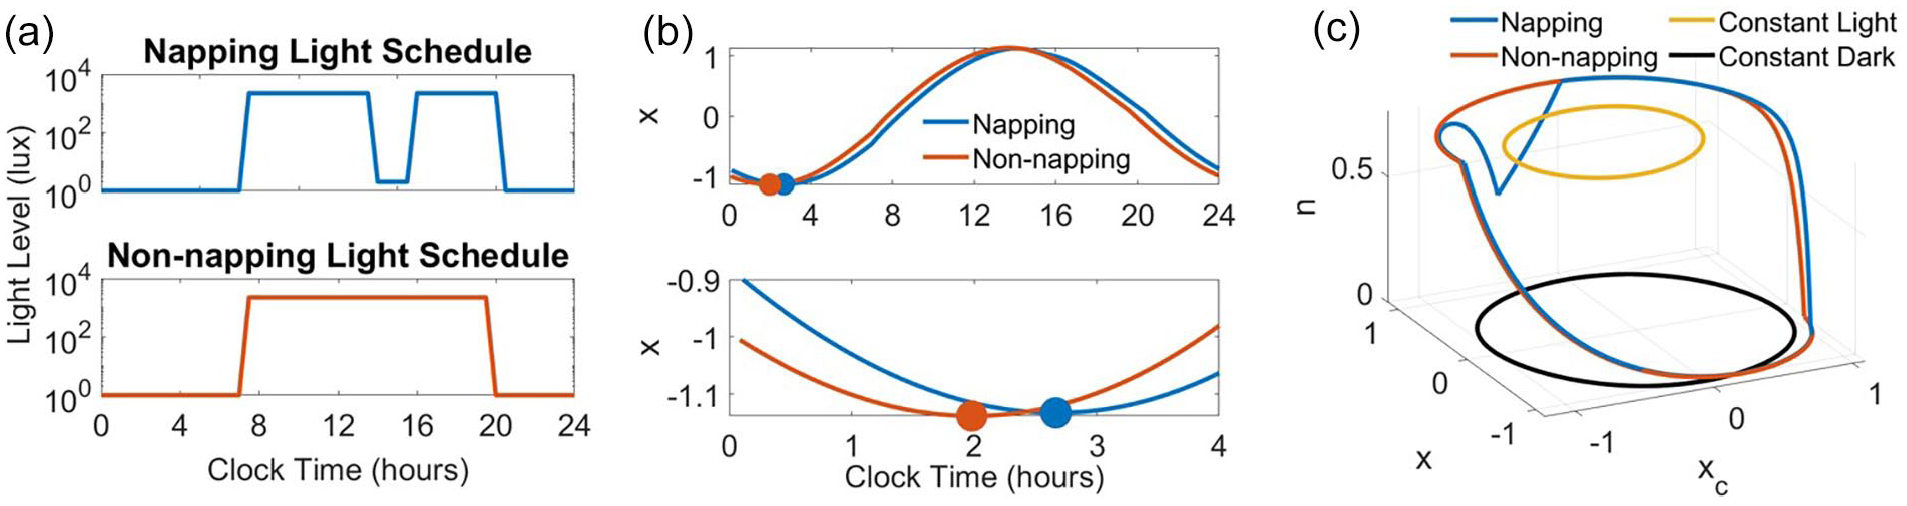
Napping and non-napping light schedules produce distinct solution trajectories and circadian phase predictions. (a) 24-h napping and non-napping light schedules describe light timing and intensities during nighttime sleep, waking, and napping. Waking light intensity is 2241 lux and sleeping light intensity is 0 lux for both schedules. In the napping schedule, the light was set to 2 lux from 1354 to 1536 h to simulate a 102-min nap centered around 1445 h. Wake time is 0700 h in both schedules, and bedtime differed between the two schedules by 43 min (bedtime is 2020 h in the napping schedule, and 1933 h in the non-napping schedule). (b) Simulation time traces of the circadian variable, x, under the napping and non-napping light schedules show that the circadian phase is delayed in the napping schedule compared with the non-napping schedule. The predicted timing of the minimums of x, representing minimum core body temperature, occur at 0159 h for the non-napping schedule and 0240 h for the napping schedule. Thus, the non-napping schedule produces an advance in circadian phase of approximately 41 min compared with the napping schedule. (c) Phase space solution trajectories, including constant light and constant dark limit cycles.
Using the built-in MATLAB function findpeaks, we determined the timing of the minimum of
In addition to simulating the light patterns previously described, we simulated the nap and bedtime characteristics of the napping pattern of light exposure (Akacem et al., 2015) independently by creating a nap only pattern (i.e., a nap with an earlier bedtime, 1933 h) and a late bedtime only pattern (i.e., no nap with a later bedtime, 2020 h). We also varied the conditions of the simulated nap (timing, duration, and light intensity) to determine the contributions of these nap features on the resulting phase difference between models entrained to napping and non-napping light patterns. The start time of the nap was varied between 1000 and 1700 h to simulate regular morning, afternoon, and evening naps. The nap duration was varied between 0.25 and 2.5 h. The light level during the nap was varied between 0 and 100 lux to simulate light reaching the retina through a closed eyelid in a dimly lit environment or to simulate a dim napping environment even if the child does not sleep. Baseline conditions for nap start time (1354 h), nap duration (1.75 h), and nap light intensity (2 lux) were chosen to be consistent with values in the napping light pattern described above. These features of the nap were varied pairwise and the phase difference from the non-napping light pattern was calculated.
Simulating PRCs to Light and Darkness
To characterize the model’s response to stimuli of light or darkness, we adapted a published experimental protocol to determine the PRC to 1 h of bright light and developed an analogous protocol to determine the PRC to 1 h of darkness (St Hilaire et al., 2012). To produce a PRC to light that is representative of the circadian oscillator of a preschool-aged participant on a regular (non-napping) schedule, we utilize the entrained solution to the non-napping light pattern to determine initial conditions for model simulations. In contrast with the experimental PRC protocol, it was not necessary to control for the timing of sleep opportunities in the simulated PRC protocol because the model does not account for sleep homeostasis. Therefore, we eliminated the sleep opportunities and used 29- to 52-h episodes of dim light to represent the constant routines of varying duration that were specified to distribute light exposure across the 24-h day. Thus, to generate the 1-h PRC to light, the model is initialized with the entrained initial conditions and immediately enters a dim light environment of 2 lux for a variable amount of time (29-52 h). Following this period of constant dim light, the model is then exposed to 1 h of bright light (5000 or 150 lux). Then, the model enters a dim light environment for a variable amount of time representing the second constant routine. During the constant dim light periods before and after the light pulse, the timing of the minimum of
To theoretically understand how the circadian clock would shift due to a pulse of darkness, we simulate an analogous protocol to the one described above and produce theoretical 1-h PRCs to darkness. Using the same entrained initial conditions, the model immediately enters a constant light environment (5000 or 150 lux) for a variable amount of time (29-52 h). Next, the model is exposed to 1 h of dim light (2 lux) representing the dark pulse. Following the dark pulse, the model reenters the original constant light environment. During the constant light periods, the timing of
The extended periods of constant background light or constant background darkness in the PRC protocols may produce phase shifting in the model, but the magnitude of the shift will vary with light intensity because the intrinsic period of the oscillator depends on the level of light input (Forger et al., 1999). Thus, to account for phase shifting due to the background light condition, we simulated the model under constant light intensities of 2, 150, and 5000 lux and computed the resulting phase shifts. We then adjusted the PRCs by subtracting the shifts computed under constant conditions from the shifts computed in the presence of the light or dark pulse, according to which light intensity was present in the background constant conditions.
The Model in Constant Conditions and With Perturbations
Given sufficient time and constant light input,


When the model is entrained to a constant light input, the solution trajectory is a self-sustaining limit cycle in a plane specified by n∞ (I)

Note that under constant light exposure,
Reduction to 2D Model
To understand the dynamic contributions of Process L, the light processing component of the model, we considered a reduced version of the model that eliminates the n-dynamics by setting


In the reduced model case, the value of
Results
Napping and Non-napping Light Schedules
In these models of the circadian pacemaker, the timing of the minimum of
Using the model of Forger and colleagues (Forger et al., 1999), we simulated the properties of the napping light pattern independently to understand the distinct contributions of dim light exposure during a nap opportunity and bright light exposure before bedtime. We created a nap only schedule and the late bedtime only schedule as described previously in the methods. Simulating the nap only schedule, CBTmin occurs at approximately 0208 h; simulating the late bedtime only schedule, CBTmin occurs at approximately 0230 h (Figure 2a). Thus, when compared with the non-napping schedule, phase delays are predicted for both the nap only schedule (9 min) and the late bedtime only schedule (32 min). These delays collectively produce the 41-min delay predicted with the originally described napping schedule, which includes both the nap and the late bedtime (Figure 2b).
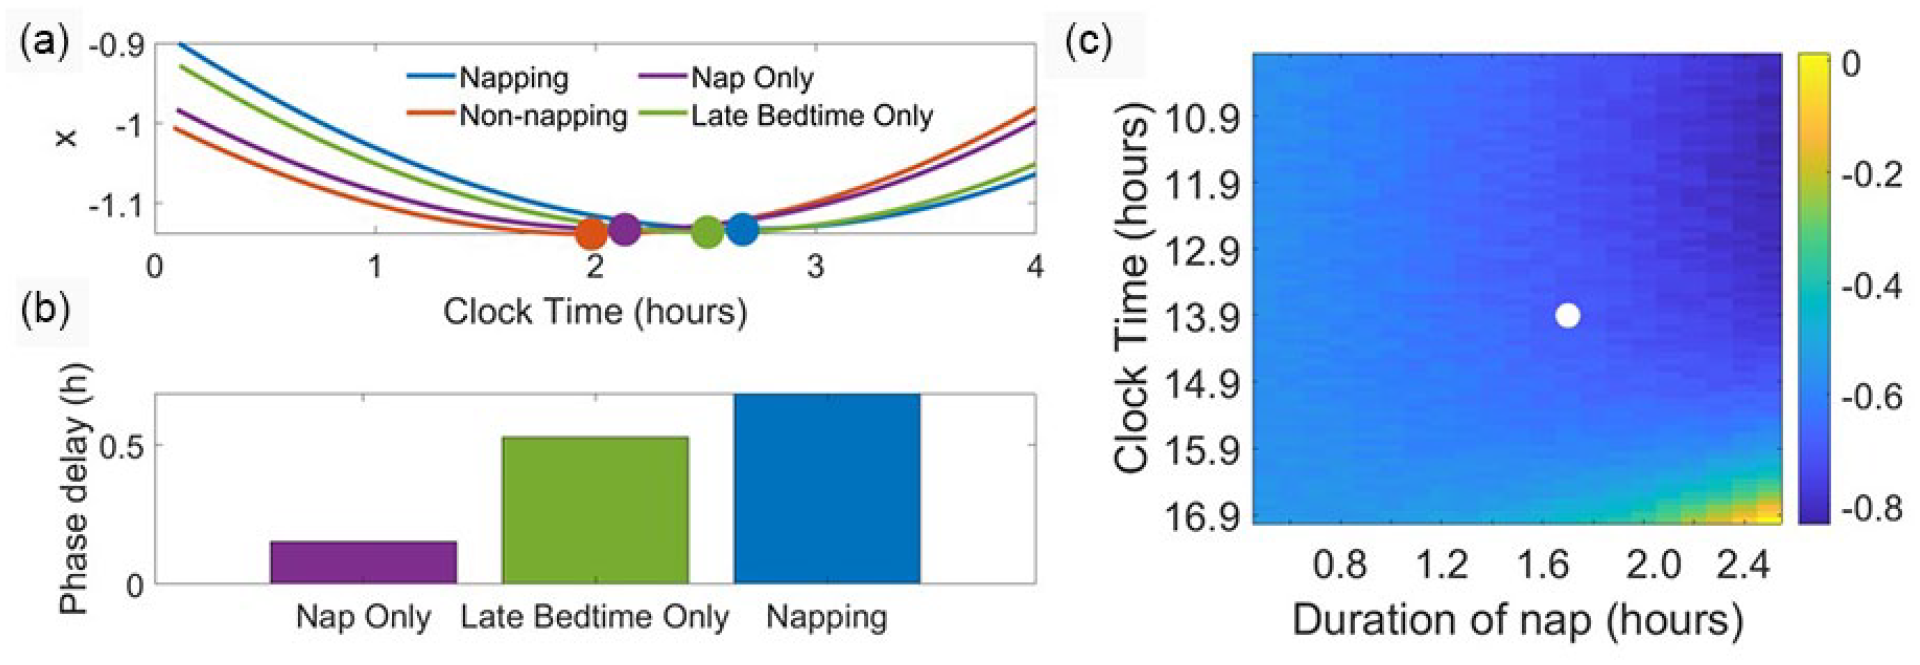
Contributions of nap and bedtime on phase shifts and the effects of varying nap properties. Light intensities for wake, sleep, and nap and the napping and non-napping light schedules are as in Figure 1. (a) Four regular light schedules are simulated: napping (timing and durations as in the napping schedule in Figure 1); nap only (102-min nap occurrence from 1354 to 1536 h and bedtime at 1933 h); late bedtime only (no nap and bedtime set to 2020 h); and non-napping (timing and durations as in the non-napping schedule in Figure 1). The four light schedules are associated with four distinct circadian phases between 0159 and 0240 h. (b) The non-napping schedule produces the earliest entrained circadian phase. The nap only, late bedtime only, and napping schedules produce circadian phases that are delayed with respect to the non-napping schedule by 0.15, 0.53, and 0.69 h respectively. (c) The heat map reports the calculated phase difference between the non-napping schedule and variations of the napping schedule (negative values are phase delays). The largest phase differences occur for long naps that occur early in the day, and the smallest phase differences occur for long naps that occur late in the day. The white marker indicates the nap start time and nap duration associated with the default napping light schedule.
In addition, we varied nap timing, duration, and light intensity to determine how these properties affected phase shifting. When the timing and duration of the nap were allowed to vary, the predicted phase differences between a schedule with a nap and the previously described non-napping light schedule ranged from [0.0137, −0.8352] h (Figure 2c). The majority of the naps considered produced phase delays, and the largest delays occurred with naps of the longest duration and earliest timing. The smallest delays and small advances occurred with naps of the longest duration and latest timing. Over the range of low light intensities that we considered, light intensity during the nap minimally affected predicted phase differences (Supplementary Figure 3).
Simulated PRCs to Light and Darkness
The simulated PRC to light shows both phase and intensity dependence, with the highest sensitivity at the phases around DLMO and the higher light intensity producing larger phase shifts (Figure 3a). Similarly, the simulated PRC to darkness also predicts a phase and intensity dependence with the highest sensitivity around DLMO and the higher constant background light level associated with larger shifts (Figure 3a). The magnitudes of the phase shifts for the light pulse protocol are larger compared with the magnitudes of the phase shifts for the dark pulse protocol. In addition, the timing of the minimum phase shift associated with the light pulse occurs slightly earlier compared with the maximum associated with the dark pulse. Given that the intrinsic period of the model varies with the background light level (24.15, 24.01, and 23.9 h for constant 2, 150, and 5000 lux, respectively), the phase shift under constant conditions also varies with the light level. Under constant 2-, 150-, and 5000-lux conditions, we calculated −0.305, −0.049, and 0.165 h shifts, respectively. These values were subtracted from the original PRC predictions to create adjusted PRCs (Figure 3b). The asymmetry and phase dependence persist for both the light and the dark pulse-adjusted PRCs; however, the intensity dependence is reduced for the adjusted dark pulse PRC compared with the unadjusted dark pulse PRC (Figure 3b). The magnitudes of the adjusted phase shifts for the light pulse protocol are larger as compared with the magnitudes of the adjusted phase shifts for the dark pulse protocol in both the 150-lux case ([0.00643, 0.22751] h for the PRC to light and [0.00060, 0.15045] h for the PRC to darkness) (t test, p = 0.00015) and the 5000-lux case ([0.01575, 0.78374] h for the PRC to light and [0.00993, 0.19312] h for the PRC to dark) (t test, p = 2.31e−11).
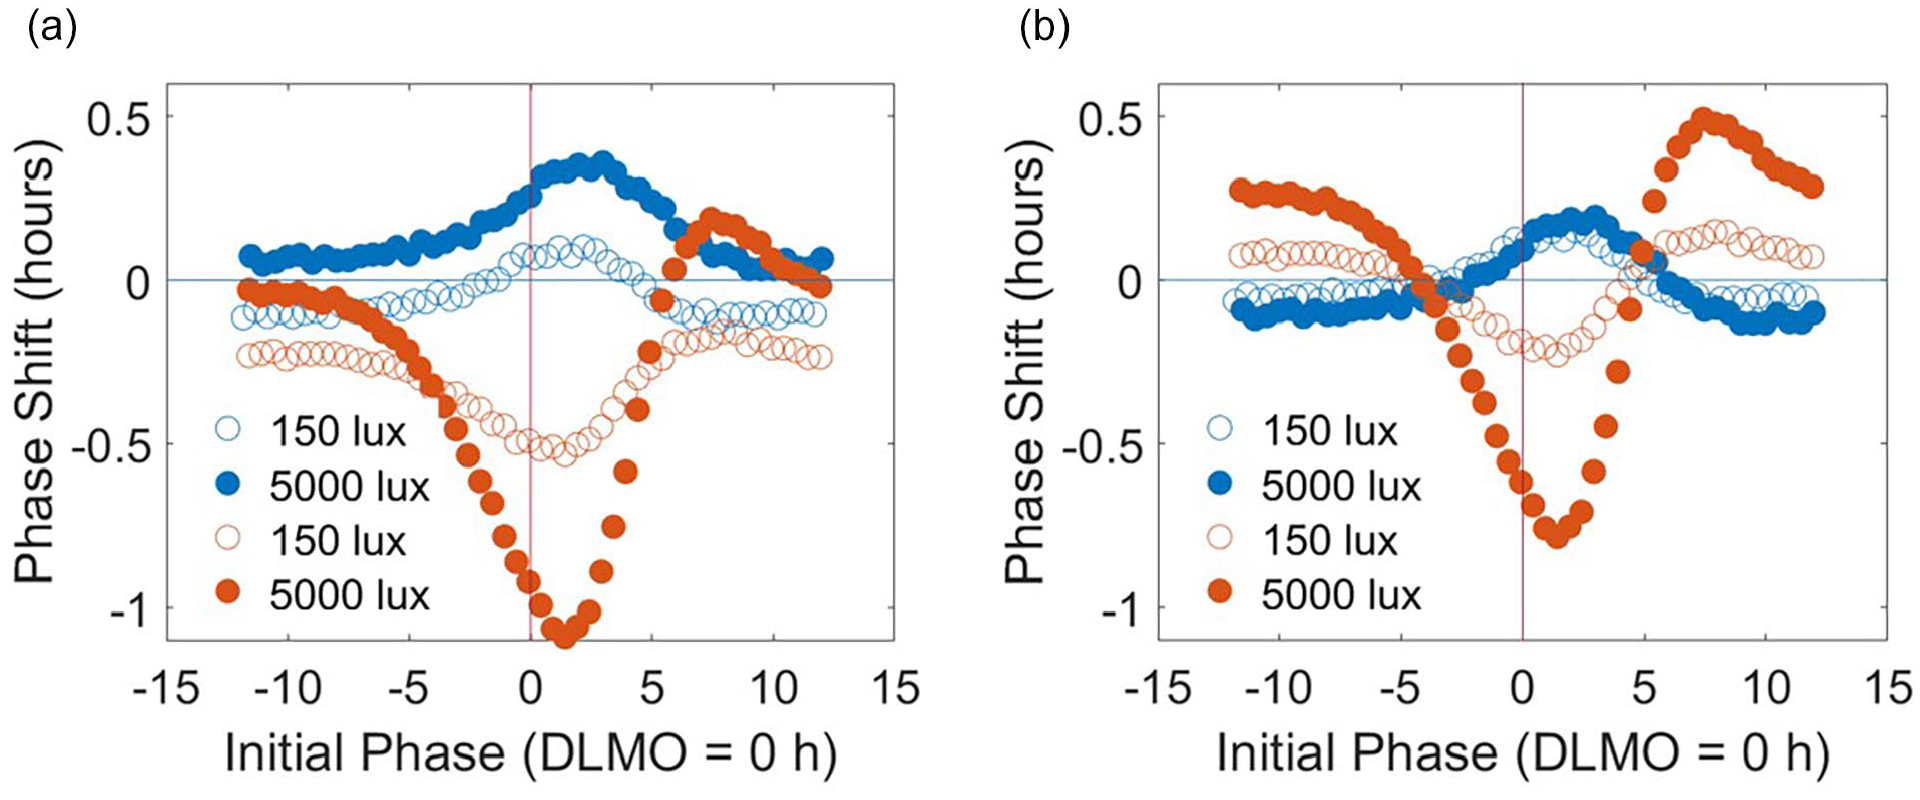
Simulated phase response curves (PRCs) to a 1-h exposure of light or dark. Each PRC protocol was simulated with early childhood initial conditions generated from the non-napping schedule. For the light pulse PRCs, a 1-h light exposure of 150 (open) or 5000 (closed) lux is administered between constant dim periods of 2 lux and produces PRCs with troughs slightly after DLMO = 0 h. For the dark pulse PRCs, a 1-h dark exposure of 2 lux is administered between constant light periods with two background light intensities of 150 (open) or 5000 (closed) lux and produces PRCs with peaks slightly after DLMO = 0 h. (a) PRCs show both intensity dependence and phase dependence for both light and dark stimuli. The light pulses produce larger magnitude phase shifts compared with the dark pulses at most circadian phases. 5000-lux light pulses or background conditions produce larger phase shifts in the light and dark pulse PRCs, respectively. (b) Adjusting the PRCs to account for phase shifting due to constant background light conditions and the system’s intrinsic period preserves phase dependence in both the light and dark pulse PRCs but reduces the intensity dependence in the dark pulse PRCs. Abbreviation: DLMO = dim light melatonin onset.
Model Dynamics in Phase Space
Under constant light conditions,
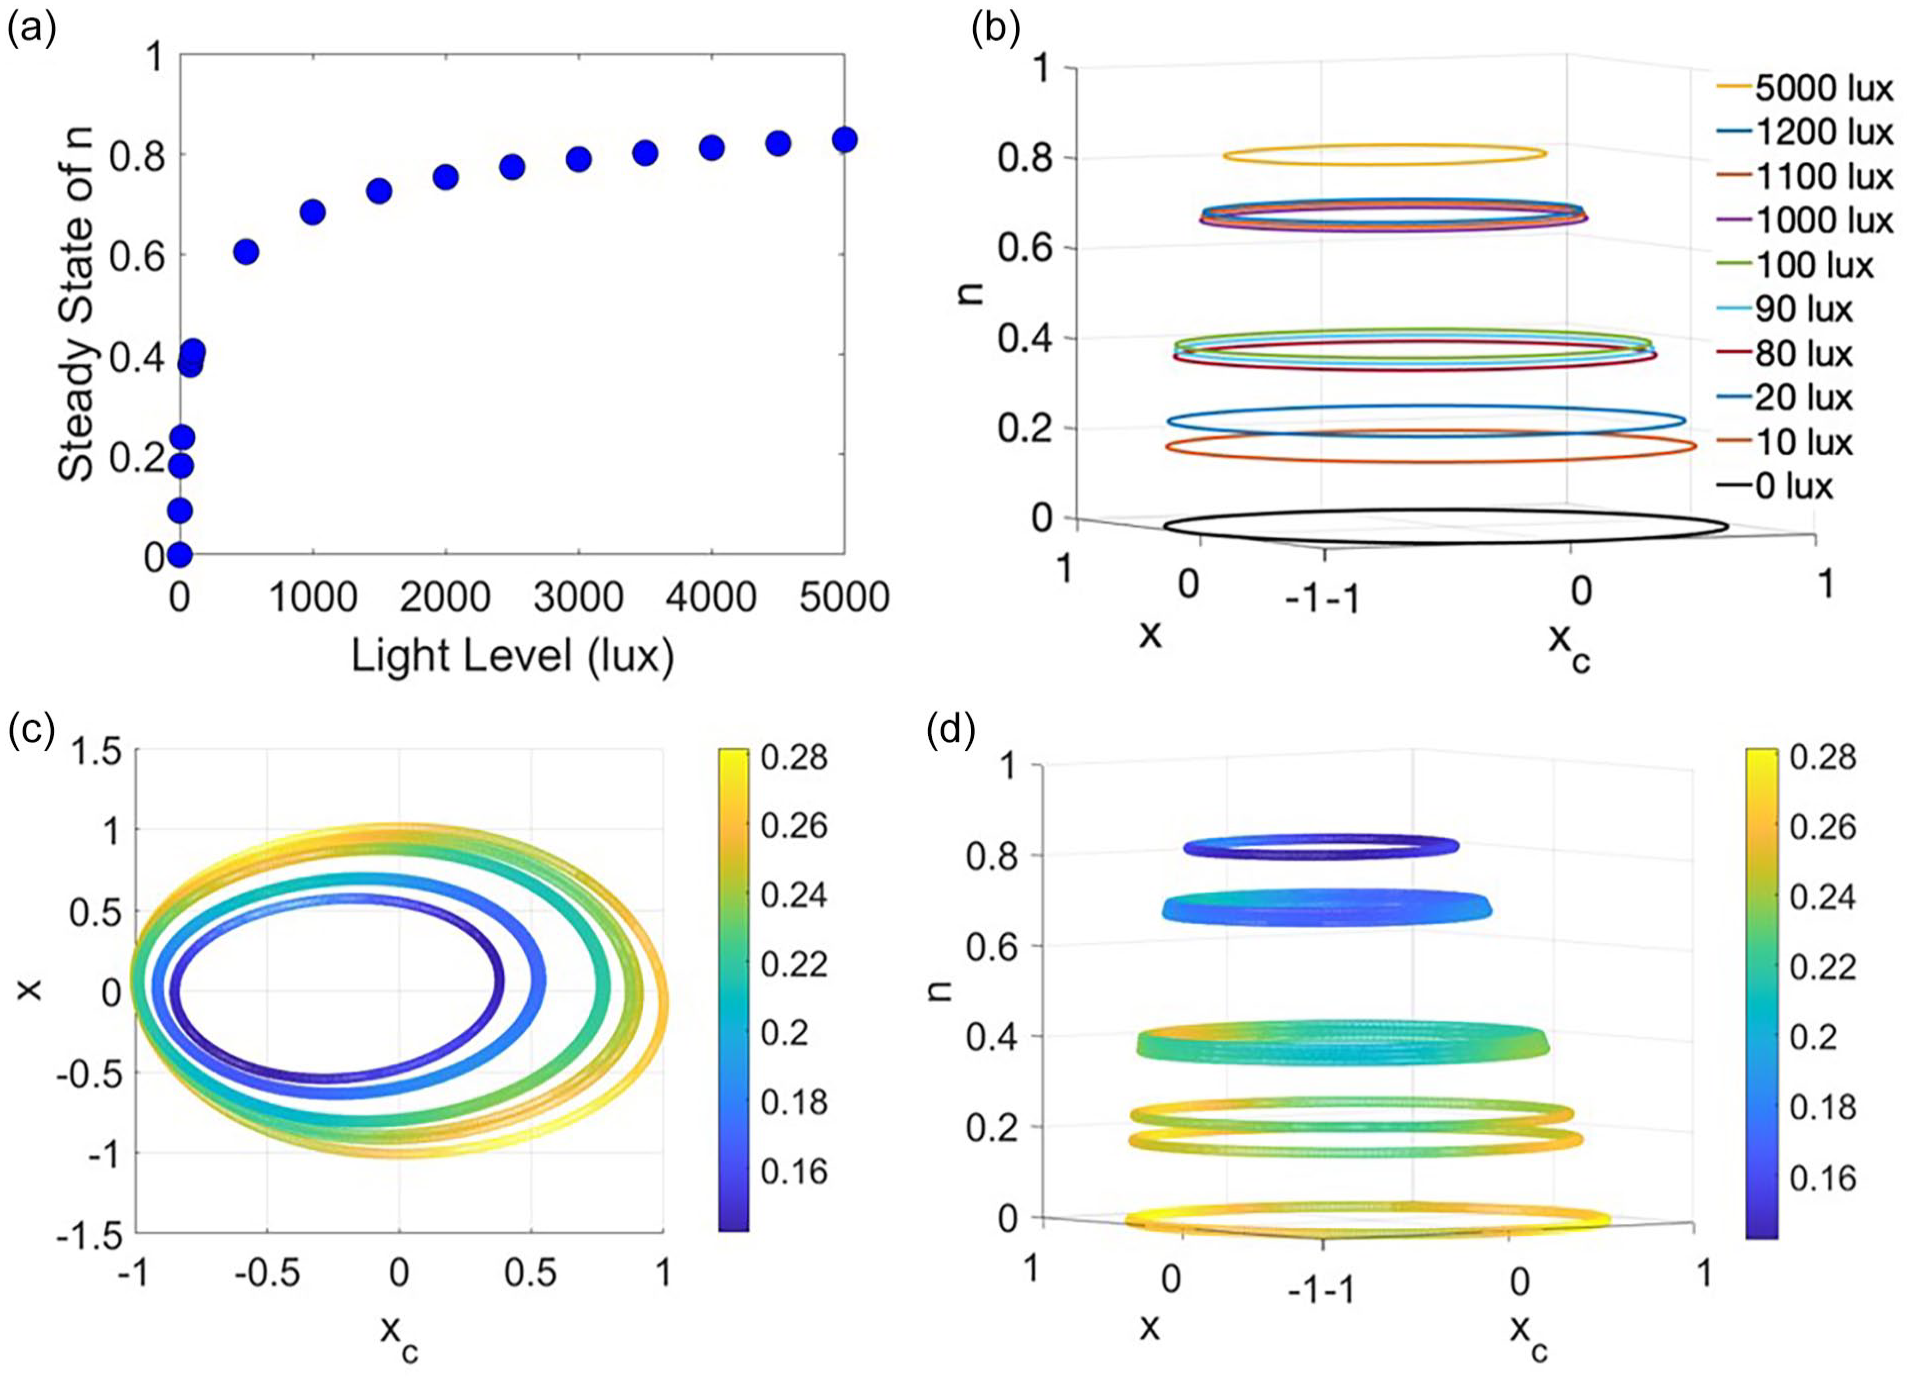
In constant light conditions, the solution trajectories form a cone of asymmetric limit cycles on planes corresponding to the steady state of n. (a) The steady state value of n, n∞, depends on (constant) light intensity and increases asymptotically toward 1 as the light level increases. (b) Limit cycle solutions for constant light inputs ranging from 0 to 5000 lux in the x-xc-n phase space. The amplitude of oscillations and the vertical distance between solutions both decrease as constant light intensity increases. (c) Limit cycle solutions projected into the x-xc plane. The magnitude of the [dx/dt, dx c /dt] vectors, denoted by the color bar, represents velocities around the limit cycles in the x-xc plane. As indicated by the colors, the velocity of the solution varies with phase around each limit cycle. (d) Velocity of limit cycle solutions for constant light inputs ranging from 0 to 5000 lux in the x-xc-n phase space varies inversely with n∞ such that velocities are slower on the limit cycles associated with high light levels compared with the velocities on limit cycles associated with low light levels.
In light schedules with variable light input, such as the napping and non-napping schedules described, solution trajectories move between planes of
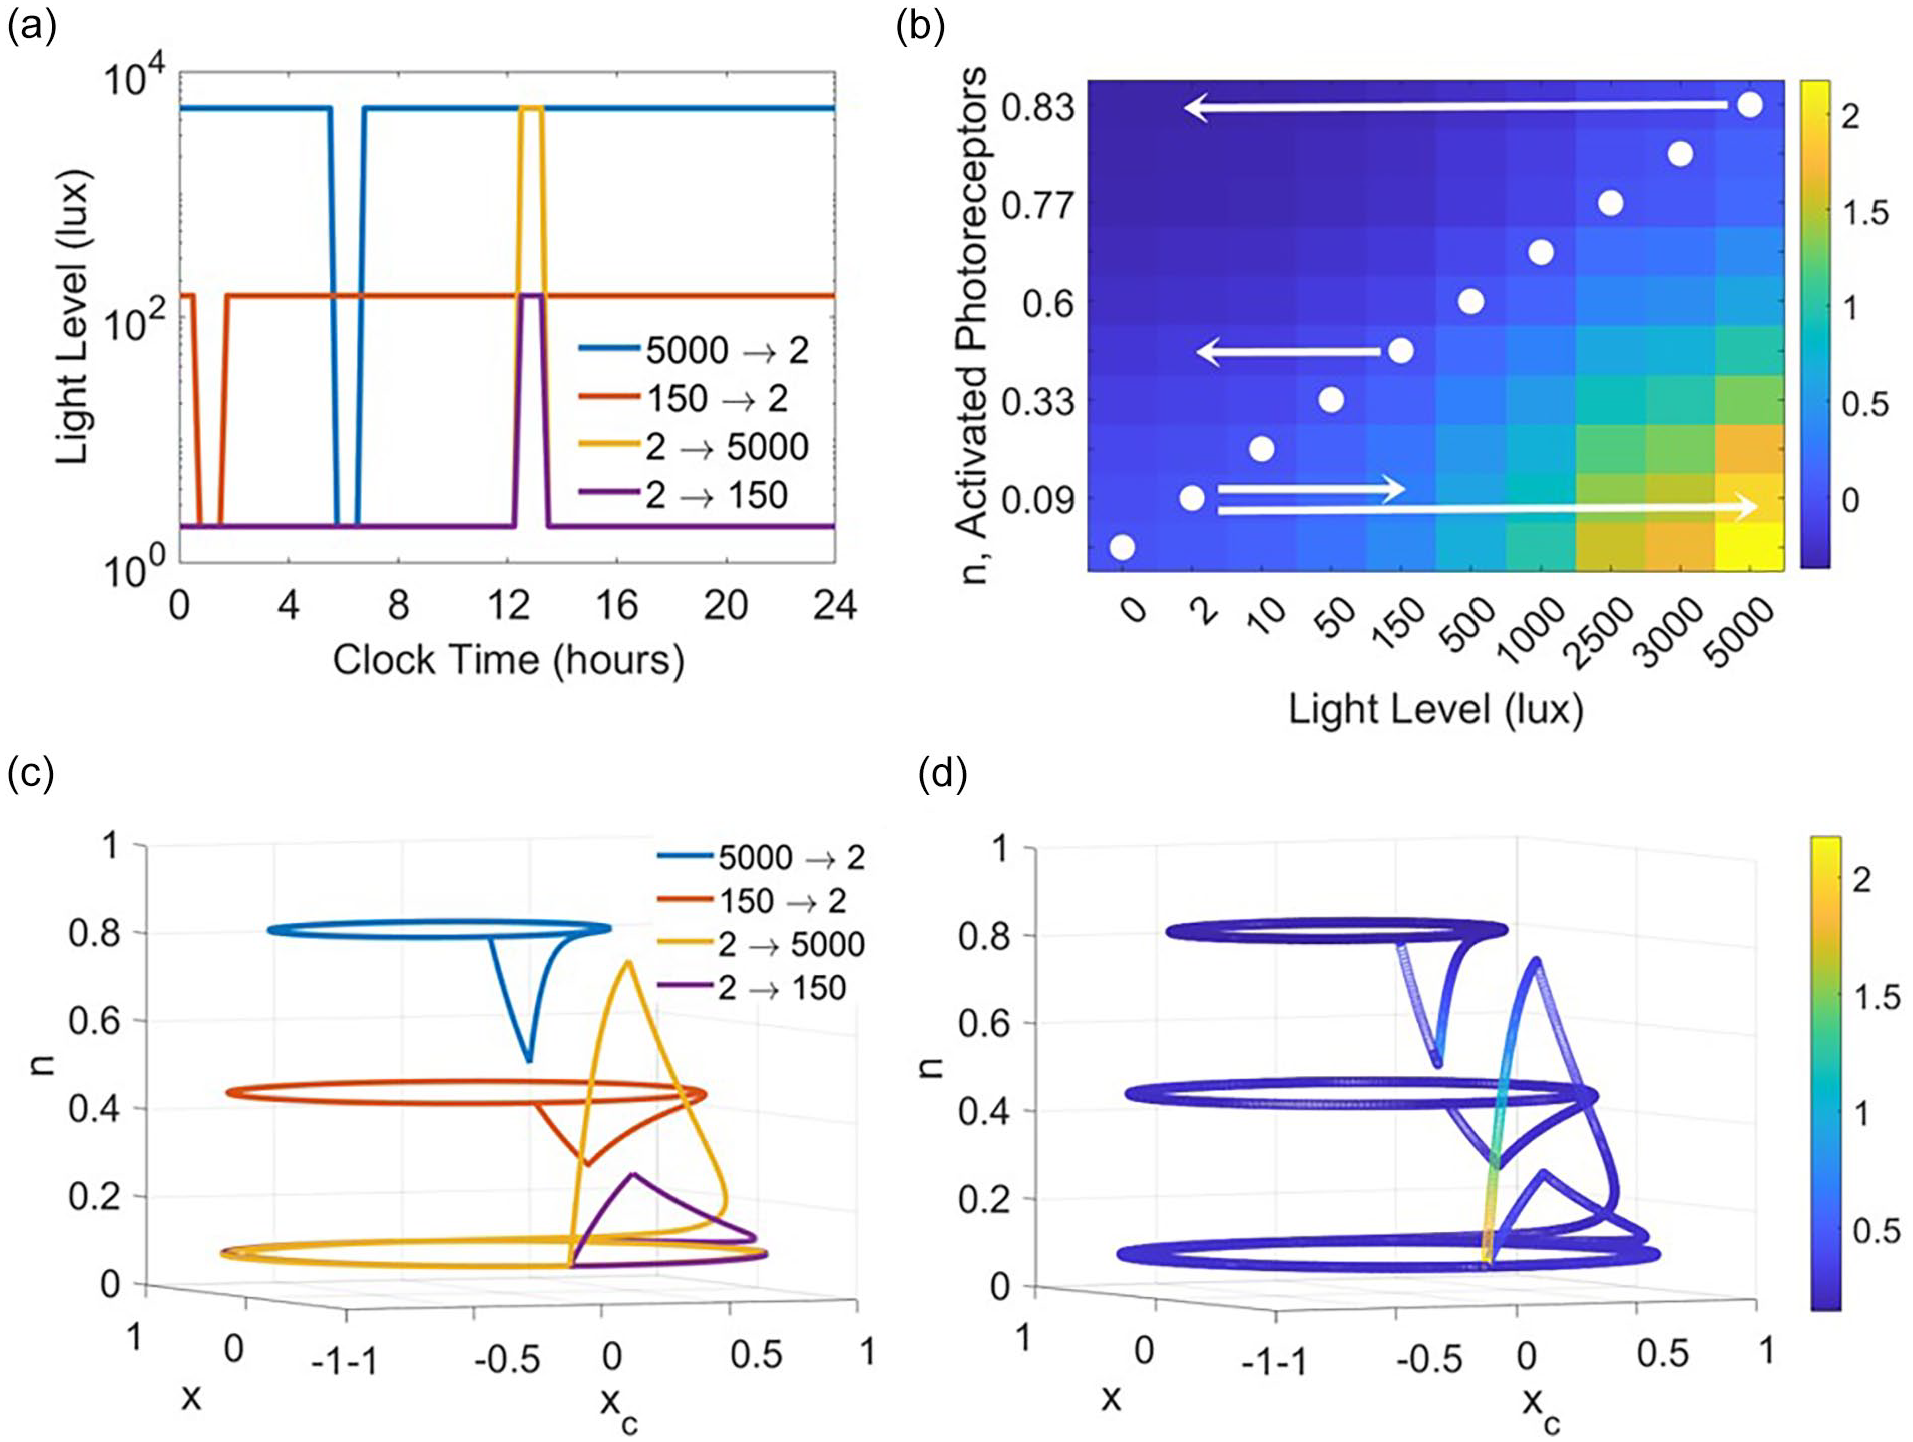
Transient solution dynamics depend on both the starting light level and the magnitude of the change in light intensity. (a) 24-h light schedules for transient solution simulations. Two schedules involve a dark pulse of 2 lux at the time of the minimum of x, with background light set to 150 or 5000 lux. In addition, two schedules involve a light pulse of 150 or 5000 lux at the time of the minimum of x, with background light set to 2 lux. (b) The heat map shows how the velocity of n, dn/dt, varies with light level and n value. The fastest changes in n occur when n is low and light intensity is high. The white circles indicate the steady state value of n for each light level. Arrows indicate the transitions in light intensities when light level is decreased from 5000 or 150 to 2 lux or increased from 2 to 150 or 5000 lux as occurs in the PRC simulations. (c) Four solution trajectories in the x-xc-n phase space approach limit cycles associated with constant light conditions and show transient excursions away from these limit cycles due to increases or decreases in light intensity. (d) Magnitude of velocity vector (dx/dt, dxc/dt, dn/dt) along four solution trajectories in the x-xc-n phase space that approach limit cycles associated with constant light conditions and show transient excursions away from these limit cycles due to increases or decreases in light intensity. Abbreviation: PRC = phase response curve.
The asymmetry in the magnitude of predicted phase shifts between the dark pulse and the light pulse protocols resulted from interactions between the differences in the limit cycles associated with the light intensities of the constant conditions and the pulse, as well as the speed at which the trajectory approaches the limit cycle associated with the pulse. To illustrate this, we analyze transient solution trajectories under four different light intensity transitions: decreasing from 150 to 2 lux, decreasing from 5000 to 2 lux, increasing from 2 to 150 lux, and increasing from 2 to 5000 lux (Figure 5a). In the dark pulse case, the transient solution moves a smaller distance from the constant light limit cycle as compared with the light pulse case in which the transient solution moves away from the dim light limit cycle (Figure 5c). Both the magnitude of the deviation from the limit cycle and the instantaneous magnitude of the vector field, which ranges from [0.1433, 2.1764], are largest when beginning at a low light level and receiving a very bright light input (Figure 5d).
Reduced Model Dynamics
To determine the contributions of Process L on the model’s predicted phase shifts, we remove the
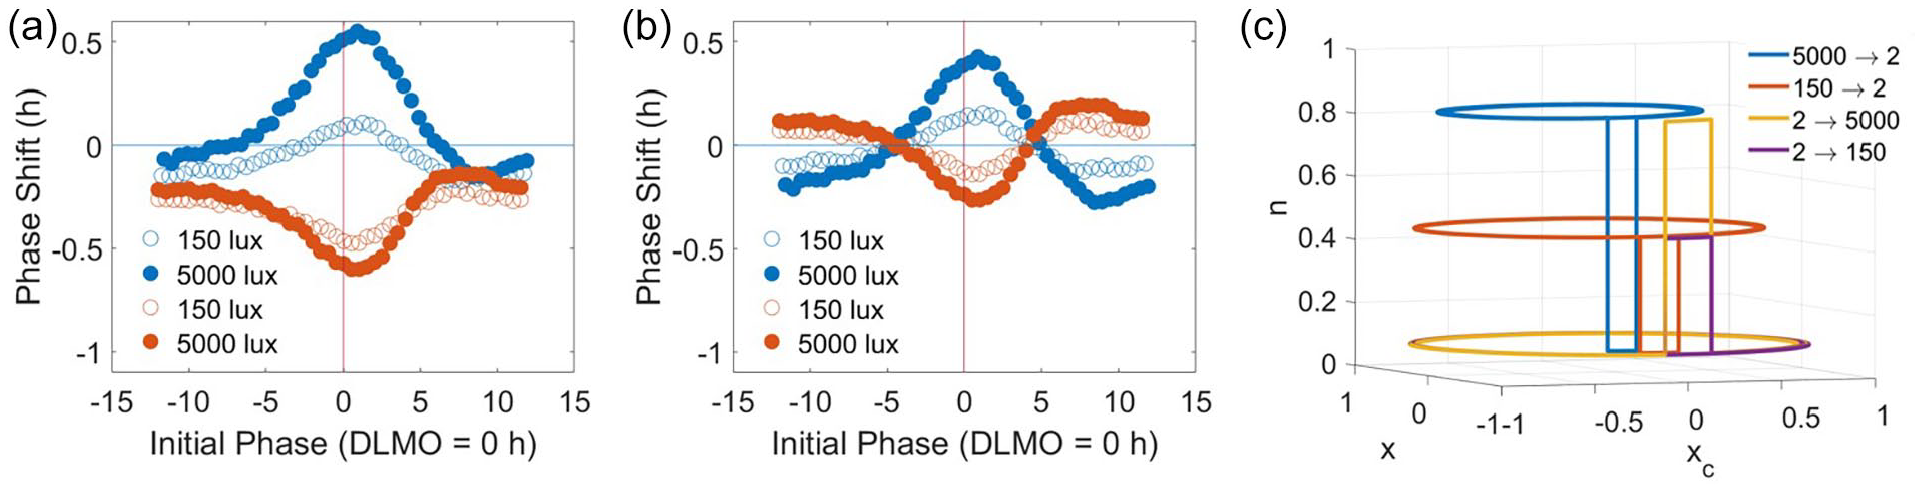
Eliminating n dynamics alters the phase shifting properties of the model. In the 2D model, n dynamics are eliminated by setting n = n∞. The light and dark pulse PRC protocols described in Figure 3 were simulated for the 2D model with early childhood initial conditions generated from the non-napping schedule. (a) PRCs for the 2D model show both intensity dependence and phase dependence for both light and dark stimuli. In contrast with the 3D model, the dark pulses produce larger magnitude shifts compared with the light pulses at most circadian phases. (b) Adjusting the PRCs for the 2D model to account for phase shifting due to constant background light conditions and the model system’s intrinsic period preserves phase dependence in both the light and dark pulse PRCs but reduces the intensity dependence in the dark pulse PRCs. (c) Four solution trajectories for the 2D model plotted in the x-xc-n phase space show instantaneous changes in n with changes in light intensity. When changes in n are instantaneous, n dynamics do not contribute to the observed phase shifts due to changes in light intensity. Abbreviations: PRC = phase response curve; 2D = two-dimensional; 3D = three-dimensional.
Observing the solution trajectories of the 2D and 3D models in phase space reveals key differences between model solution trajectories that underlie the observed differences in the PRCs associated with these models. In the reduced model, the variable
Discussion
Using a validated mathematical model of the human circadian oscillator, we determined that differences in patterns of light exposure associated with napping and non-napping light schedules could produce the circadian phase delay observed in napping compared with non-napping preschool-aged children (Akacem et al., 2015). Simulations of distinct light schedules revealed that both the nap and the later bedtime associated with the napping light schedule contributed to the 41-min predicted phase delay of nappers compared with non-nappers. However, the additional light exposure associated with the later bedtime produced a larger delay than the additional dark exposure associated with the nap. Our results are consistent with previous experimental and modeling work demonstrating that circadian timing is sensitive to different photoperiods (Glickman et al., 2012; Bordyugov et al., 2015; Schmal et al., 2015; Diekman and Bose, 2018, 2022), including our finding that the model under a typical adult light pattern predicted a later circadian phase distinct from both the toddler napping and non-napping patterns.
We also found that the magnitude of phase delays produced by the nap varied with the timing and duration of the nap, with the greatest phase delays occurring for naps with the earliest timings and longest durations. Analysis of model dynamics in phase space provided insight into the dynamical features of the model that produced these observations, as well as the reasons for asymmetry in the effects of light and dark pulses.
Constant light conditions produced limit cycles in the
Physiology of Light Processing
Early research on the mammalian eye and its role in circadian regulation indicated that rods and cones were the primary photoreceptors responsible for the communication of light input to the nonvisual system (Rodieck, 1998). However, in subsequent years, evidence began to emerge that uncharacterized photoreceptors existed in the eye and were also contributing to the regulation of the nonvisual system (Freedman et al., 1999; Lucas et al., 1999; Thapan et al., 2001). This led to the discovery of ipRGCs (Berson et al., 2002). These cells contain melanopsin, a visual pigment, and play a significant role in mediating light exposure’s contribution to circadian regulation (Hattar et al., 2002). Furthermore, ipRGCs in mice have been categorized into five types, referred to as M1-M5 (Viney et al., 2007) with each type exhibiting differences in their properties, such as intrinsic photosensitivity and firing rate, and their functions, such as circadian photoentrainment and detecting motion (Ecker et al., 2010; Hu et al., 2013; Zhao et al., 2014). New uncharacterized cell types in the retina are still being discovered (Quattrochi et al., 2019; Young et al., 2021), and the influence of the wavelength of light may be unique for different types of photoreceptors (Berson et al., 2002; Lall et al., 2010; Lucas et al., 2014).
In this study, we were interested in the physiology of light processing during early childhood development. There is a growing literature indicating high circadian sensitivity to light in young children (Higuchi et al., 2014; Akacem et al., 2018; Hartstein et al., 2022a, 2022b), and it is thought that this high level of sensitivity may be attributed to physiological changes that occur across the lifespan. Higuchi and colleagues found that, under both dim and bright light conditions, children exhibited larger pupil sizes as compared with their parents (Higuchi et al., 2014). They have also found a correlation in adults between larger pupil diameter and greater melatonin suppression due to light exposure (Higuchi et al., 2008). In addition to changes in pupil size, the clarity of ocular lenses decreases with age. Ocular lenses become increasingly yellow across the lifespan, decreasing the transmission of light to photosensitive cells in the retina (Charman, 2003). Rodent studies have suggested developmentally mediated changes in the light processing communication pathway. Between young and mature mice, the amount of ipRGCs in the retina decreases (Sekaran et al., 2005). As young mice develop, rods and cones begin contributing light information (Schmidt et al., 2008) and there is an increase in the strength of the signals sent to the SCN (Brooks and Canal, 2013). Understanding the developmental changes in the human light processing system will continue to be an important area of research to understand more about the circadian system in early childhood.
Mathematical Models of Light Processing
The mathematical model we focused on in this study includes a phenomenological representation of light processing that was developed based on the idea that a photoreceptor exposed to light will send a signal to the SCN, but in doing so the photopigment within the cell will be unable to send another signal until sufficient time has passed (Kronauer et al., 1999). The model was fit to experimental studies where participants were exposed to very bright light (~9500 lux) (Khalsa et al., 1997; Forger et al., 1999). There are limited data describing the dynamics of light processing in young children. Later mathematical models of the human circadian clock have refined the light processing dynamics and introduced the effects of nonphotic inputs, such as changing sleep-wake status, on the circadian clock (St Hilaire et al., 2007). In this study, we obtained similar results using the Forger et al. model and the model developed by St. Hilaire and colleagues to compare the effects of napping and non-napping light schedules. However, interestingly, the updated light processing proposed by St. Hilaire and colleagues had the greatest effect on light signals below 150 lux. This difference would have a minimal effect under our light protocols since the waking light intensity in our simulations was much higher than 150 lux being set at 2241 lux. However, recent experimental work suggests that the circadian system of young children is highly sensitive to lower light intensities, indicating that the original model of Process L may be better suited to describing the effect of light on the circadian pacemaker of young children. More research is needed to investigate this hypothesis. More recently, other mathematical models have investigated the interactions among different types of ipRGCs (Walch et al., 2015) and considered the effects of different wavelengths of light on phase shifting properties of circadian clock models (Tekieh et al., 2020). Future work extending these findings may establish a physiological basis for the light processing dynamics incorporated in the original model of Process L (Kronauer et al., 1999).
Predicted Phase Shifting Effects of Naps
This simulation-based study suggests that the loss of light exposure associated with a short (1-2 h) nap or nap opportunity in dim light can delay the circadian clock and affect the processing of subsequent light exposure. The cumulative delay effect of a nap and later bedtime may be stronger in young children than in adults due to differences in circadian timing and phase of entrainment to sleep onset (LeBourgeois et al., 2013). A previous experimental study in adults found that morning naps advance and evening naps delay circadian phase; afternoon naps, however, did not affect circadian phase (Buxton et al., 2000). The naps in the study by Buxton and colleagues had a duration of 6 h, a much longer duration than the naps typically observed in early childhood. We hypothesize that the nap-induced delay observed in our study occurs due to a reduction in phase advancing afternoon light exposure. The delay, however, is confounded for naps that are sufficiently long to include regions of the dark pulse PRC associated with small advances or delays, particularly when interindividual variability is considered (Crosby, 2005; Crowley and Eastman, 2017; Chellappa, 2021). Furthermore, the model predicts that when a nap occurs during the advance region of the light pulse PRC (in the morning and afternoon), the phase delay due to evening light exposure is larger compared with a non-napping light pattern. This larger phase difference occurs because the decreased light level during the nap amplifies the phase delay induced by light exposure in the evening.
Limitations
There are two main limitations of this work. First, this model was fit to and validated on datasets characterizing the healthy adult circadian clock. At this time, similar datasets characterizing the circadian clock in preschool children are not available. It is therefore unknown how the circadian waveform and response to light differ in early childhood compared with adulthood. In addition, age-related physiological changes in the eye, such as yellowing of lenses and decreased pupil size, have been observed and may influence light processing. Furthermore, light sensitivity in this age group has been found to be high around bedtime (Higuchi et al., 2014; Akacem et al., 2016, 2018; Hartstein et al., 2022a, 2022b). Analyses of the phase shifting properties of the circadian clock in grade school children and adolescents have not identified major differences compared with adults (Crowley and Eastman, 2017; Moreno et al., 2022); additional experimental research utilizing innovative protocols are necessary to address these gaps. Second, the behavioral and observational data used in this study are from a small cohort of healthy, good-sleeping participants. Studies on sleep during early childhood in more diverse participant cohorts are needed to investigate the likely effects of distinct light schedules on the circadian clock.
Conclusions and Implications
Using an established model of the adult human circadian pacemaker entrained to light schedules consistent with early childhood, we showed that differences in light exposure associated with napping and non-napping light patterns can produce the observed phase difference in the circadian clocks of napping and non-napping toddlers. Future work applying approaches such as entrainment maps may provide additional insight into differences in oscillator properties between oscillators entrained to the napping or non-napping light schedules, respectively (Diekman and Bose, 2018, 2022). Model analysis revealed a key influence of the dynamics of light processing on predicted phase shifts. However, more experimental research is needed to understand how light sensitivity and dynamics may change across development and to elucidate the impacts of such changes on the circadian system (Higuchi et al., 2014; Hartstein et al., 2022a, 2022b). Moreover, studies of historical patterns of light exposure have established that light exposure changes over time with changes in cultural norms and the advent of new technologies (Ekirch, 2016). For example, access to screens is pervasive and becoming more prevalent for humans at all stages of development. There is a growing literature about the effects of screen usage and its relationship to human circadian health and development. Research suggests that increased screen time is associated with delayed bedtimes and shorter total sleep time in children and adolescents (Hale and Guan, 2015; LeBourgeois et al., 2017), and in adults, screen usage before bed suppresses melatonin production and reduces next-morning alertness (Chang et al., 2015). To promote the healthy consolidation of sleep during early childhood, as well as to increase treatment efficacy of circadian and sleep disorders across the lifespan, improved understanding of the developing circadian system is of great importance.
Supplemental Material
sj-docx-1-jbr-10.1177_07487304231180953 – Supplemental material for Modeling the Effects of Napping and Non-napping Patterns of Light Exposure on the Human Circadian Oscillator
Supplemental material, sj-docx-1-jbr-10.1177_07487304231180953 for Modeling the Effects of Napping and Non-napping Patterns of Light Exposure on the Human Circadian Oscillator by Shelby R. Stowe, Monique K. LeBourgeois and Cecilia Diniz Behn in Journal of Biological Rhythms
Footnotes
Acknowledgements
The authors would like to thank the participants and their families for their contributions to this work. This study was supported in part by the National Institutes of Health Grants K01-MH074643, R01-MH086566, R0I-HD087707, T32-HL149646 and the National Science Foundation Grant DMS 1853511.
Conflict of Interest Statement
The author(s) declared the following potential conflicts of interest with respect to the research, authorship, and/or publication of this article: SRS has no financial or personal conflicts to declare. MKL reports receiving travel funds from the Australian Research Council and research support from the National Institutes of Health, beyond the submitted work. CDB reports receiving research support from the National Institutes of Health, the National Science Foundation, LumosTech, and the Juvenile Diabetes Research Foundation, outside the submitted work.
Supplementary material is available for this article online.
References
Supplementary Material
Please find the following supplemental material available below.
For Open Access articles published under a Creative Commons License, all supplemental material carries the same license as the article it is associated with.
For non-Open Access articles published, all supplemental material carries a non-exclusive license, and permission requests for re-use of supplemental material or any part of supplemental material shall be sent directly to the copyright owner as specified in the copyright notice associated with the article.