
Abstract
Circadian rhythms are ubiquitous and are observed in all biological kingdoms. In nature, their primary characteristic or phenotype is the phase of entrainment. There are two main hypotheses related to how circadian clocks entrain, parametric and non-parametric models. The parametric model focuses on the gradual changes of the clock parameters in response to the changing ambient condition, whereas the non-parametric model focuses on the instantaneous change of the phase of the clock in response to the zeitgeber. There are ample empirical data supporting both models. However, only recently has a unifying model been proposed, the circadian integrated response characteristic (CiRC). In the current study, we developed a system of ordinary differential equations, dynamic CiRC (dCiRC), that describes parameters of circadian rhythms and predicts the phase of entrainment in zeitgeber cycles. dCiRC mathematically extracts the underlying information of velocity changes of the internal clock that reflects the parametric model and the phase shift trajectory that reflects the non-parametric model from phase data under entraining conditions. As a proof of concept, we measured clock parameters of 26 Neurospora crassa ecotypes in both cycling and constant conditions using dCiRC. Our data showed that the morning light shortens the period of the clock while the afternoon light lengthens it. We also found that individual ecotypes have different strategies of integrating light effects to accomplish the optimal phase of entrainment, a model feature that is consistent with our knowledge of how circadian clocks are organized and encoded. The unified model dCiRC will provide new insights into how circadian clocks function under different zeitgeber conditions. We suggest that this type of model may be useful in the advent of chronotherapies.
Most living organisms on the earth orchestrate their behaviors and underlying physiology in accordance with the 24 h rotation of the earth. The cyclic environment is perceived by the organism via different cues such as the light-dark cycle, food availability, temperature changes, and social interactions. The basis for all of these daily changes is the light-dark cycle, which is therefore the predominant environmental cue (zeitgeber) integrated by circadian clocks (Hurley et al., 2015; Young, 2018; McClung, 2019; Welkie et al., 2019; Koronowski and Sassone-Corsi, 2021). Although the key molecular players in generating the circadian rhythm signals are different, there are significant common design principles found in clocks in various model organisms (Young, 2018; Loros, 2020). Their common characteristics include an endogenous, self-sustained circa 24 h (hence circadian) rhythm that persists in constant conditions, with a period length that is relative insensitive to temperature changes within a physiological range (temperature compensation) (Francois et al., 2012; Tseng et al., 2012). In entraining conditions, the clock is adjusted to the local time. A characteristic relationship between the zeitgeber cycle and the endogenous circadian clock defines the phase of entrainment (Roenneberg et al., 2010a; Hastings et al., 2019; An et al., 2021). The robust and sustainable 24 h period of the circadian clock, and its relative independence from temperature is intriguing, challenging the basic assumptions of biological processes. The results of mutant screens have addressed these mechanisms. We have a good appreciation of the molecular mechanisms for generating 24 h rhythms in constant condition. In comparison, we have much less understanding of entrainment and its role in the ecology of the clock in a natural, cycling environment (Roenneberg et al., 2010a; Welkie et al., 2019).
There are two contrasting models concerning the mechanisms of entrainment, parametric and non-parametric. The non-parametric approach assumes entrainment occurs due to an instant shift of internal phase in response to the zeitgeber transition while the clock’s parameters do not reset (Comas et al., 2006). The phase shift is described by the Phase Response Curve (PRC) (Bruce and Pittendrigh, 1958; Johnson, 1992). In contrast, the parametric approach indicates that the velocity change of the internal clock caused the entrainment, expressed in a form called Velocity Response Curve (VRC) Taylor et al., 2010). Both PRC and VRC are based on the recorded phase changes in stable conditions, usually one or more days after the light-dark transition occurs. The traditional non-parametric and parametric approaches of modeling entrainment are built on the phase-only models, meaning the only output is the phase shift.
In an attempt to integrate these two views on how circadian clocks function in a cycling environment, a model was proposed, the Circadian Integrated Response Characteristic (CiRC) (Roenneberg et al., 2010a). CiRC is based on an assumption of period matching between the endogenous clock and the zeitgeber. The organism integrates light differentially according to internal time to adjust the internal cycle length to that of the zeitgeber. Specifically, the light around dawn compresses the internal cycle, and light around dusk expands it. In comparison to the traditional approaches, CiRC has several key advantages. First, CiRC makes the natural assumption of period matching. The clock actively entrains to the zeitgeber signal, adjusting the velocity of the internal clock. Second, CiRC proposes a robust way of light functioning in the entrainment process. The light stimuli accelerate or decelerate the clock according to the internal time. Third, a variety of zeitgeber structures (e.g. photoperiod or thermoperiod) lend themselves to CiRC analysis and modeling. It allows us to study how the zeitgeber properties affect the entrainment. The CiRC should also reveal unique properties of various zeitgebers and their distinct signaling mechanisms.
In the current study, we develop a mathematical model reflecting the premises of both parametric and non-parametric natures of the circadian clock, dCiRC. The dCiRC faithfully describes the overt rhythms and molecular rhythms in both constant and cycling conditions. The dCiRC model describes the phase shift trajectory and the continuous velocity changes of the internal clock in a cycling condition. For the proof of concept, we analyzed 25 Neurospora ecotypes using dCiRC and found that these ecotypes have genotype-specific CiRC shapes, light receptor sensitivity, and elasticity.
Material and Methods
Neurospora Strains and Cultures
The N. crassa ecotypes were gifts from Dr. L. Glass at University of California, Berkeley; D116, D117, D119, JW161, JW162, JW168, JW169, JW172, JW176, JW18, JW180, JW200, JW22, JW220, JW224, JW228, JW238, JW24, JW260, JW261, JW59, JW60, P4463, P4469, P4483. DBP338 (frq7, bd) was a gift from Dr. S. Crosthwaite at NIAB EMR, UK. FGSC#2489 was received from the Fungal Genetics Stock Center (Manhattan, KS). The translational FREQUENCY: LUC reporter bearing strain X716-6a (called L3 in this report) was a gift from Dr. L. Larrondo at Pontificia Universidad Católica de Chile. The developmental rhythm was measured by Inverted Race Tube Assay as previously reported (Park and Lee, 2004). In short, we performed the experiment in two laboratory conditions, constant darkness (DD) and 12 h light: 12 h dark cycling condition (LD). We analyzed 25 N. crassa natural strains, the reference strain FGSC#2489, and DBP338 (frq7; rasbd) in DD and LD. For the chamber experiments, the inoculated race tubes are kept in a growth chamber (E-41L2, Percival) under different light conditions (DD and LD) at constant temperature 25°C. The chambers are located in a temperature controlled (25°C) and light-tight room. In the room, there are two different lights, white light and red light. All race tube manipulations are performed under red light, which does not interrupt circadian regulation. Onset® HOBO® Data Loggers are used to record the temperature and light intensity in each experiment as an independent validation of the light and temperature conditions. Digital images of the race tubes were analyzed to calculate the clock properties, period and phase of entrainment, using the software Chrono (Roenneberg and Taylor, 2000) and the web-based program BioDare2 (Zielinski et al., 2014).
Measuring Molecular Rhythms
Luminometry requires darkness to detect the photon emission from the cell. However, our goal is measuring the molecular clock in a light: dark cycling condition. We optimized the assay condition to measure the luciferase activity of a strain bearing a FREQUENCY luciferase translational fusion construct in a light: dark cycling condition (Suppl. Fig. S1).
Circadian Integrated Response Characteristic (CiRC)
CiRC describes the circadian system’s phase-dependent capacity to compress or expand its internal cycle length (denoted by
CiRC is composed of a sine curve and its second harmonic, see Eq (1). The second harmonic coefficient is defined as a shape factor(s). It determines the extent of the dead zone around noon. An asymmetry factor (
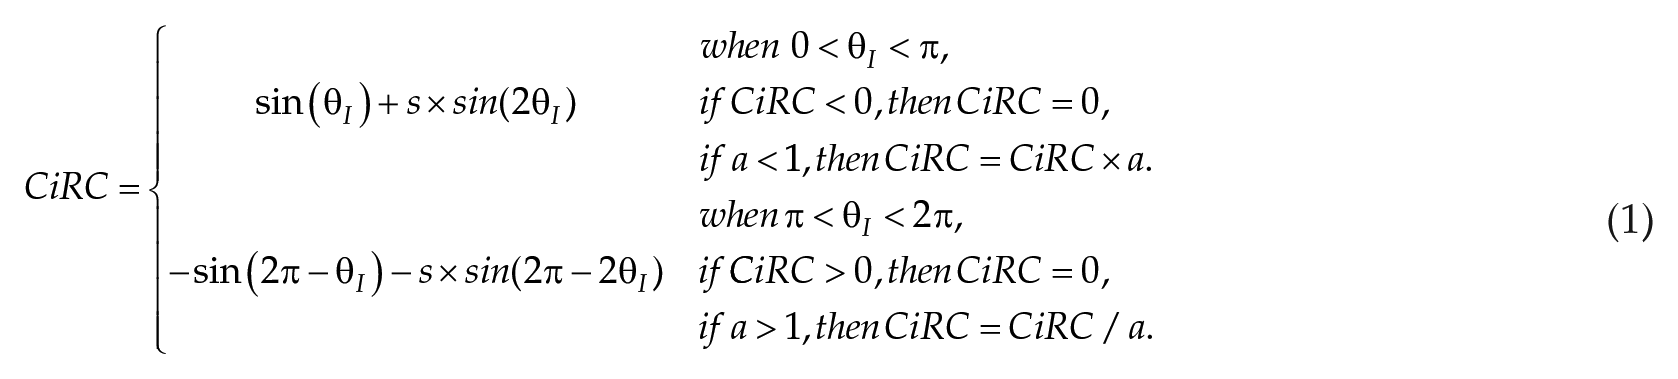
where
Expressing Biological Times: Two Conventions
The CiRC concept was developed using the convention “external time” (ExT) and “internal time” (InT) (Daan et al., 2002). The readers are encouraged to refer to the editorial paper for the full discussion on why ExT and InT were proposed. Our goal for the current study is developing ODEs that are faithfully reflecting the properties of CiRC (Roenneberg et al., 2010a). At the same time, we wanted to use ZT and CT, which are more commonly used conventions in the community. Briefly, ExT is the number of hours × 24/T elapsed since the middle of the dark period, where T is the duration of the LD cycles in hours. ln T = [CT – 18]. CT0 is aligned with ZT0 to follow the convention.
Dynamic Circadian Integrated Response Characteristic (dCiRC) Model
The dynamic CiRC model is composed of the CiRC equations and a system of ODEs to govern the behaviors of the zeitgeber cycle and the internal clock:
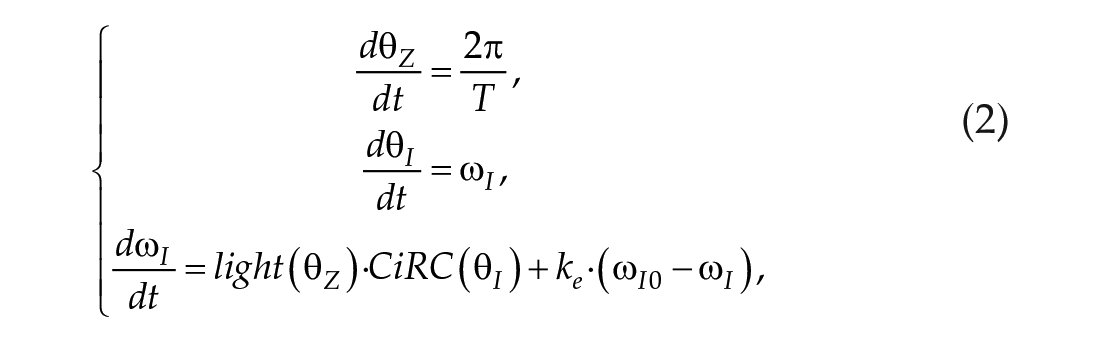
with:

Where
The first equation in Eq (2) governs the rate of change of
Phase of Entrainment
Entrainment occurs when the circadian rhythm overcomes the period mismatch to adjust its period to that of the external environment (Duffy and Wright, 2005). Entrainment is characterized by a stable phase relationship with the ambient environment. The period-phase relationship between the internal clock and zeitgeber has been extensively studied in previous works (Daan and Pittendrigh, 1976; Wright et al., 2001; Duffy and Wright, 2005; An et al., 2021; Hoffmann, 1962). During the synchronization process, the phase differences (denoted by
Analysis of Entrainment Data
Data Processing
For developmental rhythm data: first, the beginning and the end of raw data are removed to exclude the outlying points. Subsequently, the truncated data is detrended using the MATLAB detrend function. We chose to subtract a quadratic trend from the data because the linear detrended results still have a clear trend that affects the following amplitude normalization process for some of the data entries. For those data entries that both the linear and quadratic detrend methods apply, we generate the final normalized data with both methods and calculate the
Determination of dCiRC Parameters
To determine the best-fitting dCiRC parameters for each genotype, we fit the simulated dCiRC phase trajectory to the processed data and solve a convex optimization problem. We apply the MATLAB PSO (Particle Swarm Optimization) algorithm with the following convex cost function:
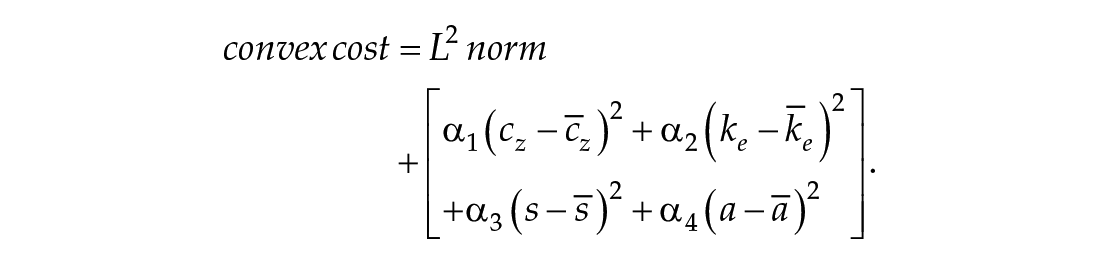
where
For all genotypes, we fit the data and take the average
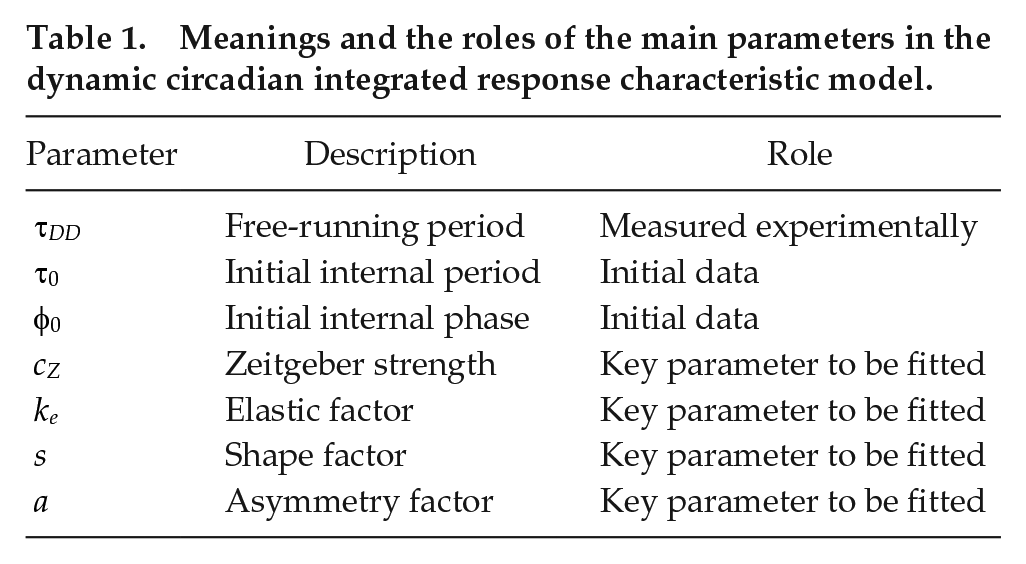
Meanings and the roles of the main parameters in the dynamic circadian integrated response characteristic model.
Results
The Velocity of the Clock
in dCiRC
To determine if dCiRC (Materials and Methods) reflects both the change of the circadian clock velocity and the phase of entrainment, we simulated the dCiRC model under different light conditions (Figure 1). The light profile was composed of two rounds of zeitgeber cycles which were repeated twice. In each of the 35 day rounds, the first 20 days were a 24 h zeitgeber cycle (12 h:12 h, light on at ZT0, light off at ZT12) conditions, and the remaining 15 days were under DD conditions. We choose the CIRC variant in Figure 1a with
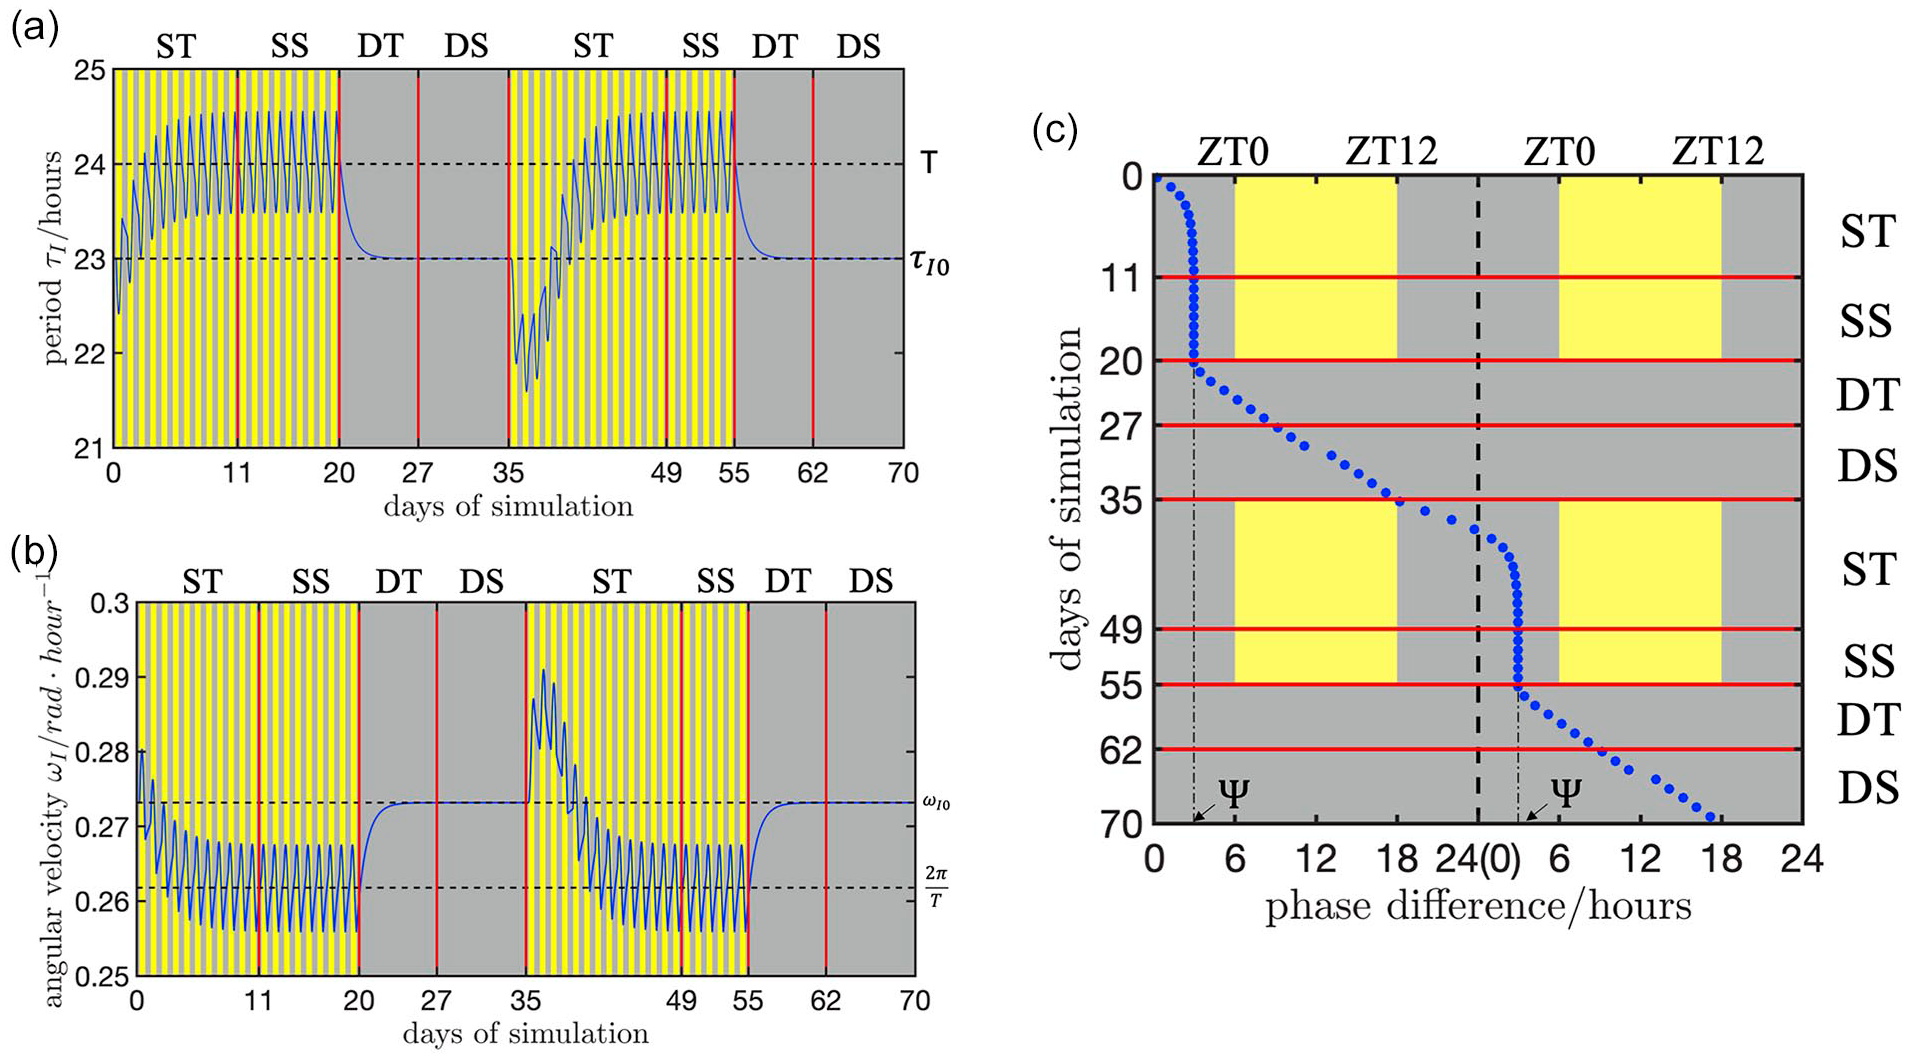
Simulations of the dCiRC model showing the clock’s velocity (
Genotype-Specific dCiRC Parameters
Next, we aimed to identify the clock parameters based on the experimental data in entraining conditions. For this, we assayed the overt daily rhythm of asexual development in 25 N. crassa natural ecotypes and a long-period mutant DBP338 (frq7; rasbd,
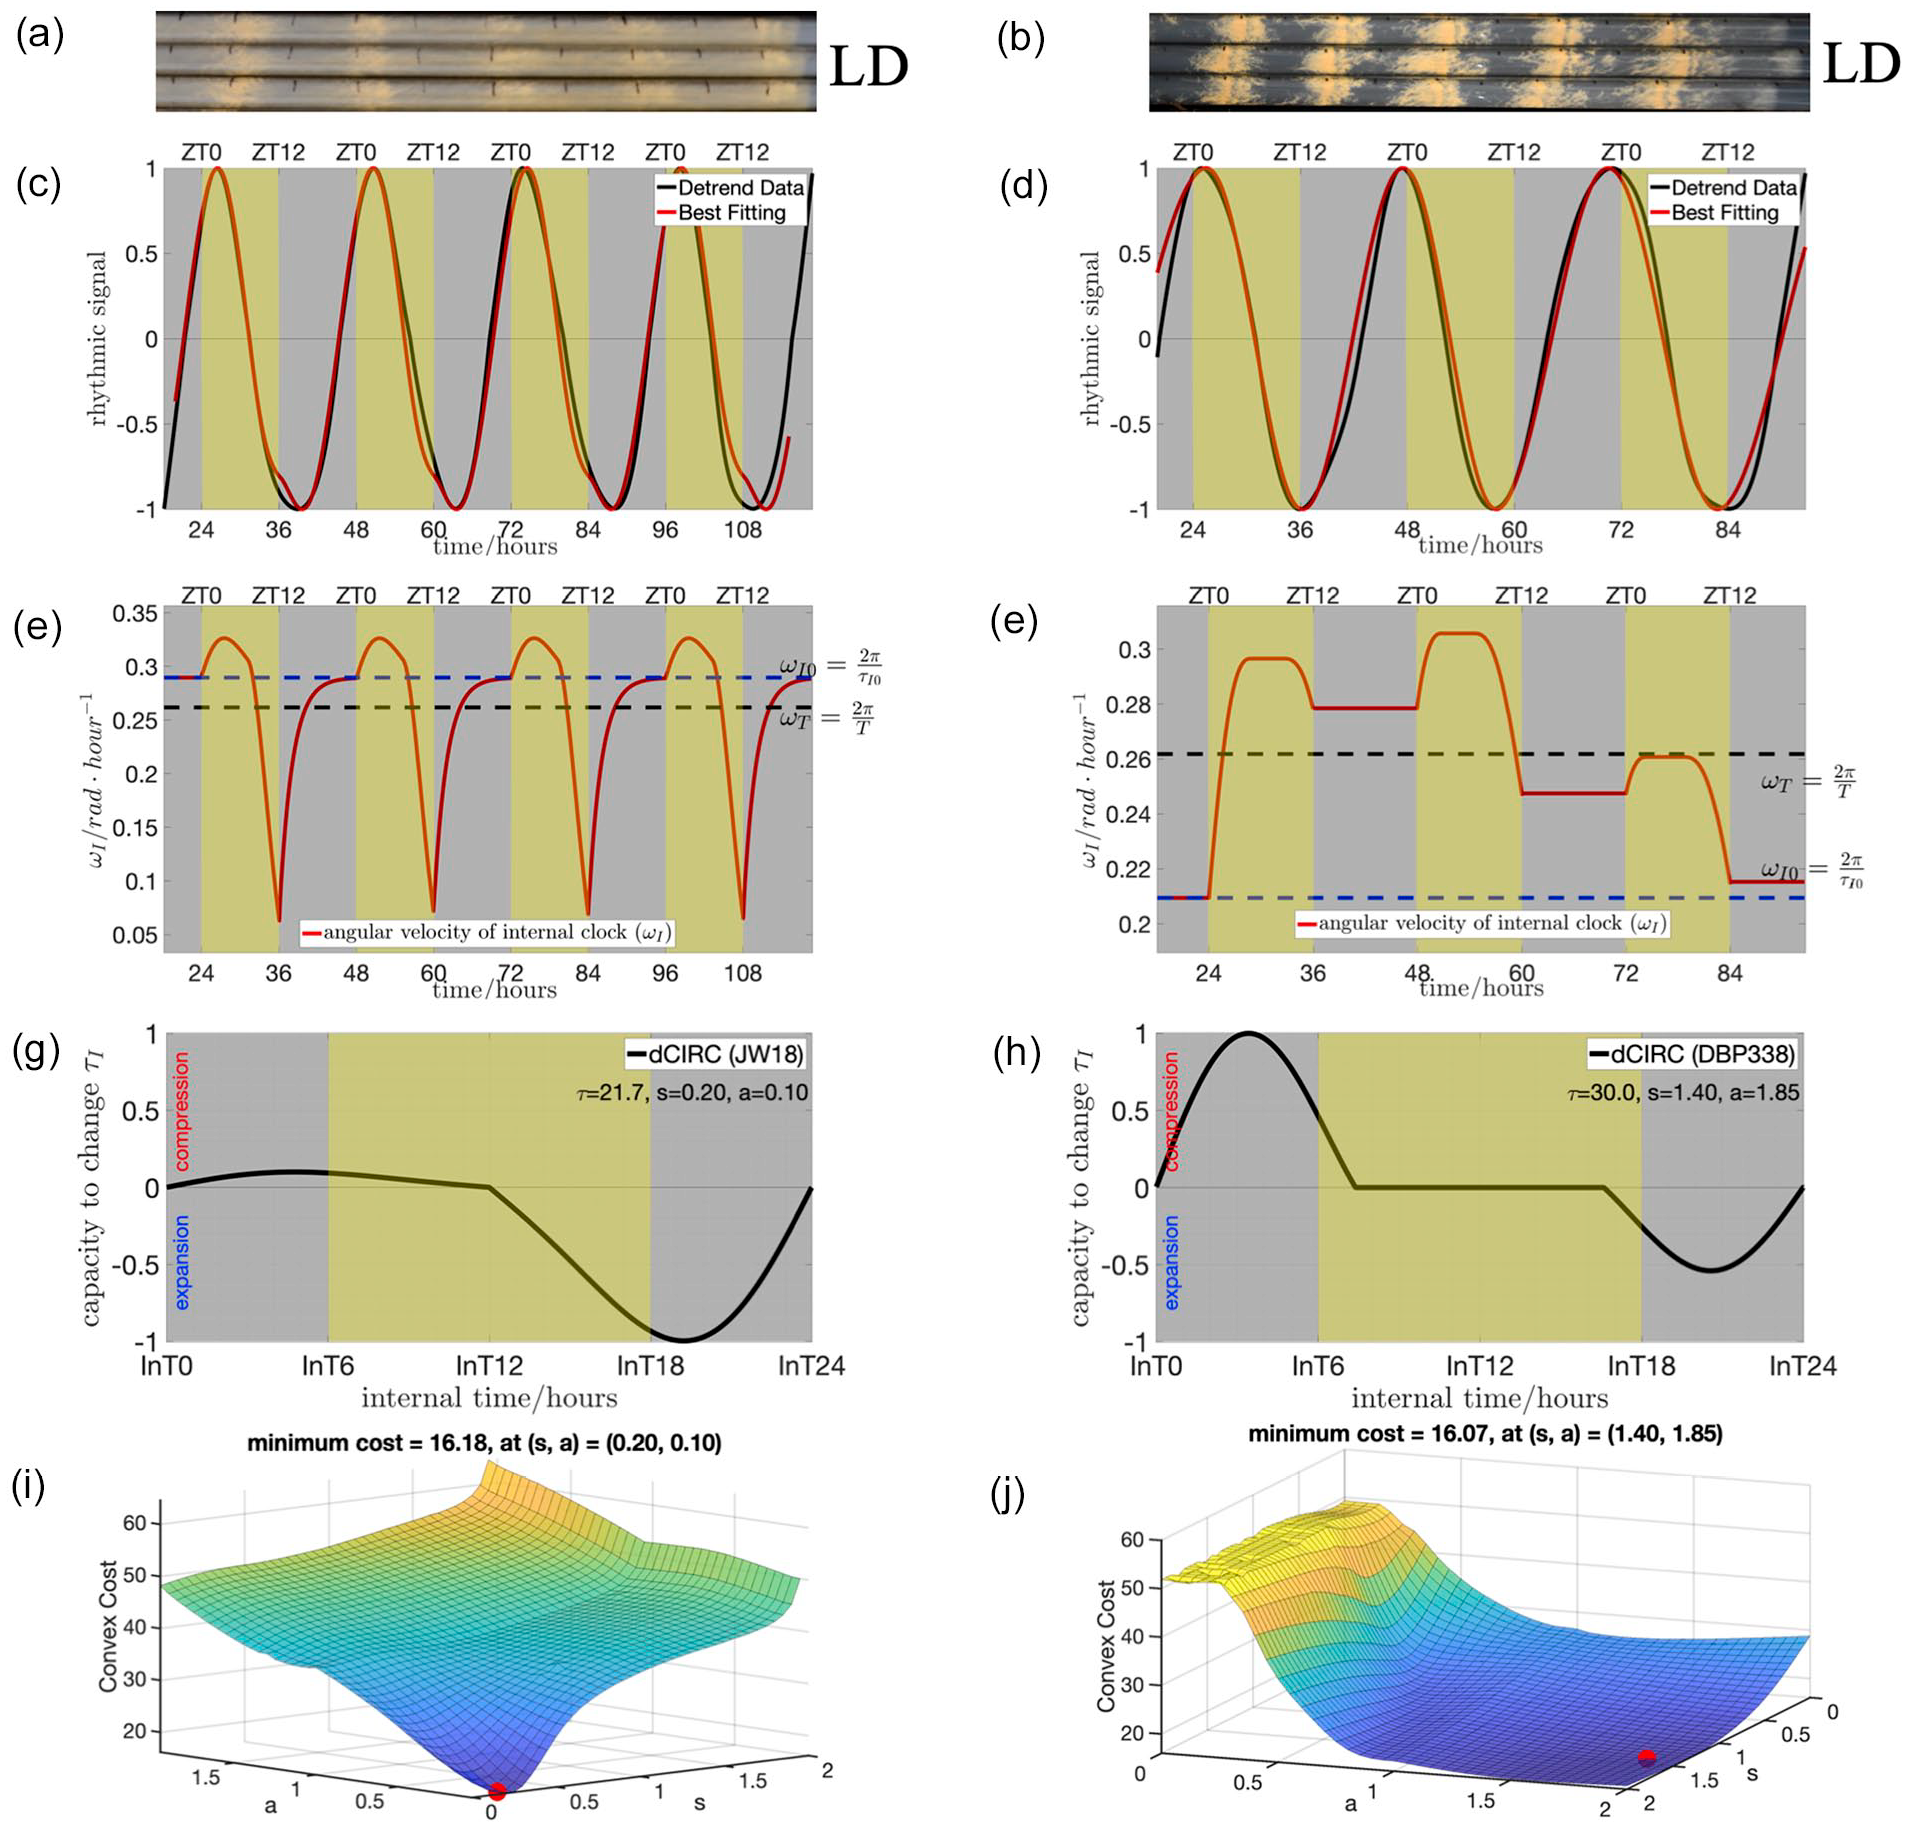
Using developmental rhythms data of N. crassa to find the genotype-specific dCiRC parameters. The organisms are exposed to light from ZT0 to ZT12 on each day. (a) and (b) are the race tube images showing the conidiation process of ecotypes JW18 (with
In conventional race tube analysis, the phase data is calculated by averaging the phase from each day during the experiments (Materials and Methods). The averaged phase value does not reflect the status of the entrainment process. We observed that the peaks of the detrended data of JW18 present roughly the same ZT hour at each day, whereas those of the detrended data of DBP338 keep advancing (Figure 2c and 2d). This suggests both that ecotype JW18 reaches a stable entrainment in four days of experimental data, whereas the long period strain DBP338 does not. The light signal during ZT0—ZT6 is used by the internal clock to overcome the period mismatch (between the
We calculated the areas under the dCiRC curve with a sign (the area is positive from 0 h to 12 h, and negative from 12 h to 24 h) and defined it as the total area under curve (TAUC) of dCiRC (Suppl. Fig. S3). We define the portion of the positive signed area covered by light signal as the light-exposed area under curve (LAUC) (Suppl. Fig. S3). Positive values of TAUC and LAUC reflect that the compression area is larger than the expansion area, thus the overall light effect is compressing
Analyzing Molecular Rhythm Data
We optimized the luciferase reporter assay for N. crassa under a cycling environment (Materials and Methods, Suppl. Fig. S1). Unlike the developmental rhythm, the luciferase reporter data reflecting the molecular rhythm are regular and consistent (Figure 3). In the beginning of the entrainment process, the internal clock shows a small trend of delayed phase; small absolute values of slope of the tangent line (Figure 3a). This observation is in agreement with the prediction that the internal clock starts with velocity
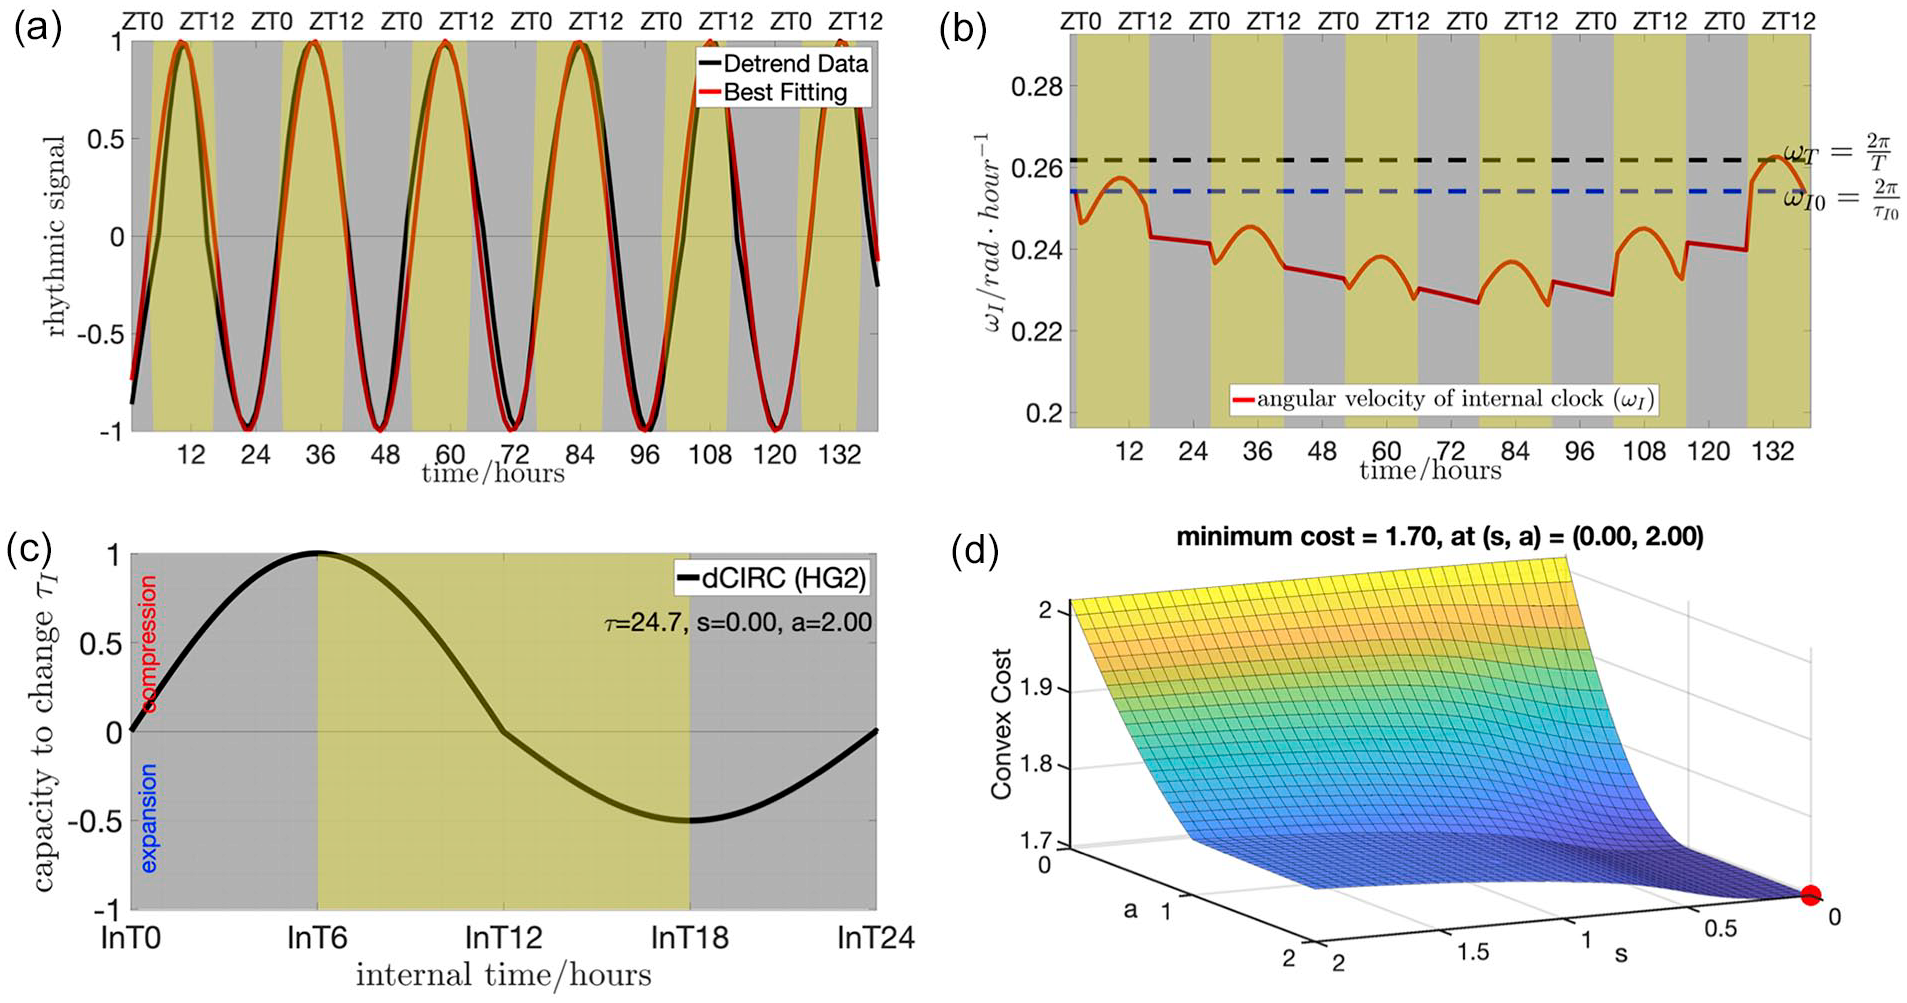
Examples of using the dCiRC model to fit the molecular rhythm data. The data recorded the luciferase activity of FREQUENCY in N. crassa. The organism (
Results of Predicting Phase of Entrainment by dCiRC
The non-parametric property of the dCiRC model allows us to predict the phase of entrainment. For the purpose of measuring the accuracy of the prediction, we compared the simulated phase of entrainment (
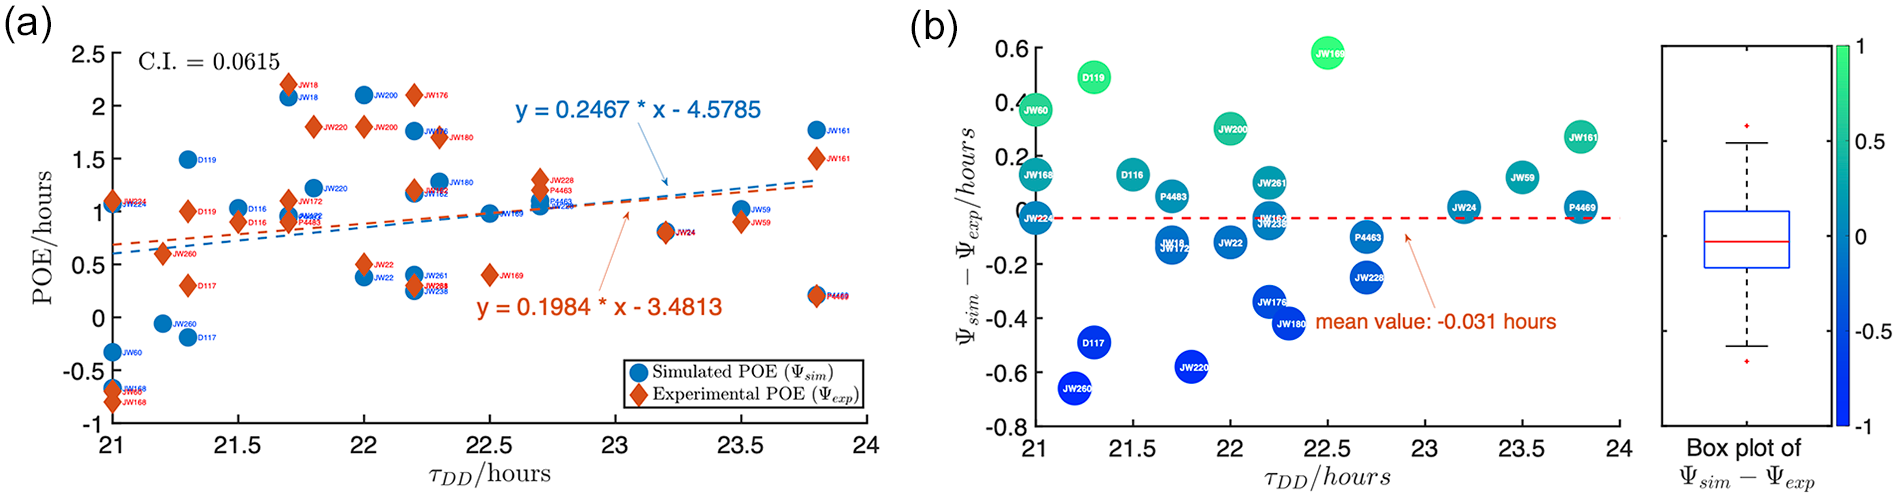
Predicting phase of entrainment by the dCiRC model. (a) The comparison of the simulated POE (
Non-Uniform Response of Ecotypes in Cycling Condition
We hypothesized that the parameters in dCiRC of the ecotypes that we have characterized in the current study reflect an evolved adaptation of the circadian clock to its local habitat. Strains are collected from geographically diverse locations. To test this hypothesis, we first analyze the relationships between TAUC and LAUC. LAUC value reflects how the ecotype responds to the current light exposure while TAUC reflects the ability of the ecotype responds to all potential light exposures (Material and Methods). There exists a strong positive linear relationship between TAUC and LAUC (r = 0.91) such that we can use LAUC to represent both the current and potential light responses in the following analysis. This is also important when we predict how one ecotype responds to various light conditions (Figure 5a).
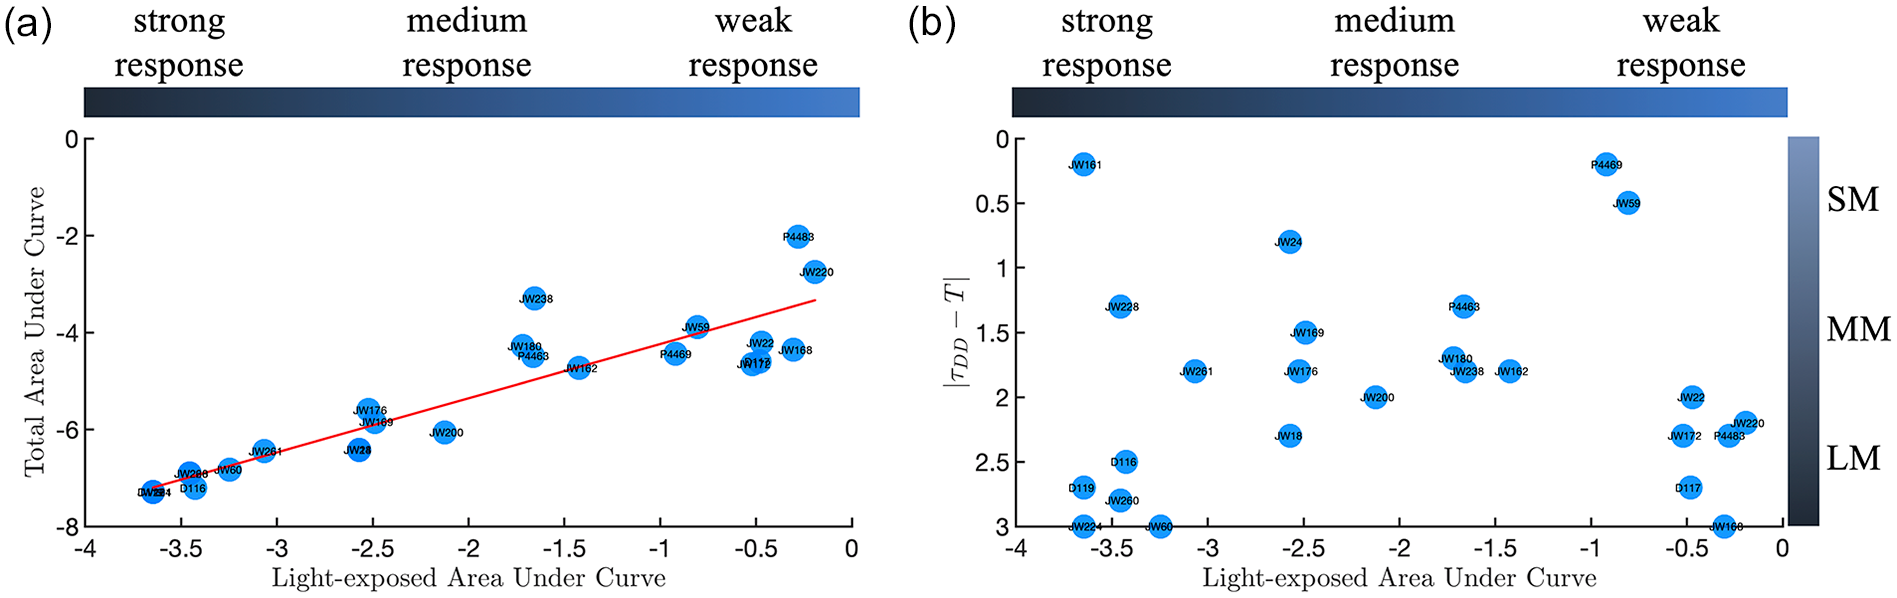
Non-uniform response of ecotypes in cycling condition. (a) Scatter plot of TAUC and LAUC with the linear regression line (in red). The color bar (top) represents the strength of light response according to the absolute LAUC values. The light response ability is categorized in the following: weak response when
We define the light response ability for each genotype according to its LAUC value. The sign of LAUC indicates whether the overall light effects is compressing or expanding the internal period (τ) (Material and Methods). The absolute value of LAUC reflects the strength of the light response. In Figure 5a, we define that when
dCiRC Model Reproduces PRCs
The PRC has been the main means of appreciating the phase shift by a certain zeitgeber of a circadian clock under constant conditions. We predicted that the dCiRC model should be able to produce a PRC using the best-fitting parameters in dCiRC (Suppl. Data S1). In addition, we can use the dCiRC model to study the phase response curves for various duration, timing, and intensity of the light. More importantly, the reverse of the above process allows us to utilize the massive data of PRCs to generate the dCiRC curves. This gives us potential to build a “circadian fingerprint” database composed of genotype-specific or species-specific dCiRC parameters that reflect the entrainment mechanisms for the organisms.
As an example, we used the dCiRC model to generate the phase response curve to one hour of light exposure. Remarkably, the dCiRC-generated PRC reflects the key features of the traditional experimental-generated PRC: a small portion of the advance zone near dawn is followed with a dead zone around noon. In the afternoon, a delay zone and a transition from the phase delays to advances is represented. A day ends in a zone of phase advances. For each genotype, the PRC shows similarities to its specific dCiRC. For genotype JW59 with
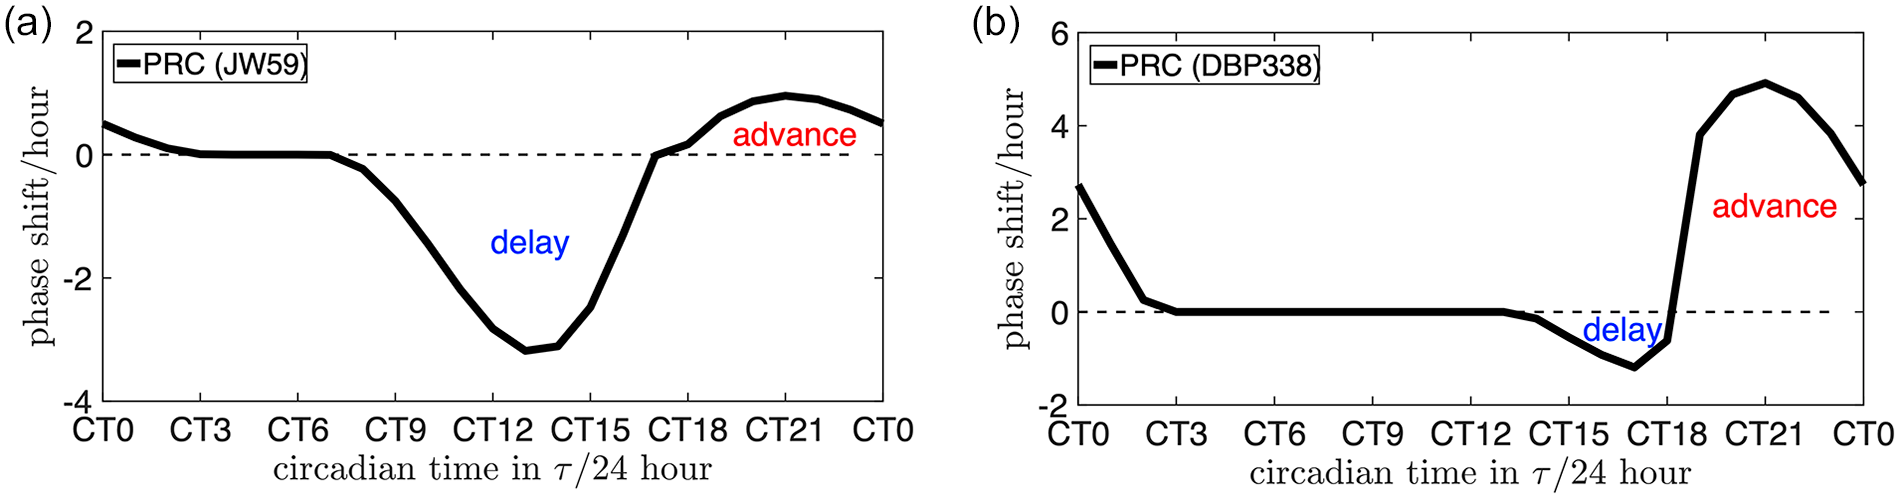
Examples of using the dCiRC model to generate Phase Response Curve. (a) The phase response curve of ecotype JW59 to 1 h of light exposure. (b) The phase response curve of ecotype DBP338 to 1 h of light exposure. The horizontal axis is the time of the light exposure measured in circadian hours. Abbreviations: dCiRC = Dynamic Circadian Integrated Response Characteristic.
Discussion
There are a large number of studies focused on modeling the circadian clock and predicting entrainment, and they are categorized into parametric and non-parametric approaches. We have generated a new approach, including an ODE-based model that reflects the characteristics of both parametric and non-parametric understanding of the circadian clock. One of the dCiRC model’s main features is that the circadian system inherits a phase-dependent capacity to compress or expand its internal period to match the period of the zeitgeber cycle. This feature reflects the parametric approach and allows the dCIRC model to describe the underlying changes in clock parameters. The other important feature of dCiRC is predicting the phase shift trajectory during entrainment. This is the non-parametric aspect of the dCiRC model which allows us to study the period-phase relationship.
A Velocity Response Curve (VRC) is designed to capture the phase shift features of a PRC and the VRC has similar shape relative to a PRC. Taylor et al. proposed a phase-only model based on the modified evolution of the internal phase depending on the light signal and the VRC (Taylor et al., 2010). While the idea has some similarities with the dCiRC approach, there is a substantial difference at the mechanistic scale: in the VRC model, the phase adjustment is described by a single equation; thus, light instantaneously changes the internal clock’s angular velocity. In contrast, in the dCiRC model, light affects the internal clock’s angular acceleration. Theoretically, the high complexity allows the dCiRC to capture the transient dynamics for changes from LD to DD. First, the “high complexity” is partially reflected by the inclusion of four parameters
Furthermore, we compare the two approaches from the perspective of predicting entrainment. In Taylor et al. (2010), the authors estimated a VRC from an existing PRC and subjected it to the entrainment data under cycling conditions. As we know that the PRC recorded the phase shifts in DD after the light exposure, the VRC approach has an inherent deficiency of utilizing information from DD condition (PRC) to study entrainment in LD conditions. In contrast, our approach estimated a dCiRC directly from the entrainment data in LD conditions and simultaneously studied how the organism adjusts its internal clock’s parameters based on the dCiRC in response to the light signal. This suggests that our approach better captures the parametric nature of the clock.
Compared to existing applications of circadian clock models, a major advantage of our approach is that it takes advantage of natural cycling conditions. For instance, Abraham et al. (2010) proposed a Poincaré oscillator-based model to study how the phase of entrainment is related to the mismatch between the internal and zeitgeber period. A two-step model in a previous study (An et al., 2021) and the dCiRC model in the current study (Suppl. Data S1) suggest that there exists a complex relationship between period and phase rather than a positive linear relationship by fitting phase data under LD conditions. Furthermore, due to the unique properties of our unified theory, the dCiRC model can extract information from the non-parametric aspects (such as phase of entrainment) and reveal the mechanisms of underlying parametric aspects (such as velocity) of the circadian systems. Granada et al. (2013) concluded that a weak oscillator (with large zeitgeber strength) results in a more extensive range of POE compared to a strong oscillator (with small zeitgeber strength). Our data support this conclusion (Suppl. Data S1 and Suppl. Fig. S4). In addition, the dCiRC model illustrates the evolution of the internal clock’s velocity changes. The results gave us insights into how the organisms with similar internal periods have significantly different responses to the light, and as a consequence, result in various phases of entrainment.
We observe that there is no significant relationship between the free-running period and light response (Figure 5). One explanation of diverse light response behaviors is that the initial status of the internal clock plays a vital role in the entrainment process. This suggests that organisms have a complex system to determine their entrainment strategy. The dCiRC model provides an approach to extract the non-parametric and parametric information of an internal clock (such as the initial phase and velocity of the internal clock) which is determined by the recent (environmental) history. We can further study how the after-effects of previous environments influence the organism’s response to the present environment. In future work, we could study how organisms switch light response modes in different external environments.
Our finding in the current study (Suppl. Data S1 and Suppl. Fig. S3) and the earlier report by Aschoff and Pohl (1978) suggest connections between the oscillator types and the zeitgeber strength. Weak oscillators are often observed in unicellular organisms and plants. These organisms tend to show a high sensitivity to zeitgebers. Consequently, a large entrainment range and a small slope of the POE verses period mismatch is observed. On the contrary, mammals and birds more frequently have strong oscillators with low sensitivity to zeitgebers. Thus, they have a narrow entrainment range and a steep slope of the POE verses period mismatch. An interesting observation by Aschoff and Pohl (1978) was that birds become re-entrained much faster than most mammals, although their internal clocks are both characterized as strong oscillators with similar responsivity to zeitgeber. Our dCiRC model provides a possible explanation and a way to verify by fitting to available data in the future. The dCiRC model shows that the re-entrained phase is determined by both Zeitgeber strength and elastic factor (
In summary, dCiRC describes many characteristics of circadian entrainment consistent with elements of both parametric and non-parametric forms. dCiRC determines the genotype specific CiRC shapes by fitting real data. By characterizing dCiRC of 26 ecotypes, we found non-uniform light responses of these clocks. One of the major advantages of dCiRC over PRC is that dCiRC allows one to study the real-time dynamic behaviors of the clock in cycling natural environments. Because the dCiRC curves have a similar shape (with a 6 h shift) with a short-pulse PRC, thus inherently, dCiRC embodies the non-parametric concept of PRC by generating the phase shift trajectory and PRC. Conversely, we can find the genotype-specific or species-specific dCiRC curves with recorded PRCs. The significance of this work is that we can further build a “circadian fingerprint” database composed of genotype-specific or species-specific dCiRC parameters and reveal the entrainment mechanisms for various organisms. As an essential improvement, dCiRC can comprehensively study the period-phase relationship in cycling conditions. In the case when the organism entrains to environmental cues, the dCiRC model tracks the evolution of the phase relationship between the circadian internal clock and zeitgeber cycle and predicts the stable phase of entrainment. In the case that the organism is not able to entrain, dCiRC generates the phase shift trajectory to help us to investigate possible reasons causing failure of entrainment. We believe that dCiRC could allow us to study the ecology and the function of circadian clock in the natural world.
Supplemental Material
sj-pdf-1-jbr-10.1177_07487304211069454 – Supplemental material for A Unified Model for Entrainment by Circadian Clocks: Dynamic Circadian Integrated Response Characteristic (dCiRC)
Supplemental material, sj-pdf-1-jbr-10.1177_07487304211069454 for A Unified Model for Entrainment by Circadian Clocks: Dynamic Circadian Integrated Response Characteristic (dCiRC) by Zheming An, Benedetto Piccoli, Martha Merrow and Kwangwon Lee in Journal of Biological Rhythms
Footnotes
Acknowledgements
The authors are grateful to Professor Dr. Till Roenneberg for fruitful discussions and comments on the manuscript. We thank Drs. Glass, Crosthwaite, and Larrondo for sharing Neurospora strains, and to Mr. Helmut Klausner and Ms. Angela Meckl for technical support, and to Charot Rodeget for critical reading and insightful suggestions. The work was supported by the Center of Advanced Studies of the LMU Munich and Rutgers Global International Travel Grant for generous support (to KL). The funders had no role in study design, data collection and analysis, decision to publish, or preparation of the manuscript.
Conflict of Interest Statement
The author(s) have no potential conflicts of interest with respect to the research, authorship, and/or publication of this article.
Data Availability Statement
All relevant experimental data are within the paper, its Supporting Information files.
The source code and data used to produce the results and analyses presented in this manuscript is available at the following public repositories,
GitHub repository at https://github.com/AZM1994/dCiRC-Project. Zenodo repository: 10.5281/zenodo.5077945
Notes
References
Supplementary Material
Please find the following supplemental material available below.
For Open Access articles published under a Creative Commons License, all supplemental material carries the same license as the article it is associated with.
For non-Open Access articles published, all supplemental material carries a non-exclusive license, and permission requests for re-use of supplemental material or any part of supplemental material shall be sent directly to the copyright owner as specified in the copyright notice associated with the article.