
Abstract
Many behaviors exhibit ~24-h oscillations under control of an endogenous circadian timing system that tracks time of day via a molecular circadian clock. In the fruit fly, Drosophila melanogaster, most circadian research has focused on the generation of locomotor activity rhythms, but a fundamental question is how the circadian clock orchestrates multiple distinct behavioral outputs. Here, we have investigated the cells and circuits mediating circadian control of feeding behavior. Using an array of genetic tools, we show that, as is the case for locomotor activity rhythms, the presence of feeding rhythms requires molecular clock function in the ventrolateral clock neurons of the central brain. We further demonstrate that the speed of molecular clock oscillations in these neurons dictates the free-running period length of feeding rhythms. In contrast to the effects observed with central clock cell manipulations, we show that genetic abrogation of the molecular clock in the fat body, a peripheral metabolic tissue, is without effect on feeding behavior. Interestingly, we find that molecular clocks in the brain and fat body of control flies gradually grow out of phase with one another under free-running conditions, likely due to a long endogenous period of the fat body clock. Under these conditions, the period of feeding rhythms tracks with molecular oscillations in central brain clock cells, consistent with a primary role of the brain clock in dictating the timing of feeding behavior. Finally, despite a lack of effect of fat body selective manipulations, we find that flies with simultaneous disruption of molecular clocks in multiple peripheral tissues (but with intact central clocks) exhibit decreased feeding rhythm strength and reduced overall food intake. We conclude that both central and peripheral clocks contribute to the regulation of feeding rhythms, with a particularly dominant, pacemaker role for specific populations of central brain clock cells.
Introduction
The circadian system produces ~24-h rhythms through the function of a cell-autonomous molecular circadian clock. Studies of Drosophila have been integral in our understanding of the genetic mechanisms underlying molecular clock function, which are conserved across species. In Drosophila, the circadian clock operates as a transcriptional-translational feedback loop that centers around rhythmic expression of the core clock genes period (per) and timeless (tim) (Patke et al., 2020). Transcription of per and tim is driven by the transcriptional activators CLOCK (CLK) and CYCLE (CYC). PER and TIM proteins accumulate in the cytoplasm during the day and eventually translocate to the nucleus where they repress their own transcription through interactions with CLK and CYC. Subsequent degradation of PER and TIM then allows a new cycle of transcription, with the entire process taking ~24 h to complete.
In addition to central clock cells in the brain, the molecular clock is widely expressed in peripheral tissues, where it is thought to regulate tissue-specific functions (Dibner et al., 2010; Ito and Tomioka, 2016; Harder and Oster, 2020). The classical view models the circadian system as hierarchical in nature, with the central brain clock dictating the timing and pace of molecular cycling in peripheral tissues; however, the degree of dependency varies according to species and tissue. In Drosophila, some peripheral clocks appear to function independently of the central clock; however, in other tissues, peripheral clocks are under convergent regulation of the central brain clock and systemic signals, as is typically the case for peripheral clocks in mammals. One such example is the fat body, which performs the function of the mammalian liver and adipose tissue (Arrese and Soulages, 2010). Under conditions of constant darkness, cycling of the fat body clock rapidly dampens in the absence of the central clock, and the oscillation of fat body gene expression is under control of the central clock, the local fat body clock, and metabolic signals (Xu et al., 2008, 2011; Barber et al., 2016; Erion et al., 2016). This multilayered regulation is reminiscent of mammalian liver and adipose tissue (Damiola et al., 2000; Stokkan et al., 2001; Zvonic et al., 2006; Kornmann et al., 2007; Lamia et al., 2008; Vollmers et al., 2009; Koronowski et al., 2019).
The presence of clocks in multiple tissues likely confers significant adaptive advantage by ensuring synchronization and correct temporal sequencing of behavioral and physiological processes (Vaze and Sharma, 2013). For example, the circadian system upregulates specific metabolic pathways in peripheral tissues in anticipation of times of increased food intake (Panda et al., 2002). In line with this idea, a growing literature has pointed to the significance of circadian control and coordination of feeding behavior and metabolism in organismal health and wellbeing (Bass and Takahashi, 2010; Longo and Panda, 2016), thus emphasizing the importance of defining the cellular and molecular mechanisms through which circadian feeding rhythms are produced and coordinated across tissues.
Drosophila feeding rhythms have been shown to depend on molecular circadian clock function, as they are abrogated in mutant flies lacking essential core clock genes (Seay and Thummel, 2011; Ro et al., 2014; Barber et al., 2021). Since feeding behavior is controlled by neurons in the brain (Sohn et al., 2013; Pool and Scott, 2014), circadian control of feeding must ultimately impinge upon central brain circuits. However, systemic signals released from peripheral tissues inform the brain about energy status and thus exert powerful control over feeding (Williams and Elmquist, 2012; Pool and Scott, 2014). For example, mammalian adipose tissue releases circulating signals such as leptin, which act on hypothalamic neurons to inhibit feeding (Friedman, 2019). The Drosophila fat body secretes multiple circulating factors, including the leptin ortholog Unpaired 2, which similarly feed back on brain regions involved in feeding and metabolism (Rajan and Perrimon, 2012; Agrawal et al., 2016; Delanoue et al., 2016; Kim et al., 2017; Sun et al., 2017; Li et al., 2019). As these peripheral tissues express functional clock components (Zvonic et al., 2006; Xu et al., 2008), it is possible that circadian control of feeding is in part regulated by peripheral clocks that govern expression or release of metabolic signals.
A role for the fat body clock in regulating feeding rhythms has been suggested by experiments that showed that suppressing clock oscillations selectively in the fat body via GAL4-mediated expression of a dominant-negative clock allele shifted the phase of feeding rhythms (Xu et al., 2008). More recently, central clock contributions to feeding behavior were demonstrated through genetic silencing, via GAL4-mediated expression of the inhibitory Kir2.1 ion channel, of a subset of central clock neurons that express the pigment-dispersing factor (PDF) neuropeptide, which eliminated free-running feeding rhythms (Barber et al., 2021). Here, we have sought to more fully characterize the ability of central and peripheral clocks to modulate feeding behavior by investigating the effects of manipulations that render molecular clocks in the different tissues temporally chimeric with one another, or that selectively eliminate clock function either in central or peripheral clocks. We find that the speed of the central brain clock, but not the fat body clock, dictates the period and timing of feeding rhythms, and furthermore that the central brain clock is uniquely necessary for the presence of feeding rhythms. Finally, despite the lack of effect of fat body–specific clock manipulations on feeding behavior, we show that simultaneous disruption of multiple peripheral clocks impacts the strength of feeding rhythms. We conclude that central brain clocks serve as critical pacemakers controlling feeding rhythms and that peripheral clocks make more subtle contributions, perhaps acting in an additive or redundant manner to regulate feeding behavior.
Materials and Methods
Fly Stocks
Flies were raised on cornmeal-molasses medium in incubators held at 25 °C and running on a 12:12 light-dark (LD) schedule. Pdf-GAL4 (FBti0027914), to-GAL4 (FBti0202314), tim-GAL4 (FBti0017922), and cyc01 were provided by Amita Sehgal. UAS-sggY214F (a hypomorphic sgg allele) (FBti0026626) and UAS-dbtL (FBti0202311) were provided by Orie Shafer. UAS-GFPnls (FBti0012492), UAS-cycDN (FBti0145085), UAS-Cas9.P2 (FBti0166500), tub>GAL80> (FBti0147582), and >stop>GAL80 (FBti0147584) were ordered from the Bloomington Drosophila Stock Center. UAS-sgRNA-per4x, UAS-sgRNA-tim3x, and UAS-sgRNA-acp4x were provided by Mimi Shirasu-Hiza. Otd-nls:FLPo (FBtp0093566) was provided by David Anderson. Lsp3.1-GAL4 (FBti0210031) was provided by Brigitte Dauwalder.
Feeding Monitoring
The Fly Liquid-Food Interaction Counter (FLIC) (Ro et al., 2014) was used to monitor physical interactions between individual flies and a liquid food source. Drosophila FLIC monitors (DFMs; Sable Systems) have 12 individual feeding arenas; each arena contains a liquid food well at its center that is surrounded by a conductive metal pad. To feed, a fly must be standing on the conductive pad and extend its proboscis into the liquid food; this interaction completes an electrical circuit and changes the voltage readout for the well. Voltage signals are collected every 200 ms and sent to a Master Control Unit (MCU; Sable Systems), which coordinates inputs from multiple DFMs and transmits that information to a computer running FLIC collection software (Pletcher Lab, University of Michigan).
FLIC monitors were modified for long-term recordings by attaching a liquid food reservoir (50-mL cell culture vial, CELLSTAR) to the base plate of each FLIC monitor, which sustained food levels for up to 7 days without experimental disruption. Liquid food consisted of a 10% sucrose solution with 45-mg/L MgCl2 to facilitate conductivity. Following a minimum of 4 days of entrainment to a 12:12 LD schedule in standard food vials, 4- to 11-day-old male flies were mouth-aspirated into FLIC arenas with fly locations randomized by genotype. FLIC monitoring was conducted in a light- and temperature-controlled incubator (Precision 818; Thermo Fisher) maintained at 25 °C. On the first day of FLIC monitoring, flies were exposed to LD conditions that matched their entrainment schedule, to allow for habituation to experimental conditions. Feeding behavior was then recorded for 6 days under constant dark (DD) conditions, beginning at CT0 on the second experimental day (CT stands for circadian time, and CT0 corresponds to the time when lights would normally be turning on under entrained conditions).
Feeding Rhythm Analysis
Data from FLIC experiments were processed using R code developed by the Pletcher Lab (Ro et al., 2014). Feeding events were defined as times when the signal amplitude (1) exceeded the baseline readings by 5 mV for a minimum of 4 consecutive 200-ms recording periods, and (2) at some point during the event, achieved a 15-mV feeding threshold above baseline readings. Each feeding event thus comprised ≥four 200-ms feeding interactions, termed “licks.” For each fly, the number of licks was binned into 30-min intervals, and the rhythm period and power of lick data were determined over 6 consecutive days in DD using χ2 periodogram analysis (ClockLab software; Actimetrics). Flies that died during the experiment were determined by visual inspection of the data and excluded from analysis. Rhythm power was calculated as the amplitude of the periodogram line at the dominant period minus the χ2 significance line (at a significance of p < 0.01). Because rhythm strength cannot be negative, flies with a calculated power <0 were assigned a power of 0 for subsequent analysis. Flies with power <25 were deemed arrhythmic. All flies, whether rhythmic or not, were included in mean rhythm power analysis; however, only rhythmic flies were included when calculating mean period. We also determined total feeding time by summing the duration of all feeding events over the first 5 days in DD for each individual fly.
Experimental Design of Behavioral Experiments
For behavioral experiments depicted in Figure 1, Pdf-GAL4 (Renn et al., 1999) or to-GAL4 (Dauwalder et al., 2002) was used to drive expression of UAS-sgghypo or UAS-dbtL (Yao and Shafer, 2014). The latter two stocks were outcrossed 7 times into the iso31 background before use (Ryder et al., 2004). Genetic controls for these experiments consisted of the same GAL4 and UAS lines crossed to iso31 flies. Behavioral experiments depicted in Figure 4 involved clustered regularly interspaced short palindromic repeats (CRISPR)-mediated targeting of either the per or tim genes selectively in brain clock cells or fat body cells. CRISPR gene targeting necessitates the presence of a synthetic guide RNA, which specifies the gene to be targeted, and a Cas9 enzyme, which creates double-stranded DNA breaks. We combined these components into single parental strains carrying UAS-gRNA-per4x or UAS-gRNA-tim3x (Delventhal et al., 2019) on the second chromosome and UAS-Cas9.P2 (Port and Bullock, 2016) on the third chromosome, and crossed these to Pdf- or to-GAL4 stocks for selective genetic disruption in brain clock cells or fat body cells, respectively. Controls consisted of the same GAL4 lines driving expression of CRISPR constructs targeting the Acp98AB gene (Delventhal et al., 2019), which encodes for an accessory gland protein that is expected to be inconsequential for neuron or fat body cell function. Behavioral experiments depicted in Figure 6 assessed the consequences of removing molecular circadian clock function in central brain or peripheral clock-containing tissues. For these experiments, we used an intersectional approach to delimit per and tim CRISPR constructs to either the central brain or peripheral tissues. We drove CRISPR construct expression with a broad tim-GAL4 driver, which expresses in most clock cells throughout the body. To restrict expression to the central brain clock cells, we combined this with a tub>GAL80> construct (Gordon and Scott, 2009), which allows for flippase (FLP)-mediated excision of the GAL80, and Otd-nls:FLPo (Asahina et al., 2014), which expresses FLP selectively in central brain neurons. Thus, the suppressive action of GAL80, which prevents GAL4-mediated expression of CRISPR constructs, is selectively removed from central brain neurons, resulting in clock disruption centrally but not peripherally. Conversely, to simultaneously disrupt clock function in most peripheral tissues while leaving the central clock intact, we replaced the tub>GAL80> with a >stop>GAL80 construct (Bohm et al., 2010). In this case, GAL80 expression is prevented by upstream, FLP-excisable transcriptional and translational stop sequences. Thus, Otd-nls:FLPo permits GAL80 expression selectively in the brain, effectively limiting CRISPR disruption to peripheral tissues marked by tim-GAL4. In these experiments, flies with central or peripheral CRISPR targeting of the acp gene were used as controls.
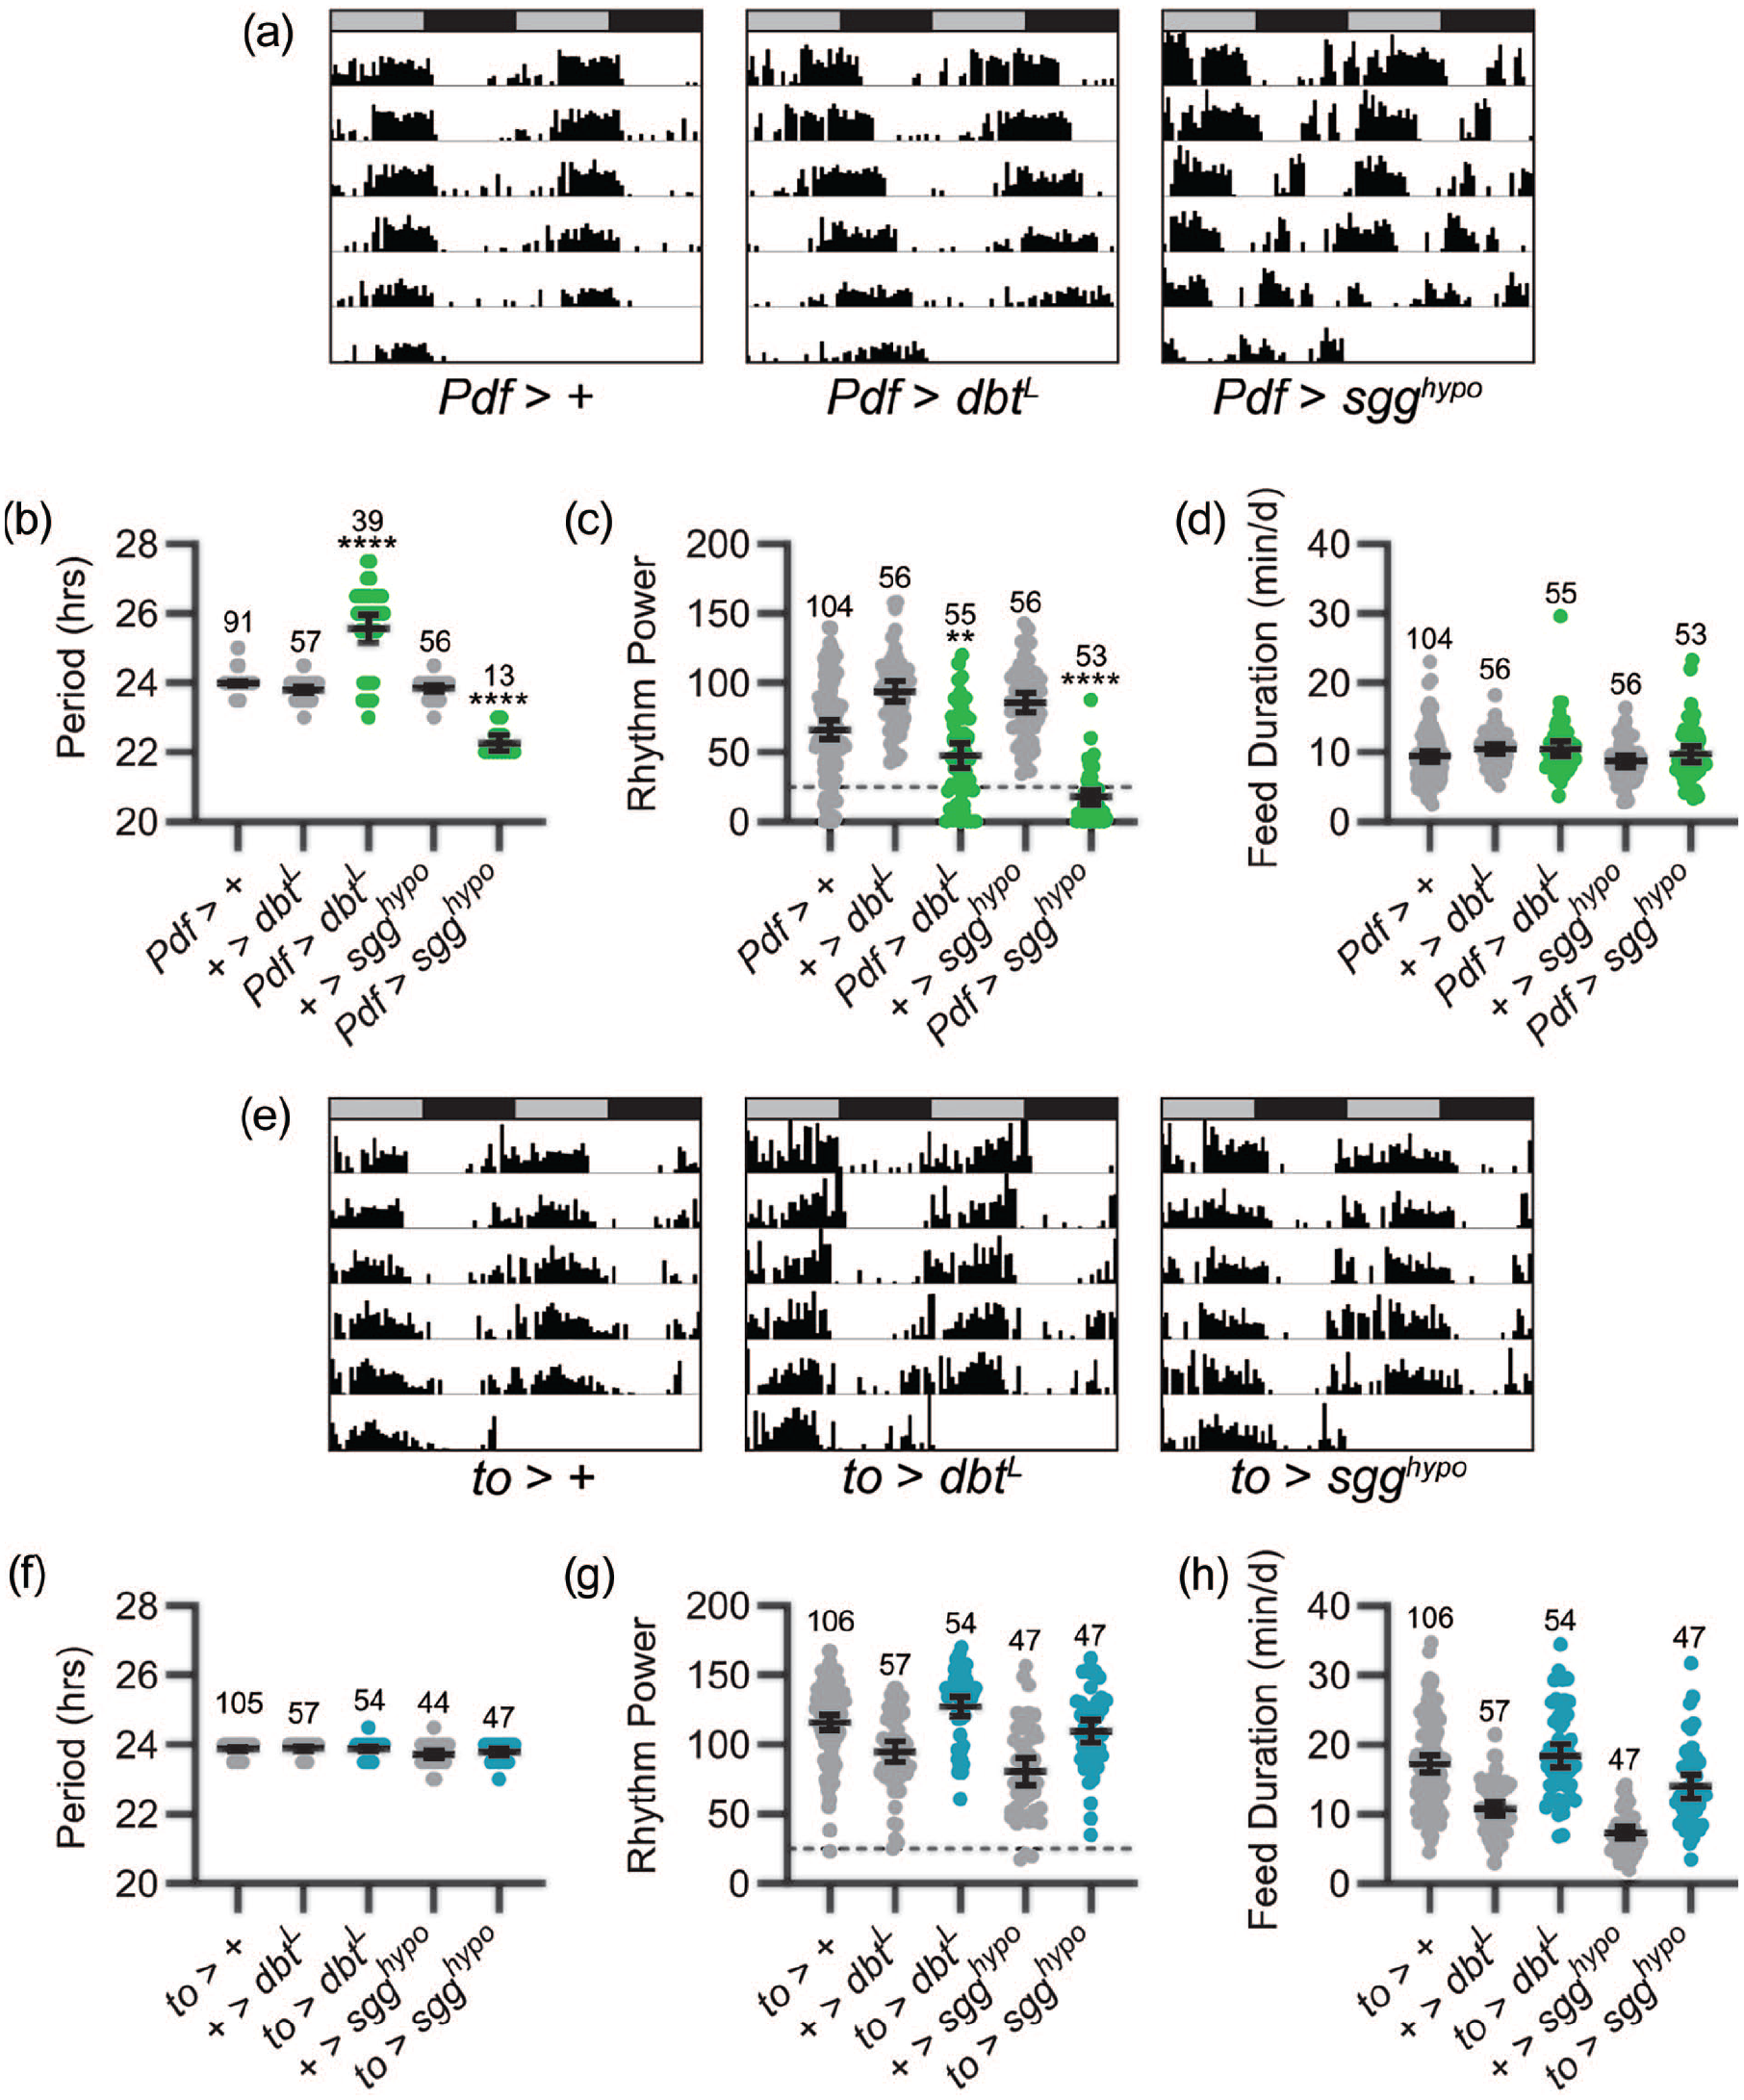
Central brain clock neurons dictate the pace of feeding rhythms. (a) Representative single-fly feeding records over 6 days in constant dark for the genotypes listed. Feeding activity in number of “licks” is graphed for each 30-min period. Feeding records are double plotted, with 48 h of data on each line and the second 24 h replotted at the start of the next line. Gray and black bars above each plot represent subjective day and night, respectively. Note that Pdf>sgghypo flies display short period feeding rhythms, as exhibited by the daily leftward drift of feeding onset and offset times, and that Pdf>dbtL flies show long period feeding rhythms, as exhibited by the daily rightward drift of feeding onset and offset times. (b-d) Feeding rhythm period (b), power (c), and total daily liquid food interaction time (d) are displayed for the genotypes listed. Experimental groups are shown in green; control groups are shown in gray. Dots represent values for individual flies, and lines show genotype means ± 95% confidence intervals. (e) Representative single-fly feeding records are graphed as in (a) for the genotypes listed. Note the lack of effect of fat body clock speed manipulations on the timing of feeding. (f-h) Feeding rhythm period (f), power (g), and total daily liquid food interaction time (h) are displayed as in (b-d) for the genotypes listed. Experimental groups are shown in blue; control groups are shown in gray. Dashed lines in (c) and (g) indicate rhythmicity cutoff. ****p < 0.0001, **p < 0.001 compared with both UAS and GAL4 controls; Tukey’s multiple comparisons test following ANOVA. Sample sizes are listed above each plot and are lower in (b) and (f) because period calculation only included rhythmic flies. Feeding records in (a) and (e) have periods that fall within the 95% confidence interval of the group mean. Abbreviation: ANOVA = analysis of variance.
Immunohistochemistry
To measure PER oscillations under DD conditions, adult male flies were entrained to a 12:12 LD cycle at 25 °C for ≥5 days, then transferred to DD, and immunohistochemical staining was conducted every 6 h on the third day of DD. To measure PER oscillations under LD conditions, adult male flies were entrained to a 12:12 LD cycle at 25 °C for ≥5 days before dissection and staining every 6 or 12 h over a 24-h LD day.
For dissections, flies were first anesthetized with CO2, then submerged for ~ 1 min in ethanol and rinsed briefly in phosphate-buffered saline with 0.1% Triton-X (PBST). Dissections were done in PBST. For fat bodies, dissecting forceps were used to tear a small opening in the caudal end of the abdomen, which served as an access point for removing internal tissues such as reproductive and digestive tracts. The caudal abdomen was then isolated and the posterior most segment was removed. An incision was then made along the ventral abdominal surface to remove ventral cuticle. Fat bodies were processed for immunohistochemical analysis in situ; the remaining dorsal abdomen also included other tissues, including oenocytes. Brains were dissected out of the head cuticle, freed of air sacs and trachea, and processed as free-floating whole mounts.
Following dissection, abdomens and brains were fixed in 4% formaldehyde for 15-35 min, washed 3 × 15 min in PBST, blocked for 1 h in 5% normal donkey serum in PBST (NDST), and incubated for 24 h in primary antibodies diluted in 5% NDST. They were then washed 3 × 15 min in PBST and incubated ~24 h in secondary antibodies diluted in 5% NDST. Finally, specimens were washed 3 × 15 min in PBST and mounted in Vectashield (Vector Laboratories). Prior to mounting, brains (but not abdomens) were cleared for 5 min in 50% glycerol in PBST. Primary antibodies were as follows: rabbit anti-GFP 1:1000 (Molecular Probes A-11122), guinea pig anti-PER 1:1000 (UPR 1140; gift of A. Sehgal), and mouse anti-PDF 1:1000 (Developmental Studies Hybridoma Bank PDFC7; generated by J. Blau). Secondary antibodies were as follows: FITC donkey anti-rabbit 1:1000 (Jackson 711-095-152), Cy3 donkey anti-guinea pig 1:1000 (Jackson 706-165-148), and Cy5 donkey anti-mouse 1:1000 (Jackson 715-175-151).
Confocal Imaging and Analysis
Immunolabeled brains and abdomens were visualized with an Olympus Fluoview FV1000 confocal microscope. Gain and offset were set to minimize saturation, and confocal capture settings were held constant for all brains or abdomens in a given experiment. For images of GFP and PER staining depicted in figures, we applied a uniform brightness adjustment (Adobe Photoshop) across all pixels of all images shown for a given experiment.
For PER quantification in central clock neurons, 8-10 brains were analyzed per time point and cells were quantified in only one hemisphere from each brain. 60× images were taken with a Z-stack through the anterior-posterior axis of either the dorsal or ventrolateral clock neurons. Small ventrolateral clock neurons (sLNvs) were identified based on PDF expression and differentiated from large ventrolateral clock neurons (lLNvs) based on relative location and soma size. Dorsolateral clock neurons (LNds) were identified based on anatomical location and lack of PDF staining. ImageJ was used to outline the PER+ portion of each clock cell (without regard to whether the signal was localized to the cytoplasm or nucleus) in a single 1-µm confocal section at the center of the nucleus. Normalized PER intensity was calculated by dividing the mean PER pixel intensity within this area of interest by the mean pixel intensity of a nearby region that lacked specific PER signal. These individual normalized clock cell PER intensities were then averaged for all cells of a given population in a brain to determine a single PER staining intensity for each clock cell population in each brain.
For fat body and oenocyte PER quantification, 8-10 abdomens were analyzed per time point. 20× or 60× images were taken with a Z-stack through the entire dorsal-ventral axis of each abdomen. To facilitate identification of fat body cells in immunohistochemical experiments, we recombined to-GAL4 with a UAS-GFPnls line. These to-GAL4, UAS-GFPnls flies were then crossed with effectors such as UAS-dbtL or CRISPR constructs so we could restrict analysis to GFP-positive abdominal cells (as in Figures 3 and 5). In some cases where we were unable to include an independent GFP marker, we identified fat body cells and nearby oenocytes based on location and cell morphology (as in Figure 7 and Suppl. Fig. S2). Using ImageJ software, a 10-µM maximum projection image was produced, and 10 fat body cells or oenocytes were randomly selected for quantification. Mean pixel intensity of PER staining was determined within the nucleus of each cell, and this value was normalized to mean background intensity, determined for an area nearby the cell that lacked specific PER staining.
Statistical Analysis
Statistical analysis was performed with GraphPad Prism 9 software (La Jolla, CA). To ensure reproducibility, we conducted 3-5 independent experimental replicates for each behavioral analysis, and data from all flies of a given genotype that survived the duration of the experiment were pooled. Circadian rhythm period, power, and feeding duration were compared using a t test (for experiments with only 2 groups run simultaneously) or a one-way analysis of variance (ANOVA) followed by Tukey’s multiple comparisons test (for experiments with 3 or more groups). Two-way ANOVA (with time and genotype as factors) with Tukey’s multiple comparisons test was used to test for differences in PER intensity in immunohistochemical experiments. For all statistical tests, p < 0.05 was considered significant. For experiments with multiple control groups, effects were only deemed significant if experimental lines were significantly different from all control lines and the effect was in the same direction compared with each control.
Results
The Central Brain Clock Sets the Pace of Feeding Rhythms
In line with previous results (Seay and Thummel, 2011; Ro et al., 2014; Barber et al., 2021), we found that control flies exhibit strong DD feeding rhythms, as assessed by FLIC monitoring, that are absent in mutants for the cycle gene, a core clock component (Suppl. Fig. S1). These experiments confirm circadian control of feeding behavior, but do not identify a cellular locus of circadian feeding regulation, as molecular clocks are deficient in all tissues of mutant animals. Both the central brain and fat body clocks have been implicated in the control of feeding rhythms (Xu et al., 2008; Barber et al., 2021), but many questions remain regarding the exact role these tissues play and to what extent central and peripheral inputs are integrated to drive cyclic feeding. Therefore, to further investigate the relative contributions of central and peripheral clocks to circadian feeding rhythms, we assessed the consequences of altering molecular clock speed either in the central brain or in the fat body. We used the Pdf-GAL4 line to target the LNv subset of central brain clock cells (Renn et al., 1999), and to-GAL4 to target fat body cells (Dauwalder et al., 2002; Xu et al., 2008). To slow down molecular clock oscillations, we drove expression of a mutant form of the double-time kinase (UAS-dbtL), which prolongs molecular cycling by ~2 h (Muskus et al., 2007; Yao and Shafer, 2014). To speed up clock oscillations, we drove expression of a hypomorphic shaggy kinase allele (UAS-sgghypo), which accelerates circadian period by ~1-2 h (Martinek et al., 2001; Yao and Shafer, 2014).
Notably, we found that molecular clock speed in LNv clock neurons dictates the pace of feeding rhythms. Pdf>dbtL flies (by convention, Pdf>dbtL refers to flies in which Pdf-GAL4 has been used to drive UAS-dbtL) displayed free-running feeding rhythms with a mean period of ~25.6 h, compared with control flies, which exhibited feeding rhythms with ~24-h periods. Conversely, sgghypo-mediated acceleration of molecular clock speed in LNv cells produced a significant concomitant reduction of feeding rhythm period to ~22.2 h (Figure 1a and 1b). In addition to modifying period length, acceleration and deceleration of molecular clock speed in LNvs also reduced the strength of feeding rhythms (Figure 1c) as well as the percentage of flies displaying rhythmic feeding behavior (70.9% and 24.5% of Pdf>dbtL and Pdf>sgghypo flies, respectively, qualified as rhythmic compared with 87.5%-100% of controls). This likely occurs because PDF cell–specific manipulations can desynchronize different populations of central clock cells, resulting in less coherent outputs from the central clock network (Yao and Shafer, 2014). These alterations of feeding period occurred absent any change in overall feeding duration (Figure 1d).
The results of our manipulations of PDF-expressing cells confirm an important role for central clock neurons in the generation of feeding rhythms and furthermore demonstrate that, as is the case for locomotor activity rhythms, central brain clock cells serve a pacemaker function in determining feeding rhythm period. In contrast, we found no effect of fat body cell manipulations on feeding rhythms. Thus, neither expression of UAS-dbtL nor UAS-sgghypo in to-GAL4-expressing cells altered the period or power of feeding rhythms, or the total duration of feeding behavior (Figure 1e-1h).
To confirm the effectiveness of our genetic manipulations of clock speed, we performed immunohistochemical analysis of the PER protein in the brain and fat body. We focused on manipulations that lengthened the period of molecular cycling, as flies expressing dbtL in LNvs maintained more coherent behavioral rhythms compared with those expressing sgghypo, suggesting that underlying molecular changes could be more consistent with dbtL. To detect the subtle alterations in clock speed that should result from our manipulations, we performed our analysis on the third day of DD (DD3) so that differences in period could compound over multiple days. Under these conditions, we found that PER expression in sLNv clock cells showed strong oscillations, with control flies exhibiting a trough of PER expression 60 h into DD and a peak at 72 h (Figure 2a and 2d). Consistent with a period lengthening of ~2 h per day, the trough of PER expression in Pdf>dbtL flies occurred 6 h later than controls, at 66 h into DD (Figure 2c and 2d). Importantly, we found no shift of PER oscillations in sLNv clock cells of to>dbtL flies (Figure 2b and 2d), confirming the absence of to-GAL4 expression in the brain (Dauwalder et al., 2002) and demonstrating a lack of feedback control of central clock cells by molecular clocks in the fat body.
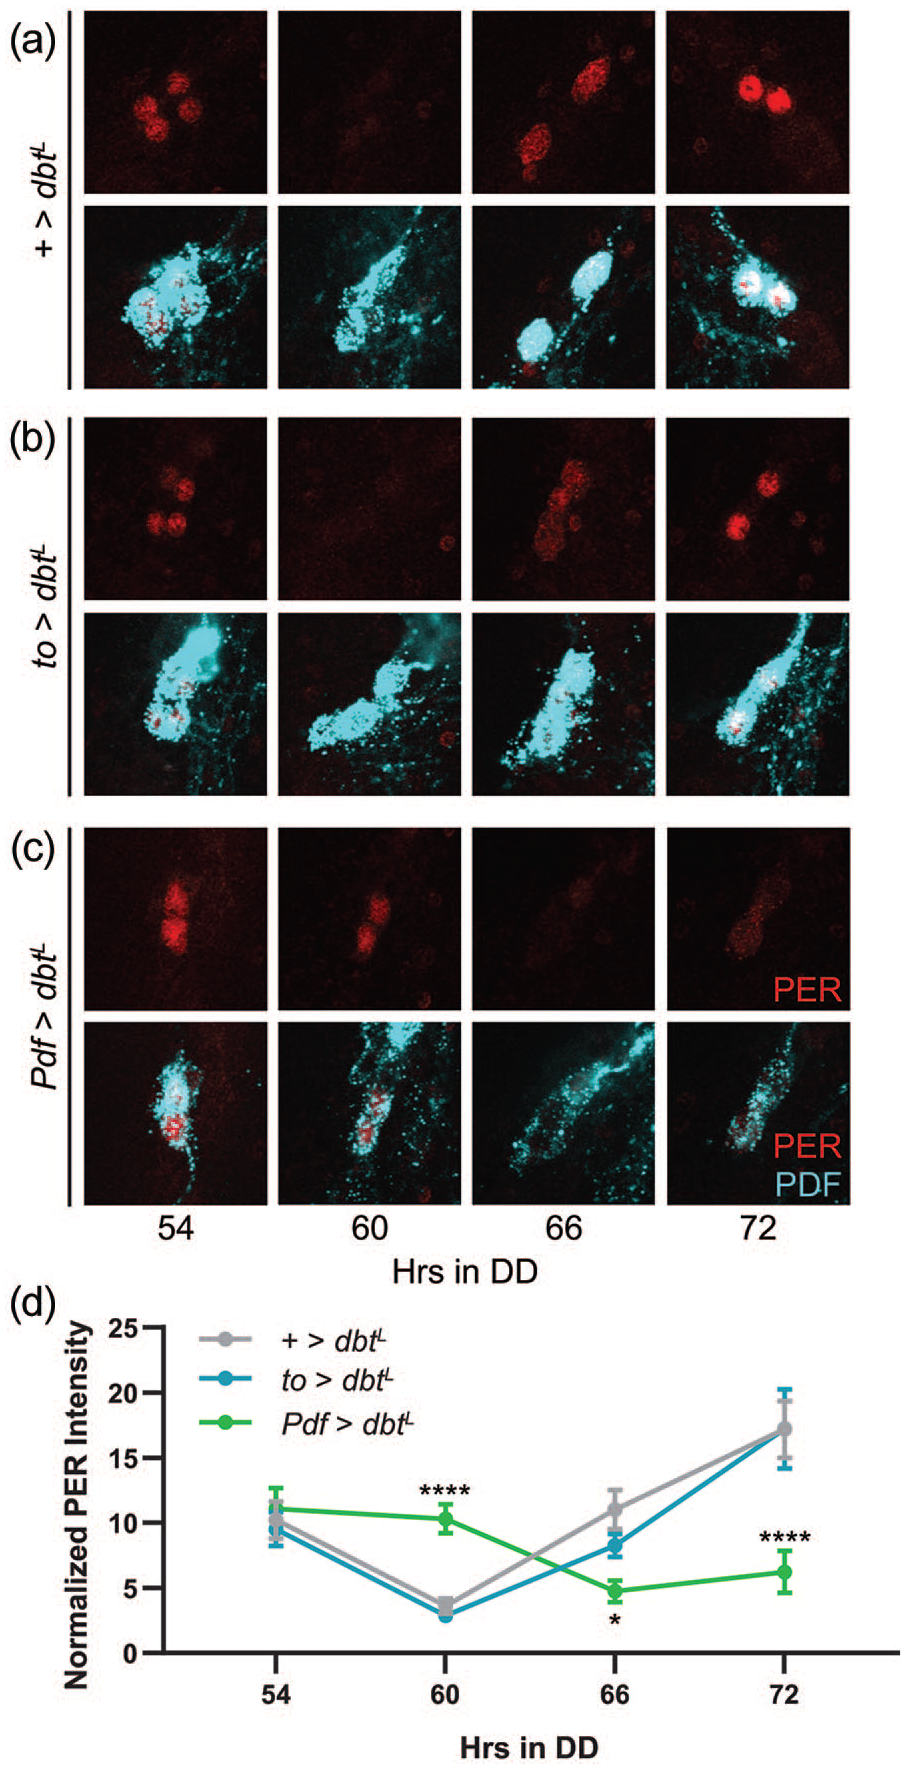
Expression of dbtL cell autonomously lengthens the period of molecular clock oscillations in sLNv neurons. (a-c) Representative confocal images of PER staining (red; top) in sLNv clock cells at time points taken every 6 h on the third day of constant darkness. PDF staining (cyan) was used to identify sLNv cells, and a merged image of PER and PDF staining is shown below each PER staining panel. Control +>dbtL brains (a) exhibit normal PER oscillations in LNv neurons, as do brains from to>dbtL flies (b). Pdf>dbtL flies (c) show a shift in the timing of PER expression. (d) Quantification of PER staining intensity, normalized to background levels (mean ± 95% confidence interval), is plotted for the indicated genotypes. n = 8-10 brains per time point; *p < 0.05. ****p < 0.0001 compared with control PER intensity at that time point, Tukey’s multiple comparisons test following two-way ANOVA. Abbreviations: sLNv = small ventrolateral clock neuron; PDF = pigment-dispersing factor; ANOVA = analysis of variance.
In contrast to the lack of effect on central clock oscillations, to-GAL4-mediated expression of dbtL effectively decelerated fat body clock speed. In control flies, we found low-amplitude PER oscillations on DD3 (Figure 3a and 3c). The low-amplitude cycling of PER expression likely results from dampening over multiple days in DD (Xu et al., 2011), as we found higher amplitude oscillations in fat body cells of flies kept in LD conditions (Suppl. Fig. S2). Nevertheless, despite their low-amplitude nature, we observed the expected shift in PER oscillations in fat body cells of to>dbtL flies (Figure 3b and 3c). These results demonstrate that the lack of effect of fat body clock speed manipulations on behavioral period cannot be attributed to an inability to modify the fat body clock. Interestingly, the low point of PER expression occurred 66 h into DD in the fat body of control flies (Figure 3c), compared with 60 h in the brain (Figure 2d), indicative of internal misalignment between the brain and fat body clocks under DD conditions, possibly due to a long endogenous period of fat body clocks.
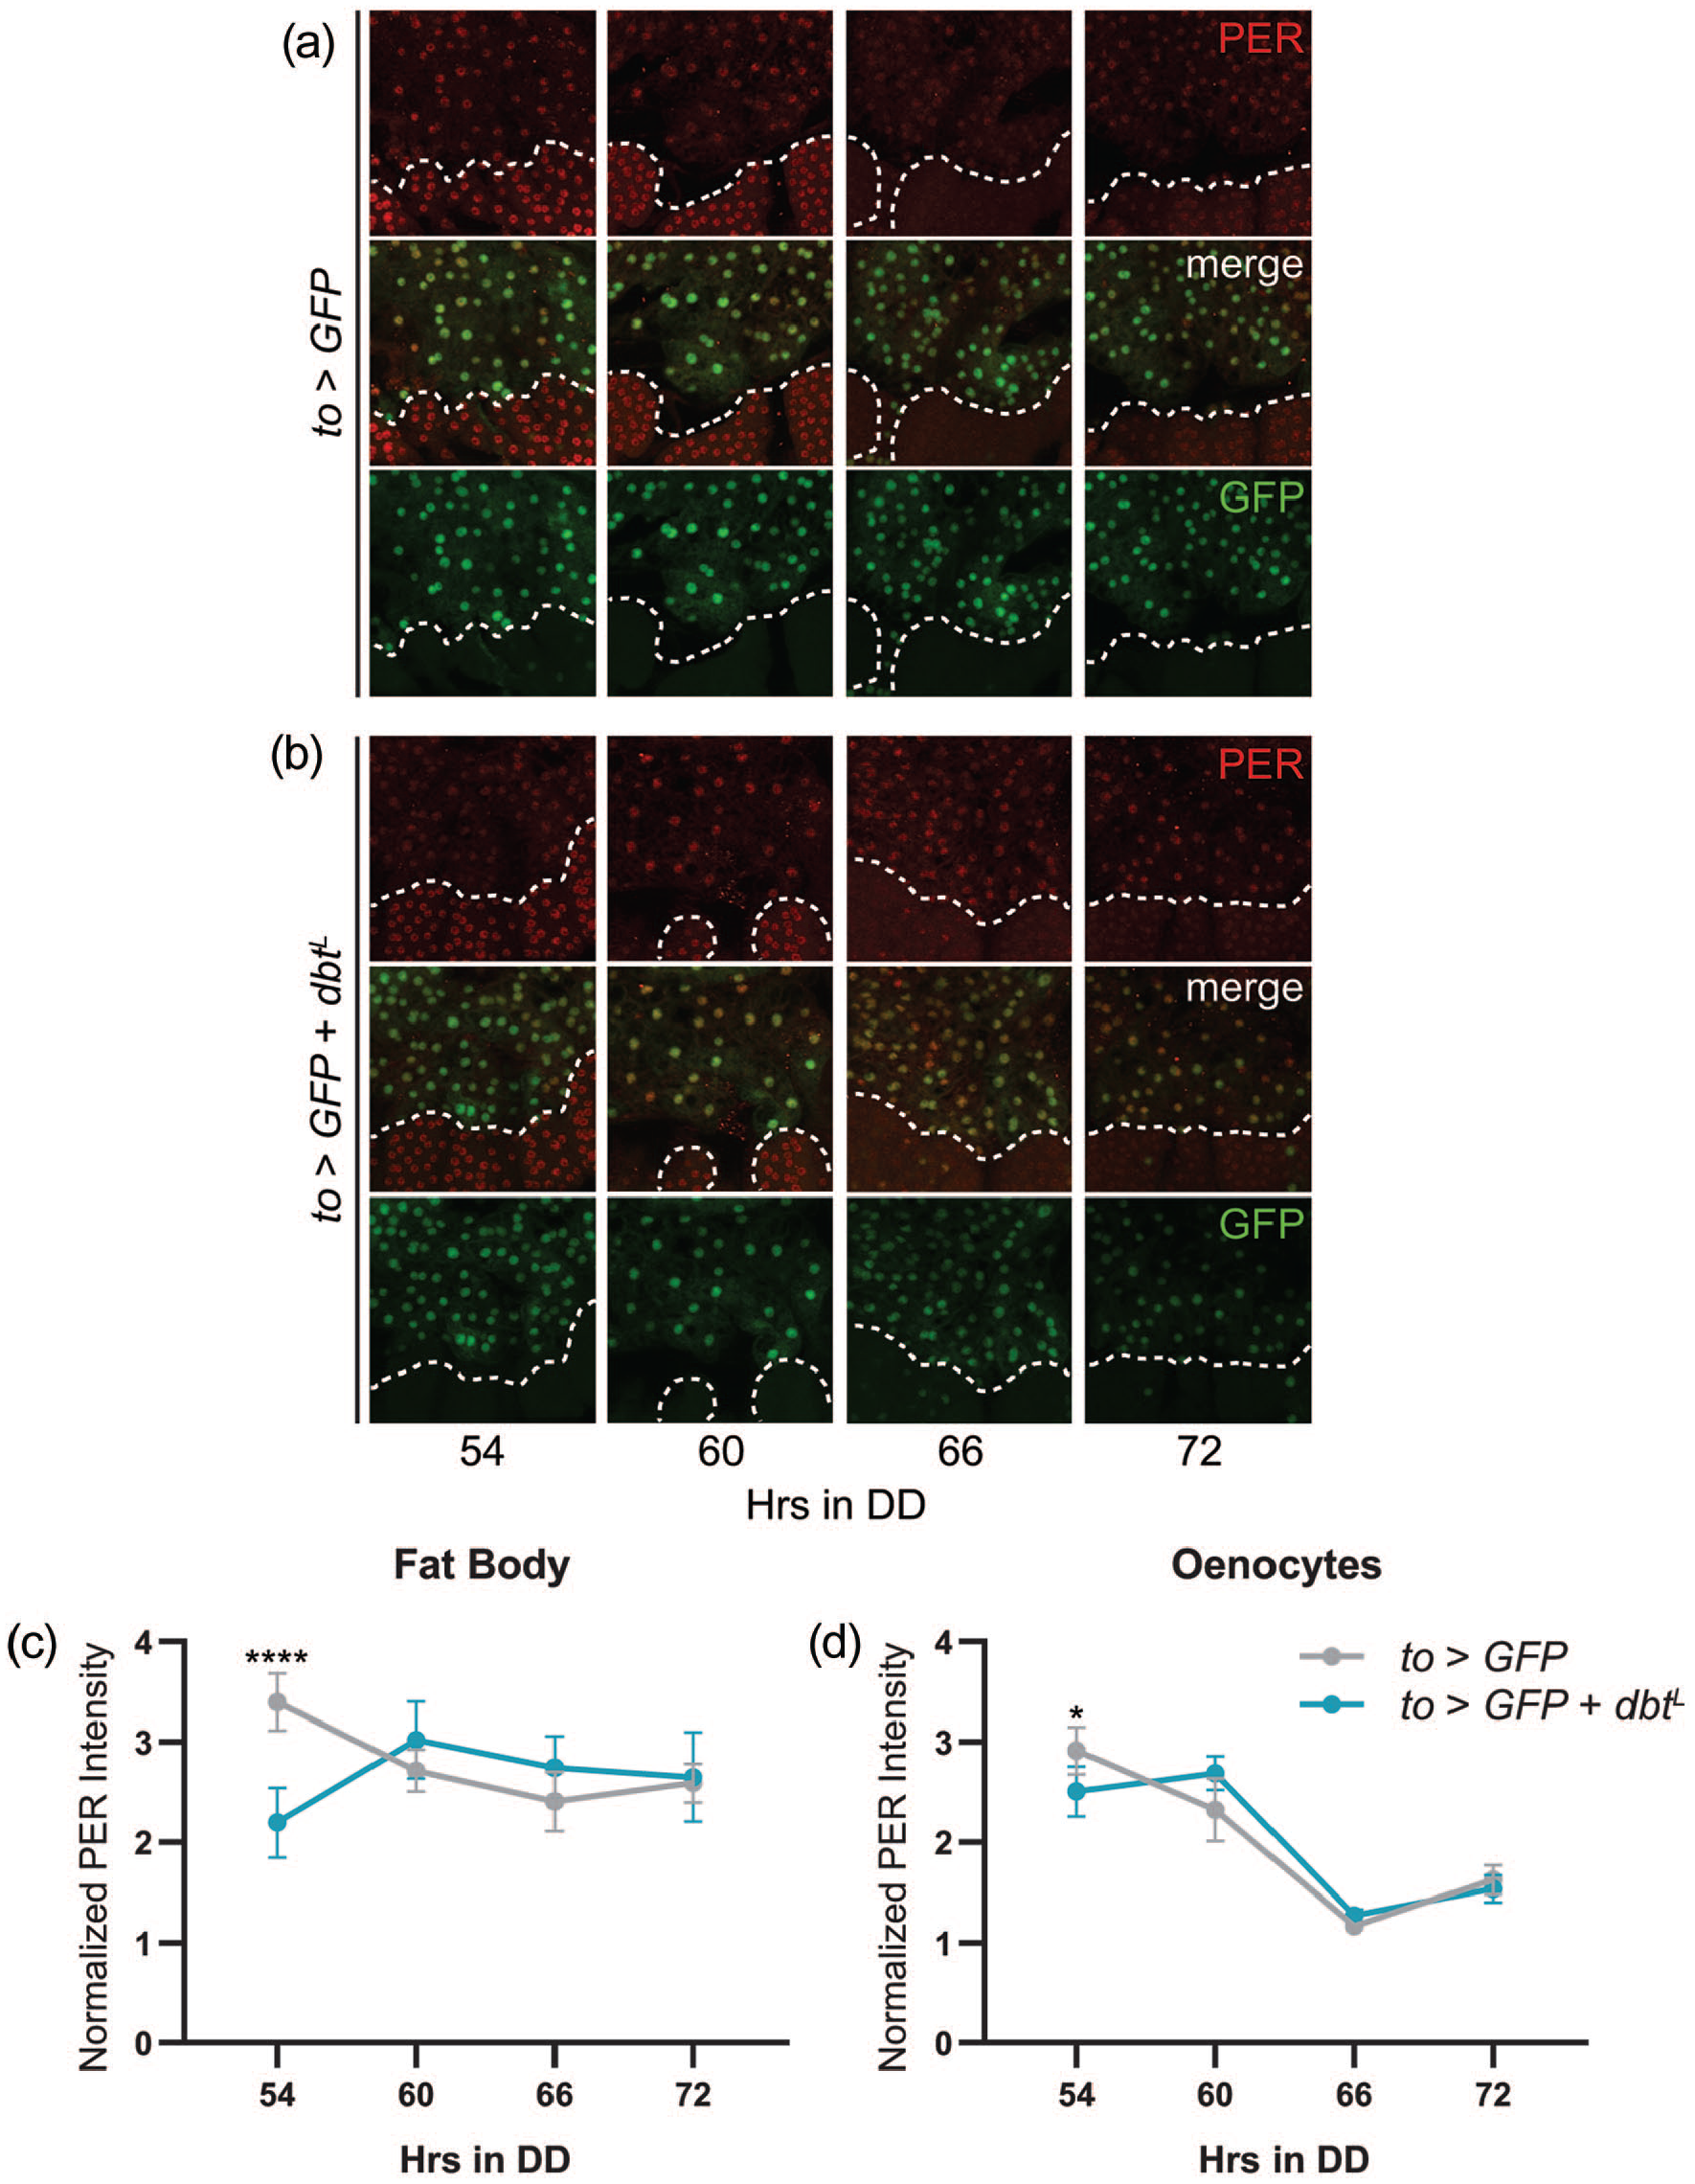
Expression of dbtL in fat body cells lengthens the period of molecular clock oscillations. (a and b) Representative confocal images of PER (red; top) and GFP (green; bottom) staining in abdominal fat body cells and oenocytes at time points taken every 6 h on the third day of constant darkness. Dashed white lines demarcate oenocytes. GFP was used to identify to-GAL4-expressing fat body cells. A merged image is shown in the middle panels. In control to>GFPnls abdomens (a), PER expression peaks 54 h into DD. In to>GFPnls + dbtL flies (b), peak PER expression is delayed to 60 h into DD. (c-d) Quantification of PER staining intensity, normalized to background levels (mean ± 95% confidence interval), is plotted for the indicated genotypes for fat body cells (c) and oenocytes (d). n = 8-10 abdomens per time point; *p < 0.05, ****p < 0.0001 compared with control PER intensity at that time point, Tukey’s multiple comparisons test following two-way ANOVA. Abbreviations: DD = constant dark; ANOVA = analysis of variance.
Because we conducted fat body staining in abdominal whole mounts, we were also able to quantify PER expression in nearby oenocytes, a group of peripheral clock cells that function in lipid metabolism, in particular, in the production of cuticular hydrocarbons (Krupp et al., 2008; Makki et al., 2014). We found more robust PER cycling on DD3 in oenocytes of control flies as compared with fat body cells (Figures 3a and 3d); however, peak and trough PER expression were in phase between these two peripheral tissues, confirming that, as appears to be the case in the fat body, oenocyte clocks have long endogenous periods (Krupp et al., 2008, 2013). Interestingly, we noted a subtle shift in PER cycling in oenocytes following fat body-specific expression of dbtL, as the phase of peak PER expression occurred 6 h later than in controls (Figure 3b and 3d). This could indicate some cross-talk between clocks in the fat body and oenocytes; however, whether this represents a true alteration in phase (rather than experimental variability) is unclear, as the time of the low point of PER expression was unchanged in oenocytes (Figure 3d).
Central Brain Clocks, but not Fat Body Clocks, Are Necessary for Normal Free-Running Feeding Rhythms
Our manipulations of clock speed allowed us to assign a pacemaker function to PDF-expressing central brain clock cells in the control of feeding rhythms. Somewhat surprisingly, however, we found no effect of altering fat body clock speed on the timing of feeding behavior. We therefore decided to assess the impact of genetic elimination of central brain or fat body clocks on feeding rhythms. As this represents a more severe clock manipulation compared with altering oscillatory speed, we reasoned that it could uncover an important contribution of the fat body clock to feeding behavior. To abrogate molecular clock function, we used GAL4-driven, CRISPR-mediated disruption of the per and tim genes (Delventhal et al., 2019).
As expected based on the pacemaker function of the LNvs, CRISPR-mediated targeting of the per and tim genes in PDF-expressing central brain clock cells strongly decreased the strength of feeding rhythms (Figure 4a and 4c) as well as the overall percentage of flies that exhibited rhythmic feeding behavior (61.5% and 36.1% of Pdf>perCRISPR and Pdf>timCRISPR flies, respectively, qualified as rhythmic compared with 88.9% of controls). Nevertheless, the fact that a substantial number of flies retained at least weak rhythmicity demonstrates that feeding rhythms can be generated in the absence of LNv clocks. Moreover, the period of feeding rhythms was unaltered in those flies that retained rhythmic feeding behavior (Figure 4b). In contrast to the profound reduction in feeding rhythm strength associated with loss of central brain clocks, we found no effect of fat body clock abrogation on either the period or strength of feeding rhythms (Figure 4e-4g). Importantly, we observed similar results when we used an alternative fat body selective GAL4 line (Lsp3.1-GAL4) (Lazareva et al., 2007) to drive expression of per- and tim-targeting CRISPR constructs (Suppl. Figs. S3A-S3D). Finally, neither central brain nor fat body clock elimination consistently altered the total duration of feeding behavior (Figure 4d and 4h and Suppl. Fig. S3D).
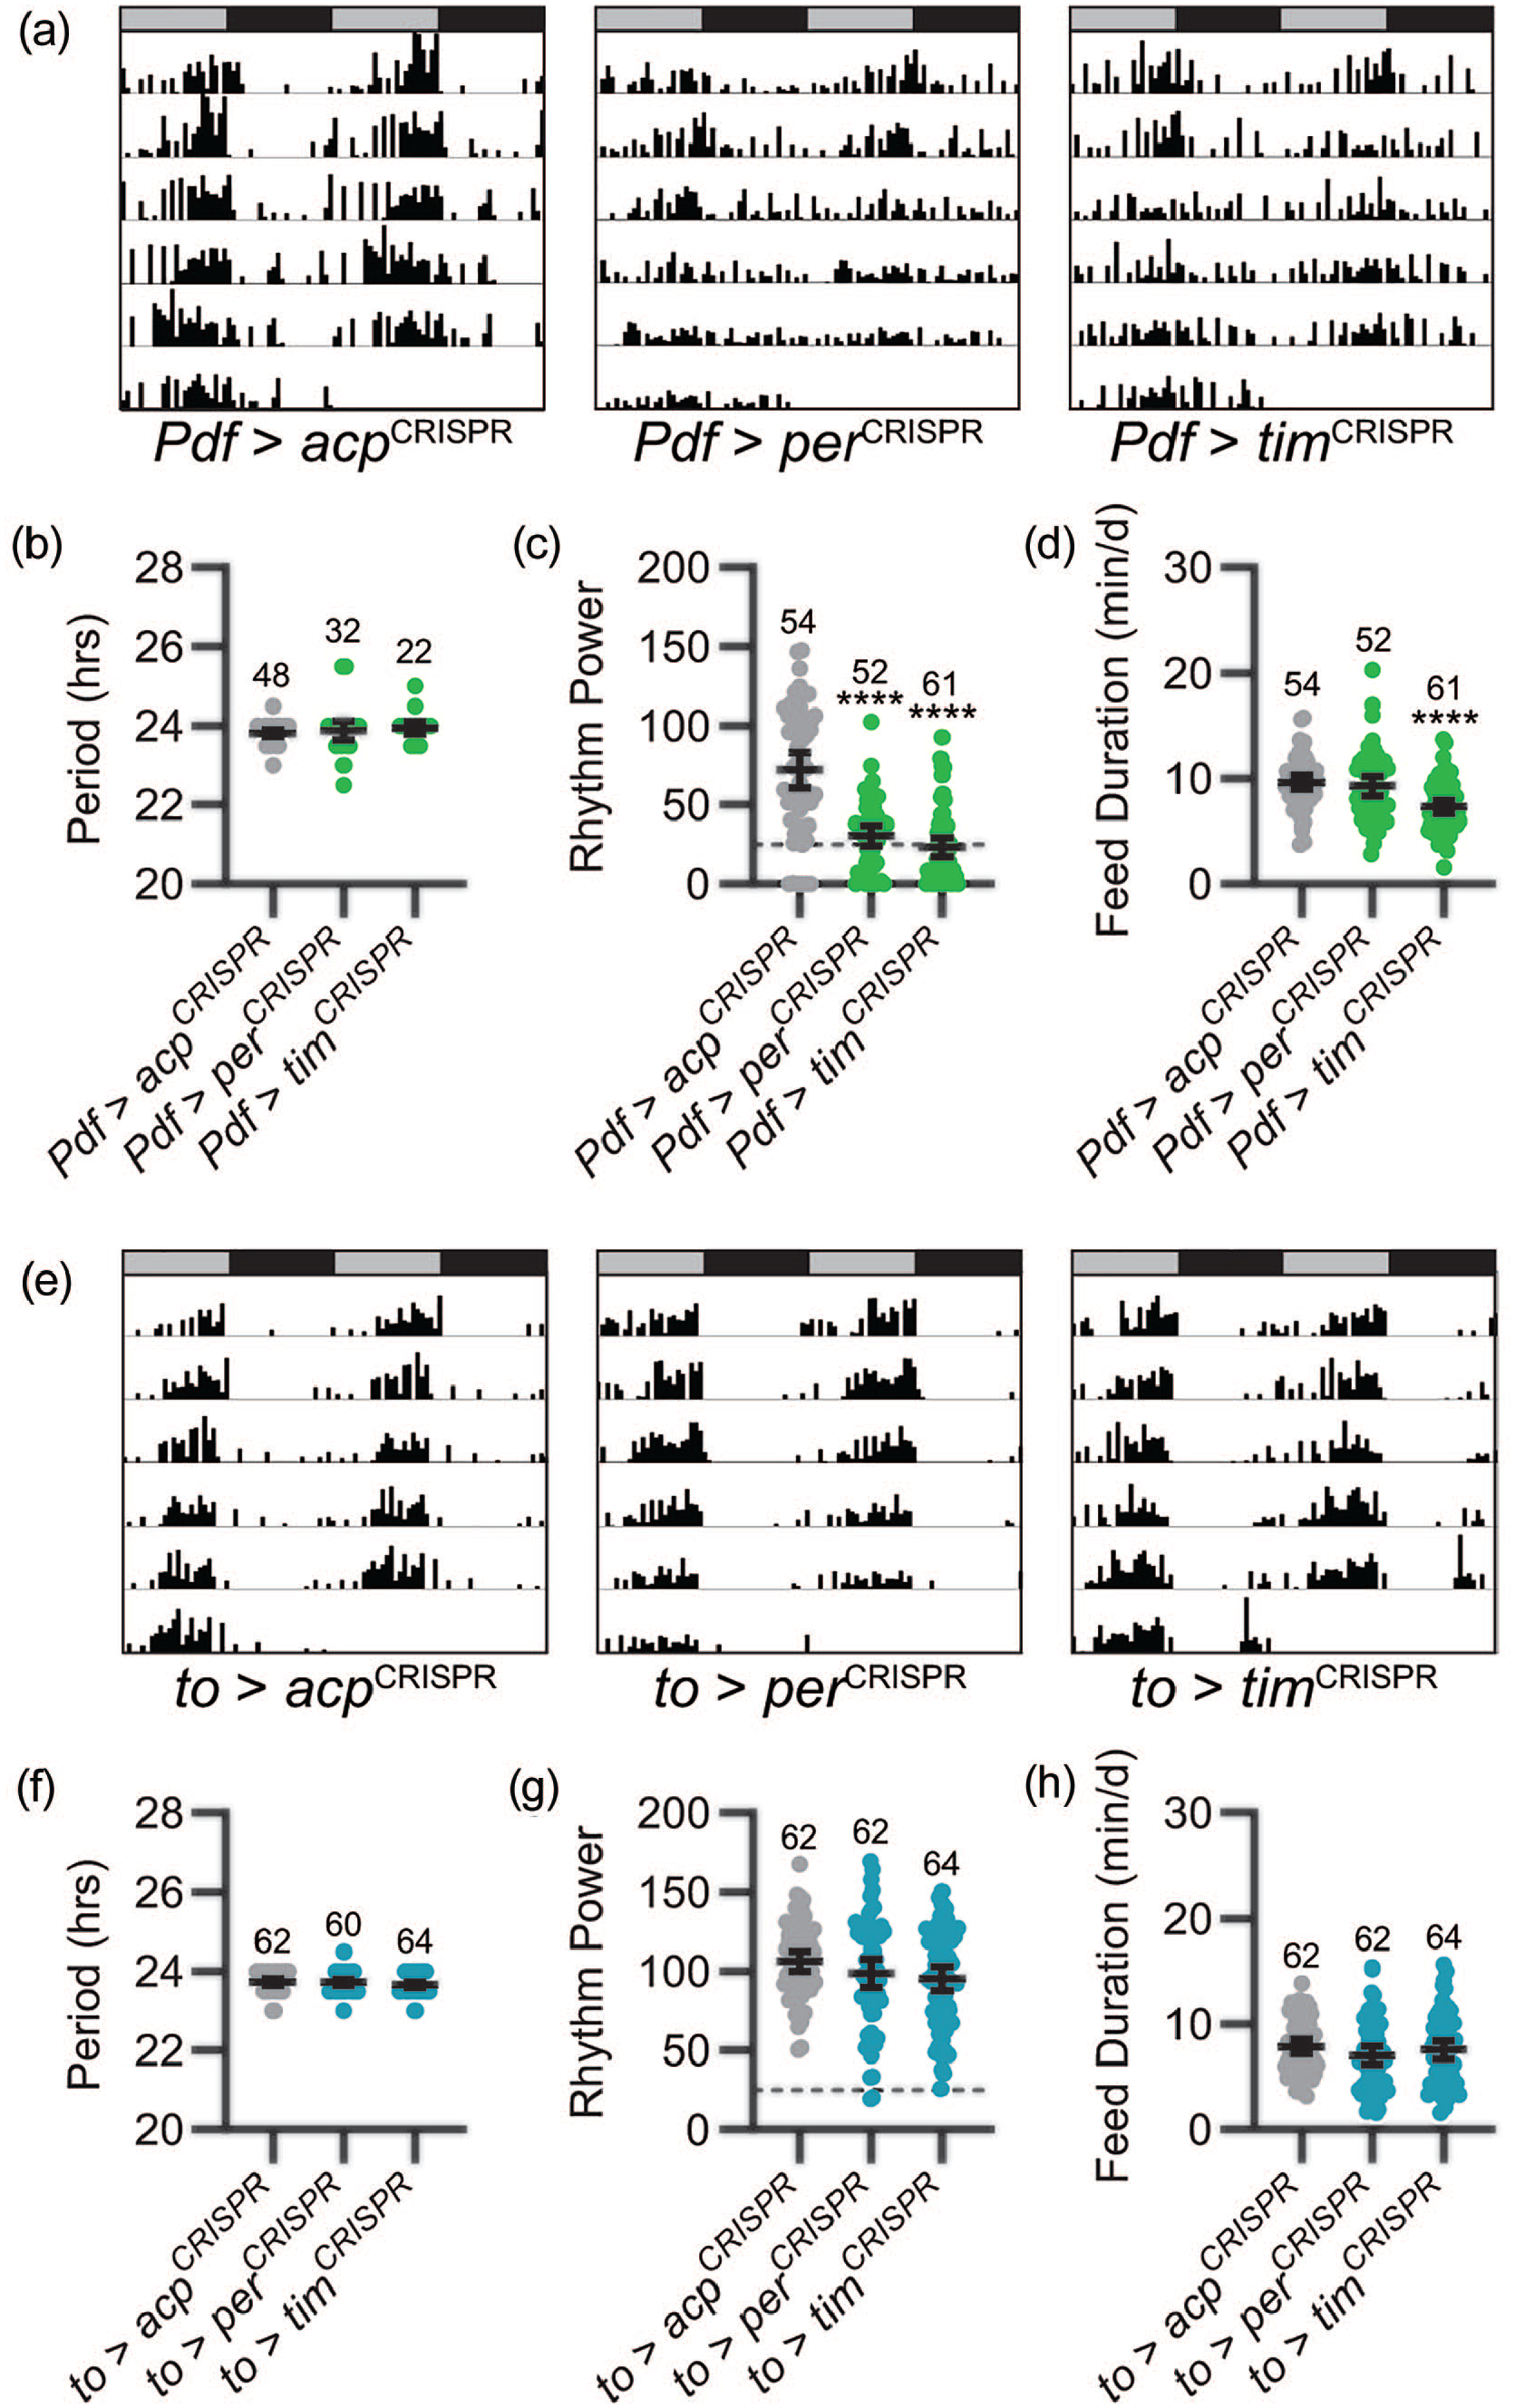
Central brain clock function is necessary for normal feeding rhythms. (a) Representative single-fly feeding records over 6 days in DD for the genotypes listed. Feeding activity in number of “licks” is graphed for each 30-min period. Feeding records are double plotted, with 48 h of data on each line and the second 24 h replotted at the start of the next line. Gray and black bars above each plot represent subjective day and night, respectively. CRISPR-mediated targeting of the per and tim genes selectively in PDF+ cells results in less coherent feeding rhythms. (b-d) Feeding rhythm period (b), power (c), and total daily liquid food interaction time (d) are displayed for the genotypes listed. Experimental groups are shown in green; control groups are shown in gray. Dots represent values for individual flies, and lines show genotype means ± 95% confidence intervals. (e) Representative single-fly feeding records are graphed as in (a) for the genotypes listed. Note the lack of effect of fat body clock abrogation on feeding behavior. (f-h) Feeding rhythm period (f), power (g), and total daily liquid food interaction time (h) are displayed as in (b-d) for the genotypes listed. Experimental groups are shown in blue; control groups are shown in gray. Dashed lines in (c) and (g) indicate rhythmicity cutoff. ****p < 0.0001 compared with control flies; Tukey’s multiple comparisons test following ANOVA. Sample sizes are listed above each plot. Feeding records in (a) and (e) have χ2 power values that fall within the 95% confidence interval of the group mean. Abbreviations: DD = constant dark; PDF = pigment-dispersing factor; CRISPR = clustered regularly interspaced short palindromic repeats; ANOVA = analysis of variance.
As with our manipulations of clock speed, we also obtained immunohistochemical validation of the effectiveness of our genetic clock ablation experiments. The CRISPR constructs that we used have previously been found to effectively eliminate PER and TIM expression in the central brain (Delventhal et al., 2019), but have not been tested for their effects in fat body tissue. We found that CRISPR-mediated targeting of the per gene in the fat body strongly disrupted PER expression. Under LD conditions, when PER cycling is robust in the fat body, control flies showed strong fat body PER expression at ZT0 and a relative absence of expression at ZT12 (Figure 5a and 5c). When per-targeting CRISPR constructs were expressed in fat body cells, PER expression was strongly suppressed (5B and C). We did note that PER expression at ZT0 appeared normal in a small number of to-GAL4-expressing fat body cells, indicating that these cells escaped the CRISPR gene editing. We cannot rule out that the lack of effect on feeding rhythms that we observed in these flies could result from sufficient function provided by the small percentage of unaffected cells; however, we consider this possibility unlikely given that the overwhelming majority of cells exhibited effective gene targeting. Importantly, expression and cycling of PER was unaffected in oenocytes (Figure 5d), demonstrating cell-type specificity.
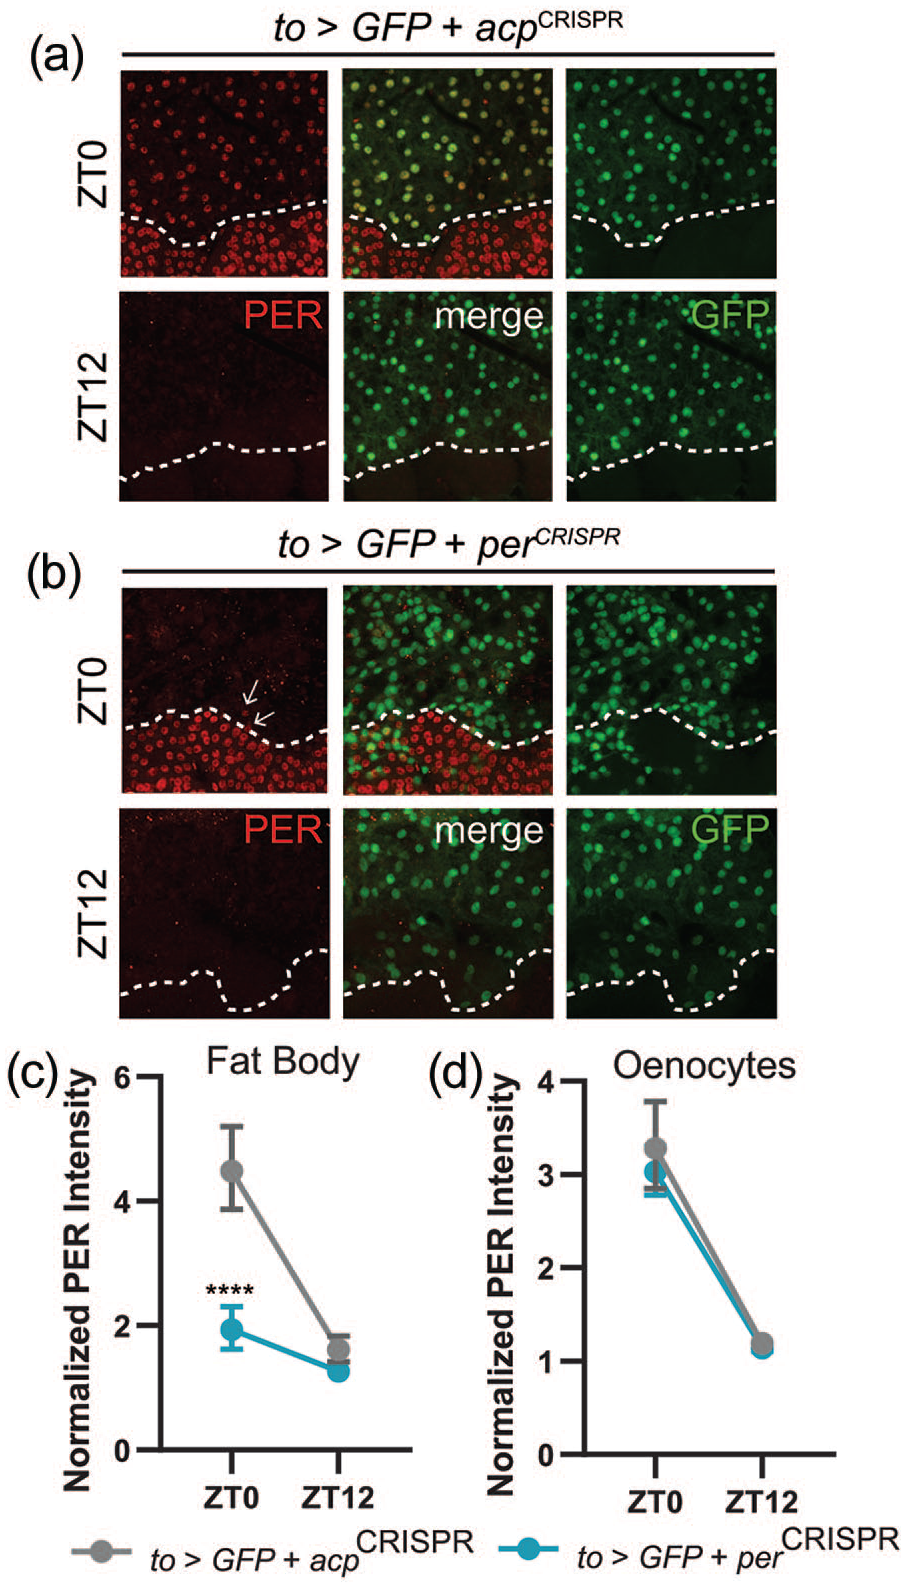
Disruption of PER staining following fat body–specific CRISPR-mediated targeting of the per gene. (a-b) Representative confocal images of PER (red; left) and GFP (green; right) staining in abdominal fat body cells and oenocytes at time points taken every 12 h in light-dark conditions. Dashed white lines demarcate oenocytes. GFP was used to identify to-GAL4-expressing fat body cells. A merged image is shown in the middle panels. Control to>GFPnls + acpCRISPR abdomens show strong PER staining in fat body cells and oenocytes at ZT0, and negligible staining at ZT12. PER staining is almost completely eliminated in fat body cells of to>GFPnls + perCRISPR flies. Arrows indicate cells that have escaped CRISPR effects. (c and d) Quantification of PER staining intensity, normalized to background levels (mean ± 95% confidence interval), is plotted for the indicated genotypes for fat body cells (c) and oenocytes (d). n = 8-10 abdomens per time point; ****p < 0.0001 compared with control PER intensity at that time point, Tukey’s multiple comparisons test following two-way ANOVA. Abbreviations: CRISPR = clustered regularly interspaced short palindromic repeats; ANOVA = analysis of variance.
To further confirm the dissociable effect of brain and fat body clock manipulations on feeding rhythms, we pursued an alternative means to prevent molecular clock cycling, in this case through GAL4-mediated expression of a dominant-negative allele of the cycle gene (UAS-cycDN) (Tanoue et al., 2004). The effects of these manipulations mirrored those obtained with CRISPR-mediated per and tim disruption: Pdf>cycDN flies exhibited greatly reduced feeding rhythm strength, while to>cycDN flies had normal feeding rhythms (Suppl. Fig. S3E-S3L). These results provide corroborative evidence that molecular clocks in central brain clock neurons are required for normal feeding rhythms, but that clocks in the peripheral fat body are dispensable.
Peripheral Clocks Contribute to the Generation of Feeding Rhythms
Our observations thus far support an essential pacemaker role for central brain LNv clock cells in the control of free-running feeding rhythms, with little evidence for a contribution of molecular clocks in peripheral fat body cells. These results raise the question of whether peripheral clocks play any role in the regulation of feeding rhythms. To answer this question, we developed an intersectional genetic approach in which we combined a broad clock cell driver (tim-GAL4) with neuron-specific expression of the GAL80 repressor, which allowed us to drive per- or tim-targeting CRISPR constructs simultaneously in the vast majority of peripheral clock cells while leaving central neuronal clocks unaffected. In a complementary set of studies, we restricted tim-GAL4 activity to central clock neurons via peripheral expression of GAL80, which selectively eliminated clock function in all central brain clock neurons but left peripheral clocks intact (see Methods for details).
Consistent with our findings using LNv brain clock selective manipulations, we observed severe disruption of feeding rhythms following CRISPR-mediated targeting of the per or tim genes in all central clock cells (Figure 6a and 6c). Notably, this manipulation resulted in greater degradation of feeding rhythms compared with molecular clock abrogation in sLNv clock neurons. Only 12.5% and 20.0% of flies with pan-central clock targeting of per and tim, respectively, exhibited rhythmic feeding behavior, compared with 98.0% of control acp-targeted flies, and mean feeding rhythm power was drastically reduced to arrhythmic levels (Figure 6c). In the small percentage of rhythmic flies, period length was not consistently altered (Figure 6b). Interestingly, in addition to their reduced rhythmicity, both central>perCRISPR and central>timCRISPR flies also showed a significant reduction in total feeding time (Figure 6d).
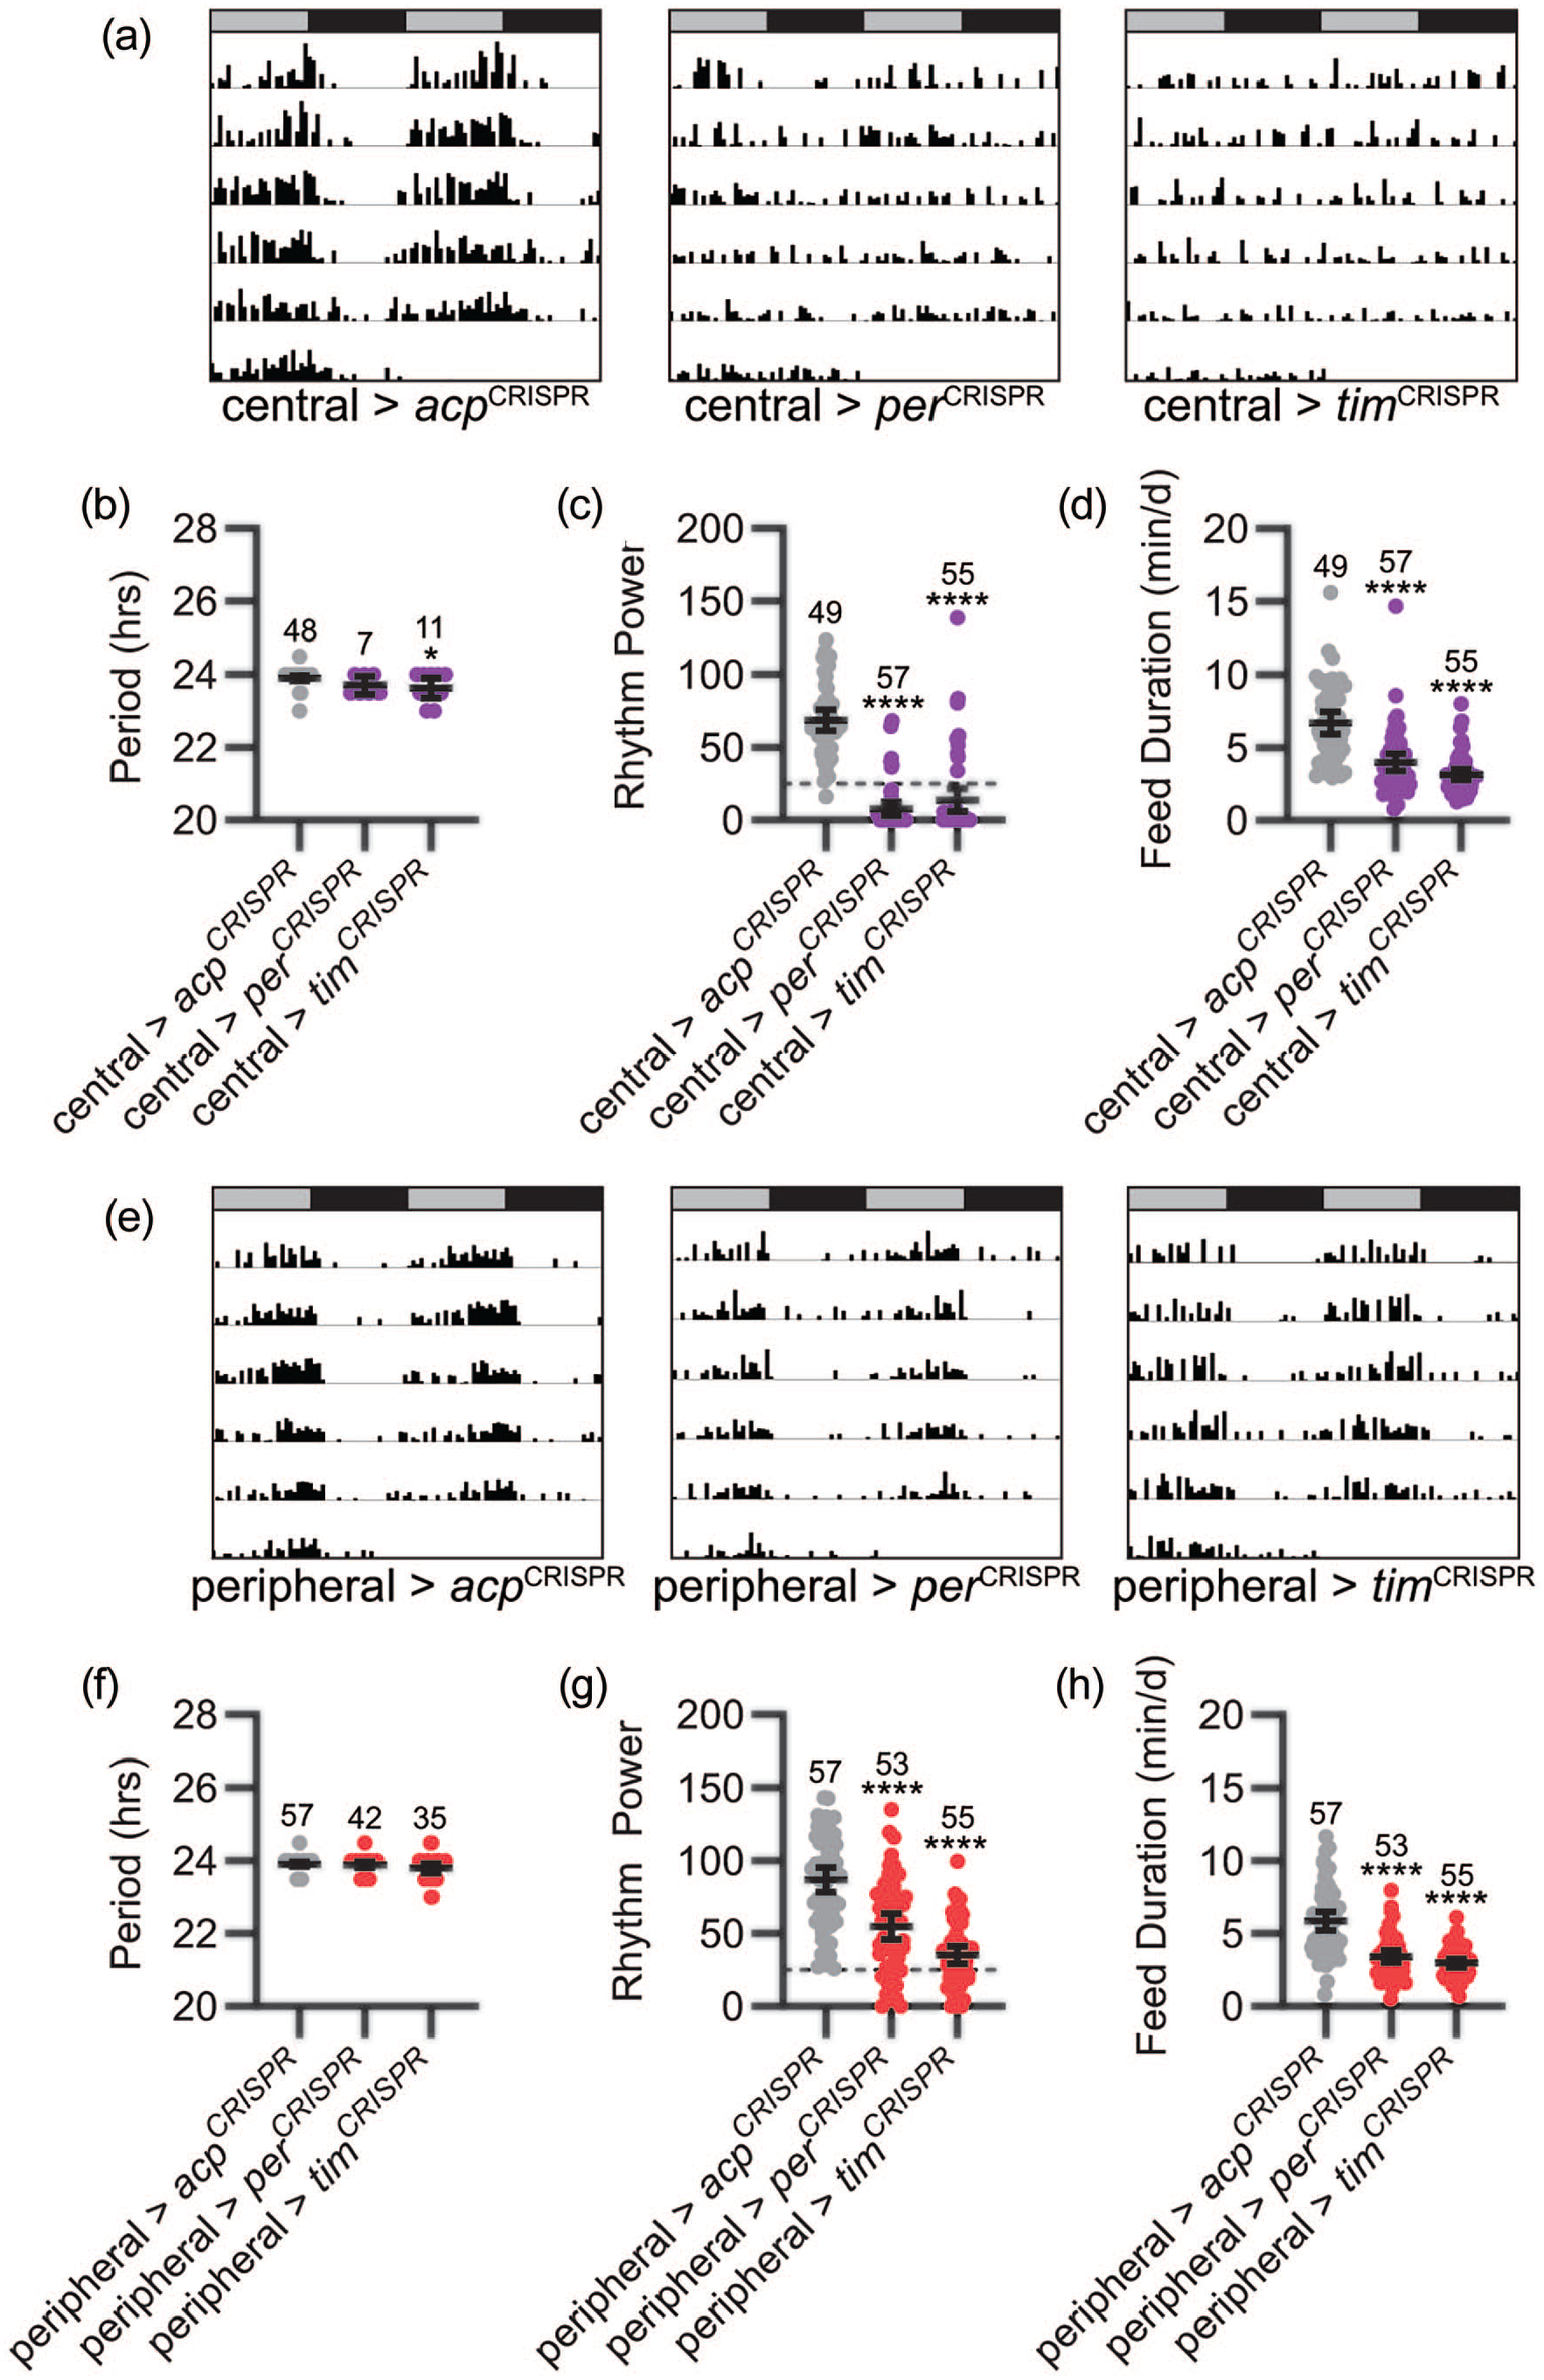
Both central and peripheral clocks contribute to circadian feeding rhythms. (a) Representative single-fly feeding records over 6 days in constant dark for the genotypes listed. Feeding activity in number of “licks” is graphed for each 30-min period. Feeding records are double plotted, with 48 h of data on each line and the second 24 h replotted at the start of the next line. Gray and black bars above each plot represent subjective day and night, respectively. Pan-central clock CRISPR-mediated targeting of the per and tim genes drastically reduces rhythmicity of feeding behavior. (b-d) Feeding rhythm period (b), power (c), and total daily liquid food interaction time (d) are displayed for the genotypes listed. Experimental groups are shown in purple; control groups are shown in gray. Dots represent values for individual flies, and lines show genotype means ± 95% confidence intervals. (e) Representative single-fly feeding records are graphed as in (a) for the genotypes listed. Pan-peripheral clock disruption of per and tim genes reduces strength of feeding rhythms. (f-h) Feeding rhythm period (f), power (g), and total daily liquid food interaction time (h) are displayed as in (b-d) for the genotypes listed. Experimental groups are shown in red; control groups are shown in gray. Dashed lines in (c) and (g) indicate rhythmicity cutoff. ****p < 0.0001 compared with control flies; Tukey’s multiple comparisons test following ANOVA. Sample sizes are listed above each plot. Feeding records in (a) and (e) have χ2 power values that fall within the 95% confidence interval of the group mean. Abbreviations: CRISPR = clustered regularly interspaced short palindromic repeats; ANOVA = analysis of variance.
In contrast to the lack of effect of fat body selective clock abrogation, flies in which per or tim were simultaneously disrupted across multiple peripheral tissues did exhibit a significant reduction in the strength of feeding rhythms (Figure 6e and 6g), with rhythmic flies retaining normal period length (Figure 6f). As for pan-central clock per or tim targeting, this was associated with a reduction in total liquid food interaction time (Figure 6h). Indeed, visual inspection of feeding records revealed that most flies showed dampened rhythmicity associated with a decrease in total feeding events (Figure 6e, 6g, and 6h). These results suggest that peripheral clocks do contribute to feeding regulation, although fat body selective clock manipulation is not itself sufficient to alter feeding rhythms.
Immunohistochemical inspection confirmed a strong effect of expressing per- and tim-targeting CRISPR constructs in peripheral tissues. Thus, PER expression was essentially eliminated in fat bodies of peripheral>perCRISPR flies (Figure 7a-7c). Surprisingly, however, oenocyte PER expression was unaffected (Figure 7a, 7b, and 7d), despite the use of a tim-GAL4 driver that is generally considered to be expressed in all clock cells in our intersectional approach. This indicates that not all peripheral tissues were impacted by our peripheral CRISPR experiments. Importantly, PER expression and cycling in brain clock neurons were also intact in peripheral>perCRISPR flies (Figure 8a-8d), ruling out the possibility that the behavioral phenotype of reduced feeding rhythm strength could be due to unintentional expression of per-targeting CRISPR constructs in the central brain.
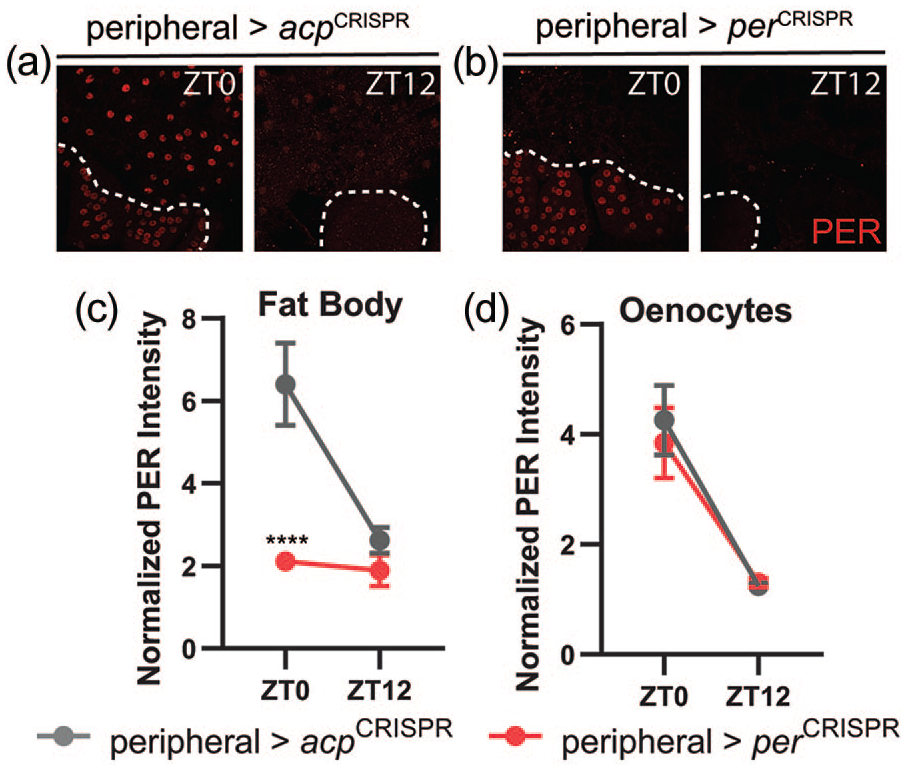
Disruption of PER staining following CRISPR-mediated targeting of the per gene in peripheral tissues. (a and b) Representative confocal images of PER staining (red) in abdominal fat body cells and oenocytes at time points taken every 12 h in light-dark conditions in control acp-targeted flies (a) and experimental per-targeted flies (b). Dashed white lines demarcate oenocytes. Control peripheral>acpCRISPR abdomens show strong PER staining in fat body cells and oenocytes at ZT0, and negligible staining at ZT12. PER staining is nearly eliminated in the fat body (but not oenocytes) of peripheral>perCRISPR flies. (c and d) Quantification of PER staining intensity, normalized to background levels (mean ± 95% confidence interval), is plotted for the indicated genotypes for fat body cells (c) and oenocytes (d). n = 8-10 abdomens per time point; ****p < 0.0001 compared with control PER intensity at that time point, Tukey’s multiple comparisons test following two-way ANOVA. Abbreviations: CRISPR = clustered regularly interspaced short palindromic repeats; ANOVA = analysis of variance.
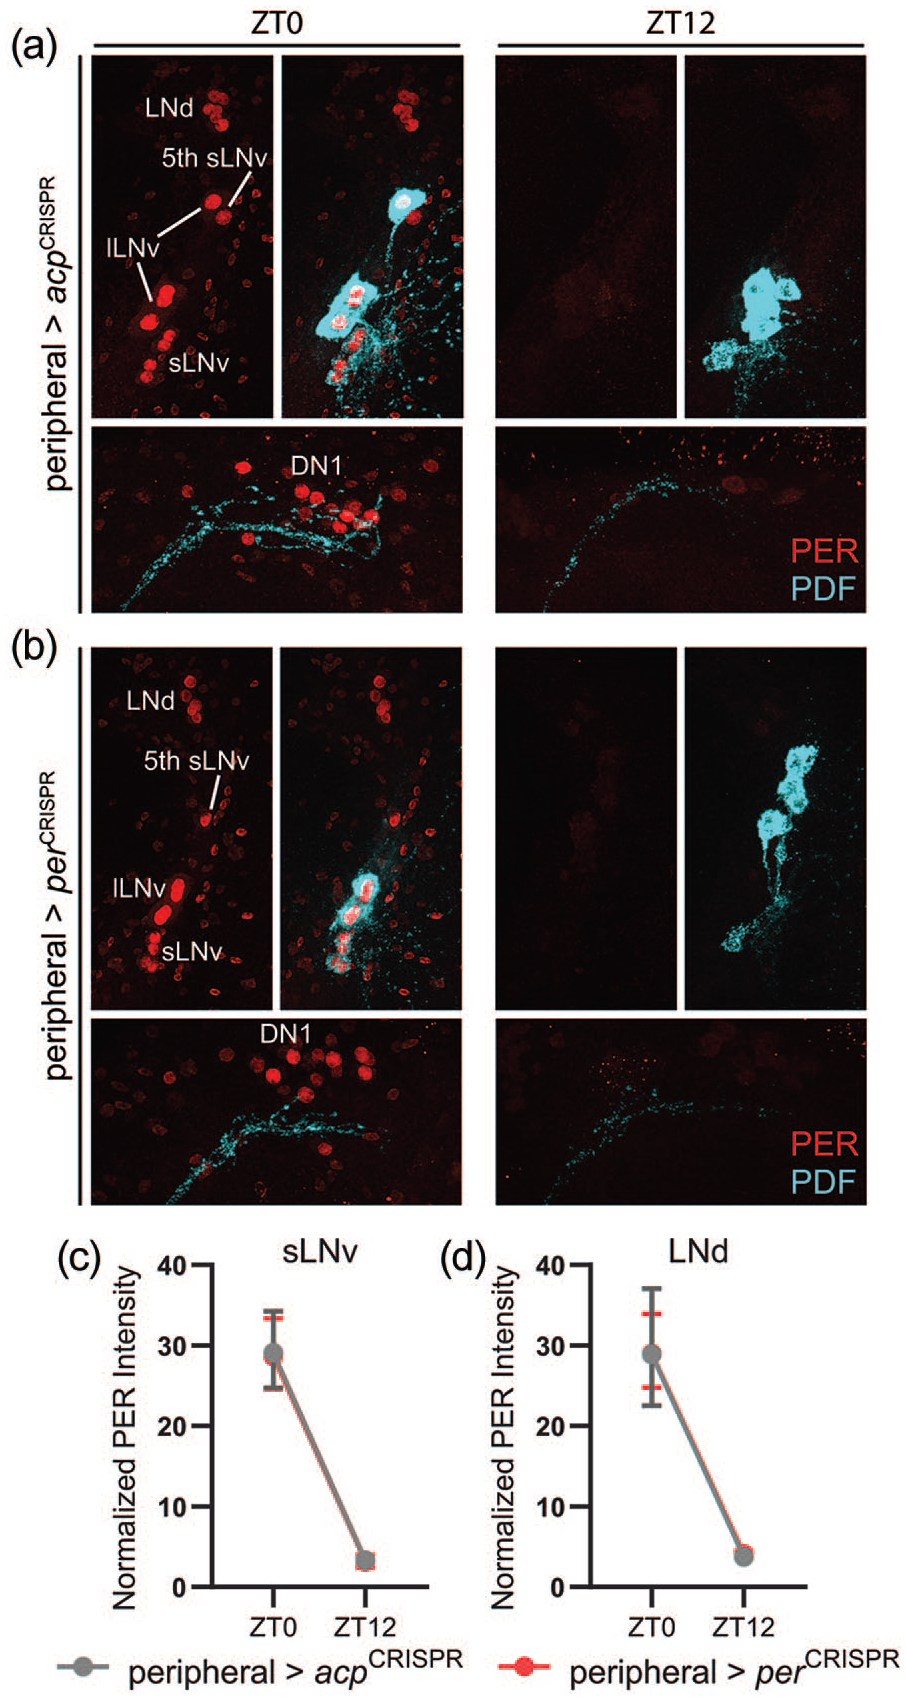
CRISPR-mediated targeting of per gene in peripheral tissues does not impact PER expression or cycling in central brain clock cells. (a and b) Representative confocal images of PER staining (red; left) in LNv and LNd (top) and DN1 (bottom) clock cells at ZT0 and ZT12. PDF staining (cyan) was used to identify sLNv cells, and a merged image of PER and PDF staining is shown to the right of each PER staining panel. Both control peripheral>acpCRISPR and experimental peripheral>perCRISPR flies showed strong PER staining at ZT0 and negligible staining at ZT12. In dorsal images, note the difference in the intensity and degree of fasciculation of PDF+ axon terminals between ZT0 and ZT12. (c and d) Quantification of PER staining intensity, normalized to background levels (mean ± 95% confidence interval), is plotted for sLNv (c) and LNd (d) clock cells of the indicated genotypes. n = 8-10 brains per time point. Abbreviations: lLNv = large ventrolateral clock neuron; LNd = dorsolateral clock neuron; PDF = pigment-dispersing factor; sLNv = small ventrolateral clock neuron; DN1 = dorsal clock neurons 1.
Discussion
Most circadian research in Drosophila has focused on locomotor activity rhythms, as they are robust, highly validated, and easily monitored with commercially available systems. However, in addition to locomotor activity, several other adult fly behaviors have been shown to be under circadian control, including feeding (Seay and Thummel, 2011; Xu et al., 2011; Ro et al., 2014), courtship and mating (Hardeland, 1972; Sakai and Ishida, 2001; Fujii et al., 2007), temperature preference (Kaneko et al., 2012), learning and memory (Lyons and Roman, 2009; Fropf et al., 2014), and grooming (Qiao et al., 2018). However, with a few exceptions (most notably for temperature preference rhythms (Goda and Hamada, 2019)), comparatively little is known about the cellular and circuit mechanisms through which these behaviors come under circadian control.
Using the recently developed FLIC system (Ro et al., 2014), we have confirmed circadian control of feeding behavior. We find that individual control flies exhibit robust feeding rhythms that persist for multiple days under free-running conditions and depend on molecular clock function. Furthermore, consistent with a recent study that demonstrated a loss of feeding rhythms following electrical silencing of LNvs (Barber et al., 2021), we establish that feeding rhythmicity critically depends on circadian function of clock neurons in the brain, in particular the PDF-expressing LNv cells. Of note, Barber et al. reported that Kir2.1-mediated inhibition of PDF-expressing cells eliminated feeding rhythms, whereas we observed that a substantial percentage of individual flies retained weakened feeding rhythms in the face of molecular clock abrogation in the same cells. As Barber et al. only reported group mean data, it is not clear whether some individual flies maintain rhythmic feeding behavior during inhibition of neuronal firing in LNvs. However, a more profound effect of electrical silencing compared with molecular clock elimination would be consistent with the idea that network properties confer resilience upon the circadian system to molecular deficiencies within specific clock cell populations, as has been suggested by studies of Drosophila locomotor activity rhythms (Bulthuis et al., 2019; Schlichting et al., 2019).
Our findings of a prominent role for LNv clock neurons in the generation of feeding rhythms parallel those observed for the control of locomotor activity rhythms (Dubowy and Sehgal, 2017), suggesting that circadian control of these two behaviors shares at least partially overlapping central circuitry. The conserved contribution of the LNvs to circadian modulation of multiple behavioral outputs is not surprising, given that the LNvs represent an essential, central node for clock network organization under conditions of constant darkness (Renn et al., 1999; Lin et al., 2004; Yoshii et al., 2009). Further studies are necessary to determine whether feeding and locomotor activity output circuits also share other clock cell components in addition to LNvs. Interestingly, though these two behaviors are inextricably linked in that flies must be awake to feed, we have found that rhythms of locomotor activity and feeding can be dissociated. Thus, mutant flies lacking diuretic hormone 44 receptor 1 (Dh44-R1) expression maintain strong feeding rhythms despite a significant reduction in the strength of locomotor activity rhythms (King et al., 2017), which indicates that the feeding rhythm does not simply occur secondary to sleep-wake cycles, and furthermore suggests that output circuits controlling these two processes ultimately diverge.
One caveat in the use of the FLIC system is that we are not directly measuring food intake. Instead, feeding is inferred based on food interactions that occur with a certain magnitude and duration, as these parameters have been shown to correlate well with intake (Ro et al., 2014; Dreyer et al., 2019). This is in contrast to other methods that measure direct consumption based on uptake of radioactive or dye-labeled food or that use the capillary feeding (CAFE) assay (Ja et al., 2007), which tracks ingestion of liquid food from a microcapillary tube. Interestingly, although several of these methods have been used to demonstrate circadian regulation of feeding, differences have been found in the exact timing of feeding. Thus, under our monitoring conditions, most liquid food interactions occurred during the subjective day, with a large peak at the end of the subjective day and a smaller peak at the onset of the subjective day (Suppl. Fig. S4). In contrast, others using variations of the CAFE assay have found prominent feeding peaks toward the beginning of the subjective day (Xu et al., 2008; Schäbler et al., 2020; Barber et al., 2021), though this appears to depend in part on sex (Liu et al., 2021). The reason for this difference in peak feeding phase is unclear, though we note that our FLIC assays also differ from other methods in that (1) we can observe strong rhythms in individual flies, whereas other methods typically report only group averages, and (2) our FLIC experiments are generally carried out for a longer time under DD conditions. This latter difference may be of importance, as it was noted for experiments measuring radioactive food consumption that a major evening peak developed with extended DD exposure (Seay and Thummel, 2011). Nevertheless, further studies will be necessary to resolve the temporal differences in feeding observed using these different feeding monitoring methods.
Previously, Xu et al. reported that genetic elimination of the fat body clock produced a change in the temporal distribution of feeding behavior, such that flies without fat body clocks exhibited substantial feeding during the subjective night (Xu et al., 2008). They did not assess for changes in the period or strength of feeding rhythms; nevertheless, their results suggested that molecular cycling in the fat body contributes to regulating the timing of feeding. In contrast, we found no effect of fat body clock manipulations on the period or strength of feeding rhythms, nor on the phase of oscillations (Suppl. Fig. S4). Furthermore, this conclusion held across multiple distinct manipulations and with different fat body–targeting GAL4 lines. It is difficult to account for these contrasting phenotypes, though they could derive from differences in the methods used to track feeding behavior. Xu et al. measured food intake based on uptake of dye-laced food, or via the CAFE assay. In both cases, ingestion was measured in groups of flies housed together, and cohorts had to be manually transferred to different food vials prior to feeding measurements. Conceivably, either of these factors could have altered feeding behavior. Regardless, our studies demonstrate that, under at least some conditions, feeding rhythms can remain unchanged in the face of manipulations of fat body clocks.
Consistent with previous findings across multiple peripheral tissues in Drosophila (Hege et al., 1997; Stanewsky et al., 1997; Giebultowicz et al., 2000; Ito et al., 2008; Xu et al., 2008; Parasram et al., 2018), we observed that molecular oscillations in the fat body clock dampened under free-running conditions. In comparison, the oenocyte clock retained more robust free-running oscillations. This suggests that the fat body clock may be particularly dependent on light cues and furthermore indicates a degree of independence in circadian regulation of these two peripheral metabolic clock tissues. In addition to dampening, molecular oscillations of the fat body clock gradually grew out of phase with those of the brain clock over prolonged DD exposure, suggestive of a long free-running period of the fat body clock. Our observation that the fat body clock operates with a long endogenous period is consistent with the finding that expression patterns of clock genes such as tim and per exhibit 26- to 28-h periods in the fat body, as assessed by RNA sequencing of fat body tissue conducted at different time points throughout the day, while the same genes displayed ~24-h oscillations in brain tissue (Litovchenko et al., 2021). This further supports our conclusion that the fat body clock does not impact feeding behavior, since robust ~24-h feeding rhythms persist in flies kept in constant darkness despite the fact that the fat body clocks operate with long periods under these conditions. Interestingly, we also observed evidence for a long-running molecular period in oenocyte cells, in line with previous reports (Krupp et al., 2008, 2013). Together, these findings raise the remarkable possibility that internal circadian misalignment commonly occurs in Drosophila in the absence of environmental time cues. It is unclear the extent to which this phenomenon could occur in other species, but seems more likely in animals in which peripheral clocks operate relatively independently of the central brain clock.
Despite a lack of effect of fat body clock manipulations on feeding behavior, we did find that simultaneous disruption of most peripheral clocks significantly dampened feeding rhythms and decreased total liquid food interaction time. These results demonstrate an important contribution of peripheral clocks to feeding behavior; however, it is unclear whether the resultant phenotypes occur due to disruption of specific peripheral clocks or if there are additive or redundant contributions from individual peripheral tissues such that multiple tissue types must be affected to alter feeding rhythms. As our peripheral CRISPR experiments did not impact oenocytes, it appears that the disruption of feeding rhythms we observed does not necessitate abrogation of oenocyte molecular clocks. Future studies aimed at selectively disrupting other peripheral clocks alone and in combination, particularly those in metabolic tissues such as the gut, oenocytes, or corpora cardiaca, will help to clarify this issue and provide insight into the manner through which central and peripheral clock information is integrated and coordinated for control of feeding rhythms.
Supplemental Material
sj-eps-1-jbr-10.1177_07487304211045835 – Supplemental material for Central and Peripheral Clock Control of Circadian Feeding Rhythms
Supplemental material, sj-eps-1-jbr-10.1177_07487304211045835 for Central and Peripheral Clock Control of Circadian Feeding Rhythms by Carson V. Fulgham, Austin P. Dreyer, Anita Nasseri, Asia N. Miller, Jacob Love, Madison M. Martin, Daniel A. Jabr, Sumit Saurabh and Daniel J. Cavanaugh in Journal of Biological Rhythms
Supplemental Material
sj-eps-2-jbr-10.1177_07487304211045835 – Supplemental material for Central and Peripheral Clock Control of Circadian Feeding Rhythms
Supplemental material, sj-eps-2-jbr-10.1177_07487304211045835 for Central and Peripheral Clock Control of Circadian Feeding Rhythms by Carson V. Fulgham, Austin P. Dreyer, Anita Nasseri, Asia N. Miller, Jacob Love, Madison M. Martin, Daniel A. Jabr, Sumit Saurabh and Daniel J. Cavanaugh in Journal of Biological Rhythms
Supplemental Material
sj-eps-3-jbr-10.1177_07487304211045835 – Supplemental material for Central and Peripheral Clock Control of Circadian Feeding Rhythms
Supplemental material, sj-eps-3-jbr-10.1177_07487304211045835 for Central and Peripheral Clock Control of Circadian Feeding Rhythms by Carson V. Fulgham, Austin P. Dreyer, Anita Nasseri, Asia N. Miller, Jacob Love, Madison M. Martin, Daniel A. Jabr, Sumit Saurabh and Daniel J. Cavanaugh in Journal of Biological Rhythms
Supplemental Material
sj-eps-4-jbr-10.1177_07487304211045835 – Supplemental material for Central and Peripheral Clock Control of Circadian Feeding Rhythms
Supplemental material, sj-eps-4-jbr-10.1177_07487304211045835 for Central and Peripheral Clock Control of Circadian Feeding Rhythms by Carson V. Fulgham, Austin P. Dreyer, Anita Nasseri, Asia N. Miller, Jacob Love, Madison M. Martin, Daniel A. Jabr, Sumit Saurabh and Daniel J. Cavanaugh in Journal of Biological Rhythms
Footnotes
Acknowledgements
Conflict of Interest Statement
The author(s) have no potential conflicts of interest with respect to the research, authorship, and/or publication of this article.
Notes
References
Supplementary Material
Please find the following supplemental material available below.
For Open Access articles published under a Creative Commons License, all supplemental material carries the same license as the article it is associated with.
For non-Open Access articles published, all supplemental material carries a non-exclusive license, and permission requests for re-use of supplemental material or any part of supplemental material shall be sent directly to the copyright owner as specified in the copyright notice associated with the article.