
Abstract
Seasonal light cycles influence multiple physiological functions and are mediated through photoperiodic encoding by the circadian system. Despite our knowledge of the strong connection between seasonal light input and downstream circadian changes, less is known about the specific components of seasonal light cycles that are encoded and induce persistent changes in the circadian system. Using combinations of 3 T cycles (23, 24, 26 h) and 2 photoperiods per T cycle (long and short, with duty cycles scaled to each T cycle), we investigate the after-effects of entrainment to these 6 light cycles. We measure locomotor behavior duration (α), period (τ), and entrained phase angle (ψ) in vivo and SCN phase distribution (σφ), τ, and ψ ex vivo to refine our understanding of critical light components for influencing particular circadian properties. We find that both photoperiod and T-cycle length drive determination of in vivo ψ but differentially influence after-effects in α and τ, with photoperiod driving changes in α and photoperiod length and T-cycle length combining to influence τ. Using skeleton photoperiods, we demonstrate that in vivo ψ is determined by both parametric and nonparametric components, while changes in α are driven nonparametrically. Within the ex vivo SCN, we find that ψ and σφ of the PER2∷LUCIFERASE rhythm follow closely with their likely behavioral counterparts (ψ and α of the locomotor activity rhythm) while also confirming previous reports of τ after-effects of gene expression rhythms showing negative correlations with behavioral τ after-effects in response to T cycles. We demonstrate that within-SCN σφ changes, thought to underlie α changes in vivo, are induced primarily nonparametrically. Taken together, our results demonstrate that distinct components of seasonal light input differentially influence ψ, α, and τ and suggest the possibility of separate mechanisms driving the persistent changes in circadian behaviors mediated by seasonal light.
The duration of daylight, or photoperiod, represents a predictable and dynamic signal of seasonal change throughout the year across much of the planet. The predictability of this signal is harnessed by organisms to initiate or avoid a variety of biological functions at specific times of year, including reproductive behaviors (Elliott and Goldman, 1981), resource conservation (Bartness et al., 1989; Bartness and Wade, 1984), and migration (Gwinner, 1990). In humans, a variety of disorders and noncommunicable diseases have seasonal correlations (Basnet et al., 2016; Oh et al., 2010; Wehr, 2001), with perhaps the most striking seasonal influence being on depression-anxiety behaviors (Koorengevel et al., 2003). Despite clear associations between photoperiodic exposure and physiological function and dysfunction, the roles of specific components of seasonal light cycles that induce those changes are incompletely understood.
One factor critical to our current understanding of the mechanism of photoperiodic induction is the persistence of seasonal changes. Physiological hallmarks of exposure to particular light schedules can be observed, for varying intervals, beyond direct exposure to that light schedule (Pittendrigh and Daan, 1976a). These persistent changes, referred to as after-effects, include characteristic changes to core circadian locomotor behavior patterns in the form of activity duration (alpha, α), free-running period (tau, τ), and phase angle of entrainment (psi, ψ). In nocturnal animals, prior exposure to long photoperiods results in after-effects of compressed α, a shortened τ, and an advanced ψ relative to short photoperiod counterparts as measured upon release into DD (Pittendrigh and Daan, 1976a).
The existence of after-effects suggests that seasonal light-cycle information is encoded within the brain and can persist beyond the interval of direct exposure. The master circadian pacemaker of the brain, the suprachiasmatic nucleus (SCN), likely plays a major role in this encoding, particularly with regard to after-effects in circadian behavior (for review, see Tackenberg and McMahon, 2018). In addition, recent work has identified a distinct non-SCN target for photoperiodic influence, the peri-habenular area, influencing seasonal response in mood (Fernandez et al., 2018). Like circadian locomotor behavior patterning, the SCN undergoes substantial changes in organization following exposure to different photoperiods, constituting network-level after-effects. These responses include changes in phase distribution (σφ) of its constituent neurons as well as in τ and ψ of SCN gene expression rhythms. Prior exposure to long photoperiod has been shown to increase σφ of Period1∷Luciferase (Inagaki et al., 2007), PERIOD2∷LUCIFERASE (Buijink et al., 2016), and electrical (VanderLeest et al., 2007) rhythms compared with short photoperiod counterparts. As in locomotor behavior after-effects, some reports have shown that prior exposure to long photoperiod shortens the SCN τ compared with short photoperiod counterparts (16:8 L:D, Ciarleglio et al., 2011; 20:4 L:D, Evans et al., 2013), whereas others have found nonsignificant decreases in SCN τ length following exposure to long photoperiod, particularly in the anterior SCN (Buijink et al., 2016; Mickman et al., 2008).
Induction of persistent circadian after-effects is not limited to changes in photoperiod. Manipulation of total day-night cycle (T cycle) length also induces after-effects in circadian locomotor behavior, with entrainment to short T cycles (T <24 h) resulting in contracted α (Azzi et al., 2014) and shortened τ upon release into constant conditions (Azzi et al., 2014; Schwartz et al., 2011). However, unlike photoperiodic after-effects, in which the changes in the τ of the explanted SCN itself match those on behavior, there is a negative correlation between behavioral and SCN explant τ following entrainment to T cycles. Exposure to short T cycles results in a long SCN τ, and exposure to long T cycles results in a short SCN τ (Aton et al., 2004; Azzi et al., 2017; Molyneux et al., 2008).
The findings described above reveal a potential pattern of circadian after-effects, with long photoperiods and short T cycles producing one set of behavioral responses (short α, short τ), and short photoperiods and long T cycles producing another (long α, long τ). Because recent work has revealed a role for DNA methylation in establishing τ after-effects of extended T-cycle entrainment, the potential association between τ and α after-effects provides a promising biochemical mechanism for both changes (Azzi et al., 2014). The linkage between the 2 types of after-effects, however, has not yet been sufficiently interrogated. The discordance between the SCN after-effects of T cycle and photoperiod offers a hint that the relationship may not be so simple. Here, we seek to further examine the alignment of T cycle and photoperiodic after-effects by measuring in vivo (α, τ, and ψ of locomotor behavior rhythms) and ex vivo (σφ, τ, and ψ of SCN gene expression rhythms) responses following exposure to 6 combinations of photoperiod length and T cycle. We find that after-effects in each of these rhythm characteristics respond to the 6 different light cycles in distinct patterns, suggesting that they are each induced by different aspects of the input light cycle. Using skeleton photoperiods, we demonstrate that parametric versus nonparametric responses differ between after-effects in α, τ, and ψ, further indicating encoding of distinct components of light input by each of these characteristics. Examining the rhythms of explanted SCN ex vivo following entrainment to these light schedules, we find that the pattern of SCN σφ reflects that of α in vivo, providing additional correlative evidence that SCN σφ may be a determining factor in setting α.
Materials and Methods
Animals
Animal experiments were conducted in accordance with Vanderbilt University Institutional Animal Care and Use Committee regulations. All animals used for behavioral experiments were heterozygous for the Per2∷Luciferase allele (Per2∷Luciferase+/-) or were Per2 wild-type (Per2∷Luciferase-/-). All animals used for SCN slice culture experiments were heterozygous for the Per2∷Luciferase allele (Per2∷Luciferase+/-).
Activity Monitoring and Housing
Animals were singly housed in light-tight boxes with activity monitoring by wheel revolutions detected by ClockLab acquisition software (Actimetrics, Inc., Wilmette, IL). Complete photoperiods used were 15:8 and 16:7 (T23 long, ~67% duty cycle), 8:15 and 7:16 (T23 short, ~33% duty cycle), 16:8 (T24 long, ~67% cycle), 8:16 (T24 short, ~33% cycle), 17:9 (T26 long, ~67% cycle), and 9:17 (T26 short, ~33% cycle). Animal numbers by group were as follows: 15:8 (in vivo n = 5, ex vivo n = 4), 16:7 (5, 2), 8:15 (6, 4), 7:16 (2, 0), 16:8 (12, 6), 8:16 (12, 8), 17:9 (6, 7), 9:17 (14,6). The 2 photoperiod duty cycles used in T23 (15:8/8:15 vs. 16:7/7:16) gave similar results and were combined into T23 long and T23 short groups for analysis.
Animals were transferred to the specified light schedule after at least 3 weeks of age and housed there for at least 28 days before transfer to DD or brain extraction for slicing. Six T26 short animals included in the data sets (3 used in behavioral experiments, 3 used in slice experiments) experienced a multihour light failure during the 28 days of entrainment but received 14 days of the correct light cycle following the failure.
Skeleton photoperiods were set up by housing animals in 12:12 LD complete photoperiods for approximately 5 days before transitioning to a 12:12 skeleton (1:10:1:12 L:D:L:D). After several cycles on this skeleton, the onset pulse was gradually advanced (0.5-1 h per day) or delayed (1 h per day) until a skeleton long (1:14:1:8 L:D:L:D) or skeleton short (1:6:1:16 L:D:L:D) photoperiod, respectively, was established. Once the final skeleton was established, animals were given 28 days of exposure to that skeleton until transfer to DD or slicing. Animal numbers by group were as follows: skeleton short (in vivo n = 6, ex vivo n = 5), skeleton long (n = 7, n = 6).
Actogram Analysis
Locomotor behavior was analyzed using ClockLab Analysis software and R. Period was determined using the chi-square periodogram over the first 7 days of DD. α was measured using automated onset/offset detection for each cycle of the actogram. Full actograms can be found in Supplemental Data 1.
Automated α Measurement
Automated α measurement was performed in R. The activity (bin size 6 min) is smoothed by a Savitzky-Golay filter with a span of 25 and degree of 3. A threshold is set relative to the maximum smoothed activity (0.01 * the maximum for each day). Points at which the smoothed activity crosses this threshold are identified as potential onsets and offsets. Segments of activity less than 2 h are considered inactive. The longest inactive segment is identified, with the start of that segment recorded as the offset and the end of that segment recorded as the onset. α is calculated as activity offset – onset, and ψ as the timing of the activity onset in the first cycle in DD relative to the projected time of lights-off from the previous light dark cycle (projected Zeitgeber Time 12 [ZT12]). Identified onsets and offsets for each cycle can be found in Supplemental Data 2. R scripts used for analysis can be found at https://dx.doi.org/10.6084/m9.figshare.11513892.
Slicing and Slice Cultures
Within 4 h of lights-off, animals were sacrificed by cervical dislocation and the brain removed. SCN slices of 200 µm were made, and the SCN was further isolated by scalpel cut under a dissecting microscope. Slices were transferred to a 6-well plate with cell culture membrane insert (PICMORG50, Millipore, Burlington, MA) and 1.2 mL of slice culture media. Slice chambers were sealed with a coverslip and vacuum grease and placed into an incubated light-tight inverted microscope (Zeiss Axioskop). Luminescence was detected using an intensified charge-coupled device (Stanford Photonics, Stanford, CA) controlled by µ-Manager recorded for 2 min every 10 min for at least 1 week.
Ex Vivo Analyses
Luminescence recordings were analyzed using Fiji and R. OME-TIFF files from µ-Manager were opened in Fiji and smoothed using a 2-frame minimization (frame rate reduction from 6/h to 3/h). A 102 × 102 grid of 10 × 10-pixel (5.175 × 5.175 µm) regions of interest (ROIs) was overlaid on the images and brightness measured for each of these 10,404 ROIs measured for every frame. These grid measurements were then exported to R for further analysis. The first 8 h of recording were excluded from peak finding to prevent slicing artifacts from interfering with measurements. First, the ROIs comprising the SCN were identified by using pixels within the top 50% of brightness. The timing of each peak of luminescence was then detected for each ROI and used to calculate the initial phase. Distribution measurements were made by median absolute deviation across all SCN ROIs. Phase maps of each SCN used can be found in Supplemental Data 3. R scripts used for analysis can be found at https://dx.doi.org/10.6084/m9.figshare.11513892. Cycle-by-cycle interpeak-calculated period and phase distribution are shown in Supplementary Figures S1 and S2, respectively.
Statistical Analysis
For measurements of α, τ, σφ, and ψ, the effects of photoperiod and T cycle (or completeness and onset/offset interval) were analyzed by 2-way analysis of variance (ANOVA). For each comparison, the p value and percentage of total variation of each factor, as well as their interaction, are reported. Where indicated in the text, Sidak’s multiple comparisons test was used to further examine within- and between-factor effects. For correlation analysis, Pearson’s r test was used.
Results
Distinct Response Patterns of ψ and After-effects on α and τ
To examine the persistent encoding of photoperiods and T cycles in vivo, as represented by entrained phase angle (ψ) and after-effects in activity duration (α) and free-running period (τ), we exposed mice to 6 different light schedules consisting of combinations of short or long photoperiod and short, standard, and long T cycles (T23 long, T23 short, T24 long, T24 short, T26 long, T26 short). After 14 to 28 days of exposure to these light schedules (see the Methods section), animals were transferred into constant darkness (DD) for 7 days. Based on previous studies examining the after-effects of T cycles (Azzi et al., 2014, 2017; Pittendrigh and Daan, 1976a; Schwartz et al., 2011) and photoperiod (Buijink et al., 2016; Ciarleglio et al., 2009; Evans et al., 2013; Pittendrigh and Daan, 1976a), we hypothesized that the response of τ and α after-effects to these 6 light schedules would produce 1 of 3 general patterns (Fig. 1).
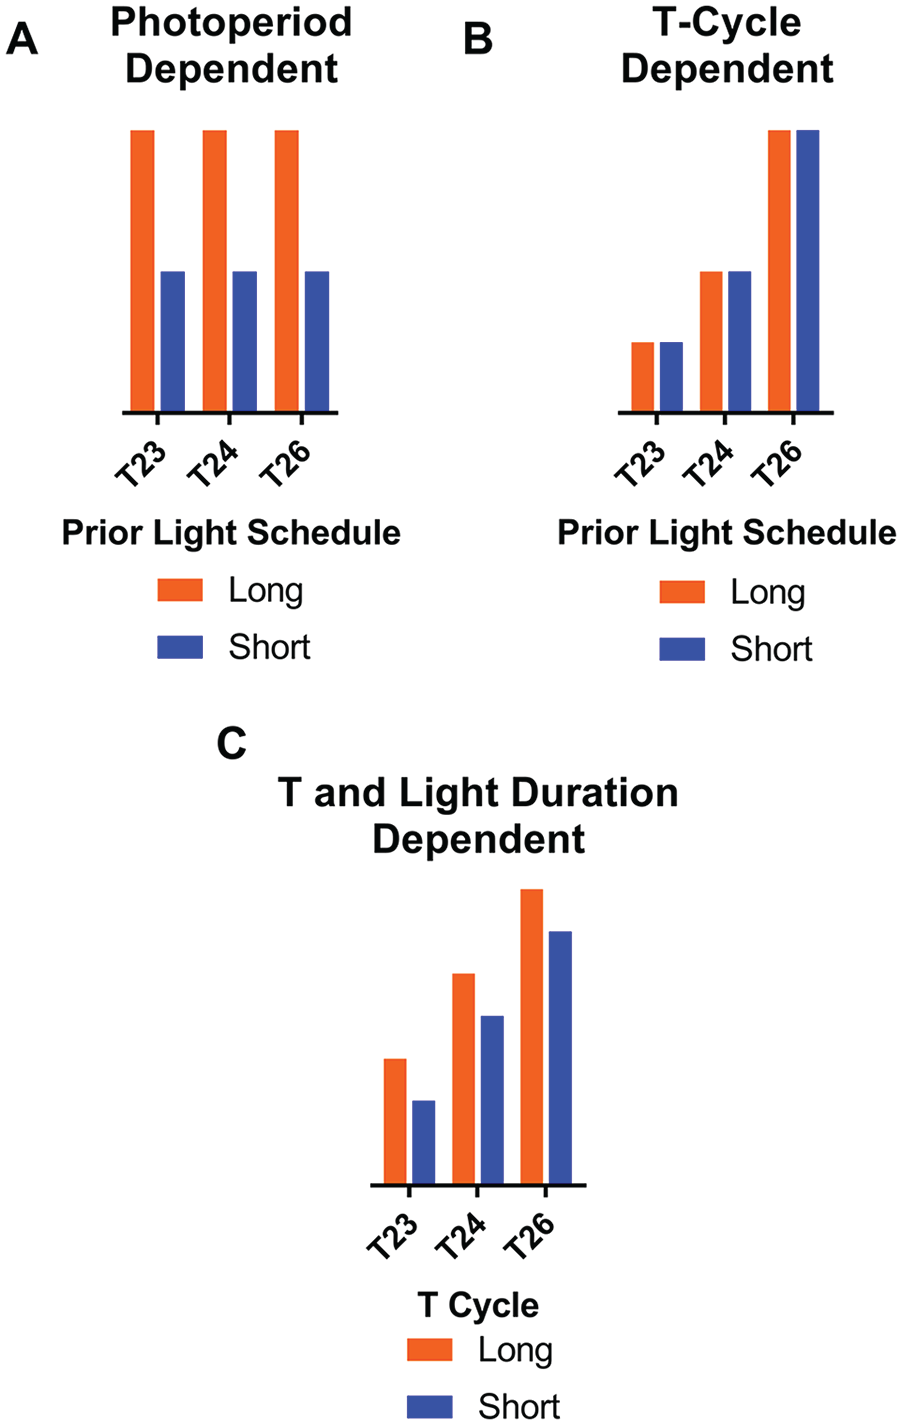
Schematic of possible patterns of measurements across T23 L/S, T24 L/S, and T26 L/S. (A) A T-cycle–dependent response in which the measurement is graded depending on the T cycle and the photoperiod within the T-cycle has negligible effects. (B) A photoperiod-dependent response in which light duty cycle dictates the measurement regardless of T cycle. (C) A combination of photoperiod and T-cycle influences, with each of the 6 combinations having a characteristic measurement level. Note that in all examples, the polarity of the measurement change is arbitrary (e.g., T-cycle response in [A] can increase or decrease with T cycle, photoperiod response in [B] can have either long or short measure higher). These patterns are illustrations of individual and combined main effects; possible interaction effects are not shown.
First, if after-effects in these rhythm characteristics were strictly dependent on the duty cycle of the light interval, then the groups would segregate into 2 levels, corresponding to long or short photoperiods, regardless of T cycle (Fig. 1A). A primary influence of the photoperiod could indicate a parametric effect of the total light duration per cycle and/or a nonparametric effect from the phase shifts caused by light onset and light offset. Second, if plasticity is strictly dependent on net daily phase advances or delays driven by entrainment to the T cycles, then the measurements would segregate into 3 groups based on T cycle (Fig. 1B). This pattern of results would most readily suggest that after-effects were induced by nonparametric effects of the daily entraining phase shifts induced by the T cycles. Third, significant main effects of both T cycle and photoperiod would result in after-effects, with each of the 6 groups having a characteristic level (Fig. 1C), whereas interactions between T cycles and photoperiod would produce many possible variations of the pattern in Figure 1C.
Indeed, ψ of locomotor rhythms relative to the projected ZT12 of the previous light:dark cycle (see the Methods section) was strongly influenced by both T-cycle length and photoperiod length, with a significant interaction between these 2 main effects (Fig. 2B). As T-cycle length increases, ψ becomes more advanced. Within each T cycle, the short photoperiod version produces a more delayed ψ than its long photoperiod counterpart, but the difference between the 2 photoperiods decreases as T-cycle length increases. This pattern resembled the example in Figure 1C, with the interaction providing an additional layer of complexity. In contrast to the multifaceted inputs to ψ, we found that photoperiod was the sole significant influence on α, with persistently reduced α in DD following long photoperiods compared with short photoperiods across all 3 T cycles (Fig. 2C). This pattern most closely resembled the example in Figure 1A and suggested that a parametric effect of the duration of light per cycle and/or a nonparametric effect of the phase shifts caused at light onset and offset induced the after-effect in α. After-effects on locomotor τ were significantly influenced by both T-cycle length and photoperiod (Fig. 2D), but unlike ψ, there was no detectable interaction between the main effects. Within each T cycle, the long photoperiod group had consistently shorter τ compared with its partner short photoperiod. Across T cycles, however, there was a direct relationship with τ, with τ increasing along with T-cycle length regardless of photoperiod. This pattern most closely resembles the example in Figure 1C.
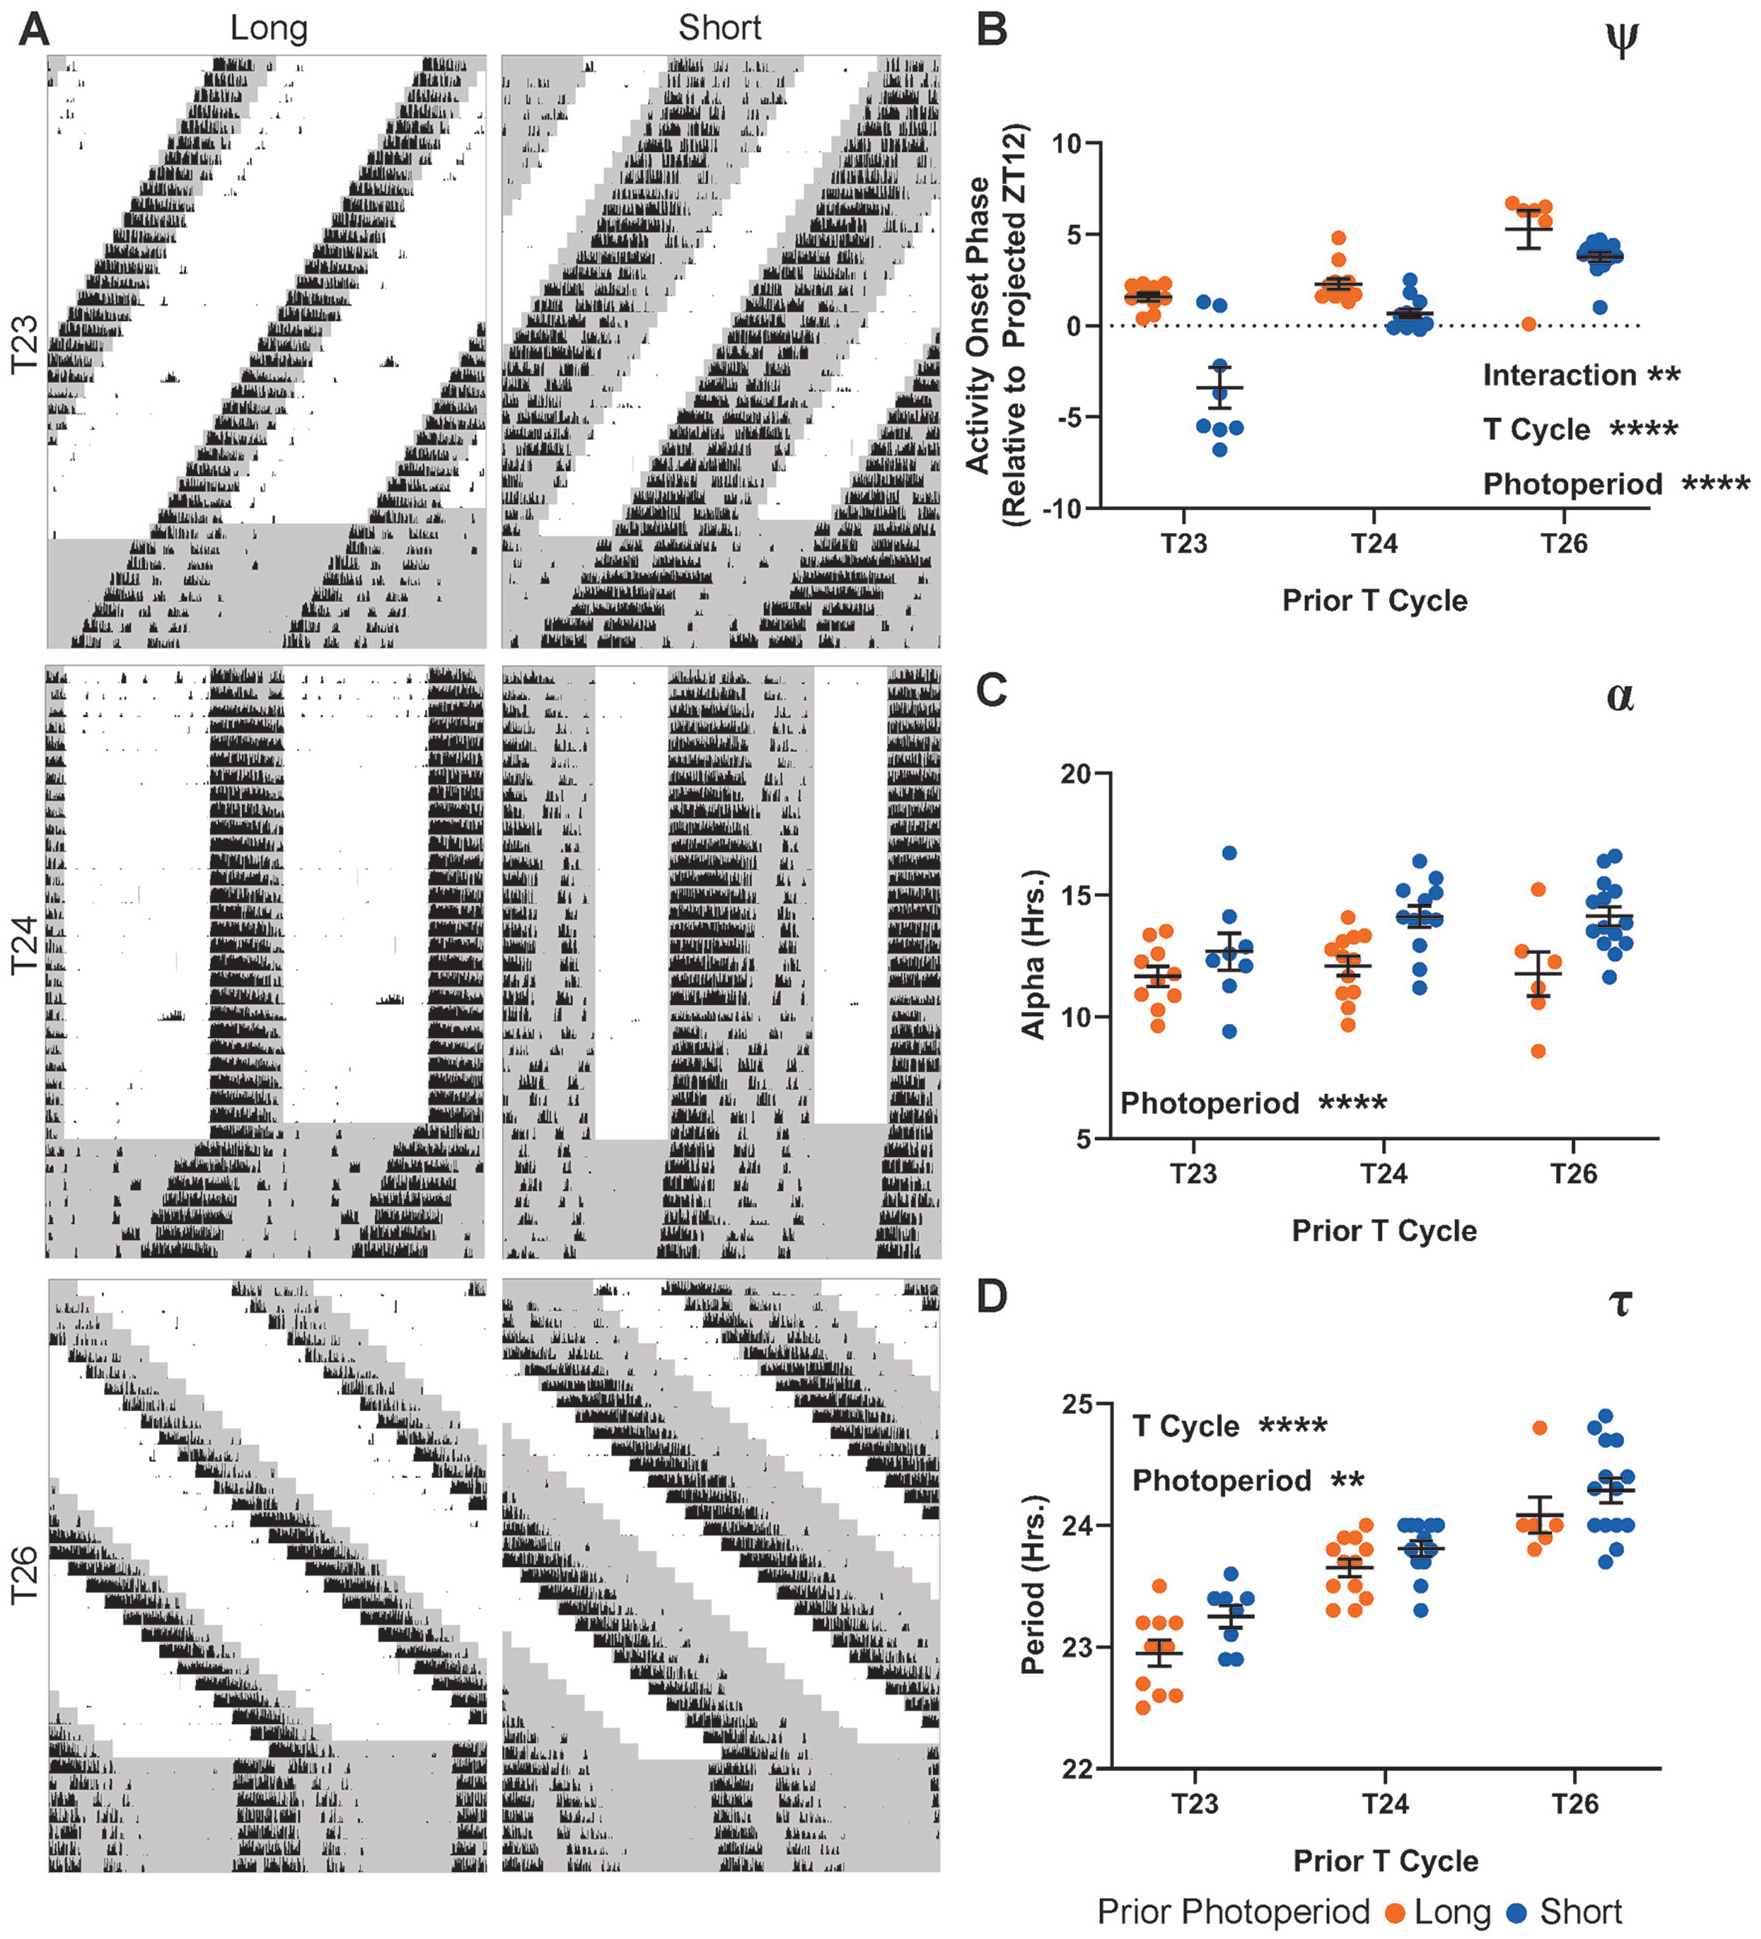
Behavioral after-effects of 6 photoperiod/T-cycle combinations. (
To further examine the relationship between the α and τ after-effects, we plotted the 2 measurements against one another (Fig. 3). The 2 factors correlated significantly in 2 specific cases: T23 long (Fig. 3, top left) and T26 short (Fig. 3, bottom right). These 2 photoperiod/T-cycle combinations represent the instances in which, in previous reports, T cycle and photoperiod independently produce similar in vivo after-effects on α and τ, with long photoperiod or short T decreasing α and τ and short photoperiod or long T increasing α and τ. Interestingly, there was a lack of correlation of these measures in T-cycle/photoperiod combinations, where the predicted after-effects of the cycle τ and photoperiod would be in nominal conflict (long photoperiod and long T, and short photoperiod and short T; Azzi et al., 2014; Pittendrigh and Daan, 1976a).
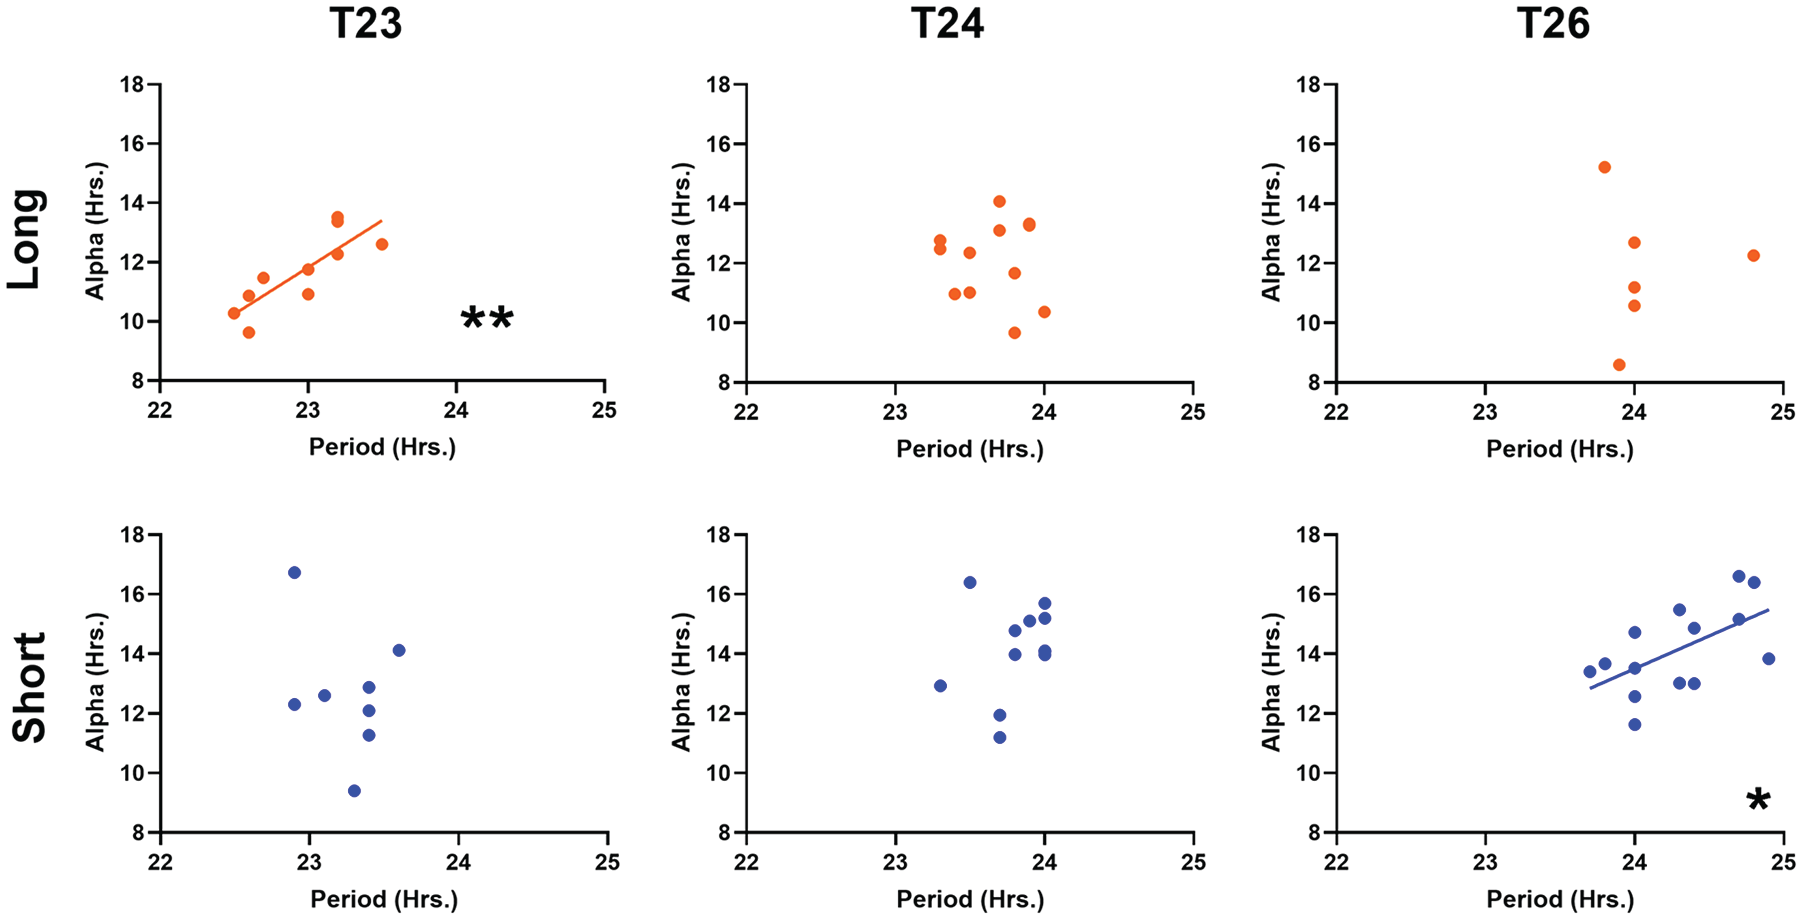
Within-individual correlations between τ and α after-effects following the given T-cycle/photoperiod combination. T23 long 0.8238 (p = 0.0034**), T24 long −0.06835 (p = 0.8328, ns), T26 long 0.004966 (p = 0.9926, ns), T23 short −0.3147 (p = 0.4477, ns), T24 short 0.2671 (p = 0.4013, ns), T26 short 0.5818 (p = 0.0291*). Values reported are Pearson r and p values (****p < 0.0001, ***p < 0.001, **p < 0.01, *p < 0.05).
ψ and α After-effects Differ in their Parametric versus Nonparametric Responses
The after-effects described in Figure 2 for all parameters showed significant main effects of photoperiod, revealing that either the interval between light transitions or the light duration is inducing persistent effects on ψ, α, and τ. To determine whether the critical aspect of the light cycle is the timing of the light/dark and dark/light transitions or the duration of light within each cycle, we used skeleton photoperiods consisting of two 1-h pulses of light, separated by intervals of darkness, that mimic the timing of the light/dark transitions on full photoperiods of 16:8 and 8:16 (Fig. 4A). Skeleton photoperiods have been used to assess the mechanism of entrainment through seasonal changes in ψ (Pittendrigh and Minis, 1964) as well as to determine the proximal effect on locomotor behavior duration (Pittendrigh and Daan, 1976a, 1976b). To determine whether skeleton photoperiods can induce plasticity in α, τ, and ψ, we assessed after-effects in locomotor behavioral rhythms in DD following 28 days of exposure to skeleton long or short photoperiods in comparison with similar entrainment to full 16:8 and 8:16 photoperiods.
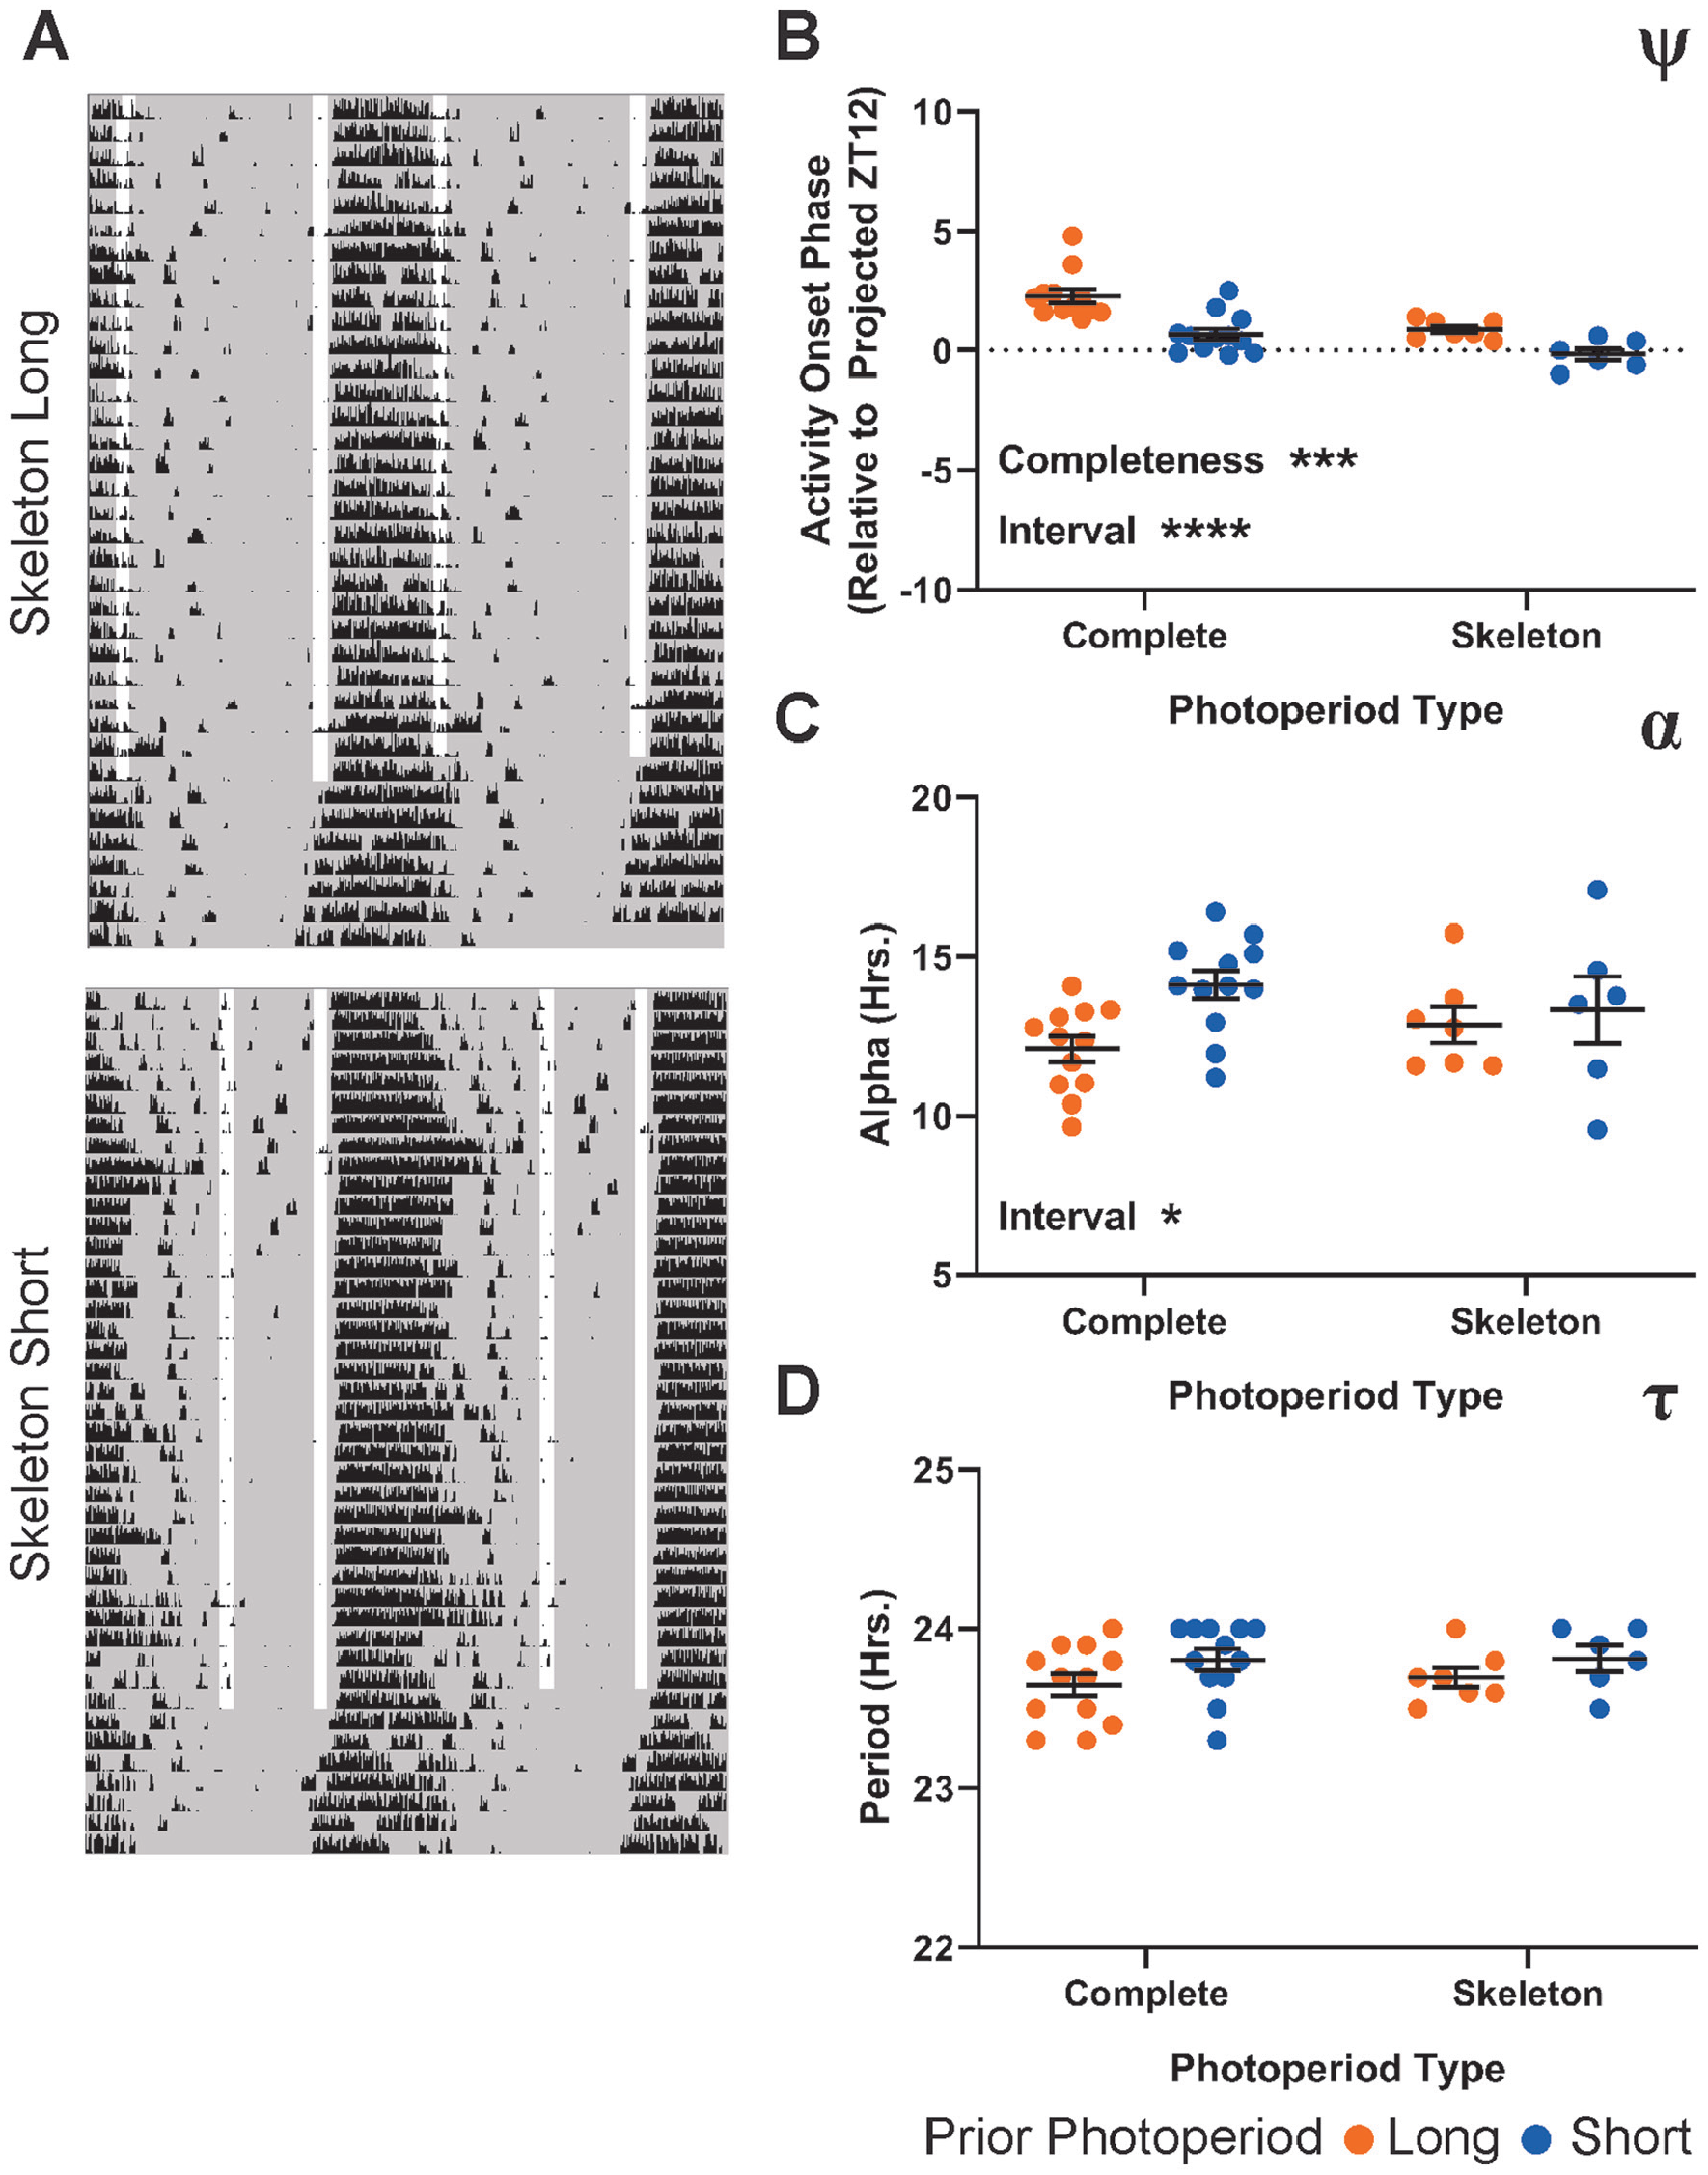
Behavioral after-effects following exposure to skeleton long and short photoperiods compared with T24 complete long and short photoperiods. (
ψ exhibited main effects of both the duration of light in complete photoperiods (completeness, Fig. 4B), and the timing of light transitions in skeleton photoperiods (interval, Fig. 4B). The significant effect of the light duration of complete photoperiods indicates that there is a parametric influence on the ψ of locomotor behavioral rhythms, in addition to the nonparametric main effect of the interval between light transitions on skeleton photoperiods. In contrast, we found a significant main effect only of the onset-offset interval of skeleton photoperiods on α after-effects, suggesting that this effect is primarily nonparametric (Fig. 4C). We found that the complete and skeleton photoperiods had no significant after-effect on τ (Fig. 4D); however, previous investigators have reported τ after-effects of complete and skeleton photoperiods (Pittendrigh and Daan, 1976a). Thus, we found that there are significant parametric and nonparametric effects on ψ, nonparametric effects of onset-offset interval on α, and non-ignificant after-effects on behavioral τ of both complete and skeleton photoperiods.
Ex Vivo SCN After-effects
Using ex vivo imaging of PER2∷LUCIFERASE (PER2∷LUC) rhythms following entrainment to the same 6 light schedules described above, we investigated the effects of photoperiod and T cycles on plasticity of the SCN pacemaker. We housed heterozygous PER2∷LUC animals in identical conditions to our complete photoperiod in vivo experiments, including running wheels, and collected SCN slices from the animals after 14 to 28 days of exposure to each of the light schedules described above. Slices were collected within 4 h of lights-off, maintained in organotypic culture, and PER2∷LUC luminescence recorded ex vivo for 5 to 7 days (see the Methods section). Slice recordings were analyzed by detecting peak PER2∷LUC expression in each of a 102 × 102 grid of subcellular (~5 × 5 µm) ROIs spread across the entire SCN image. These PER2∷LUC peak times were then used to calculate and map σφ (Fig. 5A), whereas the average PER2∷LUC luminescence profile over time was used to calculate SCN τ.
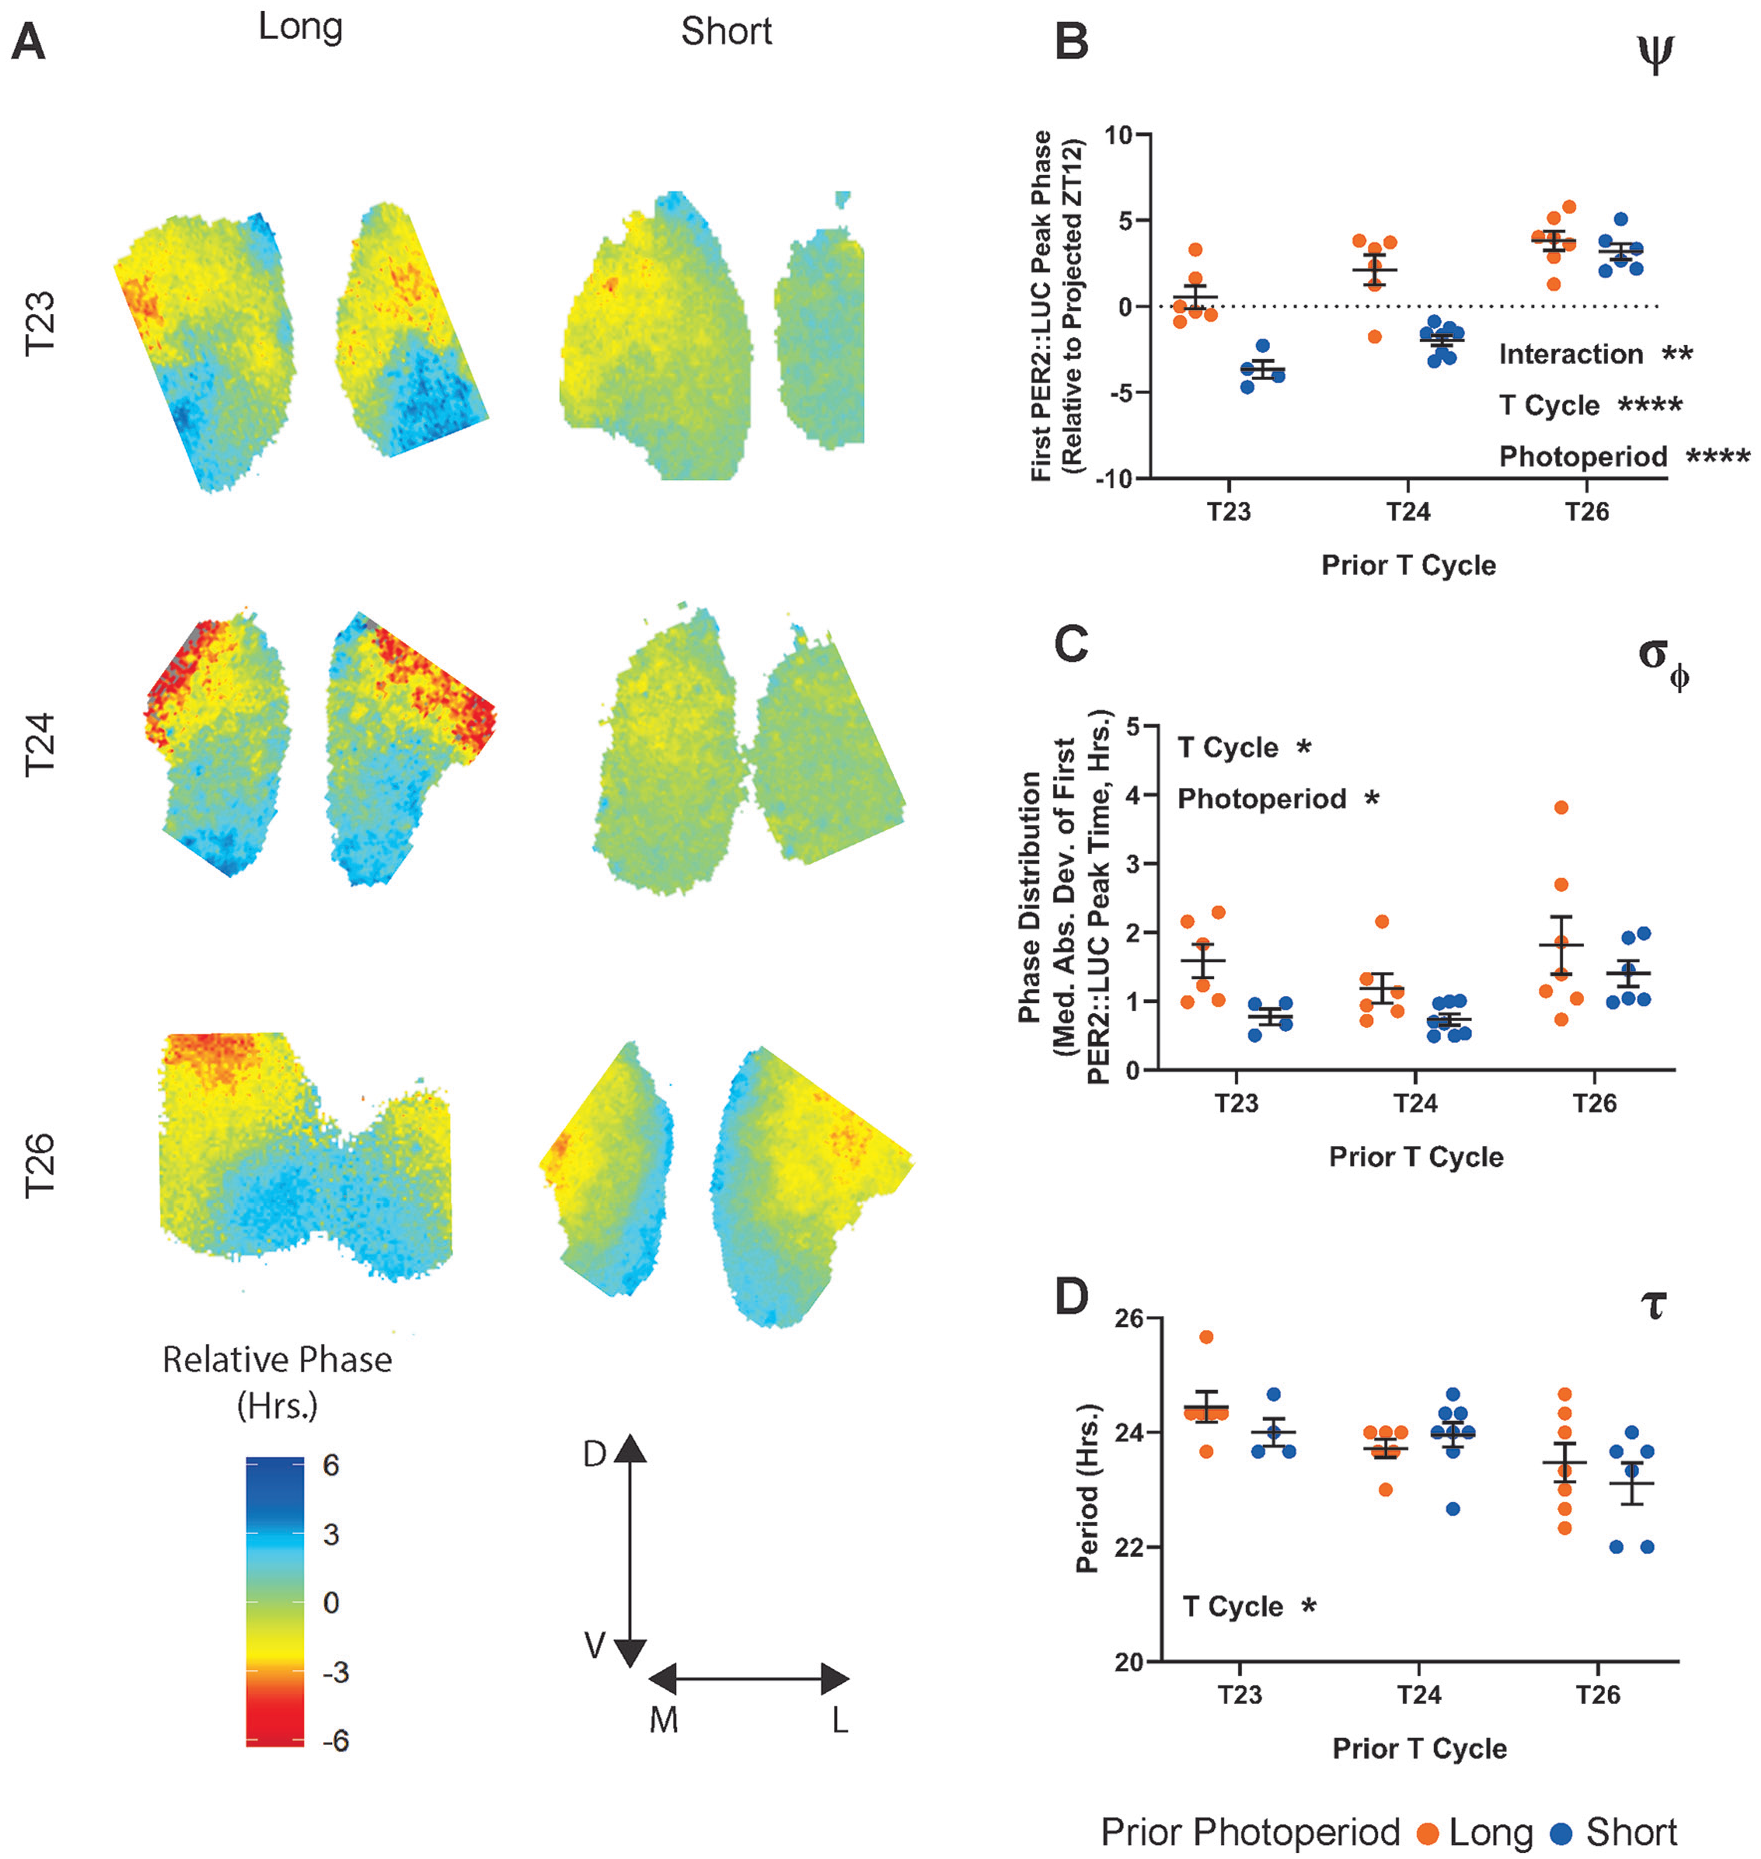
PER2∷LUC after-effects following exposure to 6 photoperiod/T cycle combinations. (A) Representative relative phase maps from long (left column) and short (right column) photoperiods combined with T23 (top row), T24 (middle row), or T26 (bottom row). (B) ψ of the PER2∷LUC rhythm following entrainment to the specified T cycle/photoperiod combination. Values represent the time of the first PER2∷LUC peak relative to the projected lights-off for the first cultured cycle (projected ZT 12). Interaction p = 0.0052 (8.185%), T cycle length p < 0.0001 (49.47%), photoperiod length p < 0.0001 (24.94%). (C) σφ (median absolute deviation of PER2∷LUC peak times) across SCN slices from animals entrained to each of the specified light schedules. Interaction p = 0.7168 (1.433%), T cycle length p = 0.0353 (15.89%), photoperiod length p = 0.0114 (15.42%). (D) τ of the PER2∷LUC rhythm over 5 cycles ex vivo. Interaction p = 0.4104 (4.109%), T cycle length p = 0.0111 (23.40%), photoperiod length p = 0.4151 (1.529%). Two-way analysis of variance results represent p value and percentage variation (****p < 0.0001, ***p < 0.001, **p < 0.01, *p < 0.05). T23 long, n = 6; T23 short, n = 4; T24 long, n = 6; T24 short, n = 8; T26 long, n = 7; T26 short, n = 6. T23 long is composed of a combination of 2 similar LD ratios (see the Methods section).
Similar to the ψ of locomotor rhythms, we found that the ψ of SCN PER2∷LUC rhythms (relative to projected ZT12 of the previous light cycle) was significantly influenced by both T cycle and photoperiod, with a significant interaction between the 2 factors (Fig. 5B). As T-cycle length increases, SCN ψ also becomes more advanced, and within each T cycle, the long photoperiod is more advanced than the short. Again, like the in vivo ψ, the ex vivo ψ featured a narrowing difference between long and short as T-cycle length increases. Similarly, mirroring in vivo α, we found that the photoperiod modulated the degree of synchrony of PER2::LUC rhythms within explanted SCN (σφ; Fig. 5C), with increased phase dispersion in long photoperiods compared with short. However, we also found a significant main effect of T-cycle length on the SCN σφ after-effect. This effect was driven by increased σφ in both T26 groups compared with both T24 groups (post hoc multiple comparisons test between T-cycle lengths, T24 vs. T26 adjusted p = 0.0329). There is no single consistent linear effect of T cycle on the ex vivo σφ after-effect. As such, the pattern most resembled that of the example in Supplemental Figure S2A but with the T26 groups elevated.
SCN τ after-effects following T-cycle entrainment have been a source of significant interest in part because of the apparent disconnect between after-effects of T cycle (where ex vivo SCN and behavioral measurements negatively correlate) and of photoperiod (where ex vivo SCN and behavioral measurements agree). In our combined T-cycle/photoperiod paradigm, we found a significant negative relationship between T-cycle length and SCN τ length. Entrainment to short T cycles in vivo resulted in lengthened SCN τ ex vivo and vice versa as previously reported (Aton et al., 2004; Azzi et al., 2017; Molyneux et al., 2008). Visually, there is an intriguing reversal in trend direction of possible photoperiod effects between T24 and the 2 non-24 T cycles that could indicate an interaction. In T24 cycles, the previously reported trend between long and short photoperiod (shortened, behavior-like τ after-effect for long photoperiod) is present, whereas in T23 and T26 cycles, the trend between long and short is inverted. This relationship results in the longest and shortest τ aligning with T23 long and T26 short, the same 2 groups highlighted above (Fig. 3) as overlap groups, in which the effects of T cycle and photoperiod are in line with one another. However, no significant photoperiod effects or interactions were revealed by the ANOVA or by multiple post hoc tests for differences within the T-cycle groups. Thus, these visual trends require further testing.
Ex Vivo SCN After-effects Have Characteristics Similar to Behavioral After-effects
To investigate the relative influence of parametric versus nonparametric inputs on SCN after-effects ex vivo, we collected slices from animals entrained to skeleton long and short photoperiods (Fig. 6A). Similar to the in vivo ψ of the behavioral rhythm to skeleton photoperiods, there was a significant effect of skeleton onset-offset interval on the ψ of the PER2∷LUC rhythm (Fig. 6B). Unlike in vivo, the PER2∷LUC ψ did not have a significant effect of photoperiod completeness, although there was a trend toward a decrease in the difference in ψ between long and short versions of skeleton photoperiods compared with the complete photoperiods. The σφ after-effect was significantly influenced by the onset-offset interval (Fig. 6C), similar to in vivo. The δφ after-effect ex vivo was also significantly influenced by photoperiod completeness. However, the mean difference in SCN σφ between the long and short versions of the skeleton photoperiods was larger compared with that of the complete photoperiods. Although the interaction that this implies was not statistically significant, it does suggest that the skeleton interval is a principal driver of σφ after-effects, similar to in vivo α (Fig. 4C). As with behavioral τ after-effects, we found no significant effect of onset-offset interval or photoperiod completeness on the ex vivo τ after-effect, again suggesting that the effects of photoperiod on τ after-effects are modest compared with T-cycle entrainment.
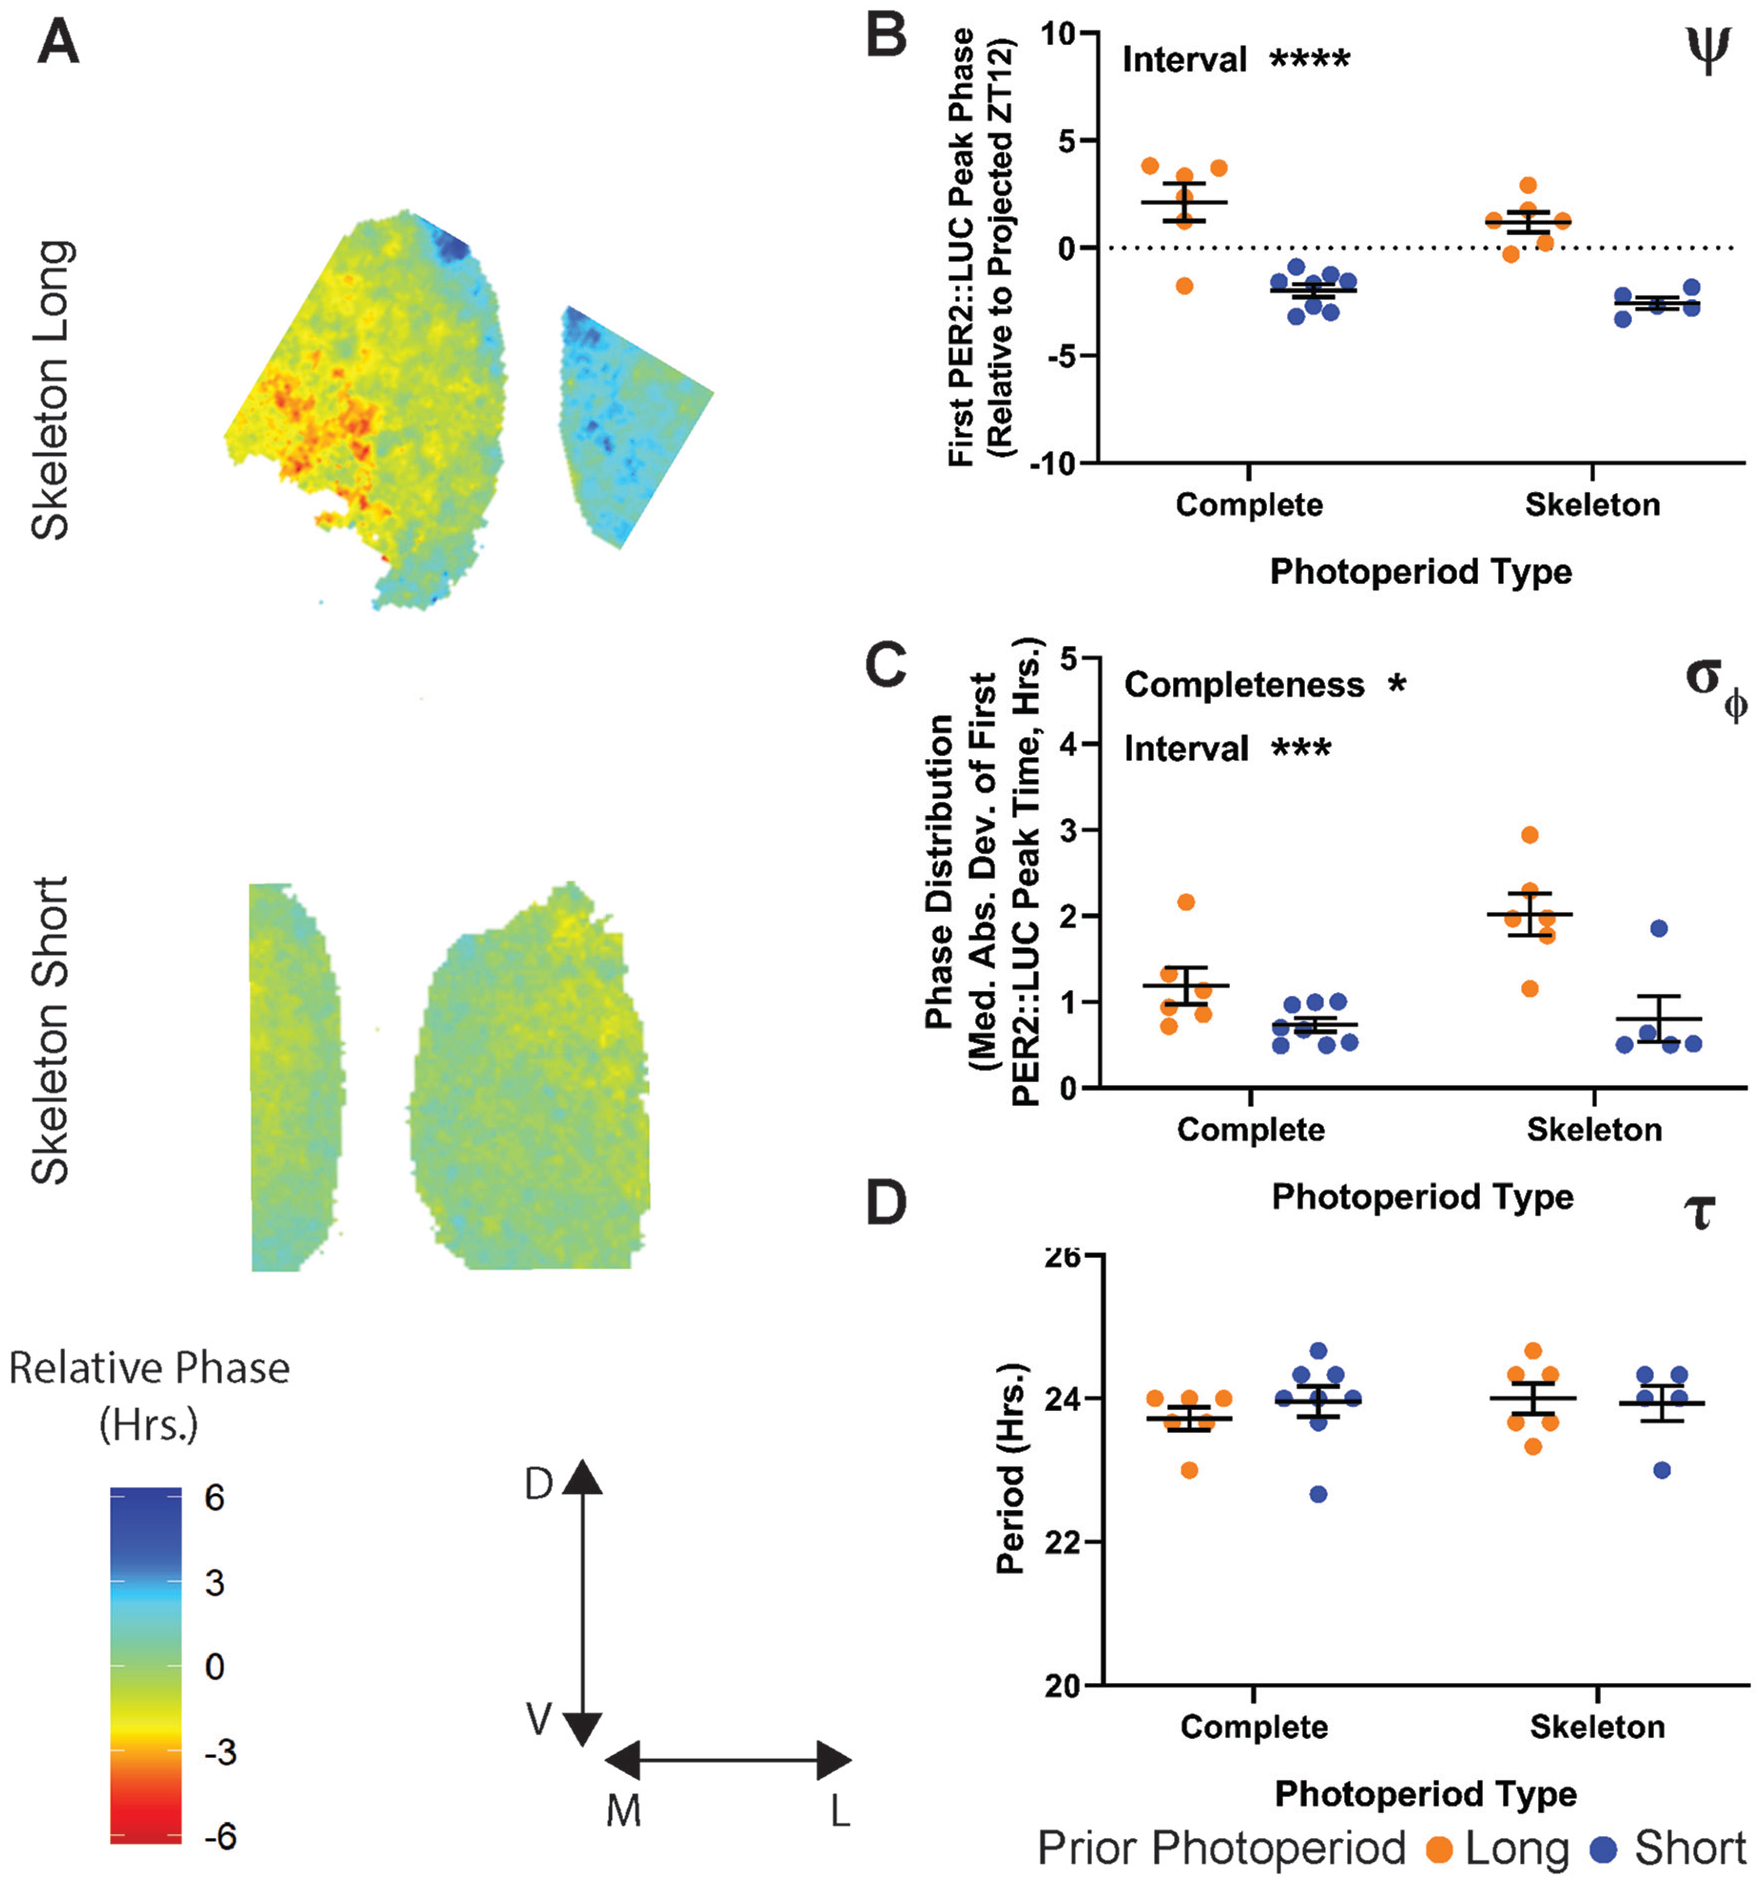
PER2∷LUC after-effects following entrainment to skeleton long and short photoperiods compared with T24 complete long and short photoperiods. (A) Representative relative phase maps from skeleton long (top) and short (bottom) photoperiod. (B) ψ of the PER2∷LUC rhythm following entrainment to skeleton long and short photoperiods. Values represent the time of the first PER2∷LUC peak relative to the projected lights-off for the first cultured cycle (projected ZT 12). Interaction p = 0.7514 (0.1326%), completeness p = 0.1660 (2.651%), onset-offset interval p < 0.0001 (70.79%). (C) σφ (median absolute deviation of PER2∷LUC peak times) across SCN slices from animals entrained to skeleton long and short photoperiod. Interaction p = 0.0654 (7.695%), completeness p = 0.0318 (10.77%), onset-offset interval p = 0.0003 (37.26%). (D) τ of the PER2∷LUC rhythm over 5 cycles ex vivo. Interaction p = 0.4867 (2.277%), completeness p = 0.5608 (1.587%), onset-offset interval p = 0.6959 (0.7131%). Long and short complete photoperiod values in (B-D) are replotted from Figure 5. Two-way analysis of variance results represent the p value and percentage variation (****p < 0.0001, ***p < 0.001, **p < 0.01, *p < 0.05). Complete long, n = 6; complete short, n = 8; skeleton long, n = 6; skeleton short, n = 5.
Discussion
Measurements in constant conditions reveal properties of the SCN and downstream circadian outputs free of light input, and as such, the study of after-effects is one means of understanding the plasticity of the SCN in response to seasonal light conditions. Understanding after-effects is also useful per se, as the encoding of light information within the SCN allows seasonal circadian properties to remain stable across ephemeral changes in the environment. Organisms in the wild experience fluctuations in light exposure during the annual photoperiodic cycle because of weather, nesting, hibernation, and other factors. Stable but flexible encoding of seasonal light inputs within the circadian system would allow for consistency across these light exposure fluctuations.
To improve our understanding of how after-effects are induced, we examined the relative influences of T-cycle length, photoperiod, and onset-offset interval on in vivo (α, τ) and ex vivo (σφ, τ) after-effects as well as on ψ (both in vivo and ex vivo). Using 8 light-cycle input groups, including 6 T-cycle/photoperiod combinations and 2 skeleton photoperiods, we tested which specific components of light-cycle input (light duration, onset-offset interval, repeated phase shifts) are encoded by the SCN in a persistent manner by measuring after-effects in circadian behavior and in SCN rhythms assayed ex vivo.
Comparison of In Vivo and Ex Vivo Responses
We found that ψ is strongly influenced by T cycle and photoperiod length, both in vivo (Fig. 2B) and ex vivo (Fig. 5B), with a significant interaction between T cycles and photoperiod in setting subsequent ψ in both cases. Using T24 skeleton photoperiods to assess the influence of nonparametric (light onset-offset interval) and parametric (light interval completeness) input, we found that both input types significantly influence ψ in vivo (Fig. 4B) while observing significant influences of nonparametric input and a trend toward an influence of parametric input ex vivo (Fig. 6B). Determination of ψ has long been considered to be nonparametric, with the exception of the continuity of light on full light cycles disambiguating onset from offset on near symmetrical light cycles (e.g., near T24 12:12; Pittendrigh and Minis, 1964). However, our results suggest a more complex picture akin to the circadian surface entrainment model of Roenneberg for Neurospora (Rémi et al., 2010; Roenneberg et al., 2010). Future experiments may provide further information about the parametric and nonparametric influences of T cycles and interval lengths through the use of skeleton photoperiods with non–24-h T cycles.
After-effects in α were strongly influenced by photoperiod length (Fig. 2C) in a nonparametric manner (Fig. 4C). This result was mirrored by the significant main effect of photoperiod on ex vivo SCN σφ (Fig. 5C), which was also primarily nonparametric (Fig. 6C). One notable difference between in vivo α and ex vivo SCN σφ, however, was the general increase in SCN σφ measured in both T26 photoperiods. The increase in the T26 short group may be related to the contracted σ observed in LD during entrainment to T26 long and short (Fig. 2A, bottom row): although the free-running α expands on the first day of DD, there is apparent negative masking occurring in the early active phase of these mice during LD. Because slices were made during the last LD cycle rather than on the first day of DD, the σφ could reflect that negatively masked pattern and imply that σφ is correlated with overt “net” α, rather than the underlying assumed endogenous active phase length.
We found that behavioral τ after-effects are significantly influenced by both T cycle and photoperiod length but that the T-cycle influence is of greater statistical significance and is the source of a greater percentage of the overall variation (Fig. 2D), suggesting that the T-cycle input to τ after-effects is more robust. Our results with T24 complete and skeleton photoperiods in vivo support this notion, as we did not observe significant τ after-effects with either complete or skeleton photoperiods (Fig. 4D). Previous studies have described τ after-effects of complete and skeleton photoperiods on behavioral τ in mice but with modest differences between the 2 skeleton photoperiod lengths (Pittendrigh and Daan, 1976a). Although locomotor τ after-effects reflected the length of the entraining T cycle, we observed negative correlations between the τ after-effects of ex vivo SCN and the length of the entraining T cycle, consistent with previous findings (Aton et al., 2004; Azzi et al., 2017; Molyneux et al., 2008). We did not detect any statistically significant modulation of the T cycle effects on τ by varying photoperiod, but visually, there are trend reversals in the expected direction of photoperiodic effects on τ in the non–24-h T-cycle groups that suggest the possibility of interactions that we did not detect statistically (T24 long vs. T23 long, p = 0.1513; T24 short vs. T26 short, p = 0.0584; Sidak’s multiple comparisons, see further discussion below).
Differences between T Cycle– and Photoperiod-Induced Responses
Because α and τ after-effects have been observed together (shorter α, shorter τ; longer α, longer τ), previous studies have attempted to explain both changes with a single underlying mechanism (Beersma et al., 2017; Gu et al., 2016). We observed different patterns of responses for after-effects in α and τ in photoperiod/T-cycle combinations (Fig. 2A, C, D) as well as in T24 photoperiods (Fig. 4A, C-D), and correlation of changes in α and τ were specific to certain T and photoperiod combinations (Fig. 3). When measuring the correspondence of τ and α after-effects in vivo, correlations were observed only in cases in which T cycle and photoperiod effects were expected to align (Fig. 3). These results suggest that while the 2 after-effects may frequently be observed together, their distinct patterning in response to particular T cycles and photoperiods could be driven by disparate but conditionally convergent mechanisms.
Changes in SCN σφ remain a likely explanation for alterations in downstream locomotor behavior duration, as an extended population-level high-firing phase of SCN neurons (for which the PER2::LUC σφ is a proxy here) would logically underlie the regulation of timing activity or inactivity (Ciarleglio et al., 2009, 2011; Inagaki et al., 2007; VanderLeest et al., 2007). Changes in τ, however, shown here to be induced primarily through T-cycle entrainment and likely the requisite repeated-phase shifts thereof, may be regulated in a different manner. Mechanisms suggested recently by other groups (Azzi et al., 2014, 2017) surrounding the epigenetic changes that may occur after extended entrainment to T cycles may help explain alterations in τ that we observed.
Regional Phase Differences and Their Influence on After-effects
Regional phase differences within the SCN network have been observed in response to T cycles and photoperiod and have been proposed to drive τ after-effects (Azzi et al., 2017; Buijink et al., 2016; Evans et al., 2013; Myung et al., 2015). In SCN explants from mice entrained to long photoperiods, the ventral or ventromedial region SCN phase leads in some studies (Buijink et al., 2016; Evans et al., 2013), but the reverse regional phase relationship was observed in another (Myung et al., 2015). SCN τ shortening after entrainment to long photoperiods was observed to correlate with ventral phase lead (Evans et al., 2013), with ventral phase lag (Myung et al., 2015), or not be present (Buijink et al., 2016). Similarly, Azzi et al. (2017) found that following entrainment to T cycles, there was an anticorrelation between SCN τ after-effect and the previous T cycle τ, as expected from previous results (Aton et al., 2004; Molyneux et al., 2008). The same study also found that shortened τ correlated with ventral phase lag, whereas lengthened τ correlated with ventral phase lead—the opposite pattern previously found for photoperiodic τ after-effects by the same group (Evans et al., 2013). Thus, there is no clear consensus in the literature as to whether SCN regional phase differences mediate τ after-effects.
We also observed the anticorrelation of ex vivo SCN τ after T cycle entrainment in vivo as well as a variety of regional σφ across our experimental conditions that included examples of ventral core phase lead in response to short T cycles (see T23 long in Fig. 6), similar to Azzi et al. (2017), and examples of more ventromedial phase clustering similar to that of Buijink et al. (2016) in response to long T cycles (see T26 short in Fig. 6). Differences in regional patterns (ventral core vs. ventromedial) may be explained by slice position on the rostral caudal axis of the SCN. Azzi et al. (2017) showed that taking sections more caudal in the SCN changes the regional phase pattern from ventral core grouping to a ventromedial grouping, similar to Buijink et al. (2016). We speculate that we may not have controlled well enough for slice depth, resulting in our observation of variations of both patterns in our data.
Conceptually, the anticorrelation of SCN ex vivo τ with in vivo τ after-effects of T cycles presents a challenge. One interpretation of these results is that the observed ex vivo τ reflects a deafferentation-induced reorganization of the SCN network, indicating that extra-SCN input is key to T cycle after-effects in vivo (Aton et al., 2004; Molyneux et al., 2008). Support for this view also comes from genetic studies showing an anticorrelation between in vivo behavioral and ex vivo SCN τ effects of genetic serotonergic deafferentation of the SCN (Ciarleglio et al., 2014) and lack of correlation of in vivo and ex vivo SCN period after-effects of genetic manipulations of SCN gene expression (Mieda et al., 2015, 2016). In addition, part of the confound regarding previous ex vivo SCN T-cycle after-effects appears to be a bias in the reporting of SCN regional rhythms by the standard PER2::LUC reporter that more highly weights τ of the dorsal region (Azzi et al., 2017). In any case, the lack of correspondence between in vivo and ex vivo T-cycle τ after-effects in the SCN makes it difficult to attribute ex vivo findings of regional patterns or mechanisms to the in vivo case, although the system can be used to study SCN ex vivo reorganization and its mechanisms (Azzi et al., 2017).
SCN σφ and Its Relationship with α
The degree of SCN neuron σφ is a characteristic attribute of photoperiodic encoding, as it represents a change in state of the SCN induced by the duration of the light interval of the daily cycle and is maintained after transfer to constant conditions (Buijink et al., 2016; Ciarleglio et al., 2011; Inagaki et al., 2007; VanderLeest et al., 2007). Our results suggest that the timing of light/dark transitions is a key factor in influencing SCN σφ (Fig. 6C) and in vivo α (Fig. 4C), although we also detected an effect of light duration on SCN σφ (Fig. 6C). The spread in the timing of neuronal rhythms allows for the daily duration of high firing activity of the SCN to be broadened or contracted without required alteration to the waveforms of individual SCN neurons, although this aspect is modulated by developmental inputs (Ciarleglio et al., 2011). As such, the degree of σφ within the SCN is a potential target for artificial SCN manipulation, driving neurons to adopt the σφ characteristic of a photoperiod, such as by pharmacologically, optogenetically, or chemogenetically extending the high firing phase, and would be expected to induce the behavioral α characteristic of that particular photoperiod, and perhaps other photoperiod-dependent responses, such as reproductive state and affective behaviors.
Because current methods for in vivo imaging are limited, the measure of α after-effects may be a useful proxy for inferring the waveform of the SCN. The integrity of this SCN waveform-α connection depends on the correlation between the two. Our findings that α and ex vivo SCN neuron σφ associate across multiple lighting conditions regardless of net daily phase shift do not address causality but strengthen the association between the 2 measurements. As the broadened electrical waveform of the SCN is associated with the compressed behavioral α seen in long photoperiods (and the contracted waveform with extended α in short photoperiods), the spread in phase of SCN neurons and the corresponding widening of overall firing that occurs as a result should account for the observed changes in α (Houben et al., 2009).
Changes to SCN network synchrony may have additional ramifications on the form of altered responses to light input, potentially explaining previously observed larger phase shifts after exposure to short days and smaller phase shifts after exposure to long days (Refinetti, 2002). The role of SCN neuron σφ in mediating those altered responses and altered τ has been explored computationally (Gu et al., 2016) and through altered GABA signaling (Farajnia et al., 2014). In their analysis of after-effects on τ, Pittendrigh and Daan (1976b) suggested that this change in circadian property may provide functional significance in terms of priming future responses to light, but it remains to be seen whether any of these after-effects constitutes an adaptive advantage or if they are simply a side effect of altered network synchrony.
Conclusion
Taken together, our results show that distinct components of light cycles can have distinct effects on the circadian system, with (1) the timing of light/dark transitions in photoperiods driving α plasticity, (2) combined photoperiod and T-cycle length driving plasticity in behavioral τ and ψ of both in vivo behaviors and ex vivo SCN gene expression, and (3) the light/dark transition interval and long T-cycle lengths affecting ex vivo SCN σφ. These results open the door to selective manipulation of circadian plasticity in α or τ for further experimentation and for potential translation to treat photoperiodic syndromes. The results shown here also demonstrate the utility of deconvolving overlapping types of input when studying complex processes within the SCN. Our results indicate that α and τ after-effects are possibly driven by distinct, although perhaps related, mechanisms, and such information can be incorporated into experimental and computational approaches to test the system in the future. With new techniques currently being established in our field to measure SCN neuronal firing rate, calcium signaling, and activity levels with high cellular specificity and extended time frame, there will be an improved ability to characterize the specific effect of photoperiodic influences on these circadian components.
Supplemental Material
supp_data_01_actograms – Supplemental material for Distinct Components of Photoperiodic Light Are Differentially Encoded by the Mammalian Circadian Clock
Supplemental material, supp_data_01_actograms for Distinct Components of Photoperiodic Light Are Differentially Encoded by the Mammalian Circadian Clock by Michael C. Tackenberg, Jacob J. Hughey and Douglas G. McMahon in Journal of Biological Rhythms
Supplemental Material
supp_data_02_alpha_marks – Supplemental material for Distinct Components of Photoperiodic Light Are Differentially Encoded by the Mammalian Circadian Clock
Supplemental material, supp_data_02_alpha_marks for Distinct Components of Photoperiodic Light Are Differentially Encoded by the Mammalian Circadian Clock by Michael C. Tackenberg, Jacob J. Hughey and Douglas G. McMahon in Journal of Biological Rhythms
Supplemental Material
supp_data_03_scn_heat_maps – Supplemental material for Distinct Components of Photoperiodic Light Are Differentially Encoded by the Mammalian Circadian Clock
Supplemental material, supp_data_03_scn_heat_maps for Distinct Components of Photoperiodic Light Are Differentially Encoded by the Mammalian Circadian Clock by Michael C. Tackenberg, Jacob J. Hughey and Douglas G. McMahon in Journal of Biological Rhythms
Supplemental Material
Supp_figures – Supplemental material for Distinct Components of Photoperiodic Light Are Differentially Encoded by the Mammalian Circadian Clock
Supplemental material, Supp_figures for Distinct Components of Photoperiodic Light Are Differentially Encoded by the Mammalian Circadian Clock by Michael C. Tackenberg, Jacob J. Hughey and Douglas G. McMahon in Journal of Biological Rhythms
Footnotes
Acknowledgements
The authors would like to thank Maria Luísa Jabbur, Carl Johnson, Terry Page, and Chloe Snider for their helpful comments and discussions. This work was supported by NIH R01 GM117650 to D.G.M., NIH F31 NS096813 to M.C.T., and NSF GRFP 0909667 to M.C.T.
Author Contributions
M.C.T. and D.G.M conceived the experiments. M.C.T. performed the experiments. M.C.T. and J.J.H. analyzed the data, M.C.T., J.J.H., and D.G.M. wrote the paper.
Conflict of Interest Statement
The authors have no potential conflicts of interest with respect to the research, authorship, and/or publication of this article.
Supplementary material is available for this article online.
References
Supplementary Material
Please find the following supplemental material available below.
For Open Access articles published under a Creative Commons License, all supplemental material carries the same license as the article it is associated with.
For non-Open Access articles published, all supplemental material carries a non-exclusive license, and permission requests for re-use of supplemental material or any part of supplemental material shall be sent directly to the copyright owner as specified in the copyright notice associated with the article.