
Abstract
Annual rhythms in humans have been described for a limited number of behavioral and physiological parameters. The aim of this study was to investigate time-of-year variations in late arrivals, sick leaves, dismissals from class (attendance), and grades (performance). Data were collected in Dutch high school students across 4 academic years (indicators of attendance in about 1700 students; grades in about 200 students). Absenteeism showed a seasonal variation, with a peak in winter, which was more strongly associated with photoperiod (number of hours of daylight) compared with other factors assessed (e.g., weather conditions). Grades also varied with time of year, albeit differently across the 4 years. The observed time-of-year variation in the number of sick leaves was in accordance with the literature on the seasonality of infectious diseases (e.g., influenza usually breaks out in winter). The winter peak in late arrivals was unexpected and requires more research. Our findings could be relevant for a seasonal adaptation of school schedules and working environments (e.g., later school and work hours in winter, especially at higher latitudes where seasonal differences in photoperiod are more pronounced).
Introduction
The temporal organization of most societies is complex and requires the arrangement of many different aspects, from school/work and transport schedules to the opening times of shops and recreational facilities. This complexity is aggravated by the conflict that often arises between biological (internal) time and social (external) time. A mismatch between internal and external time leads to chronic sleep deprivation and a condition called social jetlag (Wittmann et al., 2006). Minimizing social jetlag is important for health (Roenneberg and Merrow, 2016; Vetter, 2018). In addition, populations show a wide distribution of so-called early and late chronotypes, namely, individuals who sleep at different times (Roenneberg et al., 2007). To accommodate sleep and other individual needs, flexible working hours have been proposed as a possible solution (Costa et al., 2006).
So far, the vast majority of chronobiology research has focused on circadian (daily) time, but biological timing spans over different time scales, from tidal (12.4 h) to annual (365.25 days) rhythms. Describing the influence that these other biological cycles have on human behavior and physiology may be relevant for the temporal organization of society as well. For instance, school and working hours could be adjusted according to seasonal changes in biological timing.
Seasonal changes derive from the Earth’s moving around the Sun. The 23.4° tilt of the Earth relative to the incidence of light from the Sun results in pronounced changes in day length. Systematic changes in photoperiod and temperature lead to seasons, which are accordingly more pronounced at latitudes farther from the equator. Distinct behaviors are associated with the changes in the environment that occur with the progression of seasons, leading to elaboration of annual biological rhythms (Foster and Kreitzman, 2009).
In some animals, these biological rhythms are under the control of an endogenous clock (Monecke et al., 2014; Paul et al., 2008; Lincoln and Hazlerigg, 2010). The presence of a circannual clock in humans has not been proven. However, some parameters and behaviors have been shown to vary according to time of year. Annual birth rates and sudden (cardiac) deaths have been shown to follow a seasonal pattern (Roenneberg and Aschoff, 1990; Arntz et al., 2000). Sleep tends to be longer in winter than in summer, supporting the notion that humans recognize and use seasonal photoperiodic and temperature signals (Okamoto-Mizuno and Tsuzuki, 2010; O’Connell et al., 2014). This difference is greater in preindustrial versus modern societies (1 h vs. 20 min; Yetish et al., 2015), suggesting that exposition to climate-controlled living conditions decreases the amplitude of an annual rhythm (Roenneberg, 2004).
Mood and cognition also seem to vary with time of year. For instance, the occurrence of depressive episodes in people with seasonal affective disorder is significantly higher in winter (Rosenthal et al., 1984), and brain activation showed seasonal peaks and troughs that were shifted in phase depending on the specific cognitive task assessed (Meyer et al., 2016). Seasonal variation in infectious diseases, such as influenza, has also been described and its association with school attendance reported (Neuzil et al., 2002; Martinez, 2018; Aldridge et al., 2016).
A time-of-year variation in other indicators of school attendance (e.g., late arrivals) and performance (grades) has to our knowledge not been described so far. We collected data on school attendance and school performance across 4 consecutive school years (from 2013 to 2017). This allowed us to assess annual variations in school attendance and performance in a single population of students and to assess the influence of day length (photoperiod) and weather conditions. Our aim was to look at the time-of-year variation of behaviors at the population level, without implying the existence of an endogenous circannual clock regulating these changes. In addition, we were interested in possible effects of daylight saving time (DST) on school attendance. We predicted that absenteeism would peak in winter, because sick leaves are more likely to occur during the colder months, and because sleep timing, especially in late chronotypes (those who sleep late), is later in winter compared with summer (Allebrandt et al., 2014). In addition, we predicted grades would be lower in winter because of the negative effect of absenteeism on grades that has been previously described (Zerbini et al., 2017; Onyper et al., 2012).
Methods
The study was performed at a Dutch high school in Coevorden (52° 40′ N/6° 45′ E) between August 2013 and June 2017. The study was conducted according to the principles of the Medical Research Involving Human Subjects Act (WMO, 2012) and the Declaration of Helsinki (64th WMA General Assembly, Fortaleza, Brazil, October 2013). The Medical Ethical Committee of the University Medical Centre of Groningen (the Netherland) and the head of the school approved the study.
The weekly number of late arrivals (during the first hour), dismissals from class (number of times a student was sent out from class by the teacher because of unacceptable behavior), sick leaves (number of times a student was on sick leave), and sick leave durations (duration of the sick leave in days) were retrieved from the school’s registration system. Grades were also collected and are reported in Table 1 together with the attendance data.
Number and percentage of students absent from class (school year level 1-6, Dutch school system) and number and percentage of students with grades (school year level 1-3). a
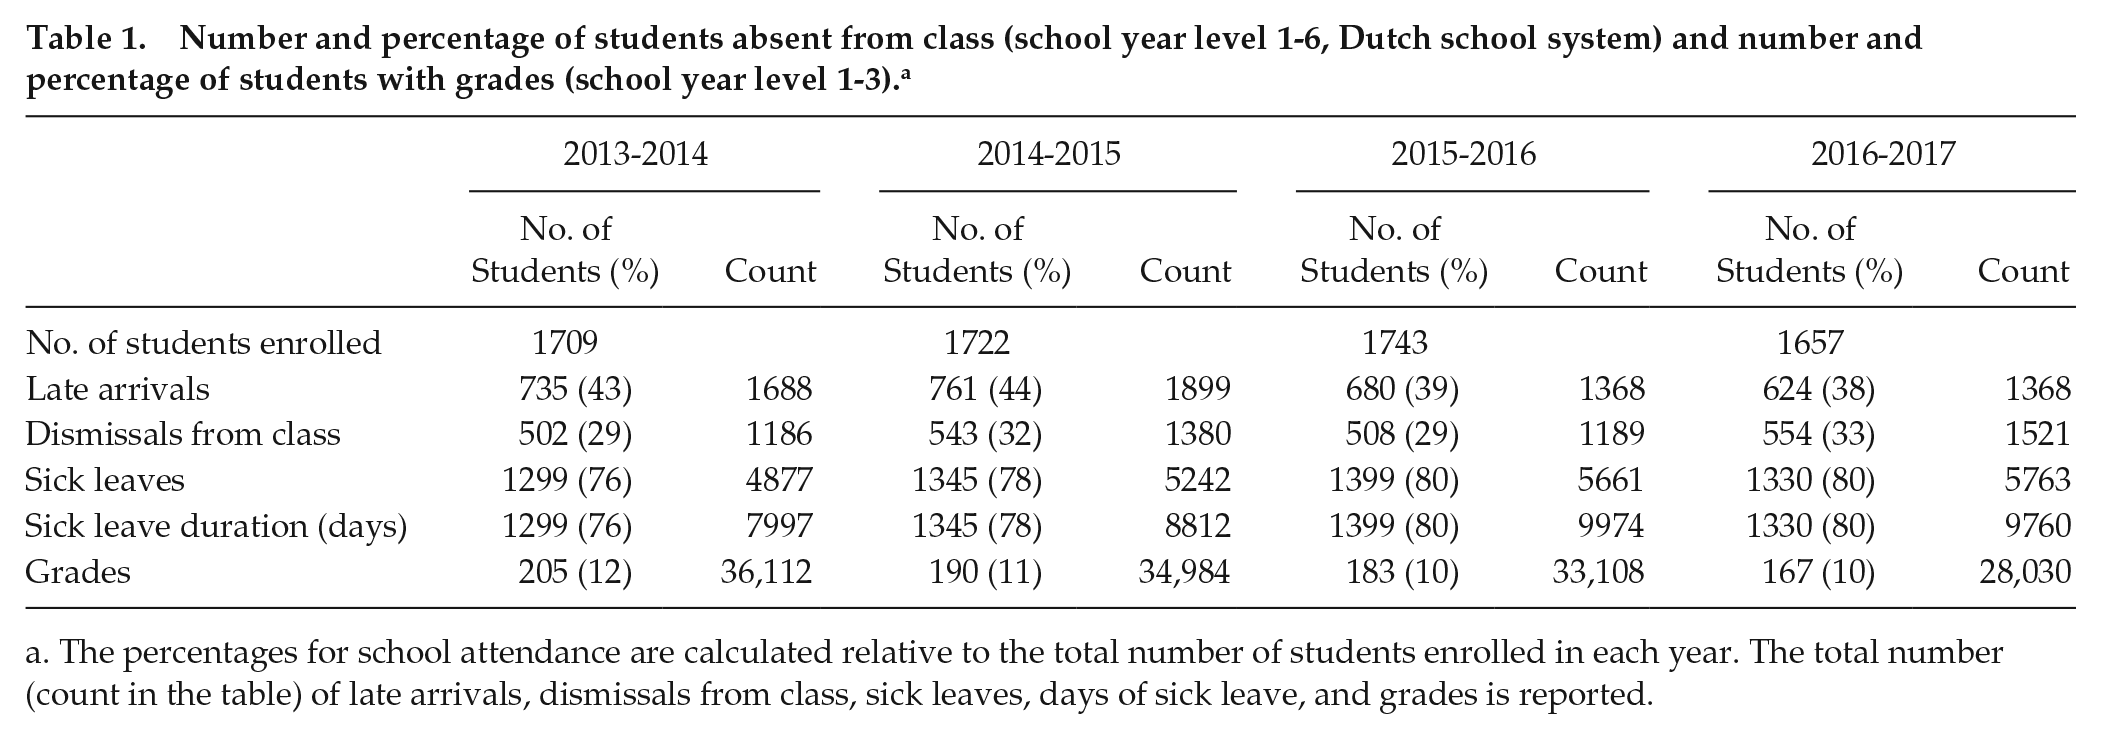
The percentages for school attendance are calculated relative to the total number of students enrolled in each year. The total number (count in the table) of late arrivals, dismissals from class, sick leaves, days of sick leave, and grades is reported.
Statistical analyses were done using R software version 3.3.0 (The R Core Team, 2013) unless otherwise specified. The annual variation in weekly totals of late arrivals, dismissals from class, sick leaves, and sick leave duration was assessed using CircWave analysis in MS Excel (version 1.4 by R. A. Hut, University of Groningen, the Netherlands; Oster et al., 2006), and the cosine fit was performed on all 4 years together. Weeks during school holidays (6 of 39 weeks per year) were considered as missing data (see Suppl. Table S1 for an overview of the school holidays). Because of the low number of estimated parameters (average, amplitude, phase), the cosine fit is robust despite not including data during weeks without school. Fits are presented for all weeks to improve the readability of the figures.
To assess the influence of the transitions from and into DST on school attendance, the daily numbers of late arrivals, dismissals from class, and sick leaves were calculated for March to April (spring) and October to November (fall). A 5-day running average was computed and plotted (data can be found in Suppl. Figs. S1-S6).
A stepwise backward regression analysis was performed to investigate the significance and strength of the unique contribution of several factors to the annual variance in school attendance. The model was run for all years together. The estimates (b coefficients) for the factors selected at the end of the stepwise regression analysis are reported in the Results section. The standardized coefficients (β) of each factor in the initial (before stepwise backward regression) and final model (after stepwise backward regression) are reported in Table 2.
Stepwise backward regression analysis of the influence of day length and weather conditions (i.e., wind speed, temperature, and precipitations) on the time-of-year variation in school attendance. a
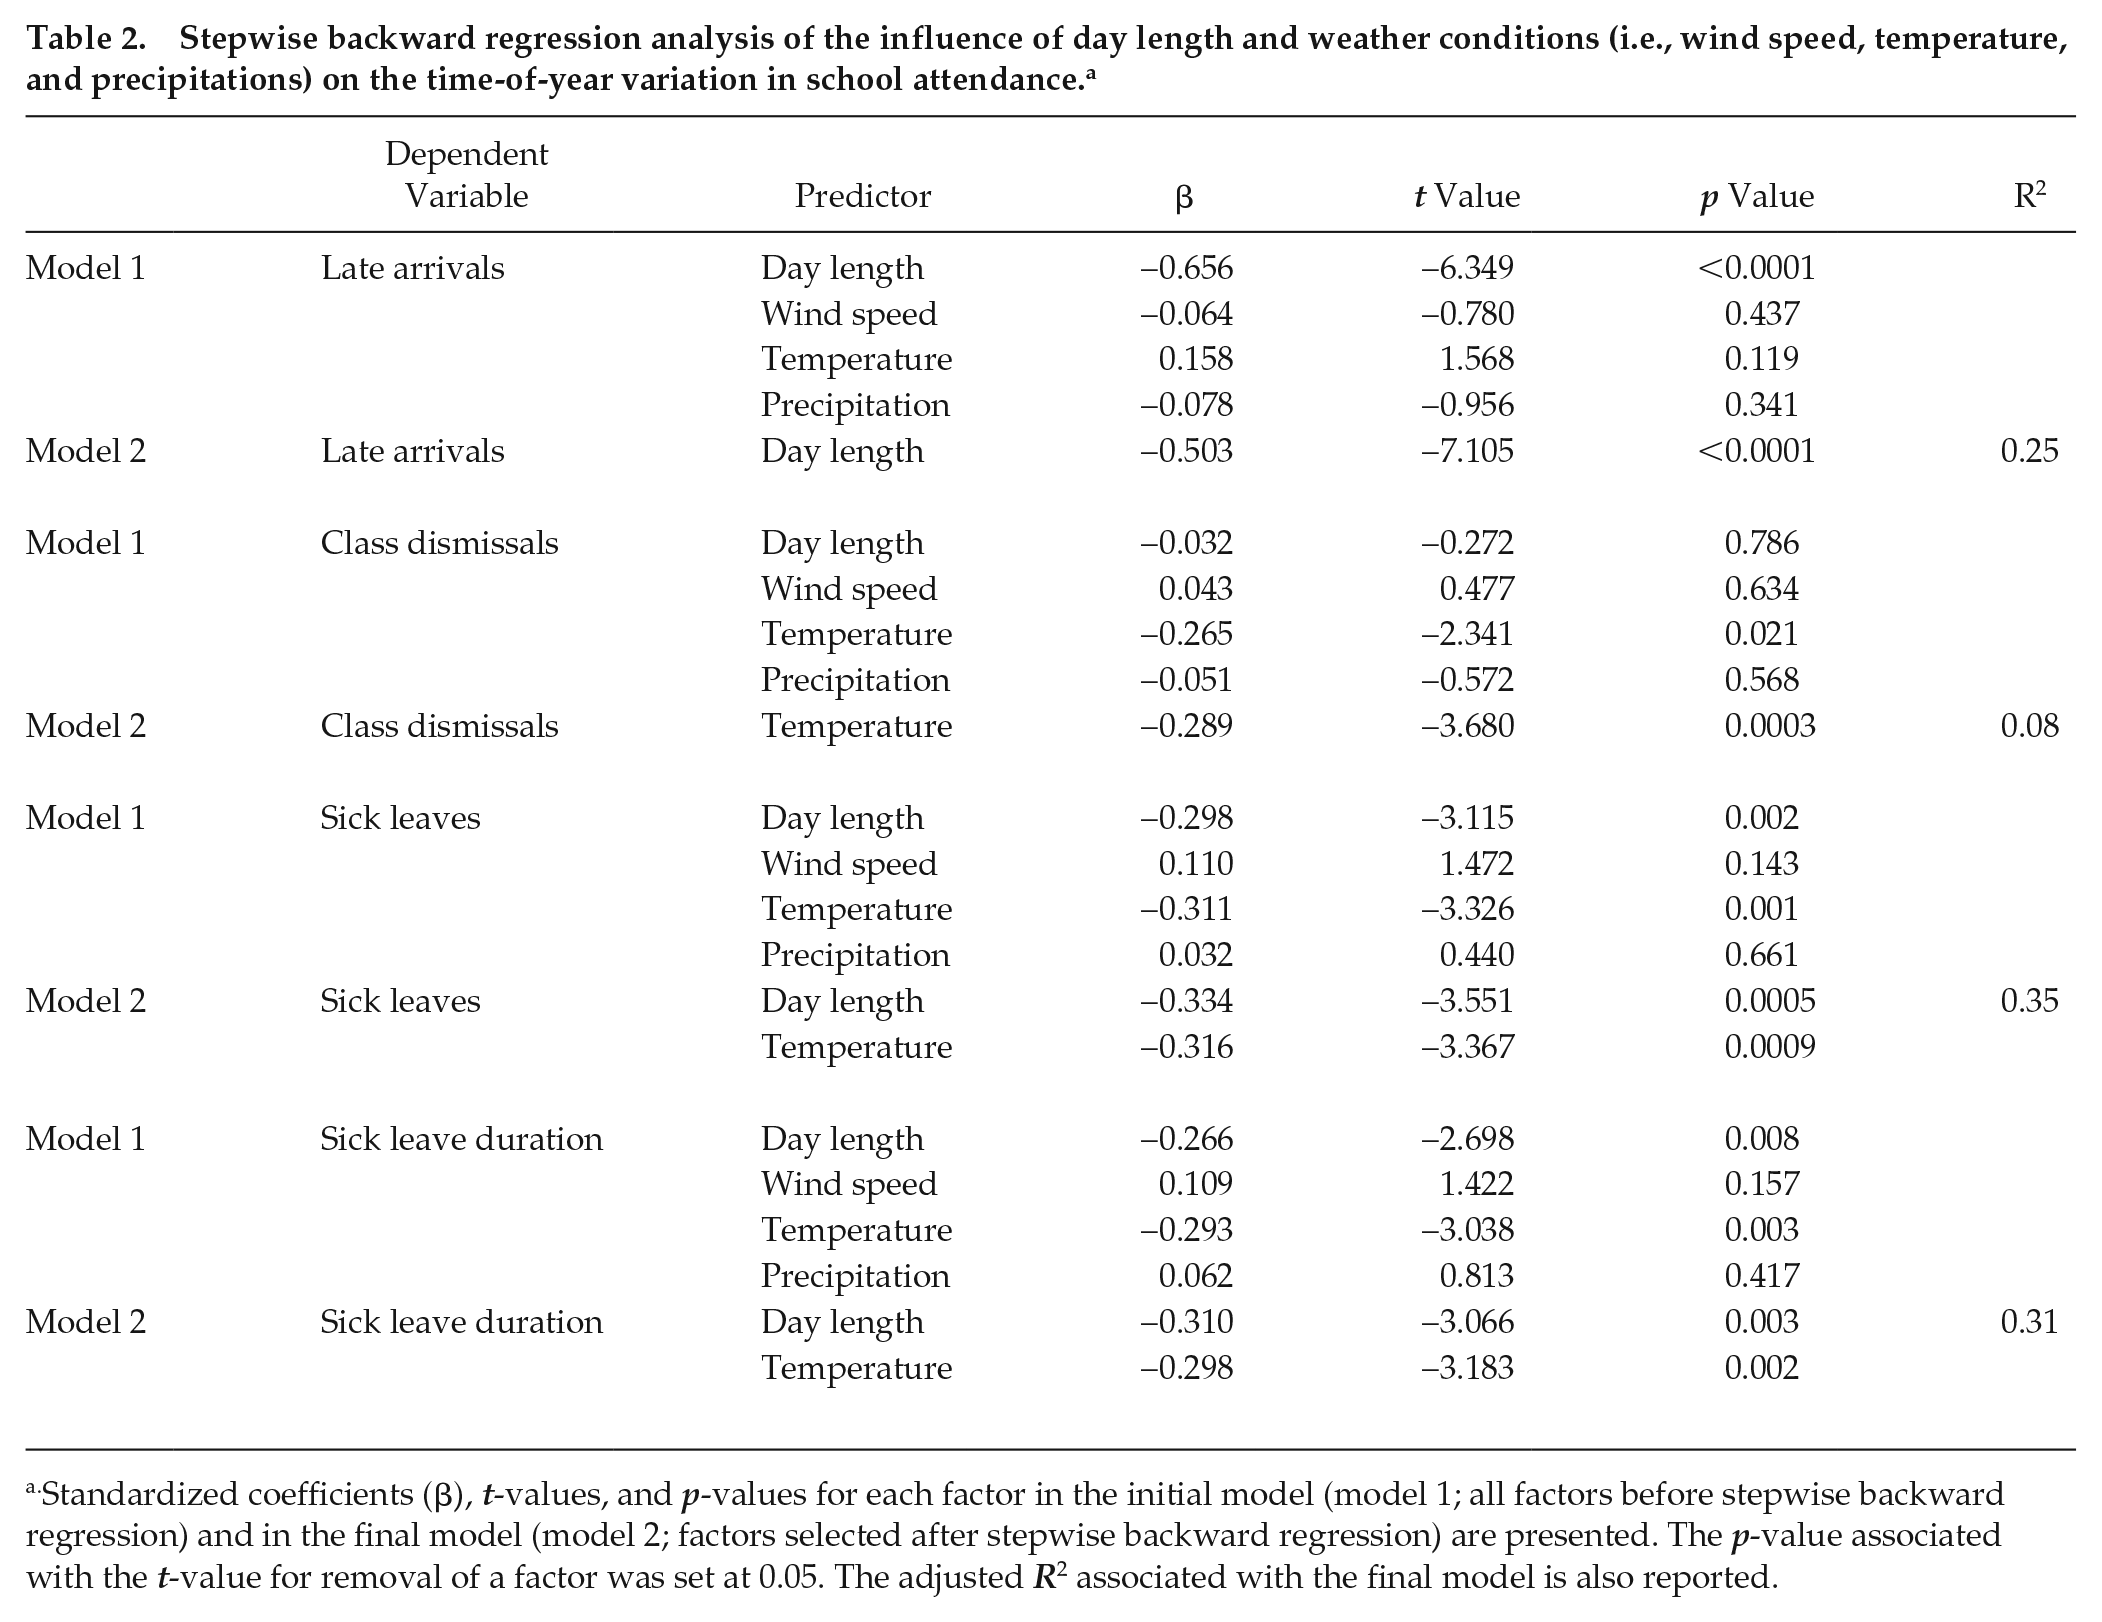
Standardized coefficients (β), t-values, and p-values for each factor in the initial model (model 1; all factors before stepwise backward regression) and in the final model (model 2; factors selected after stepwise backward regression) are presented. The p-value associated with the t-value for removal of a factor was set at 0.05. The adjusted R2 associated with the final model is also reported.
The factors analyzed in the model were day length (photoperiod in hours), wind speed (in meters per second), temperature (in degrees Celsius), and precipitation (in millimeters; sources: www.knmi.nl, Hoogeveen weather station, WMO #06279, 52° 43′ N/6° 28′ E; http://ecdc.europa.eu/en/Pages/home.aspx). For all of these parameters, data were collected with a 1-hr time resolution between 0600 h and 0900 h. Weekly averages were further calculated and incorporated into the model.
Grades were collected during 4 periods (fall: August-October; winter: November-January; spring: February-April; summer: May-July). In the Dutch secondary school system, grades range from 1 (lowest) to 10 (highest), with 6 considered to be the pass mark for a single exam. 1 The annual variation in grades was assessed using a hierarchical linear model with individual grades as the dependent variable and period of the year as the independent variable. Student ID was analyzed as a random factor nested within a class. Sex, age, school subject, and indicators of school attendance were entered in the model as covariates. Bonferroni correction was used for the post hoc tests. Hierarchical linear modeling (HLM) is a widely used statistical approach in educational research to analyze complex data organized at different levels (student, classroom, school; e.g., Woltman et al., 2012; Theobald, 2018). By introducing (nested) random effects, HLM allows for the control of process variance, which is not of interest itself to researchers but might influence the outcome variable. Examples of process variance are differences between classes (e.g., influence of the teacher) and between individual students (e.g., students’ aptitude).
Results
School Attendance over 4 Years
The number and percentage of students absent from class (school year level 1-6, Dutch school system) and of students with grades (school year level 1-3) are reported in Table 1. The age range of the students was 11 to 18 years. The proportion of female and male students was the same in each academic year (49% females in 2013-2014 and 50% females in the other years).
There was a significant time-of-year variation in the following parameters (Fig. 1): late arrivals (F2,149 = 35.68, p < 0.0001), dismissals from class (F2,150 = 8.69, p = 0.0003), sick leaves (F2,150 = 48.35, p < 0.0001), and sick leave duration (F2,150 = 41.26, p < 0.0001). All peaked in winter, albeit each at a different phase: late arrivals reached their maxima during the last week of November, dismissals from class peaked during the last week of January, and number of sick leaves and sick leave duration were highest during the second week of January. We did not find any effect of the transitions into and from DST on school attendance across the 4 years (Suppl. Figs. S1-S6).
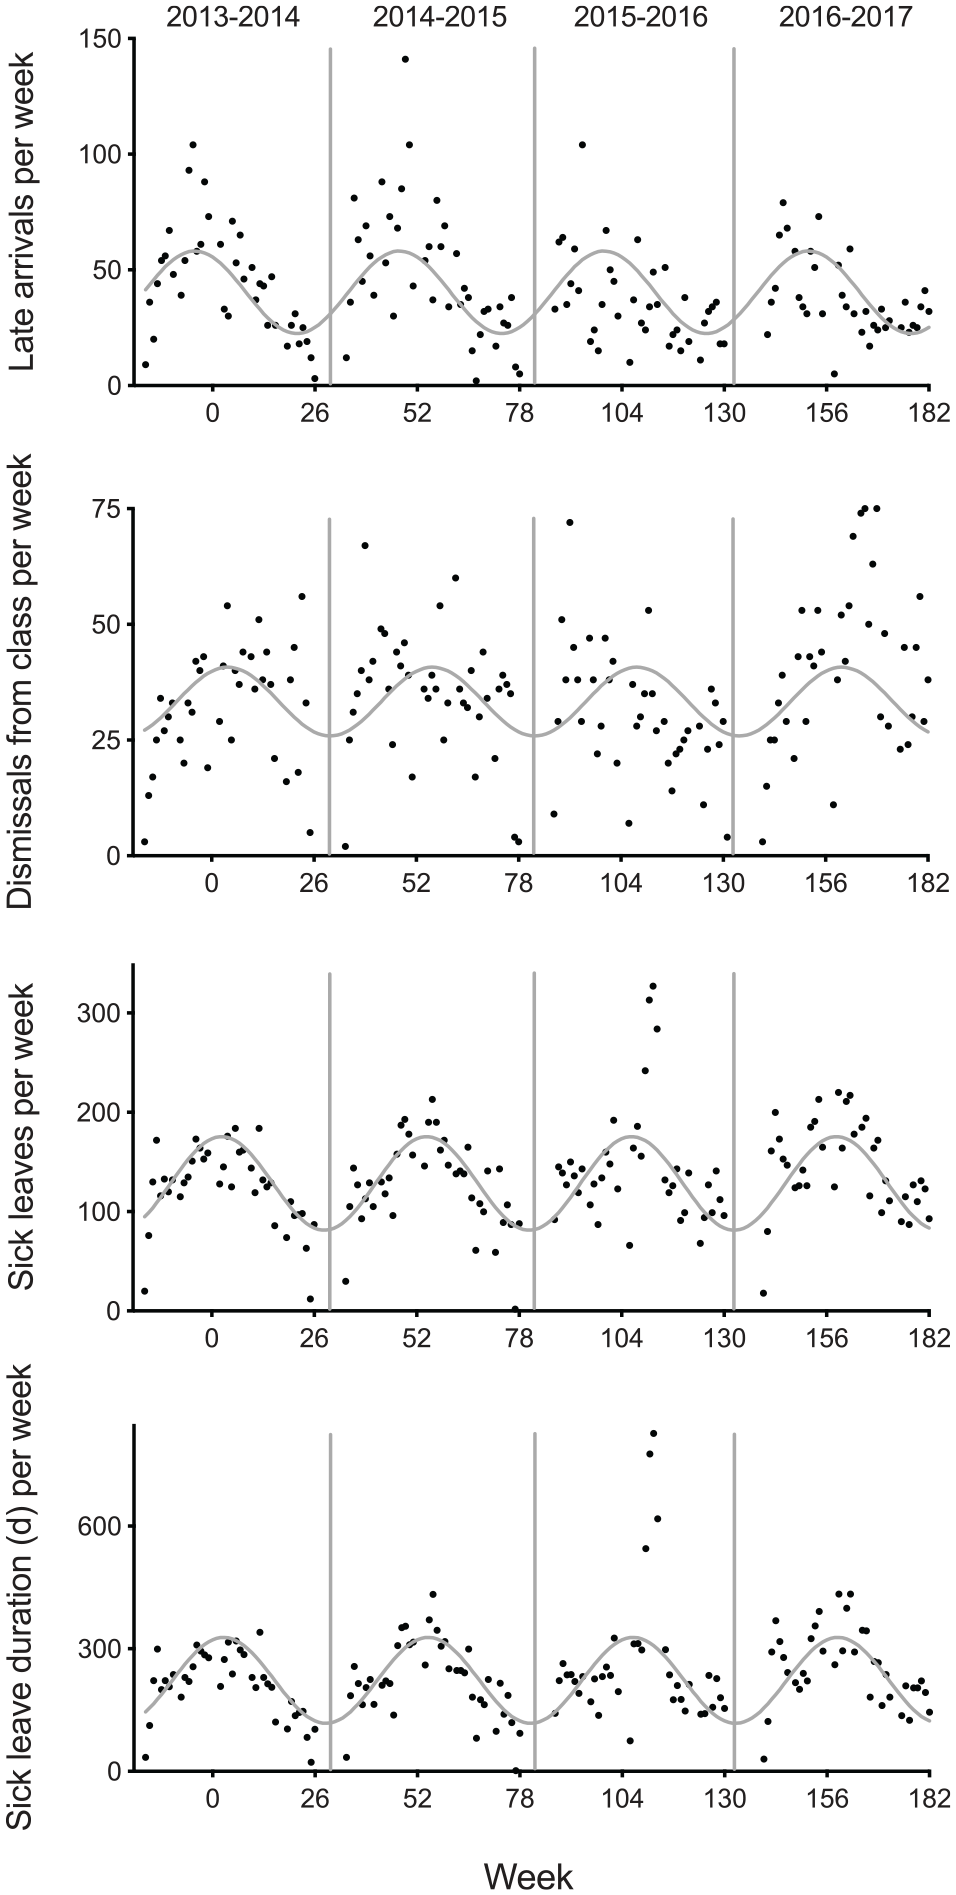
School attendance (late arrivals, dismissals from class, and sick leaves) over 4 years. Week number 1 is the first week of January 2014. Data for the 4 academic years are plotted next to each other. The gray curves represent the least-squares fits obtained using CircWave analysis. The black dots represent (from top to bottom) the weekly number of late arrivals, dismissals from class, sick leaves, and days of sick leave. School years are separated by vertical gray lines.
Day length was the only factor—among the ones assessed—contributing to the seasonal variance in late arrivals (b = −3.8, t[149] = −7.11, p < 0.0001). The model predicts that for each additional hour of daylight, there is a decrease of 4 late arrivals per week at the school level. The model explained 25% (adjusted R2 = 0.25) of the variance in weekly number of late arrivals. Outdoor temperature—not day length—was the only significant factor associated with the weekly number of dismissals from class (b = −0.8, t[149] = −3.68, p = 0.0003). The model predicts that when the outside temperature increases by 1 °C, the weekly number of dismissals from class decreases by 1 at the school level. The model explained 8% (adjusted R2 = 0.08) of the variance in the weekly number of dismissals from class. Both day length and outside temperature contributed significantly to the variance in number of sick leaves (adjusted R2 = 0.35; day length: b = −5.3, t[149] = −3.55, p = 0.0005; temperature: b = −2.8, t[149] = −3.37, p = 0.0009) and in sick leave duration (adjusted R2 = 0.31; day length: b = −11.6, t[149] = −3.18, p = 0.0018; temperature: b = −6.3; t[149] = −3.07, p = 0.0026). The model predicts that with each additional hour of daylight, there are 5 fewer students on sick leave and that the duration of the sick leaves decreases by 11 days at the school level. The model also predicts that when the outside temperature increases by 1 °C, the number of sick students decreases by 3, and the duration of sick leaves is 6 days shorter.
School Performance (Grades) over 4 Years
The multilevel model revealed that over the academic year (fall, winter, spring, summer) the seasons were significantly associated with grades, except for the academic year 2014-2015 (Fig. 2; 2013-2014: F3,35888 = 8.020, p < 0.0001; 2014-2015: F3,34779 = 1.010, p = 0.387; 2015-2016: F3,32915 = 55.814, p < 0.0001; 2016-2017: F3,27845 = 30.795, p < 0.0001). In 2013-2014, grades were lowest in summer; in 2015-2016, grades were highest in autumn and lowest in winter; and in 2016-2017, grades were lower in autumn and summer compared with spring and winter.
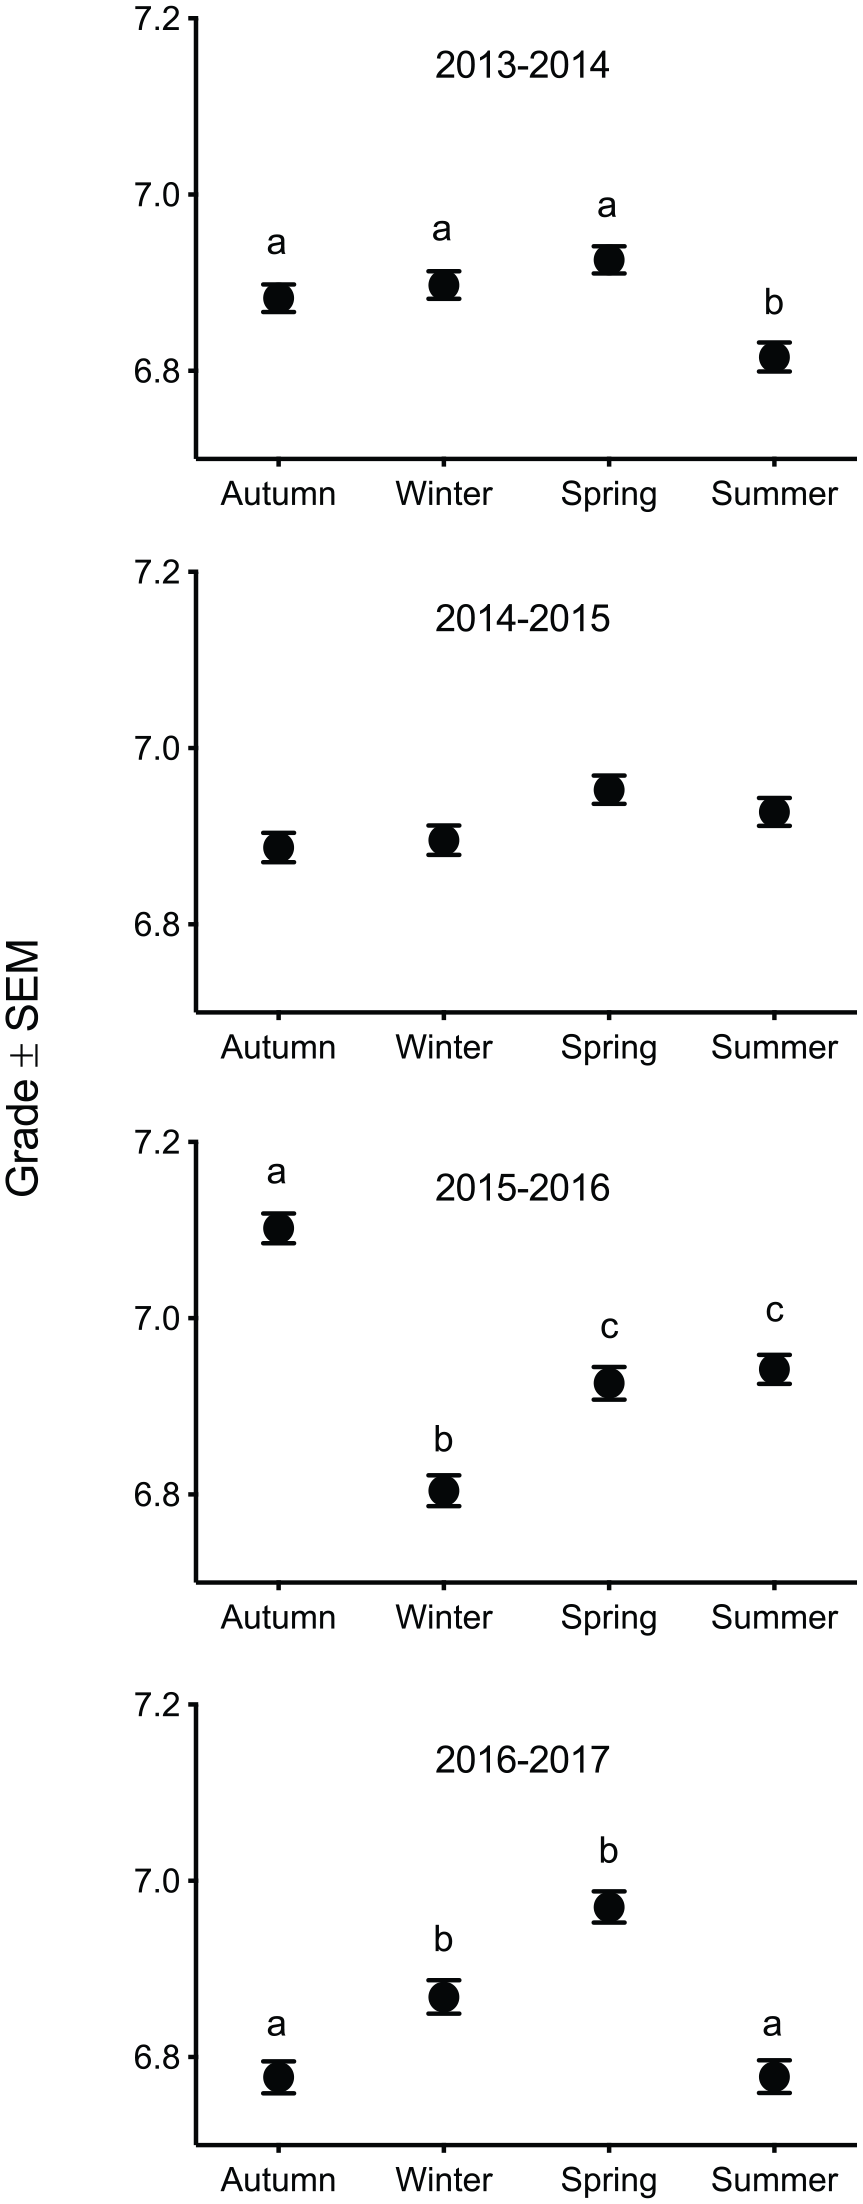
School performance (grades) over 4 years. Data points represent mean grades ± standard error of the mean (SEM) and were compared across the 4 periods of the school year (autumn, winter, spring, and summer) separately for each academic year (from August 2013 to June 2017). Significant differences between seasons found with post hoc tests are highlighted with different letters (p < 0.0001 with Bonferroni correction). In the Dutch school system, grades range from 1 (lowest) to 10 (highest), with 6 considered to be the threshold to pass a single exam.
Overall, males obtained worse grades compared with females (F1,731 = 49.924, p < 0.0001). The model predicted that the grades of male students are on average 0.3 units lower (on a scale from 1 to 10; b = −0.274, t[731] = −6.628, p < 0.0001). This effect was almost 10 times stronger than the effect of season (standardized β coefficients for sex: –0.09 and for period: –0.01). Student age was not significantly associated with grades (F1,66 = 0.237, p = 0.628). The indicators of school attendance were all negatively associated with grades, meaning that students who were more often absent from class obtained lower grades (late arrivals: F1,729 = 11.182, p = 0.0009; sick leaves: F1,739 = 39.595, p < 0.0001; dismissals from class: F1,724 = 23.568, p < 0.0001). This result confirms our previous findings (Zerbini et al., 2017) in a larger data set (here, 4 years of data compared with 1 year of data in our previous study).
Discussion
The aim of this study was to assess whether school attendance and school performance vary with time of year. Indicators of school attendance were collected between August 2013 and June 2017. We found a winter peak in late arrivals, dismissals from class, sick leaves, and sick leave duration (Fig. 1). Day length and weather conditions varied with time of year and were associated with the observed variation in school attendance. The photoperiod in Coevorden (52° 40′ N/6° 45′ E) is 7 h 36 min on the 21st of December and 16 h 53 min on the 21st of June. The range in temperature between August 2013 and June 2017 in the hours from 0600 h to 0900 h (the time interval in which most students commute to school) was −4.7 °C and 24.8 °C, with the coldest temperatures between December and March. In a recent study, the incidence of influenza was shown to be higher in winter (in the Northern Hemisphere), and climate (e.g., temperature) was found to be the main seasonal driver of this infectious disease (Martinez, 2018). Other studies have reported increased school absenteeism during the influenza season (Neuzil et al., 2002; Aldridge et al., 2016). Our observation of a peak in sick leaves during the colder winter months, therefore, is in line with these studies.
Likewise, the winter peak in late arrivals could have been explained by unfavorable weather conditions due to cold temperatures (e.g., presence of ice and snow on the streets). However, our results indicate that day length was more strongly associated with absenteeism than the weekly average temperature and weather conditions.
Light exposure influences the sleep-wake cycle (Roenneberg and Foster, 1997; Roenneberg and Merrow, 2007; Duffy and Wright, 2005). Exposure to less light and to light at night is associated with delayed (later) sleep (Skeldon et al., 2017; Roenneberg et al., 2013). In addition, the circadian clock, which is involved in the regulation of the sleep-wake cycle, is particularly sensitive to light in the morning and in the evening, responding with phase advances (e.g., earlier sleep) after morning light exposure and with phase delays (e.g., later sleep) after evening light exposure (Khalsa et al., 2003). During winter months, the students were likely exposed to reduced natural light, especially in the morning: in December and January, sunrise in Coevorden was later than the time at which school started (mean sunrise time in December and January 0835 h, range 0822-0848 h; school start time 0815 h). We did not assess light exposure nor sleep timing throughout the school years; therefore, we can only speculate that students were exposed to limited daylight in winter, especially in the morning, hence pushing sleep later compared with spring and summer. This alone would increase the probability of arriving late for school. Based on this hypothesis, we would expect to find a less pronounced seasonal variation in school attendance (and sleep) in schools that are located closer to the equator (due to smaller annual variations in day length). We would also expect to find no difference in school attendance between schools that are located in regions at the same latitude (same seasonal variation in day length) but with different climate (different amplitude in the temperature cycle) across the year.
Dismissals from class varied with time of year. This result was unexpected, and any interpretation was limited by the observational nature of our study. Studies in humans have shown impaired inhibitory control as a consequence of sleep deprivation (Kamphuis et al., 2012). If we assume that students were sleeping for a shorter time in winter, a sleep-related reduction in inhibitory control could explain an increase in dismissals from class (because of unacceptable behavior) during this period of the year. Temperature being the only significant predictor of this time-of-year variation was also unexpected. However, since this is a correlational analysis, the 2 parameters could vary similarly across the year (hence the correlation), without necessarily influencing each other.
The bi-yearly time shift resulting from DST was not associated with consistent changes in school attendance in the current study (Suppl. Figs. S1-S6). We expected an increase in absenteeism following the transition from standard time into DST (spring) and a decrease in absenteeism following the transition from DST into standard time (fall). These expectations were based on previous studies showing the negative influence of DST on various parameters in humans (Kantermann et al., 2007; Medina et al., 2015; Robb and Barnes, 2018). However, the many holidays occurring in spring and fall might have mitigated the effects of DST. Moreover, it is difficult to disentangle these effects from the observed seasonal variation in school attendance (absenteeism decreased from March to April and increased from October to November).
Grades in our study were significantly associated with season. However, we could not detect a pattern that was consistent between years and similar to the rhythm observed in the school attendance data. There are at least 2 possible explanations for this. First, grades were not collected on a weekly basis but at the end of each period (only 4 time points). This limited our seasonal variation analysis in comparison with what was performed with the school attendance data. Second, grades are influenced by many other factors, which also vary with time of year (for instance, topics might be easier at the beginning of the school year), making any detection of a seasonal variation in grades depending on environmental factors (e.g., photoperiod) difficult. The latter explanation is supported by the fact that the effect size of period of the year was almost 10 times lower as compared with that of, for example, sex. The tendency of female high school students to obtain overall better grades is a known effect reported in the literature (Duckworth and Seligman, 2006) and shows that our data are representative of the general school population. More studies with a higher time resolution (e.g., grades collected on a weekly basis) are needed to determine whether school performance as well varies with time of year.
In conclusion, the present data set shows that school attendance varies with time of year, with a winter peak in absenteeism. It is important to note that our correlational analyses cannot fully explain the underlying mechanisms of our observations, since correlation does not prove causation. Still, our findings stimulate ideas on how to organize school schedules. At high latitudes, for instance, schools could start later in winter, to see if this would reduce the higher rates of absenteeism during this time of year and possibly improve school performance, since absenteeism is negatively associated with grades (Onyper et al., 2012; Zerbini et al., 2017). In summer, an earlier school starting time could be maintained, to increase morning light exposure in students (important to entrain the circadian clock to an earlier phase) and allow for after school (outdoor) activities. Future studies could investigate whether seasonal variations in starting times (i.e., later start times in winter) help modify school attendance rates and performance levels in students. Ideally, these data sets should be complemented by individual data on rest/activity (e.g., by means of actigraphy) and light exposure profiles.
Supplemental Material
SMJBR – Supplemental material for Tardiness Increases in Winter: Evidence for Annual Rhythms in Humans
Supplemental material, SMJBR for Tardiness Increases in Winter: Evidence for Annual Rhythms in Humans by Giulia Zerbini, Vincent van der Vinne, Lana K. M. Otto, Stefanie Monecke, Thomas Kantermann and Martha Merrow in Journal of Biological Rhythms
Footnotes
Acknowledgements
We thank Jorrit Waslander and Hilde de Vries for their help in collecting the data. Our work is supported by the Technology Foundation STW grant P10-18/12186, the University of Groningen, and LMU Munich. Vincent van der Vinne is supported by a Novo Nordisk Postdoctoral Fellowship run in partnership with the University of Oxford.
Conflict of Interest Statement
The authors have no potential conflicts of interest with respect to the research, authorship, and/or publication of this article.
Notes
References
Supplementary Material
Please find the following supplemental material available below.
For Open Access articles published under a Creative Commons License, all supplemental material carries the same license as the article it is associated with.
For non-Open Access articles published, all supplemental material carries a non-exclusive license, and permission requests for re-use of supplemental material or any part of supplemental material shall be sent directly to the copyright owner as specified in the copyright notice associated with the article.