
Abstract
The suprachiasmatic nucleus (SCN) is the master clock of the brain. It is a network of neurons that behave like biological oscillators, capable of synchronizing and maintaining daily rhythms. The detailed structure of this network is still unknown, and the role that the connectivity pattern plays in the network’s ability to generate robust oscillations has yet to be fully elucidated. In recent work, we used an information theory–based technique to infer the structure of the functional network for synchronization, from bioluminescence reporter data. Here, we propose a computational method to determine the directionality of the connections between the neurons. We find that most SCN neurons have a similar number of incoming connections, but the number of outgoing connections per neuron varies widely, with the most highly connected neurons residing preferentially in the core.
A majority of living organisms display internal rhythms that oscillate with nearly 24-h periods. These are called circadian rhythms, and they control gene expression in cells as well as bodily processes and behavioral patterns in larger organisms (Dunlap, 1999). The main pacemaker for this process in mammals is the suprachiasmatic nucleus (SCN), a neuronal network composed of approximately 20,000 neurons, situated in the ventral hypothalamus (Ralph et al., 1990). This neuron cluster acts to entrain the body’s circadian rhythms with environmental light/dark cycles as well as to subsequently entrain peripheral physiological functions (Bass and Takahashi, 2010). While individual cells within this network display circadian oscillations, the robust system properties and stability necessary to be useful in a dynamic biological system do not emerge without communication between the individual oscillators (Liu et al., 2007; Stelling et al., 2004; Webb et al., 2009). The cells communicate and synchronize via neurotransmitters and neuropeptides. The transcription-translation feedback loop that produces oscillations within a single cell has been extensively studied and modeled (Leloup and Goldbeter, 2003; To et al., 2007). However, the network dynamics are dependent on the topology of the SCN network as a whole.
Much work has been done to elucidate the mechanisms of communication in the SCN (Aton et al., 2005; DeWoskin et al., 2015). The main mechanism focused on in this article is signaling via vasoactive intestinal polypeptide (VIP) to achieve synchronization of the clock protein PERIOD2 (PER2) via CREB (cAMP response element-binding protein) and the resulting synchronization of PER2 expression among cells in the SCN. Additional work has been conducted to explore the nature of the network structure. Several potential topologies have been examined (Cutler et al., 2003; Vasalou et al., 2009), including nearest neighbor, Strogatz-Watts, and exponential networks. Some models (Gonze et al., 2005) have also used a mean-field mechanism to attain synchrony in the system. Data analysis techniques applied to PER expression data using a bioluminescent reporter have suggested that a small world network with an exponentially distributed node degree provides a good fit to observed network properties (Abel et al., 2016). This type of network is also consistent with what is known about the development of neurons and their structure (Cutler et al., 2003). There are several modes of coupling among neurons in the brain. These include synaptic connections, gap junctions, and diffusing signals. Mechanisms such as diffusing signals do not exhibit directionality, as they are diffusion mediated, and so transmitters simply move along concentration gradients. Gap junctions more directly connect 2 cells and allow for rapid transmission of electrical signals and exchange of small molecules. This direct connection goes both ways and therefore does not exhibit directionality. Connections between the axons and dendrites, however, may exhibit directionality. While it is possible for a neuron both to send a signal to another neuron via its axons as well as to receive that second neuron’s signals at its own dendrites, it is not a requirement. It is possible for a neuron only to receive a signal in this manner or only to send it. Thus, neural connections give rise to networks that are partially, although not exclusively, directed. Recent research has focused on which cells were connected but not on the directionality of those connections. Since neurons do not necessarily communicate bidirectionally, to further understand these complex biological networks it is important that we know not only whether or not 2 cells are connected but also whether the signal goes from cell A to cell B or vice versa.
Other works (Abrahamson and Moore, 2001) have suggested an asymmetric distribution of nodes, with findings that indicate 2 distinct regions in the SCN lobes: a core and a shell (Leak et al., 1999). These works have found that the core is the main driver of synchrony (Welsh et al., 1995), leading the PER oscillations while the shell lags slightly behind. Previous studies (Abel et al., 2016) of the network connections of the SCN have also observed a higher number of connections within and extending from the core region. Furthermore, it is established (Cagampang et al., 1998) that while a majority of neurons in the SCN, and nearly all in the shell (Kalamatianos et al., 2004), are capable of receiving VIP, the putative coupling agent for synchronization (Abel et al., 2016), only approximately 20% are able to synthesize it (Kalamatianos et al., 2004).
Functional network structures for neurons have been identified using techniques including mutual information, transfer entropy, directed transfer functions, Granger causality, and between-sample analysis of connectivity (Abel et al., 2016; Garofalo et al., 2009; Bettencourt et al., 2007; Kaminski et al., 2001; Pourzanjani et al., 2015; Fujita et al., 2010). However, each of these methods has 1 of 2 issues. They are either inappropriate for determining the directionality of connections or the lack of high-frequency data and slow nature of the feedback loop controlling the core SCN oscillator render the technique not applicable. For example, high-frequency GABA signals affect the firing of SCN neurons and have been mapped previously (Garofalo et al., 2009); however, fast-scale GABA is not thought to affect the core oscillator (DeWoskin et al., 2015), but rather it is primarily driven by slow-scale VIP, resulting in the damping of high-frequency signals (Fujita et al., 2010; Webb et al., 2012). In addition, although the maximal information coefficient has been used to identify the functional connectivity of the SCN (Abrahamson and Moore, 2001), it does not provide information regarding the directionality of those connections.
This article makes 2 primary research contributions. First, we introduce a model-based methodology for inference of directionality of network connections. Second, we apply this methodology to infer the directionality of 4 networks of SCN cells. By analyzing the resynchronization data from 4 mouse SCN explants with knock-in PERIOD2:Luciferase, we confirm that there are likely phase-leading nodes that entrain others and that these nodes reside preferentially in the core. We find that the SCN forms a directed network with an exponentially distributed outgoing node degree but a normally distributed incoming node degree. This further supports the idea that driver nodes are the primary controllers of the SCN phase. Based on these findings, we suggest that this structure serves a purpose of balancing the ability of the system to synchronize and reentrain quickly with the ability to maintain robust oscillations that are not desynchronized by short time-scale perturbations.
Methodology and Results
Data Gathering
To collect the data for this experiment, 4 mouse SCNs were sliced and cultured under a microscope. Images were captured every hour, and tracking software (Abel et al., 2016) was used to identify and ascribe bioluminescence values to individual cells. The complete methodology is detailed in the “Biological Methods” section of Abel et al. (2016). Tetrodotoxin (TTX), a neurotoxin that inhibits intercellular signaling, was applied and left for 6 days. The TTX was then washed from the system, and the subsequent resynchronization was observed for 8 days. The hourly data from the resynchronization portion of these experiments was then used to infer the network structure. The full data set used to obtain results is publicly available online at https://github.com/JohnAbel/scn-resynchronization-data-2016.
Inference of Directed Connections between SCN Neurons
Basic Concept
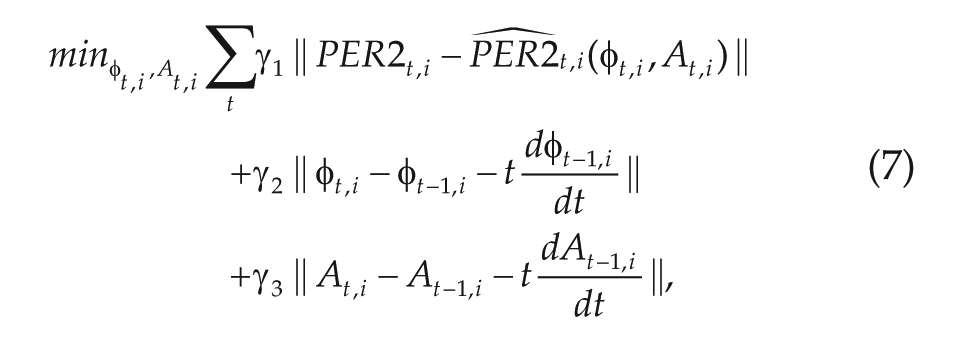
The basic concept for our method is as follows: given the data, which consists of PER2 concentrations at 60-min intervals, and a simple model (we used a phase-amplitude model from Garofalo et al., 2009), minimize the difference between the data and the model predictions as a function of the directionality of the network connections between each pair of neurons. Thus, we have
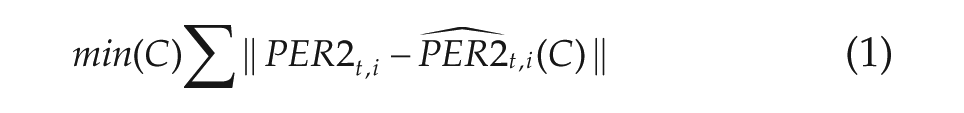
where
The naive approach requires that we explore an exponentially increasing number of network configurations to be explored, needing to explore as many as
Instead, we propose a method that solves a least-squares problem, minimizing over the possible connection directionalities while constraining the weights for each connection to between 0 and 1. We begin by noting that the derivative of the phase of an oscillating system is given by the velocity response curve (VRC; Garofalo et al., 2009; Taylor et al., 2010), which is a cell-specific function of the current phase and amplitude, and of the incoming VIP to each cell, which depends on the network connections, including their directionality. Using a forward Euler method to obtain the phase at time
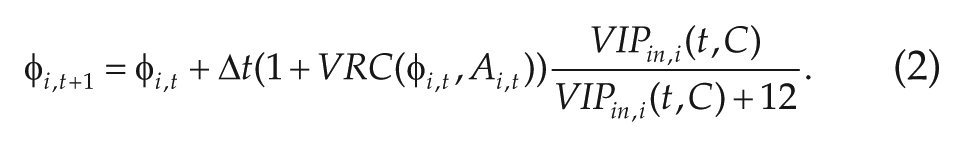
The new phase, given by the model, can be expressed as a linear function of the connectivity matrix. Then, we minimize the error between the observed phase and the model-predicted phase over the connections

noting that, by multiplying through in equation 3 by the denominator of the fraction, it is easy to see that the new phase, given by the discretized model, can be expressed as a linear function of the connectivity matrix. Thus, this minimization can be performed very efficiently via a linear least-squares solver.
In our specific implementation, we instead solved for VIP as a function of phase and minimized the difference between predicted and observed incoming VIP, again leading to a linear least-squares problem. A detailed description may be found in the Supplementary Materials.
It is important to note that there are 2 possible ways in which the model can come into the optimization. One could solve the ordinary differential equation (ODE) numerically, over the entire interval, and minimize, over all possible connectivities, the distance between the solution to this ODE and the data. Or one could reinitialize the ODE at each data point using the data. This introduces a complication, though, in that the phase-amplitude model will need initial values at each time point for both phase and amplitude, and both of these values will need to be determined from the PER2 data. We found that the second method, despite the complications of generating the required initial values from the data, was much more robust.
In our inference of directionality, we began with the functional networks inferred in Abel et al. (2016).
Model
This inference approach requires a model that, given the data at time t and a proposed connectivity matrix C, can produce an approximation to the PER2 concentration at time
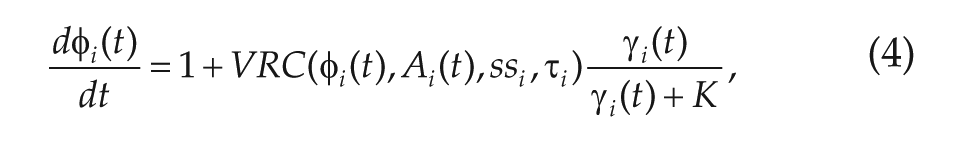
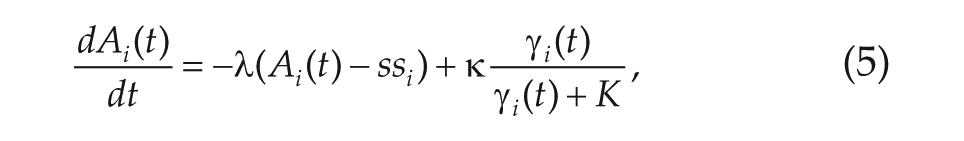
where

where
The key feature of this model that allows it to work with our limited data comes from the fact that the PER concentration in each cell can be represented as an oscillator with a varying phase and amplitude, making it useful for predicting circadian behavior. Thus, the PER data can be converted into a series of phases and amplitudes for each cell, and the response of the oscillators to external stimuli (VIP) can be modeled using VRCs. The process for the conversion is outlined later in this section.
The relaxation rate used in this model is
One caveat is that the specific model chosen likely affects the results. To be a candidate model for analyzing connection directionality, a model must have both a way to relate phase to neurotransmitter release and a relationship for how neurotransmitter inputs affect phase velocity. The model used in this article has both. A family of VRCs tuned for this system is used to relate VIP input to phase change, and the model includes a prediction of VIP release based on a cells phase. Changing these factors will have the largest effect on the results.
Generation of Phase and Amplitude from the Data
To use the phase-amplitude model to make predictions and infer network structure, it was necessary to obtain the phases and amplitudes from the PER2 data at each time point. To accomplish this, we made initial predictions of the phase and amplitude using the model and refined the predictions via a minimization with regularization, as described below.
The phase values at peaks and troughs, as well as the amplitude values at peaks, were directly calculated. These points will henceforth be referred to as anchor points. Initial guesses for the remaining phases and amplitudes were generated assuming that each cell experiences a mean field concentration of VIP stimulus, and Euler’s method was used to generate values from one anchor point to the next. A detailed explanation can be found in Supplement S1.
The initial guess for a time series between 2 anchor points was then refined by minimizing the
where
The first regularization prevents the phase from deviating too much from the model inferred value. This keeps the phase within reasonable bounds from one time step to the next (i.e., no jumps from
Results
The method was tested using synthetic networks generated in silico. Directed networks were randomly generated, and the reduced model was used to produce a corresponding set of resynchronization data. The method described above was then used on these test data, given an undirected version of the network, to determine the success rate of the method. The parameters used to produce the test data were varied from those assumed during the inference, to test the robustness of the method. In addition, Gaussian noise with a standard deviation of up to 50% of the mean amplitude of the oscillations was added to the synthetic data to test their effect on the accuracy of the inference. The results of the inference were evaluated for accuracy (ACC), sensitivity (TPR), and specificity (SPC) according to
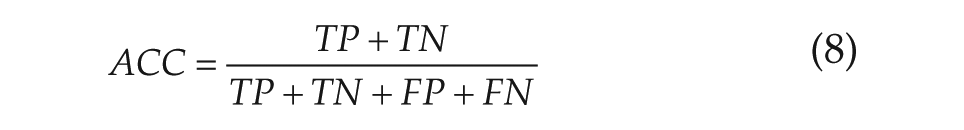


where TP is the number of true-positives, TN is the number of true-negatives, FP is the number of false-positives, and FN is the number of false-negatives.
With Gaussian noise of 20% of the value of the mean amplitude applied, the inference of connections in the synthetic networks had an ACC of 82.6%, with a TPR of 88.5% and an SPC of 78.6%. With 10% noise, those values become a 91.1% ACC, a 93.4% TPR, and an 88.2% SPC. When the anchor points were not used and the phase and amplitude values for the entire time series were determined using only the initial conditions, the robustness of the method greatly decreased. The results of all of the trials are summarized in the Supplemental Material.
Initial results from Abel et al. (2016) suggested that exploring the functional connectivity within SCNs revealed networks with an exponential node degree. Our work further supports this, finding an exponential node degree for outgoing connections . However, we also observe a truncated normally distributed node degree for incoming connections. This result illuminates previous experimental research that found that only approximately 20% of cells in the SCN express VIP (Kalamatianos et al., 2004), while almost all SCN cells express the surface protein responsible for the detection of VIP. The results of our examination are visualized in Figure 1. It seems likely that the highly connected nodes are VIP-ergic cells that drive the synchronization and entrainment of the system.
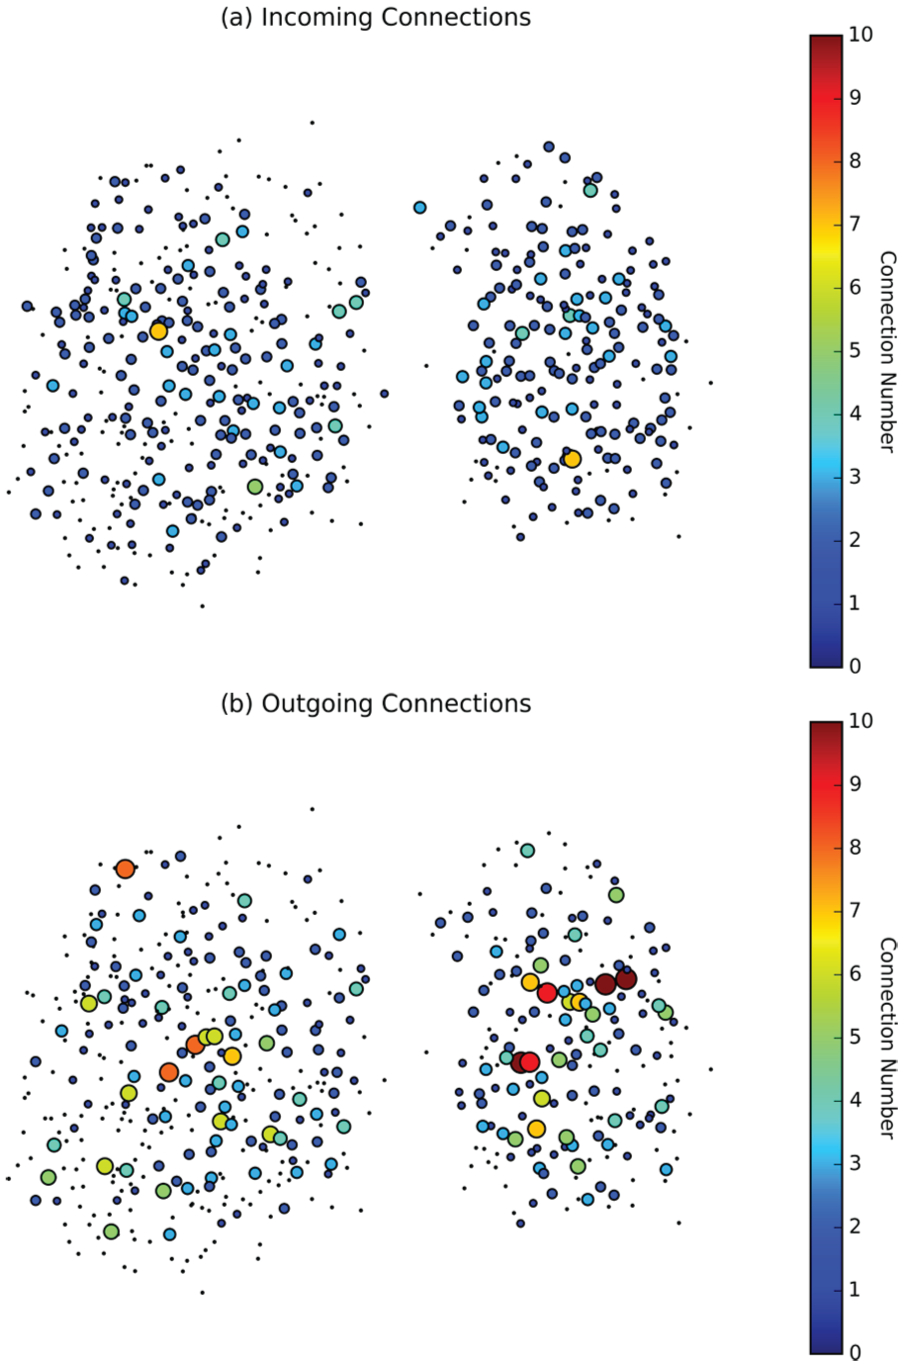
Incoming (a) and outgoing (b) connections for suprachiasmatic nucleus (SCN) 1. Nodes are sized and colored (online) according to the number of incoming and outgoing connections. The maximum outgoing node degree for this SCN was found to be 10, with node degrees of greater than 5 occurring 20 times (n = 541), and the maximum incoming node degree was found to be 7, with node degrees of 5 or more occurring only 3 times.
More than 99% of identified SCN neurons were determined to have 3 or fewer incoming connections (Fig. 2). In contrast, approximately 80% of SCN neurons have 3 or fewer outgoing connections, while the remaining 20% are relatively highly connected nodes of outgoing degree 4 or larger. Among all cells, 60% have no outgoing connections at all. This suggests that most cells have some input from 1 to 3 other nodes, while approximately 20% of the cells are generating that input.
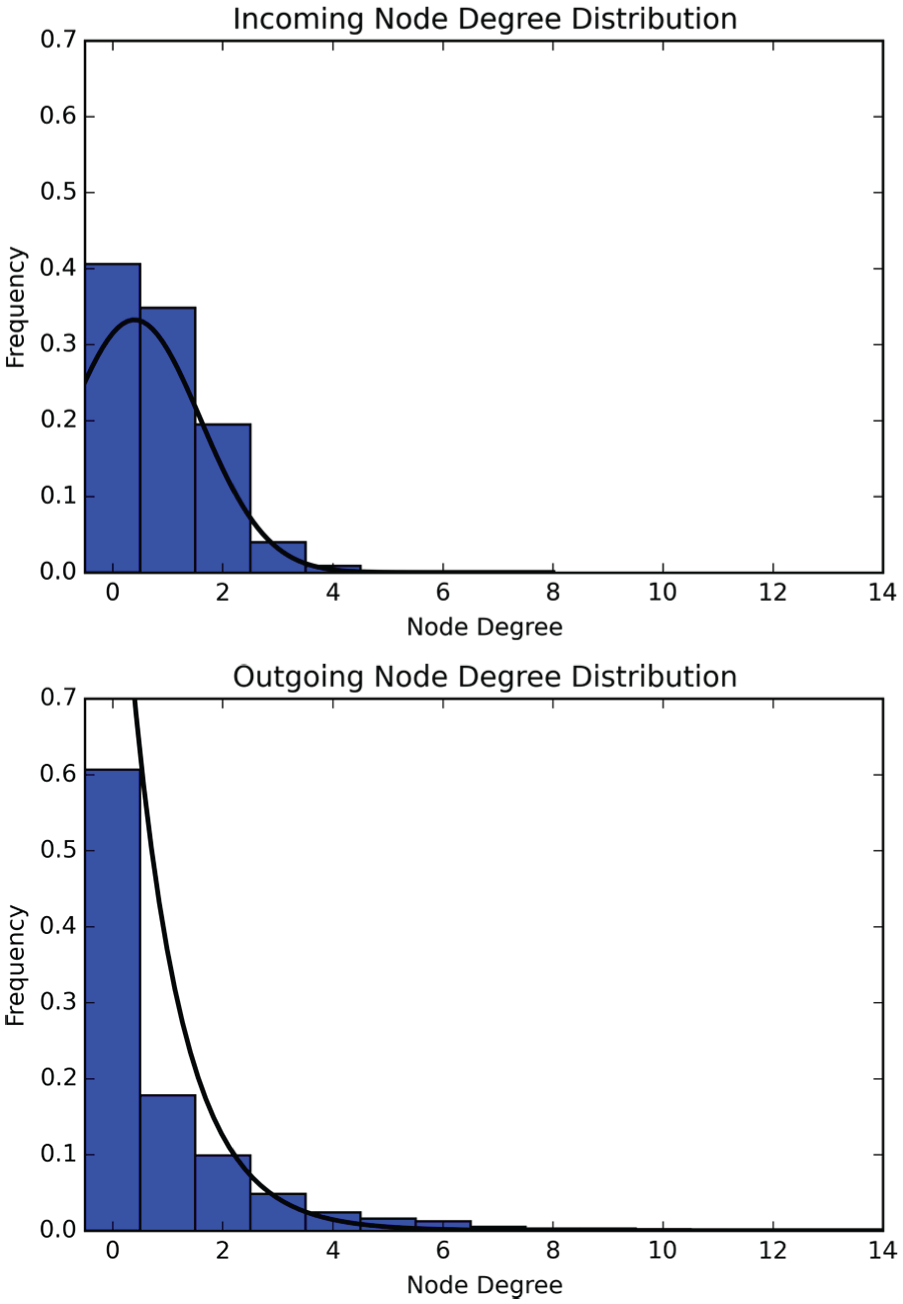
Cumulative incoming and outgoing node degree distributions for the 4 suprachiasmatic nucleus slices. The largest outgoing node degree observed was 18, and the largest incoming node degree was 8. Approximately 40% of cells were determined to have no incoming connection, and approximately 60% were determined to have no outgoing connection. Of the cells with observed incoming connections, only 1% had more than 3 incoming connections. Of the cells that had observed outgoing connections, 20% had more than 3 outgoing connections.
Discussion
In this work, we have introduced a methodology for model-based inference of network directionality and then used it to infer the directionality of the functional networks for synchronization of SCN slices. In this article, we sought the functional network structure for synchronization, which occurs on a relatively long time scale and is known to be driven mainly by neuropeptide-mediated communication. We note that this is different from short time-scale communication, which is important for other SCN functions, such as the electrical coupling used for visual function in Stinchcombe et al. (2017).
The inference methodology is based on minimization of the difference between simple, local models and the data, over the time intervals for which the data were measured. Although we had data for only 1 chemical species, PER2 concentration, we showed how to make use of another optimization to obtain estimated time-course information for both period and phase. The inference was then carried out simply and efficiently by solving a linear least-squares problem. We anticipate that our overall approach may be extended to inference of directionality of more complex, multivariable problems in which data are available for only some of the state variables but strong correlations exist between the known and unknown variables.
In Abel et al. (2016), potential connections were identified between cells based on their phase progression as synchrony was restored to a system that had been disrupted with TTX. In this article, we use those identified connections as the basis of our network and then use a model to determine their direction. The directionality of the functional network for synchronization that we inferred from the slices revealed an asymmetric network in which most neurons had an incoming node degree less than or equal to 3 and the network of outgoing connections was small world. Approximately 31.3% of those connections were found to be bidirectional, while 68.7% were found to be directed. The neurons with a higher degree of outgoing connections reside preferentially in the core, which would be expected if the core entrains the shell in synchronization (Taylor et al., 2017). We suspect that these may be the VIP-ergic nerurons as found in Kalamatianos et al. (2004). Simulated networks with this structure result in the highly sparsely connected nodes becoming phase leaders while the more highly connected nodes lag slightly behind. This agrees with the findings of Taylor et al. (2017), who found that core SCN neurons peaked in expression after shell neurons.
The directionality found in this article resembles the structure of, for example, a corporation. Nearly all nodes have a small number of incoming connections, but select nodes have a much larger number of outgoing connections. This structure suggests that the highly connected nodes drive the resynchronization, while the redundancy of smaller nodes likely contributes to the robustness of the system. By having a large network with several sparsely connected nodes that exert only a small influence on the overall system, as opposed to a small network in which each node is highly connected and important, random cell death is less likely to disrupt the nodes that drive resynchronization (Abel et al., 2016).
Further investigation is necessary to determine the evolutionary benefits such a network structure would confer. Some key questions include whether or not the directed network allows the system to save on the metabolic cost of creating connections while still producing a robust circadian network. Furthermore, it is possible that it also saves on the cost of sending signaling peptides if the system is able to achieve the same level of synchronization with fewer total connections. It is also important to investigate the balance that this structure strikes between being able to adapt to changing external signals on a long time scale such as seasonal lighting changes while maintaining the robustness necessary to minimize short-term perturbations such as lightning strikes and other natural light-producing events. We are currently pursuing these directions.
Supplemental Material
JBR790402_Supplementary_Material_CLN – Supplemental material for Model-based Inference of a Directed Network of Circadian Neurons
Supplemental material, JBR790402_Supplementary_Material_CLN for Model-based Inference of a Directed Network of Circadian Neurons by David McBride and Linda Petzold in Journal of Biological Rhythms
Footnotes
Acknowledgements
This work has been supported by the Institute for Collaborative Biotechologies through grant W911NF-09-0001 from the U.S. Army Research Office. The content of the information does not necessarily reflect the position or the policy of the government, and no official endorsement should be inferred. We would also like to acknowledge Dr. Erik Herzog of Washington University for making the SCN data available to us.
Conflict of Interest Statement
The authors declared no potential conflicts of interest with respect to the research, authorship, and/or publication of this article.
Notes
References
Supplementary Material
Please find the following supplemental material available below.
For Open Access articles published under a Creative Commons License, all supplemental material carries the same license as the article it is associated with.
For non-Open Access articles published, all supplemental material carries a non-exclusive license, and permission requests for re-use of supplemental material or any part of supplemental material shall be sent directly to the copyright owner as specified in the copyright notice associated with the article.