
Abstract
The suprachiasmatic nucleus (SCN) is an extremely robust self-sustained oscillator, containing virtually the same molecular clock present in other tissues in the body but, in addition, endowed with tight intercellular coupling dependent on multiple neurotransmitter systems that allow the SCN to function as the “master clock.” Several studies on the circadian SCN transcriptome have been published and compared with the transcriptome of other tissues, but the recent focus shift toward the circadian metabolome and the importance of small molecules for circadian timekeeping has so far been limited to macroscopic tissues such as the liver. Here, we report the successful use of laser capture microdissection coupled with liquid chromatography/tandem mass spectrometry for the circadian profiling of SCN amino acids. Among 18 amino acids detected, 10 (55.5%) showed significant variations, particularly marked for proline, lysine, and histidine, with higher levels during the subjective day. Moreover, we compared SCN and cortical amino acid levels between wild-type and Bmal1-deficient animals, either in the whole body or specifically in the liver. Interestingly, lack of Bmal1 in the whole body led to a significant increase in most amino acids in the SCN but not in the cerebral cortex. In contrast, deletion of Bmal1 in the liver mostly affected cortical amino acid levels during the subjective day. This study demonstrates that laser capture microdissection can be used for the isolation of microscopic brain structures for metabolomic purposes and reveals interactions between liver and SCN amino acid metabolism.
Introduction
A critical stage in the metabolomic analyses of finer structures and tissues is the isolation of the target tissue with minimal contaminations from surrounding cells, especially in the brain, where specific nuclei can have radically different metabolism from neighboring areas. To illustrate this point in the case of the suprachiasmatic nucleus (SCN), rhythms in extracellular amino acids (a.a.) have been documented by in vivo microdialysis from the region of the rat SCN (Glass et al., 1993b), where both glutamate and aspartate showed high levels during the night in a 14:10 LD cycle, but no significant changes in aspartate or glutamine, or any other a.a. measured, were reported using rat SCN punches from cryosections (Takeuchi and Takahashi, 1994). The authors argued that the source of a.a. (i.e., total intracellular vs. the “neurotransmitter” extracellular fraction), was the cause for the lack of significance, but a more accurate method to microdissect the SCN may have revealed significant rhythms.
As the master clock, the SCN is a highly metabolic nucleus, with pronounced rhythms in many neuropeptides such as vasoactive intestinal polypeptide, gastric-related peptide, neuropeptide Y, and vasopressin, as well as in the neurotransmitters serotonin and acetylcholine (Abrahamson and Moore, 2001; Card and Moore, 1984; Rusak and Bina, 1990; van den Pol, 1986). Pervasive rhythms in gene expression, notably of genes involved in neuropeptide synthesis, have also been reported in the SCN (Panda et al., 2002; Ueda et al., 2002). This rhythmic activity should also be seen at the level of the metabolome. We thus sought to develop a method to precisely quantify metabolites from the SCN and focused our initial study on a.a. because of their relevance in neurotransmission.
Laser capture microdissection (LMD) of mammalian tissues is often used to measure gene expression from the SCN or other fine histological structures (Doi et al., 2016; Hiragaki et al., 2014; Yamaguchi et al., 2013); in this case, prolonged bath fixation and counterstaining to visualize the tissue leads to inevitable loss of cellular metabolites. However, LMD has been successfully used for metabolome analysis of specific plant tissues, without fixation or counterstaining (Schad et al., 2005).
Without counterstaining, it would be difficult to ascertain the boundaries of the SCN prior to LMD. However, the shape of the optic chiasm, extending laterally to the vicinity of the lateral preoptic area, can be used as a guide for the rostral SCN location. Similarly, the separation of the optic tracts and the tapering of the ventral hypothalamus are an indication that the caudal SCN has been reached. Using these markers as SCN boundaries in the rostrocaudal axis, we here report the circadian profiling of a.a. by liquid chromatography/tandem mass spectrometry (LC/MS/MS) from SCN LMD samples. Moreover, we provide a comparative study of a.a. variations in the SCN, the cerebral cortex, and the liver between CT4 and CT16, and investigate the impact of the genetic ablation of Bmal1, in the whole body or specifically in the liver.
Material and Methods
Animals
All experiments were approved by the animal experimentation committee of Kyoto University. Mice were maintained at 23 °C ± 1 °C with 50% ± 10% relative humidity, on a 12-h light/12-h dark cycle (lights-on 0800 h, lights-off at 2000 h), food and water ad libitum. Whole-body or liver-specific Bmal1-deficient mice on a full C57BL/6J background were obtained by breeding Bmal1f/f (Shimba et al., 2011) with Tg(CAG-cre)2Osb (RIKEN, Japan) or B6.Cg-Tg(Alb-cre)21Mgn/J (Jackson Laboratories, Bar Harbor, ME), respectively. Bmal1f/f were used as wild-type (WT) control when comparisons between genotypes were made. Circadian profiling in Figure 1 was obtained with C57BL/6J mice. All measurements were made from tissues dissected from male mice between 10 to 12 weeks of age, sacrificed on the second day in constant darkness, under dim red light.
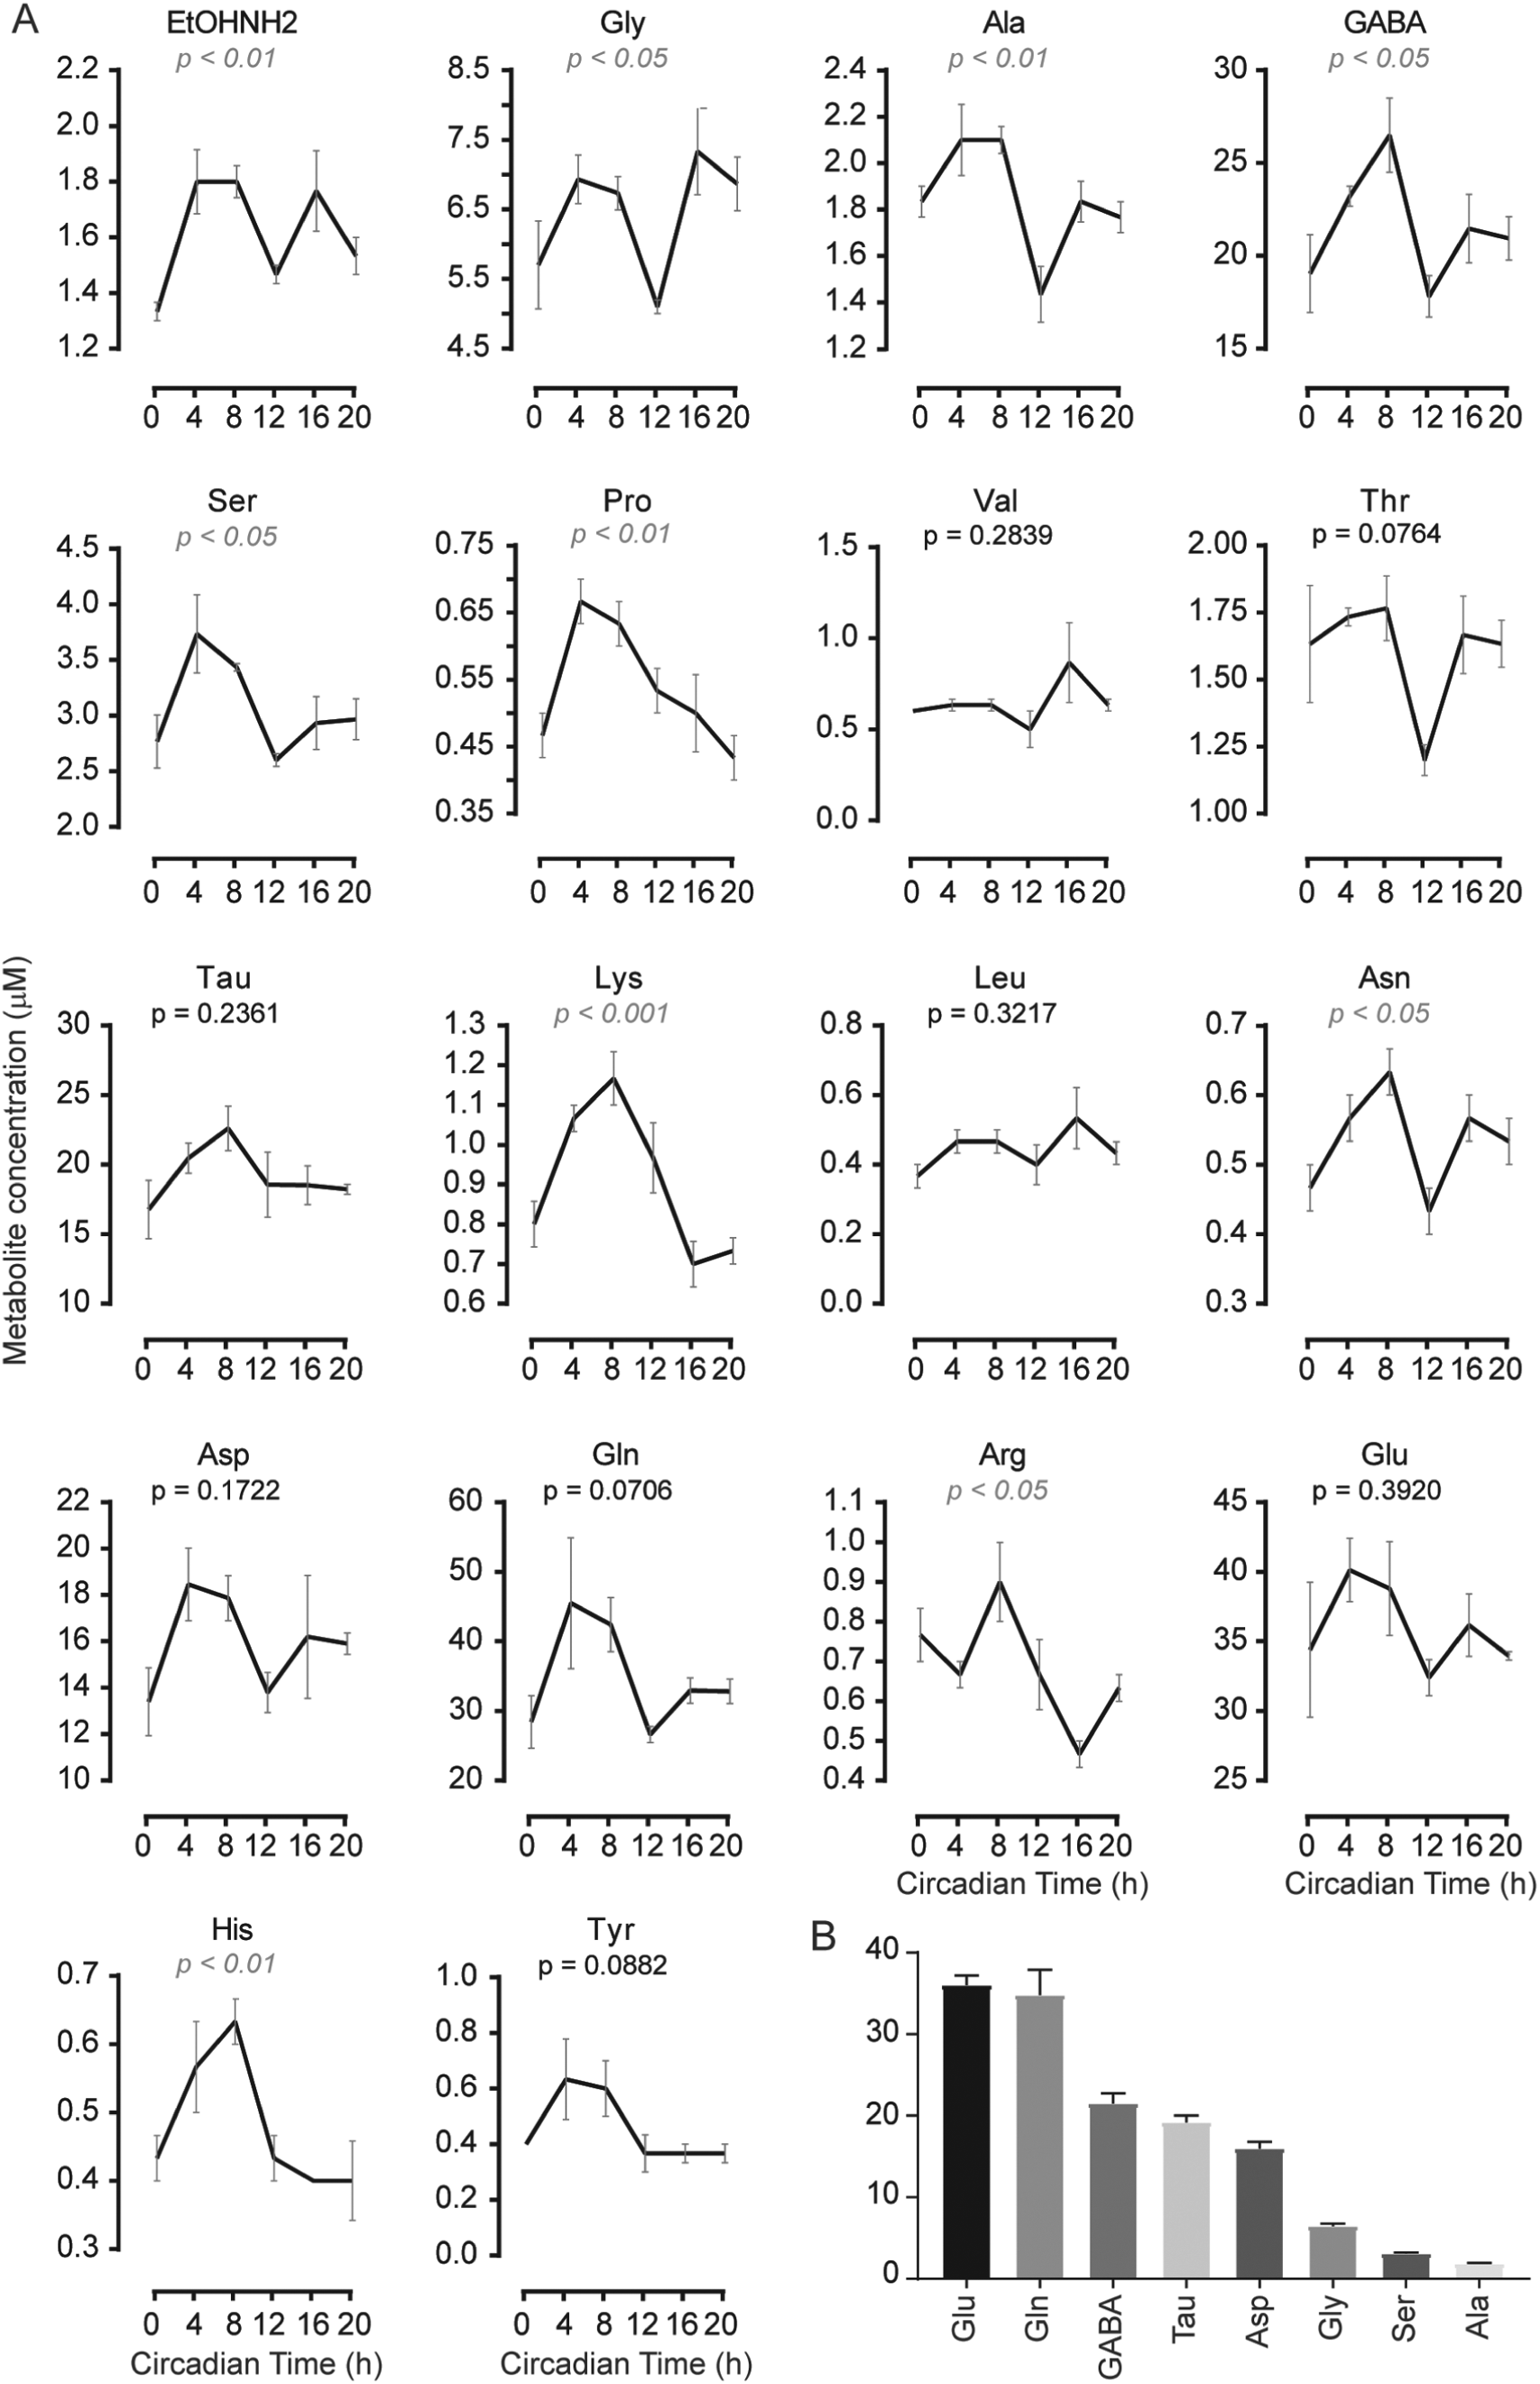
Circadian amino acid levels in microdissected suprachiasmatic nucleus (SCN). (A) Profiles of amino acids. The p value in one-way analysis of variance is given under the 3-letter amino acid symbol. Data show mean ± SEM of n = 3 animals per time points. (B) Average of each amino acid in the SCN. Data show mean ± SEM of n = 3 animals × 6 time points. Only the top 8 in abundance are shown.
Laser Microdissection of SCN and Cortex
Mice were sacrificed by cervical dislocation, and brains were promptly frozen on dry ice starting from the basal hypothalamus. Brains were kept at −80 °C until used. For each animal, 20 coronal 30-µm sections were prepared at −20 °C using a Leica microtome (CM3050S) and mounted on 0.9-µm polyester foil slides and allowed to dry at room temperature. From these sections, a serial subset of 15 sections was selected based on local histology, from which the SCN was microdissected (Suppl. Fig. S1). The total dissected area, 5 × 10⁶ ± 0.15 (mean ± SEM) µm2, calculated from a preliminary microdissection of 15 serial counterstained SCN sections, was kept constant for all SCN samples by keeping the area of each sections within 0.33 ± 0.03 µm2. The total volume of tissue dissected was 1.50 × 108 µm3. The shape of each microdissection was that of an inverted heart centered on the third ventricle. For the cortex, 15 microdissections of a fixed circular area of 0.7 × 106 µm2 from the somatosensory cortex were collected from the same sections used for the SCN (total volume of tissue: 3.15 × 108 µm3).
Microdissections of SCN or cortex were pooled into the collection cap filled with 50 µL of 80% methanol containing the internal standard L-Phe-UCN, 6 µM. After pooling, the 50 µl of methanol with the sections were transferred to the collection tube. The extract was collected at the bottom of the tube, mixed by pipetting several times, and transferred to a 1.5-mL tube. Extract was vortexed at full speed for 15 sec then centrifuged for 2 min at 15,000×g. The supernatant was transferred to a new 1.5-mL tube, and the pellet containing the membranes was kept for measuring residual metabolites during preliminary experiments. Just before analysis, equivalent amounts of high-performance liquid chromatography (HPLC)–grade water and chloroform were sequentially added to the sample, which was mixed and then centrifuged at 12,000 rpm for 5 min at 4 °C. The supernatant was transferred to a new tube and dried in a centrifugal evaporator for 2 h at room temperature. The sample was resuspended with 7 µL of HPLC-grade water. For the experiment reported in Figure 1, we quantified a.a. from samples taken from 1 animal, but since some a.a. (Arg, His) were barely above the lower end of the linear quantification limit, in subsequent experiments, we pooled sections taken from 2 animals for each sample. This caused discrepancies, and changes between CT4 and CT16 for Arg and His in WT animals were not confirmed in Figure 2.
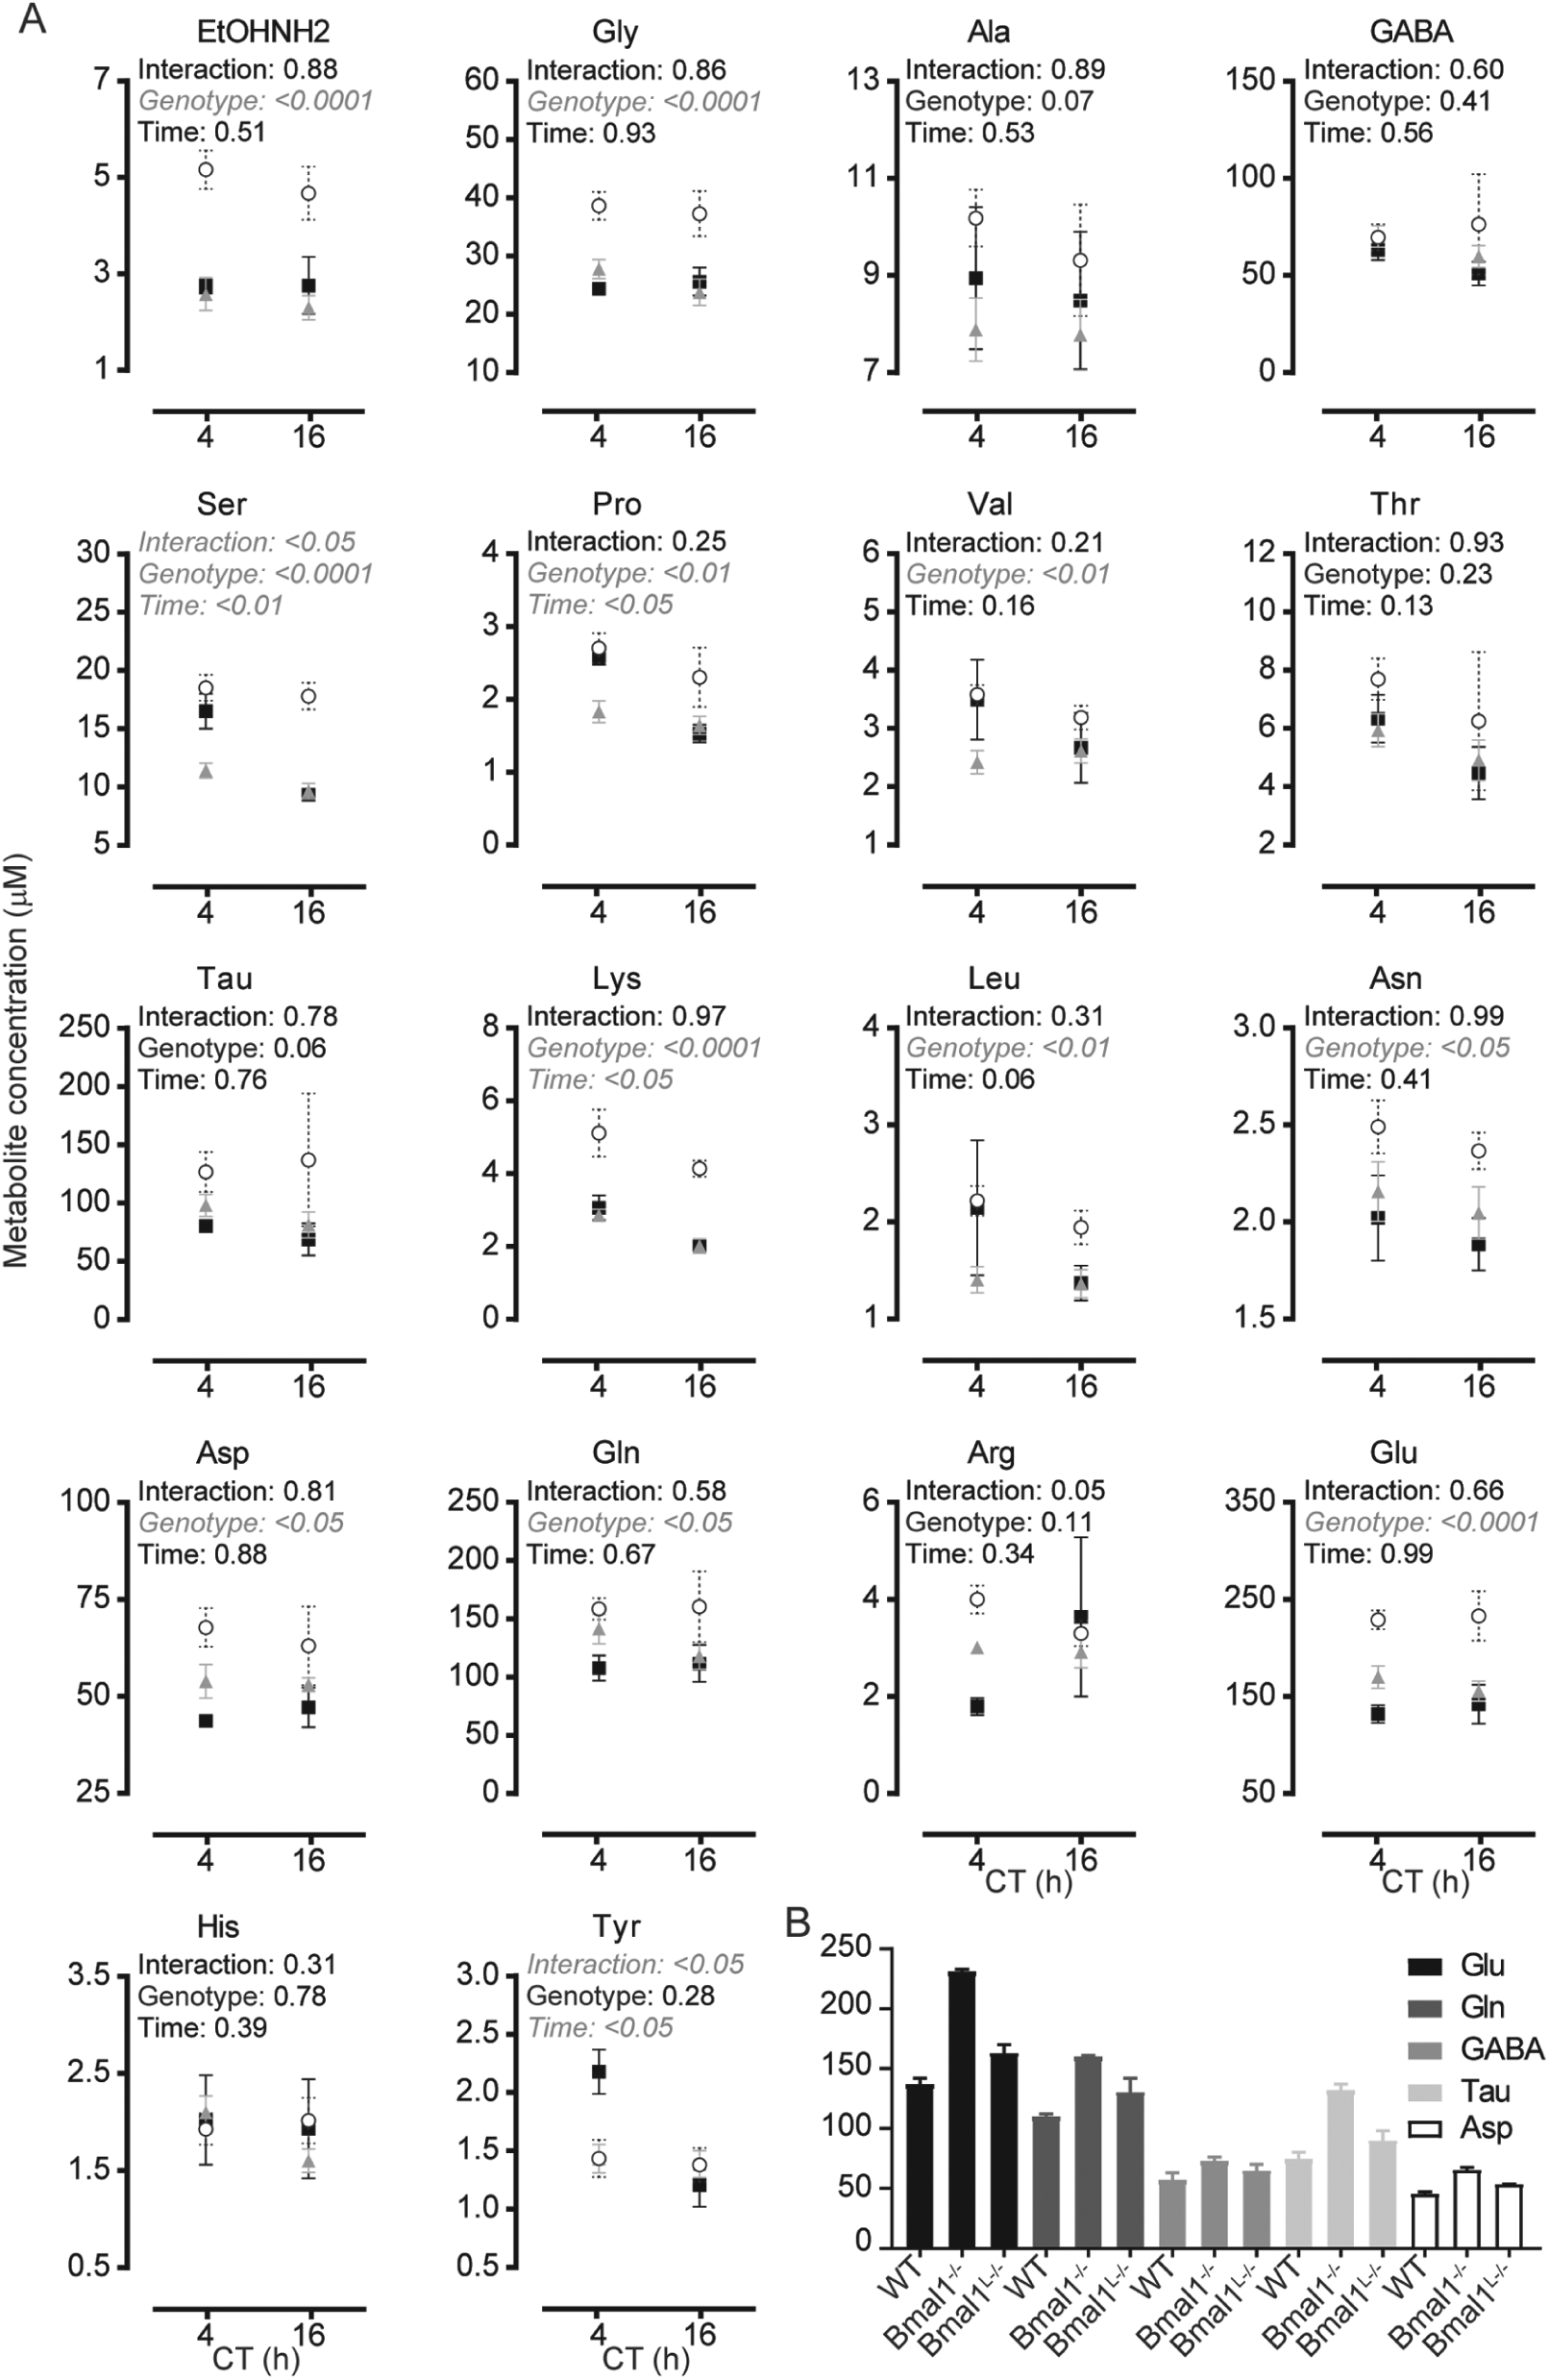
Genetic ablation of Bmal1 in the whole body or only in the liver disrupt amino acid levels in the suprachiasmatic nucleus (SCN). (A) Amino acid levels at CT4 and CT16 were compared in the SCN of wild-type (filled squares), Bmal1L-/- (gray triangles), and Bmal1-/- (open circles) mice. Data shown are mean ± SEM of n = 6 samples at CT4 and CT16 for Bmal1L-/-; n = 6 and n = 3 samples for Bmal1-/- at CT4 and CT16, respectively; and n = 2 at CT4 and CT16 for wild-type samples. Here, each sample contained SCN sections pooled from 2 animals. All animals were sacrificed on the same day and all SCN microdissected within 2 days. (B) Comparative analysis of the mean concentration of the 5 major a.a. in the SCN of wild-type (left bar), Bmal1-/- (middle), and Bmal1L-/- (right) mice. Notice consistently higher a.a. levels in Bmal1-/-. Data were analyzed by 2-way analysis of variance followed by Bonferroni multiple-comparison correction. CT = Circadian Time.
A negative control for SCN and cortex was prepared the same way by microdissection of the same area of membrane without adsorbed tissue. Low a.a. levels were found in the negative control, notably Ala (50% of value with sample), Thr (7%), Tau (6%) Asp (2%), and Gln (0.8%). Of a.a. within measurement range in the tissue samples, <10% residual amounts were found in the membrane pellet.
Liver Sampling
After cervical dislocation, 30 to 40 mg of liver tissue was dissected from the center of the left lobe, briefly washed in ice-cold phosphate-buffered saline to remove excess blood, dabbed on a lint-free tissue to remove excess buffer, weighed, and then flash-frozen in liquid nitrogen. Liver samples were then homogenized dry in a liquid nitrogen bath with a multibeads shaker at 1700 rpm for 10 sec ×2 (Yasui Kikai, Tokyo, Japan), then homogenized again at 1700 rpm for 10 sec ×2 in 80% methanol/20% water extraction solution containing 6 µM L-Phe-UCN, 1 mL/10 mg of liver sample. Four hundred microliters of the homogenate was mixed with equal amounts of water and chloroform, then centrifuged at 12,000×g for 5 min at 4 °C. Six hundred microliters of supernatant was dried in a centrifugal evaporator and resuspended in 60 µL HPLC-grade water.
LC/MS/MS
Amino acids were quantified using HPLC and electrospray ionization tandem mass spectrometry (Shimbo et al., 2009). Samples were derivatized with 3-aminopyridyl-N-hydroxysuccinimidyl carbamate (WAKO, Osaka, Japan). Derivatized samples were injected into a Shimadzu LC20AD liquid chromatography system (Shimazu, Tokyo, Japan) coupled to an API 4000 triple quadrupole mass spectrometer (Applied Biosystems-MDS Sciex, Tokyo, Japan). An Inertsil C8-3 column (GL Sciences Inc., Tokyo, Japan) and an Inertsil ODS-3 guard column were used for separation. Mobile phases A and B were 25 mM HCOOH (pH 6.0 NH4OH) and 60% MeCN (v/v), respectively. Initial tests on WT SCN revealed relatively low sample-to-sample variations, and relatively accurate a.a. quantification could be obtained with a limited sample size (n = 3).
Statistical Analyses
Data from Figure 1 were analyzed by conventional one-way analysis of variance (ANOVA). Data shown in Figures 2, 3, and 4 were analyzed by 2-way ANOVA, without matching to allow for missing values, followed by Bonferroni post hoc analysis. All analyses were performed using GRAPHPAD Prism 7.
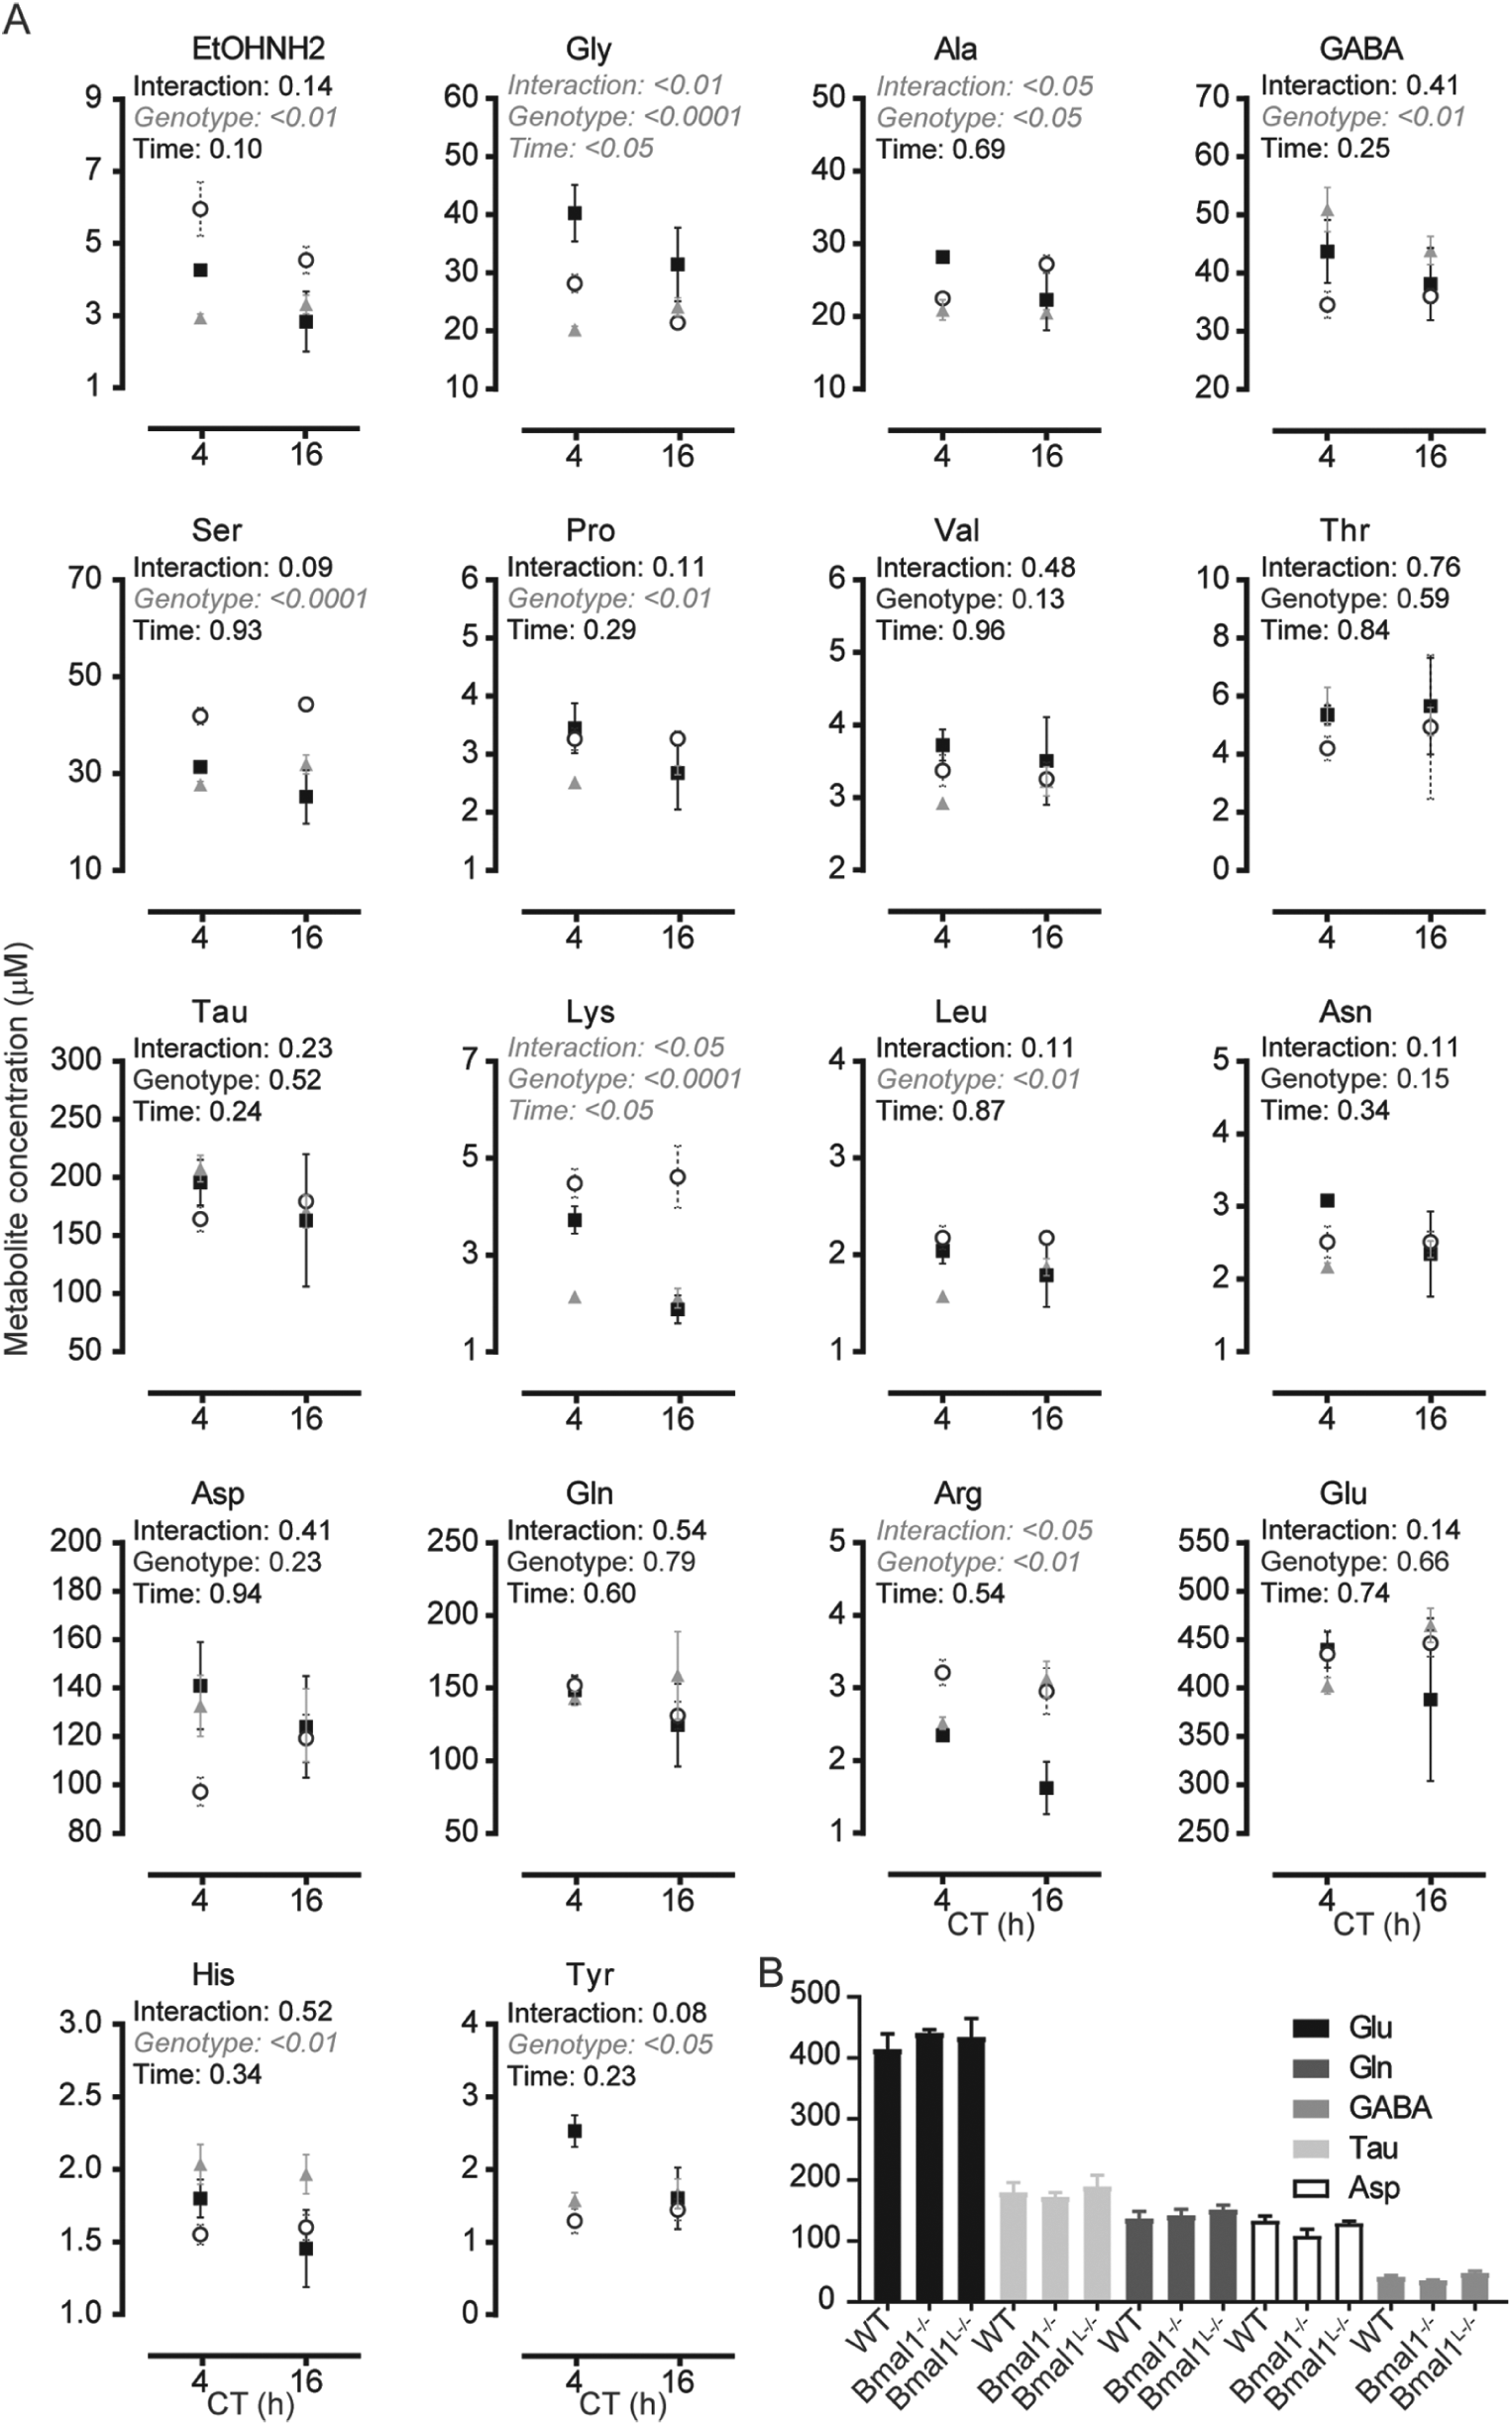
Changes in cortical amino acid (a.a.) levels in wild-type, Bmal1L-/-, and Bmal1-/- mice are different from that in the suprachiasmatic nucleus (SCN). (A) Amino acid levels measured in the cortex at CT4 and CT16 of wild-type (filled squares), Bmal1L-/- (gray triangles), and Bmal1-/- (open circles) mice. Data shown are mean ± SEM of n = 6 animals at CT4 and CT16 for Bmal1L-/-; n = 6 and n = 3 animals for Bmal1-/- at CT4 and CT16, respectively; and n = 2 at CT4 and CT16 for WT animals. All animals were sacrificed on the same day, and all SCN were microdissected within 2 days. (B) Comparative analysis of the mean concentration of the 5 major a.a. in the cortex of wild-type (left bar), Bmal1-/- (middle), and Bmal1L-/- (right) mice. Compare with Figure 2B. While they are the same 5 neurotransmitters as in the SCN, their respective abundance is different, and no overall tendency between genotypes was observed. Data were analyzed by 2-way analysis of variance followed by Bonferroni multiple-comparison correction. CT = Circadian Time.
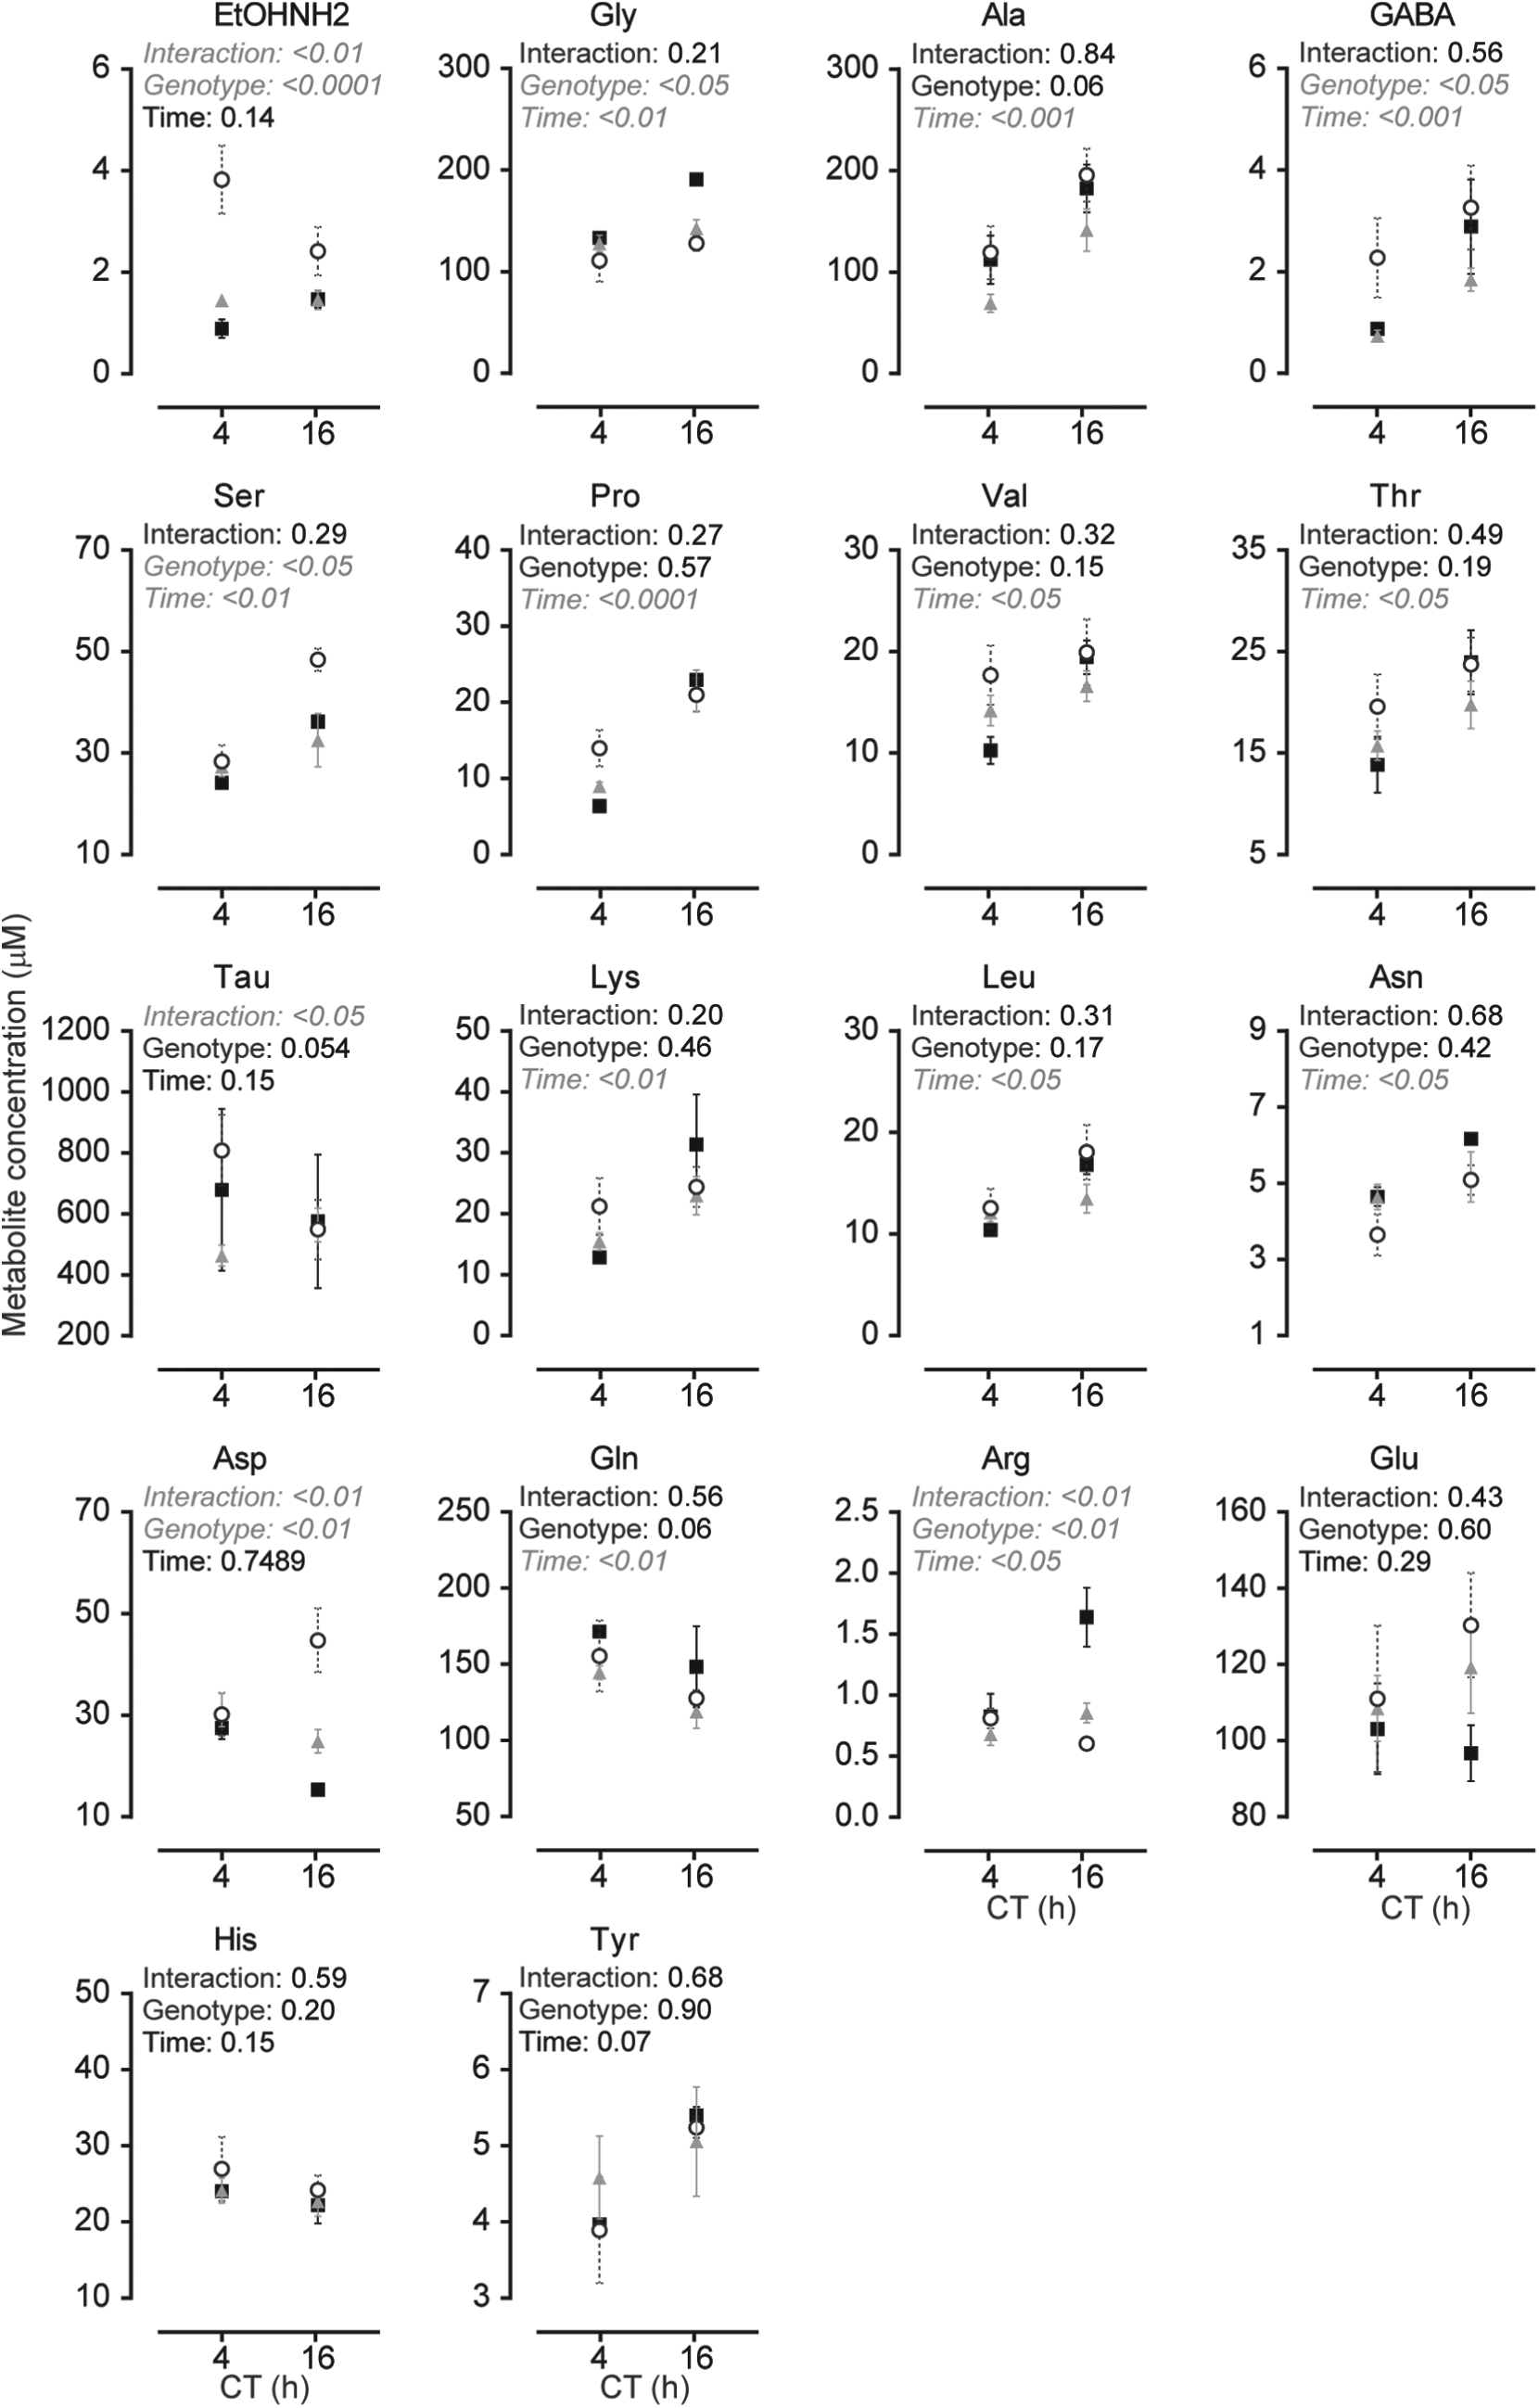
Changes in amino acid levels in the liver of wild-type, Bmal1L-/-, and Bmal1-/- mice. Amino acid levels measured in the liver at CT4 and CT16 of wild-type (filled squares), Bmal1L-/- (gray triangles), and Bmal1-/- (open circles) mice. Data shown are mean ± SEM of n = 6 animals at CT4 and CT16 for Bmal1L-/-; n = 6 and n = 3 animals for Bmal1-/- at CT4 and CT16, respectively; and n = 2 at CT4 and CT16 for wild-type animals. All animals were sacrificed and liver sampled on the same day. Data were analyzed by 2-way analysis of variance followed by Bonferroni multiple-comparison correction. CT = Circadian Time.
Results
We first measured a.a. from microdissected SCN samples, prepared every 4 h during 24 h from n = 3 animals per time point (Fig. 1). Fifty percent of measurable a.a. showed significant variations: Ala, Arg, Asn, EtOHNH2, GABA, Gly, His, Lys, Pro, and Ser. Interestingly, most a.a. showed higher levels during the day and showed uncanny profile similarities. Many a.a. showed a biphasic profile with a trough at CT12 (e.g., glycine, alanine, asparagine, serine, and aspartate). Glutamate, used to synthesize GABA, and glutamine together showed remarkable similarities. Lysine, proline, and histidine, all peaking during the day, showed the most significant variations. The mean concentration of a.a. in the SCN revealed that glutamate, glutamine, GABA, taurine, aspartate, and glycine, all neurotransmitter a.a. and precursor thereof (glutamine), were the most abundant a.a. in the SCN. These data show that laser microdissection can indeed be used as a sampling method for metabolomic studies and reveal temporal organization of a.a. metabolism.
Next, we sought to answer the following questions. First, what is the role of the circadian clock in the control of a.a. levels in the SCN? Second, what is the role of the circadian clock in the liver in the control of a.a. levels in the SCN? Third, how do a.a. levels compare between the cortex and SCN under these conditions? To answer these questions, a.a. levels were measured at CT4 and CT16 in the SCN, the somatosensory cortex, and the liver of WT mice, whole-body Bmal1 knock-out mice (Bmal1-/-), and liver-specific Bmal1 knock-out mice (Bmal1L-/-; Fig. 2). CT4 and 16 were selected as they correspond to highs and lows of the most significant a.a. from Figure 1.
Significant changes between genotypes in 2-way ANOVA were found in Asn, Asp, EtOHNH2, Gln, Glu, Gly, Leu, Lys, Pro, Ser, and Val. All of these a.a. increased in Bmal1-/- mice compared with WT and Bmal1L-/-. Bonferroni comparison indeed revealed significant differences between genotypes at CT4 and CT16, as summarized in Table 1. Together, these data show that variations of most a.a. levels in the SCN do not depend on circadian metabolism in the liver but are strongly affected by the total loss of Bmal1. Interestingly, most neurotransmitter a.a., excitatory (Asp, Glu) or inhibitory (Gly) and precursors (Gln), increase in the SCN of Bmal1-/- mice.
Statistical analysis of a.a. levels in the SCN of WT, Bmal1-/-, and Bmal1L-/-.
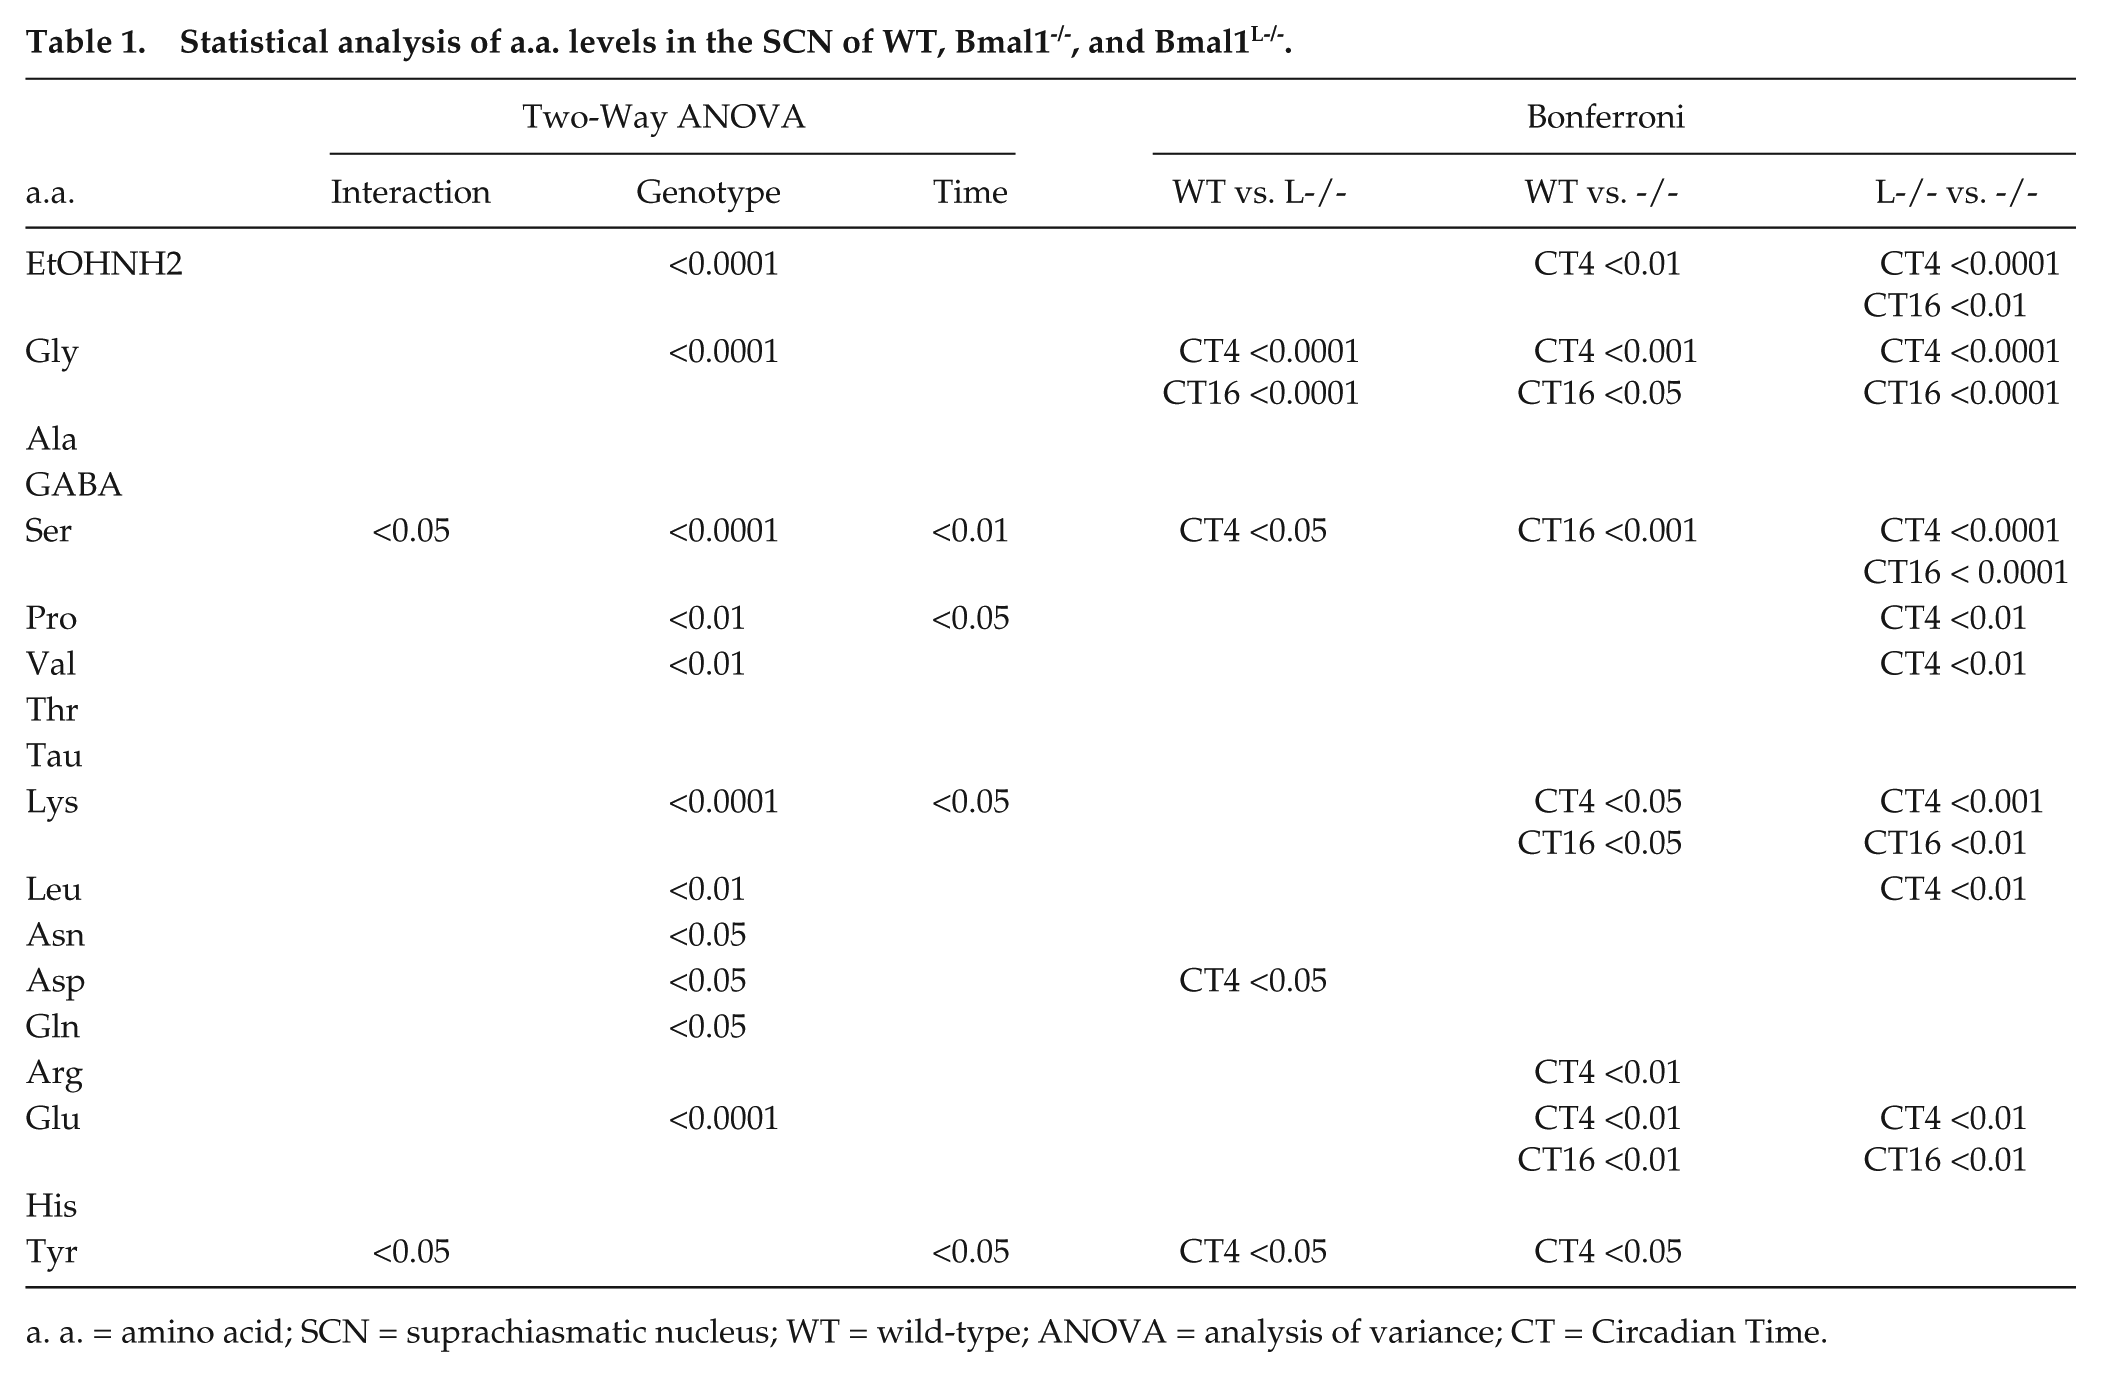
a. a. = amino acid; SCN = suprachiasmatic nucleus; WT = wild-type; ANOVA = analysis of variance; CT = Circadian Time.
We next sought to compare the above data with a.a. levels in the somatosensory cortex (Fig. 3). In this tissue, significant differences between genotypes were found for EtOHNH2, Gly, Ala, GABA, Ser, Pro, Lys, Leu, Arg, His, and Tyr. Significance between genotypes at CT4 and CT16 in Bonferroni analysis is summarized in Table 2. The direction of these changes was different between the SCN and the cortex: while the loss of Bmal1 in the whole body often led to an increase in a.a. levels in the SCN, it resulted in the cortex in a more varied pattern. While Gly and Lys showed significant differences between CT4 and CT16 in the cortex, in the SCN it was Lys, Pro, Ser, and Tyr. Lys was an interesting case, as it showed lower levels at CT16 than at CT4, in both WT cortex and SCN, but was affected differently by the loss of hepatic circadian metabolism: levels were barely affected in the SCN but blunted completely in the cortex. Moreover, while the loss of Bmal1 in the liver had little impact on SCN a.a. levels, in the cortex variations were blunted or even reversed.
Statistical analysis of a.a. levels in the cortex of WT, Bmal1-/-, and Bmal1L-/-.
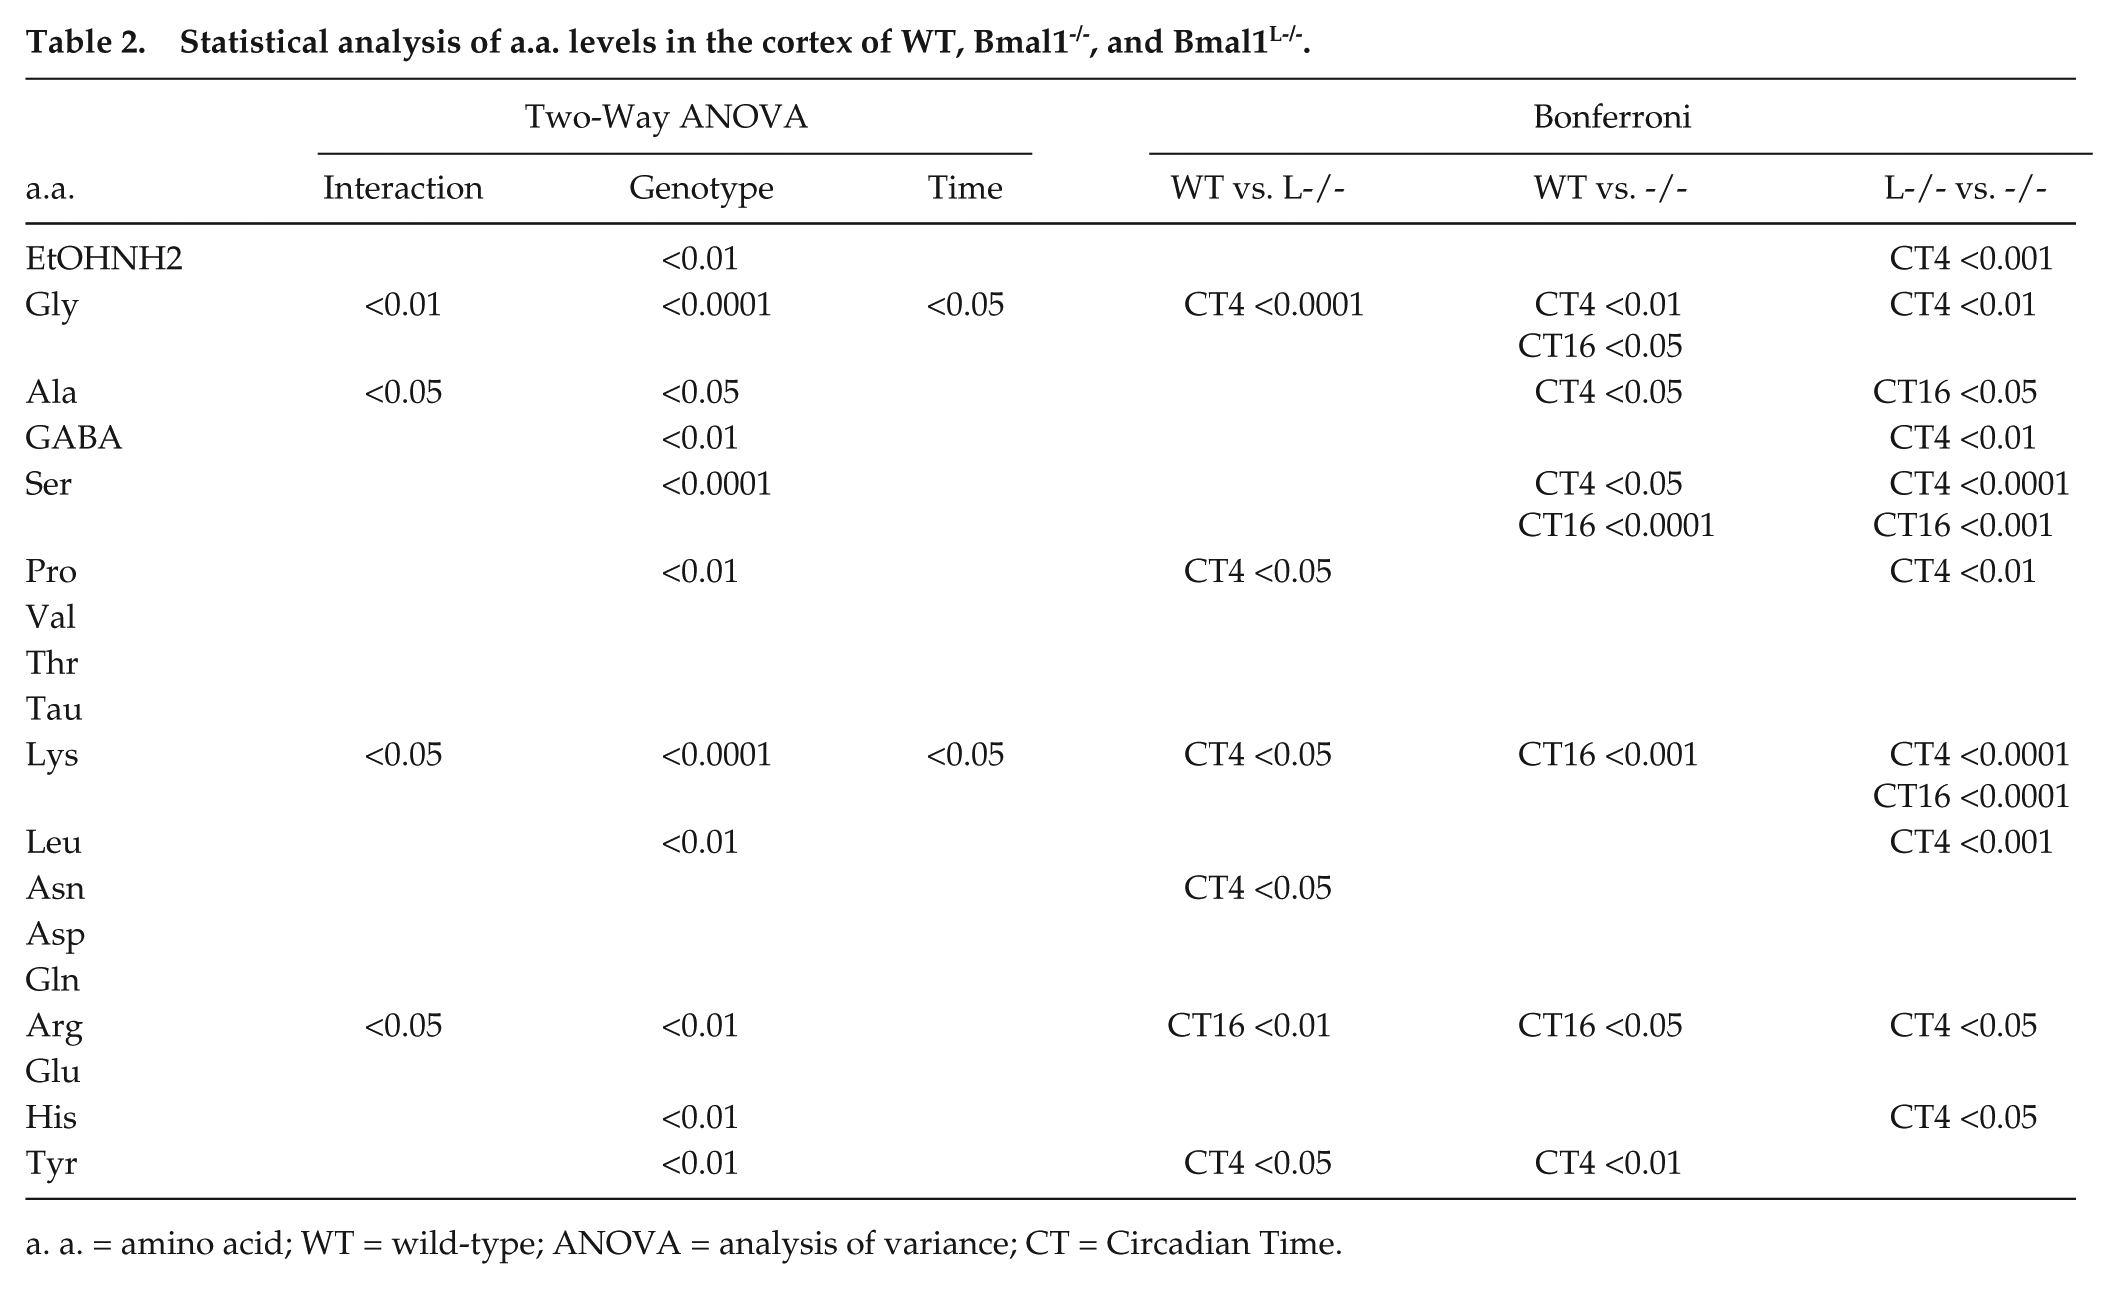
a. a. = amino acid; WT = wild-type; ANOVA = analysis of variance; CT = Circadian Time.
In the cortex, major a.a. are, in order of abundance, Glu, Tau, Gln, Asp, and GABA. Glutamate was the major a.a. in both SCN and cortex, but divergences were seen, as expected, especially for GABA, known to be the principal neurotransmitter in the SCN (Moore and Speh, 1993).
Finally, hepatic a.a. levels from the same animals were also measured (Fig. 4). The liver is the major organ for the catabolism and disposal of a.a., as it is the only tissue where the urea cycle occurs. Postprandial a.a. will mostly be carried to the liver from splanchnic tissues and will be catabolized. Therefore, the concentration of a.a. leaving the liver by the hepatic vein will be determined by the liver metabolism. While the transport of essential neutral and basic a.a. to the brain is significant, some a.a., such as the acidic Glu and Asp, can be synthesized in the brain to match metabolic demands. We thus sought to relate a.a. changes in the liver compared with those in the SCN and cortex. The first observation from the analysis is that, unlike a.a. levels in the cortex and SCN, most a.a. in the liver had higher levels at CT16. Surprisingly, while genotype had a significant effect on most a.a. in the SCN and cortex, time was the only significant source of variation in 2-way ANOVA for many a.a.: Ala, Pro, Val, Thr, Leu, Asn, and Gln. Genotype was a significant source of variation for EtOHNH2, Gly, GABA, Ser, Asp, and Arg, and significant interactions were found for EtOHNH2, Tau, Asp, and Arg. Bonferroni comparisons revealed significance between genotypes, as summarized in Table 3.
Statistical analysis of a.a. levels in the liver of WT, Bmal1-/-, and Bmal1L-/-.
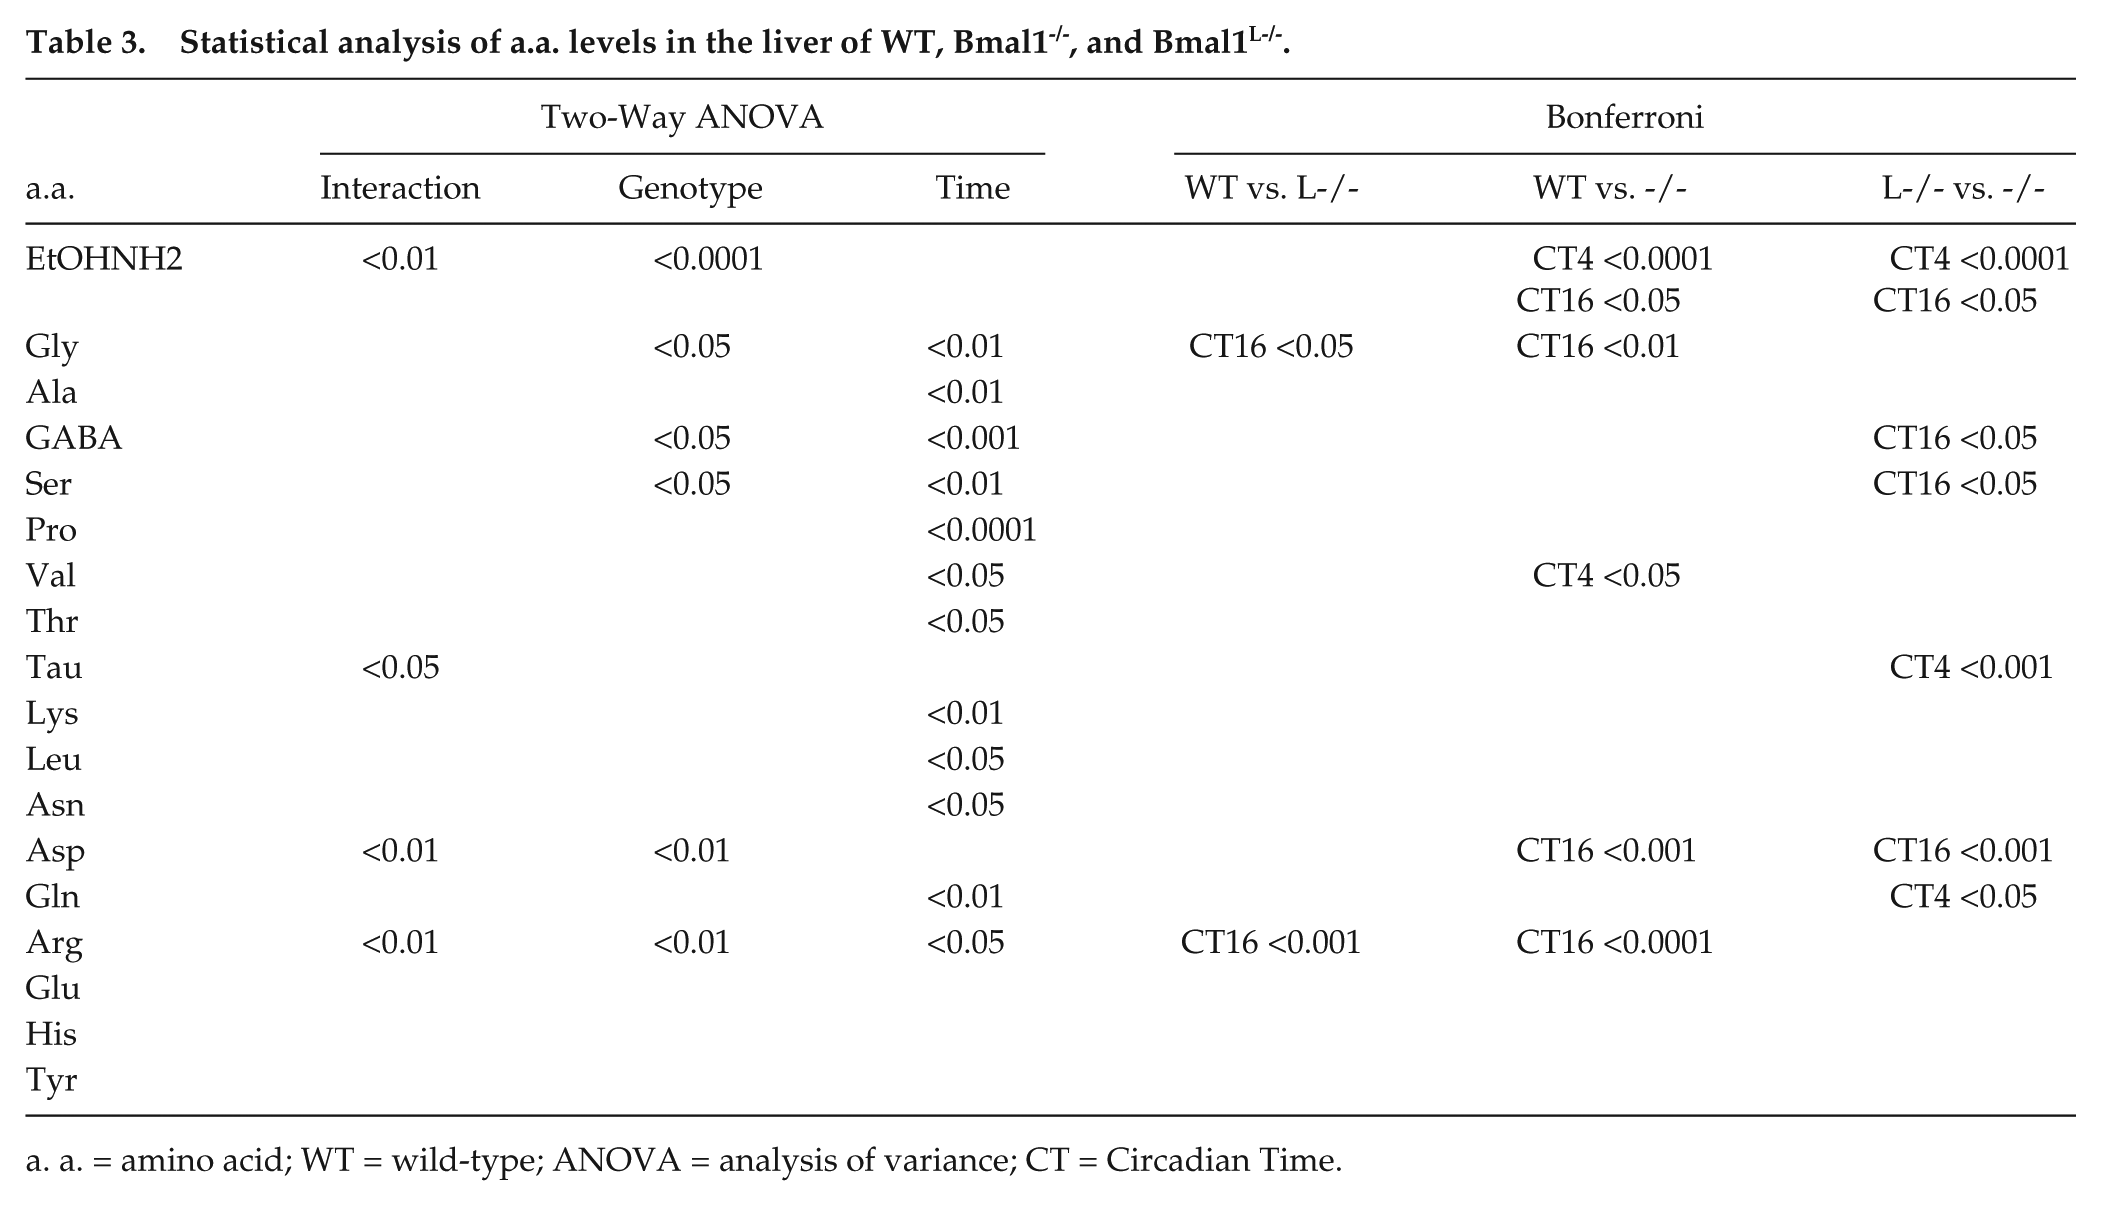
a. a. = amino acid; WT = wild-type; ANOVA = analysis of variance; CT = Circadian Time.
Discussion
Using laser microdissected mouse SCN, significant circadian changes in a.a. were found, indicating a.a. metabolism is orchestrated by the circadian clock, probably linked to their use as neurotransmitters, but also to support translation, which has been found to show circadian changes in the SCN in vitro (Shibata et al., 1992). Indeed, Leu incorporation in the SCN was reported to reach a maximum at CT22 to CT0, corresponding to the time of least abundance of most free a.a. showing significant circadian variations in our data (e.g., Lys, Pro, Ser, His). Global translation has recently been shown to be directly controlled by Bmal1 acting as a translation factor (Lipton et al., 2015). The bimodal pattern observed for many a.a. likely originates from the influence of the glycolysis and the TCA cycle, the sources of precursors for a.a. synthesis (Suppl. Fig. S2), which have been shown to be regulated by a cell-autonomous 12-h clock (Zhu et al., 2017).
Surprisingly, the loss of Bmal1 in the liver or the whole body has a more profound impact on SCN and cortical a.a. levels than in the liver itself. Of 18 a.a. reliably quantified, 11 showed significant differences between genotypes in the SCN and the cortex, but only 6 in the liver. Time-dependent changes were in contrast more significant in the liver compared with brain tissues, with Bmal1-/- or Bmal1L-/- mice often showing a nonsignificant blunting of the CT4/CT16 variations compared with WT. Amino acid levels in the liver mainly mirror food intake, with most a.a. in this tissue indeed having high levels at CT16, consistent with circadian blood plasma a.a. levels (Minami et al., 2009). Therefore, WT and Bmal1L-/- liver were expected to have similar a.a. levels. For Bmal1-/- mice with arrhythmic locomotor activity and food intake, blunted a.a. levels with high animal-to-animal variability were observed (e.g., EtOHNH2, Ala, GABA, Pro, Val, Thr, Leu, Asp, Glu), rather than abnormally high or low a.a. levels due to the disruption of endogenous metabolic control as seen for some a.a. in the brain. Moreover, some changes in a.a. appeared antiphasic in the liver compared with the SCN (e.g., Gly and Lys). As we previously noted, liver a.a. levels may be mainly determined by feeding rhythms, while those in the SCN are likely determined by solute uptake and intrinsic metabolism. Solute carriers, for example, may be rhythmically expressed in the SCN but not the liver. In addition, neurotransmitter metabolism and protein synthesis in the SCN may be temporally gated in a different manner from that in the liver, linked to the phase difference between the master and peripheral clocks.
Ethanolamine was found to be higher in all tissue in Bmal1-/- mice, which is consistent with previous reports. Ethanolamine is phosphorylated by choline/ethanolamine kinase, which is the first and rate-limiting step in phosphatidylethanolamine synthesis, known as the Kennedy pathway (Gibellini and Smith, 2010). This pathway has been shown to be regulated by the hepatic circadian clock and increases in the liver of Bmal1-/- mice (Grechez-Cassiau et al., 2015). Moreover, Bmal1-/- mice have elevated fatty acid levels (Shimba et al., 2011). Together, this supports the reliability of our method. Comparing changes in a.a. between genotypes at CT4 and CT16 is, however, limited, since the differences observed in a.a. levels could originate from simple phase shifts, rather than an increase/decrease in baseline.
Previous analyses have reported daily variations in the release of serotonin (synthesized from Trp) and glutamate from the SCN by in vivo microdialysis (Rea et al., 1993; Glass et al., 1993a, 1993b), of Asp and Glu release from organotypic SCN slices (Shinohara et al., 2000), as well as total Glu, GABA, Gln, Asp Ser, Gly, His, Arg, and Asn levels in punched rat SCN (Takeuchi and Takahashi, 1994). While significant changes were found in these released a.a., no a.a. levels from punched whole SCN were significant. The method used by Takeuchi and Takahashi (1994) was to punch three 1000 × 650 ×300 µm slices through serial rat sections (300 µm), for a total tissue volume of 5.85 × 108 µm3, which may have contained too much non-SCN tissue. Mouse SCN punches, for transcriptome analysis or immunoblot, have been previously described: two 300 × 1000 ø µm slices (total: 4.7 × 108 µm3; Mori et al., 2014), one 500 × 600 ø µm slice (total: 1.4 × 108 µm3; Tei et al., 1997), and one 300 × 600 ø µm slice (total: 0.86 × 108 µm3; Doi et al., 2011). The tissue volume sampled here is comparable to these single-slice punches, but the visualization of histology by LMD microscope and the flexibility of the dissected shape allows higher accuracy. The use of LMD coupled with fluorescence microscopy, using sections from SCN-enriched fluorescent protein reporter mice such as PER1::eGFP (Kuhlman et al., 2000), AVP-eGFP (Maruyama et al., 2010), or PER2::VENUS (Smyllie et al., 2016), should provide convenient native counterstaining for even more accurate laser microdissection.
Footnotes
Acknowledgements
This work was supported in part by the Core Research for Evolutional Science and Technology, Japan Science and Technology Agency (CREST/JPMJCR14W3, H.O.); by grants from the Kato Memorial Bioscience Foundation (J.-M. F.), the Senri Life Science Foundation (J.-M. F.), the Mochida Memorial Foundation for Medical and Pharmaceutical Research (J.-M. F.), the Kobayashi International Scholarship Foundation (H.O.), and by a Grant-in-Aid for Scientific Research on Innovative Areas (26116713, J.-M. F.), a Grant-in-Aid for Young Scientists (26870283, J.-M. F.), and a Grant-in-Aid for Scientific Research A (15H01843, H.O.) from the Ministry of Education, Culture, Sports, Science and Technology of Japan.
Conflict of Interest Statement
The author(s) have no potential conflicts of interest with respect to the research, authorship, and/or publication of this article.
Notes
References
Supplementary Material
Please find the following supplemental material available below.
For Open Access articles published under a Creative Commons License, all supplemental material carries the same license as the article it is associated with.
For non-Open Access articles published, all supplemental material carries a non-exclusive license, and permission requests for re-use of supplemental material or any part of supplemental material shall be sent directly to the copyright owner as specified in the copyright notice associated with the article.