
Abstract
Although the suprachiasmatic nucleus (SCN) has long been considered the master circadian clock in mammals, the topology of the connections that synchronize daily rhythms among SCN cells is not well understood. We combined experimental and computational methods to infer the directed interactions that mediate circadian synchrony between regions of the SCN. We analyzed PERIOD2 (PER2) expression from SCN slices during and after treatment with tetrodotoxin, allowing us to map connections as cells resynchronized their daily cycling following blockade and restoration of cell-cell communication. Using automated analyses, we found that cells in the dorsal SCN stabilized their periods slower than those in the ventral SCN. A phase-amplitude computational model of the SCN revealed that, to reproduce the experimental results: (1) the ventral SCN had to be more densely connected than the dorsal SCN and (2) the ventral SCN needed strong connections to the dorsal SCN. Taken together, these results provide direct evidence that the ventral SCN entrains the dorsal SCN in constant conditions.
Keywords
Temporal regulation of daily behaviors in mammals depends on reliable output from central pacemaker cells in the hypothalamic suprachiasmatic nuclei (SCN) (Reppert and Weaver, 2002). To generate a reliable output, the approximately 20,000 neurons of the SCN must synchronize their rhythms to each other and to external cues, such as light (Bloch et al., 2013). This is a highly complex system in which a heterogeneous set of oscillators achieves synchrony via multiple modes of intercellular communication (Welsh et al., 2010; Maywood et al., 2011; Evans and Gorman, 2016). Neither the topology of the communication network nor the intracellular mechanisms generating and responding to the signals are fully understood. Understanding how the SCN rhythms are coordinated will give important insight into multi-oscillator systems, particularly mammalian clock function.
There is evidence that rhythm coordination differs from region to region in the SCN. For example, the daily abundance of the clock protein PER2 appears as a spatial wave often from the dorsomedial to the ventrolateral SCN (Evans et al., 2011; Foley et al., 2011; Evans et al., 2013; Koinuma et al., 2013; Pauls et al., 2014), and there is a similar pattern in BMAL1 oscillations (Myung et al., 2012). In addition, the dorsal rat SCN has a shorter period than the ventral SCN when isolated in vitro (Noguchi et al., 2004) and the dorsal mouse SCN loses synchrony when isolated from the ventral SCN (Yamaguchi et al., 2003). These results and the distribution of neuropeptides and light responses in the SCN have led to a model that refers to ventrolateral (“core”) and the dorsomedial (“shell”) regions as functionally separable (Moore, 1996; de la Iglesia et al., 2004; Lee et al., 2009). For example, it has been argued that the neuropeptide vasoactive intestinal polypeptide (VIP), the primary mediator of synchrony, is synthesized by neurons primarily in the core and arginine vasopressin (AVP) is synthesized by neurons predominantly in the SCN shell. Accordingly, we use “core” and “shell” to refer to cells in the ventral and dorsal SCN, respectively.
The roles of the core and shell within the SCN are only partially understood. One simplified view is that the core is an input processor and the shell is an output generator. The core receives light input directly from the retinohypothalamic tract (RHT), and, although the shell does not (Shigeyoshi et al., 1997; Abrahamson and Moore, 2001), the shell does entrain extra-SCN tissues (Nakamura et al., 2005), implying communication from core to shell. Evidence for this role separation is seen in entrainment to light profiles with long photoperiods (duration of light), which causes the core and shell to separate in phase (Myung et al., 2015; Evans et al., 2015). Once phase separation occurs, extra-SCN brain tissues remain phase-aligned with the shell, suggesting that the shell sends time-of-day cues (Evans et al., 2015). Finally, feedback from the shell to the core is suggested by the dynamics of an SCN slice recovering from disruption—core rhythms shift to resume a steady-state phase difference from the shell rhythms (Evans et al., 2013). These results led us to test the hypothesis that the ventral SCN entrains the dorsal SCN.
Experimentation and computational models have provided insights into the relative contributions of oscillator characteristics and different coupling agents, but we lack information about the relative strength and directions of connections between the core and shell of the SCN. Using automated analyses of experimental data and modeling, this study aimed to measure intracellular properties, such as the period of oscillation, and intercellular network interactions that mediate resynchronization. Specifically, we took advantage of our ability to chemically isolate neurons with tetrodotoxin (TTX) and then remove the toxin to allow the SCN to recover its synchrony. We employed a clustering method that, while blind to cell location, revealed the core-shell spatial organization and stabilization of core rhythms prior to those of the shell. We then used a computational model to infer that the network topology within the core is likely denser than that of the shell, and that the strength of the connections from the core to the shell is likely to be much higher than that of connections from the shell to the core. Taken together, these results imply that, in constant conditions, the core entrains the shell.
Materials and Methods
Experimental Methods: TTX Treatment
Animals
Mice expressing a fusion of the mouse PERIOD2 and firefly Luciferase proteins (PER2::LUC) were housed in a 12-12 h light-dark cycle in the Danforth Animal Facility at Washington University. PER2::LUC knock-in mice (generously provided by J. S. Takahashi, University of Texas Southwestern Medical Center; Yoo et al., 2004) were backcrossed with C57Bl/6JN (The Jackson Laboratory, Bar Harbor, ME) and bred as homozygous pairs. All procedures were approved by the Animal Care and Use Committee of Washington University and followed National Institutes of Health guidelines.
Bioluminescence recording
SCN were prepared as 300-μm coronal slices and cultured as described previously (Webb et al., 2009; Aton et al., 2005). Briefly, explants from PER2::LUC neonates (postnatal day 15) were maintained at 36 °C on Millicell-CM inserts (Millipore, Billerica, MA) in 1 ml of medium (Dulbecco’s Modified Eagles Medium, DMEM, supplemented with 10% fetal bovine serum and 0.1 mM beetle luciferin (BioThema). Bioluminescence images were collected (1 h exposures; 1024 × 1024-pixel resolution) with a cooled CCD camera (Andor, Ikon) for a minimum of 18 days. After 4 days of baseline recording, we treated organotypic SCN explants with 2.5 µM tetrodotoxin (TTX, Sigma-Aldrich, St Louis, MO; Webb et al., 2009). TTX remained in the medium for 6 days. Afterwards, the medium was washed thrice and replaced with 1 full volume exchange of fresh medium with luciferin. Recording then continued for at least 8 days to examine resynchronization after restoration of intercellular communication.
Data Analysis: Cell-based and Pixel-based Analyses of PER2::LUC Expression
We used an automated method to track gene expression in each pixel within the cultured SCN. Each bioluminescence image stack was pre-processed to construct a coarse-grained stack of images with separate stacks for the left and right halves of the SCN, as in Pauls et al. (2014). For each half of the SCN, pixels above a manually defined threshold established those in the background and those within the bilateral SCN (n = 5 bilateral SCN of 632 × 658; 757 × 810; 649 × 704; 1024 × 1024; and 640 × 512 pixels, with the area of a pixel approximately 1 µm2). We averaged adjacent 4 × 4 pixels into superpixels for clustering and time-series analyses.
We then compared results from the automated pixel-based method to results from manually tracked gene expression in individual cells. We drew circular Regions of Interest (ROIs, 60 μm2) over each visually identified cell in each frame of the background-subtracted movie and measured the integrated intensity from each discriminated cell over time.
Experimental Methods: Immunohistochemistry
After recording bioluminescence, we immunolabeled a representative SCN culture for the neuropeptides VIP and AVP. Explants were fixed using 4% paraformaldehyde, incubated in 4% sucrose overnight, and then double-immunolabeled with rabbit anti-VIP (Immunostar, Hudson, WI; 1:2,000) and guinea-pig anti-AVP (Peninsula Laboratories International, San Carlos, CA; 1:2,000) followed by donkey anti-rabbit IgG conjugated to Cy2 (Jackson ImmunoResearch Laboratories, West Grove, PA; 1:50) and donkey anti-guinea-pig IgG conjugated to Alexa 594 (Jackson ImmunoResearch Laboratories; 1:50) using published methods (Webb et al., 2009). To register the fluorescence and bioluminescence images, we aligned the third ventricle in both and scaled the fluorescence image so that the lateral edge of the SCN was aligned with that of the bioluminescence image.
Data Analysis: Clustering Based on PER2 Dynamics
To identify cells with similar resynchronization dynamics, we applied a k-means clustering algorithm to the PER2:LUC time series. K-means clustering sought to partition the PER2 expression traces into groups, where k is the number of clusters, such that the members of each cluster were the most like each other (i.e., minimizing the distance between each time series within a cluster and the mean time series of the cluster). We used 2 distance metrics: The squared Euclidean distance (the component-wise arithmetic mean of all the time series in the cluster) and the correlation distance (one minus the sample correlation between time series, where the cluster mean was the component-wise arithmetic mean of all the time series in the cluster after each was normalized to zero mean and unit standard deviation). We applied MATLAB’s kmeans function (The Mathworks, Natick, MA) 100 times to each half of the SCN to ensure that we arrived at a consistent clustering.
Data Analysis: Clustering Based on VIP and AVP Immunofluorescence
We tested whether clusters of PER2 expression related to VIP and AVP localization by independently clustering the VIP and AVP fluorescence images. We sorted pixels by fluorescence level using combinatorial clustering analysis and assigned pixels to clusters by minimizing the difference between the fluorescence of each pixel and the mean of its cluster. The cluster mean was the mean fluorescence of the pixels in the cluster. We used these clusters to correlate resynchronization dynamics and VIP or AVP localization in the SCN as the percent overlap between the fluorescence and bioluminescence clusters.
Data Analysis: Determining Spatial Patterns
We then tested whether there was a spatial pattern inherent to the PER2 dynamics. K-means clustering with the correlation distance showed an apparent phase wave from the dorsal to ventral SCN, whereas clustering with the squared Euclidian distance revealed concentric oval-like regions with high amplitude in the center and low amplitude on the edge of the SCN. To determine whether clusters in a unilateral slice were spatially distinct from other clusters, we first computed the Euclidean distance d from each superpixel (or cell, for the cell-based analysis) to the ventrolateral corner (for phase-based clustering) or the center (for amplitude-based clustering). We then compared the distributions of distances for each cluster and considered clusters spatially distinct if their means were significantly different with a one-way ANOVA test.
Data Analysis: Determining Period and Synchrony
To compute the period and synchronization index every hour, we used a Morlet wavelet transformation. We first normalized each time series to the range between zero and unity and then determined the instantaneous phase and period using the Wavos (Harang et al., 2012) MATLAB toolkit. The instantaneous phase was then used to compute the synchronization index at time
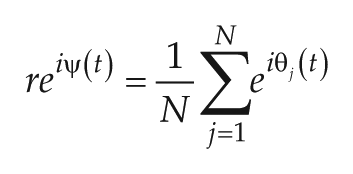
where
Mathematical Model
Our goal was to determine the network topology that would produce the observed PER2 dynamics. To test different network topologies, we used a model that allowed us to specify the intrinsic circadian properties and connectivity of the cells (Webb et al., 2012). The basic components of the model include the phase and amplitude of each oscillator, the intercellular signaling of a given network topology, and phase and amplitude adjustments that individual cells make in response to intercellular signaling (Webb et al., 2012).
For the clock in each cell, the model is a generic 2D limit cycle oscillator in polar coordinates with 2 key additions that allow it to behave like a weak oscillator: 1) increased amplitude decreases the phase response, and 2) the amplitude increases in response to signaling from other cells (Webb et al., 2012). By modeling weak oscillators, we could capture the resynchronization behavior of the cells upon recoupling. The ordinary differential equations (ODEs) for the model are,
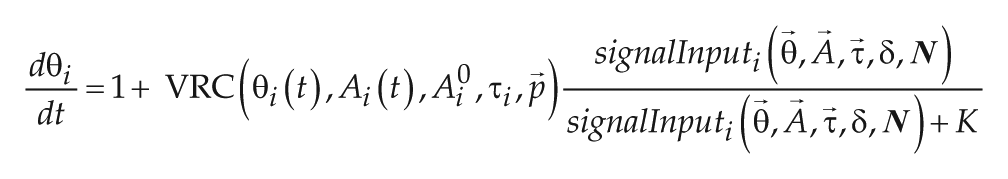
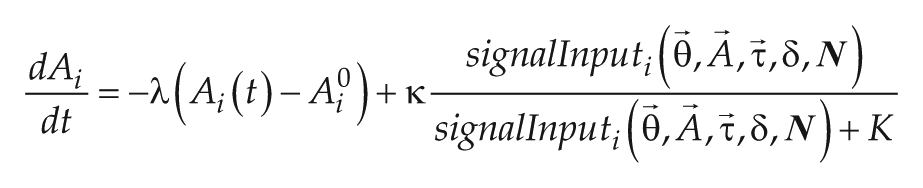
where
Mathematical Model: A Library of Viable Response Characteristics
We identified response characteristics (VRC parameter values) that enabled the model to simulate an SCN slice as it recovered from TTX treatment. The values of 4 parameters were fixed for all simulations
Each set of parameters was used to simulate 360 h of recovery from TTX. In addition to the parameters, the simulation required a network topology, an intrinsic period for each oscillator, and initial values for the phase and amplitude of each oscillator. The shell was constructed as a 13 × 13 grid of oscillators with a nearest-neighbor topology, and the core was constructed as a 13 × 13 grid of oscillators with a nearest-neighbor topology plus additional randomly chosen long-range connections (see Fig. 3C, center). To connect the core and shell, we added network edges from the core to the shell such that each oscillator in the shell received a signal from one randomly chosen oscillator in the core. We repeated that process for the core, so that each oscillator received a signal from one oscillator in the shell (see Fig. 3B, left). The strength of the connections between the regions was the same as the strength of the connections within each region (see Fig. 3C, center). Intrinsic periods were chosen to match the distribution of periods observed from the SCN slices during TTX treatment: The intrinsic period for each core oscillator was chosen from a Gaussian distribution centered at 25.1 h with a standard deviation of 1.3 h, and the intrinsic period for each shell oscillator was chosen from a Gaussian distribution centered at 23.9 h with a standard deviation of 1.9 h. The initial values of the phase for each cell were chosen from a random, uniform distribution in the range of 0 to 24 (to indicate the asynchrony in TTX). The initial values of the amplitudes for each were at unity. We numerically integrated the above ODEs using Matlab’s ode15s and generated a trajectory for which the dynamics could be evaluated.
Of the 10,670 parameter sets tested, 83 met the following criteria: The simulated cells reached a stable period of 24-27 h (with a standard deviation of cycle-to-cycle differences for the last 5 cycles less than 0.1 h) and the peak of the average core per2 mRNA trace (computed as a sine curve that is a function of the phase and amplitude of each oscillator) was between 0 and 6 h after the peak of the average shell per2 mRNA trace. We refer to the 83 parameter sets meeting the above criteria as the library of “viable response characteristics”.
Mathematical Model: A Library of Network Topologies
We developed a library of network topologies that included the following variations in local and long-distance connections between the cells and in the location of cells with different intrinsic periods: 1) Regional networks had nearest neighbor connections and a 5% chance for additional long-range connections between pairs of oscillators within the region; 2) Connections between the regions were designed so that the number of connections received by each oscillator could be between 1 and 5; 3) The strength of the connections between regions ranged from 0 to 1 (where 1 is the strength of connections within a region); and 4) We tested networks where the cells with longer circadian periods were placed either in the core or in the shell (Supplemental Table S6). This produced a library of topologies with 1,320 possible states: 3 regional networks, up to 5 connections between cells in different regions, 11 possible connection strengths, and 8 possible period distributions.
Results
The SCN Recovers from TTX-induced Desynchrony with a Spatial Pattern in Phase
It is unclear what cellular and network properties underlie the observed wave of PER2 expression from dorsal to ventral SCN (Evans et al., 2011; Foley et al., 2011; Fukuda et al., 2011; Pauls et al., 2014). The stereotyped recovery of circadian synchrony after removal of TTX (Yamaguchi et al 2003; Webb et al., 2009; Evans et al., 2011) presents a unique opportunity to test the roles of differences in regional intrinsic periods, amplitudes, and connections within the SCN. We have previously shown that this TTX treatment blocks action potentials in all SCN neurons (Aton et al., 2006). We therefore tested the hypothesis that the dynamics of recovery from TTX could be used to infer whether and how the ventral and dorsal SCN influence each other. Consistent with prior reports (Yamaguchi et al 2003; Webb et al., 2009; Evans et al., 2011), we found that oscillators in the SCN showed reduced synchrony (n = 5 slices) during the 6 days of TTX treatment and regained synchrony following removal of TTX (Fig. 1A, Suppl. Fig. S2). We used k-means clustering to identify groups of cells that were most similar to each other before, during and after TTX treatment (note that to cluster data during the treatment, we eliminated the first 2 days of treatment so that the organization inherent from the base condition did not have a strong effect on the results). Clusters found using correlation distance (phase-based clustering; Fig. 1C) showed the canonical dorsal to ventral phase wave in all recorded SCN before and after, but not during, TTX treatment. Clusters found using the squared Euclidean distance (amplitude-based clustering, Fig. 1D) showed higher amplitude oscillations in the center of each unilateral SCN before, during, and after TTX treatment, consistent with prior results from untreated SCN (Fig. 1D; Pauls et al., 2014). These results indicate that the dynamics of resynchronization after TTX removal reliably reflect the restoration of regional organization within the SCN, with no evidence for TTX-induced changes in network architecture.
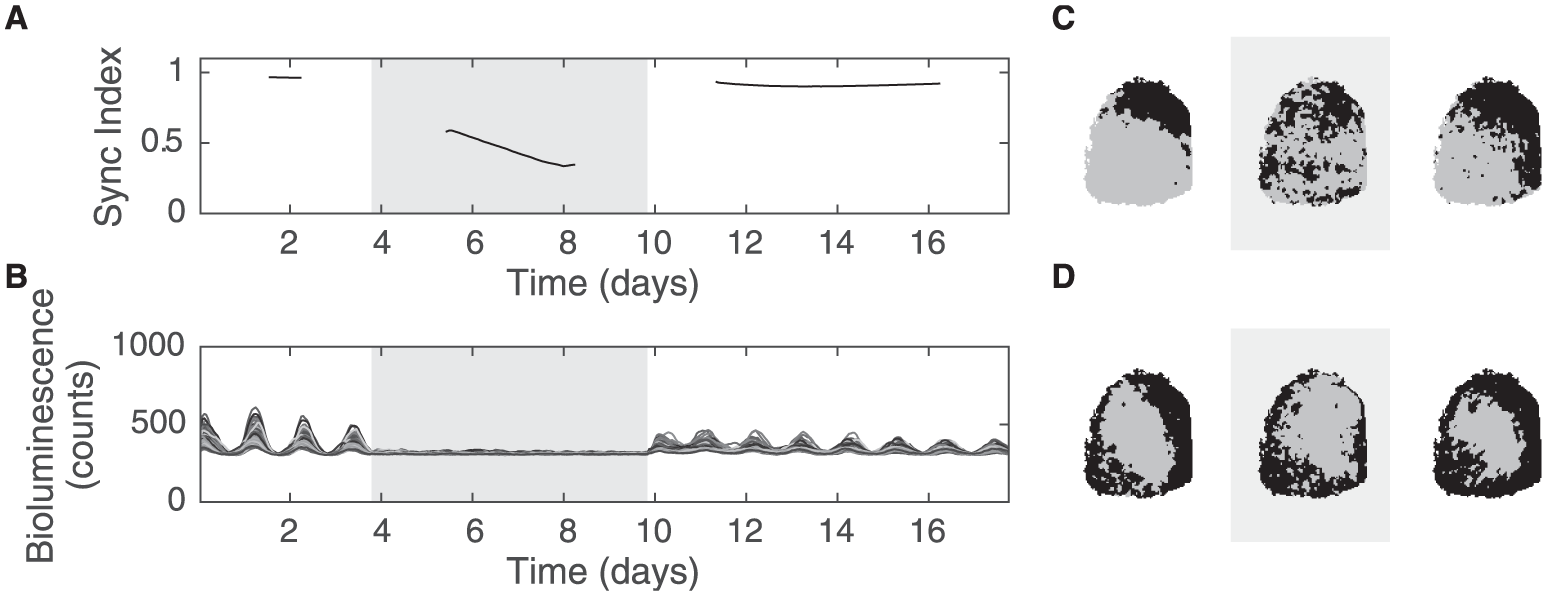
Suprachiasmatic nucleus (SCN) cells resynchronize as 2 groups. Representative data from SCN cells in a slice show the loss and restoration of coordinated daily rhythms in PERIOD2 (PER2) expression during and after treatment with tetrodotoxin (2.5 μM TTX) for 6 days (grey background). (A) Upon removal of TTX, the Synchronization Index returned to a value close to 0.9, indicating that cells were oscillating roughly in phase with the same circadian period. (Note that the computation requires each experimental condition to be evaluated separately, and that the phase cannot be estimated accurately during the first or last 1.5 cycles, leaving gaps of time during which we cannot assess the degree of synchrony.) (B) PER2 expression from representative regions of the SCN (each trace comes from every 100th 4 × 4-pixel group). K-means (k = 2) clustering analyses of the traces revealed similar spatial organization of these SCN cells before and after TTX treatment based on their average peak time (C, gray cells had a later peak time than black cells) or their mean amplitudes (D, gray cells had higher amplitude than black cells). Note that the unilateral slice is shown with the dorsomedial region up and to the right.
The Ventral Region Is Intrinsically Slower, Stabilizes Its Period Earlier, and Peaks Later than the Dorsal Region
We were intrigued to find that the 2 identified clusters were reliably and spatially distinct (one-way ANOVA followed by a Tukey HSD test, p < 0.00001, see Methods for details) and could be optimally separated using linear discriminant analysis (Hasty et al., 2009) into dorsal and ventral regions, with fewer than 23% of the superpixels on the wrong side of the line (Fig. 2, Suppl. Figs. S3, S4 and S5). We therefore refer to the functionally similar clusters of cells as ventral and dorsal groups.
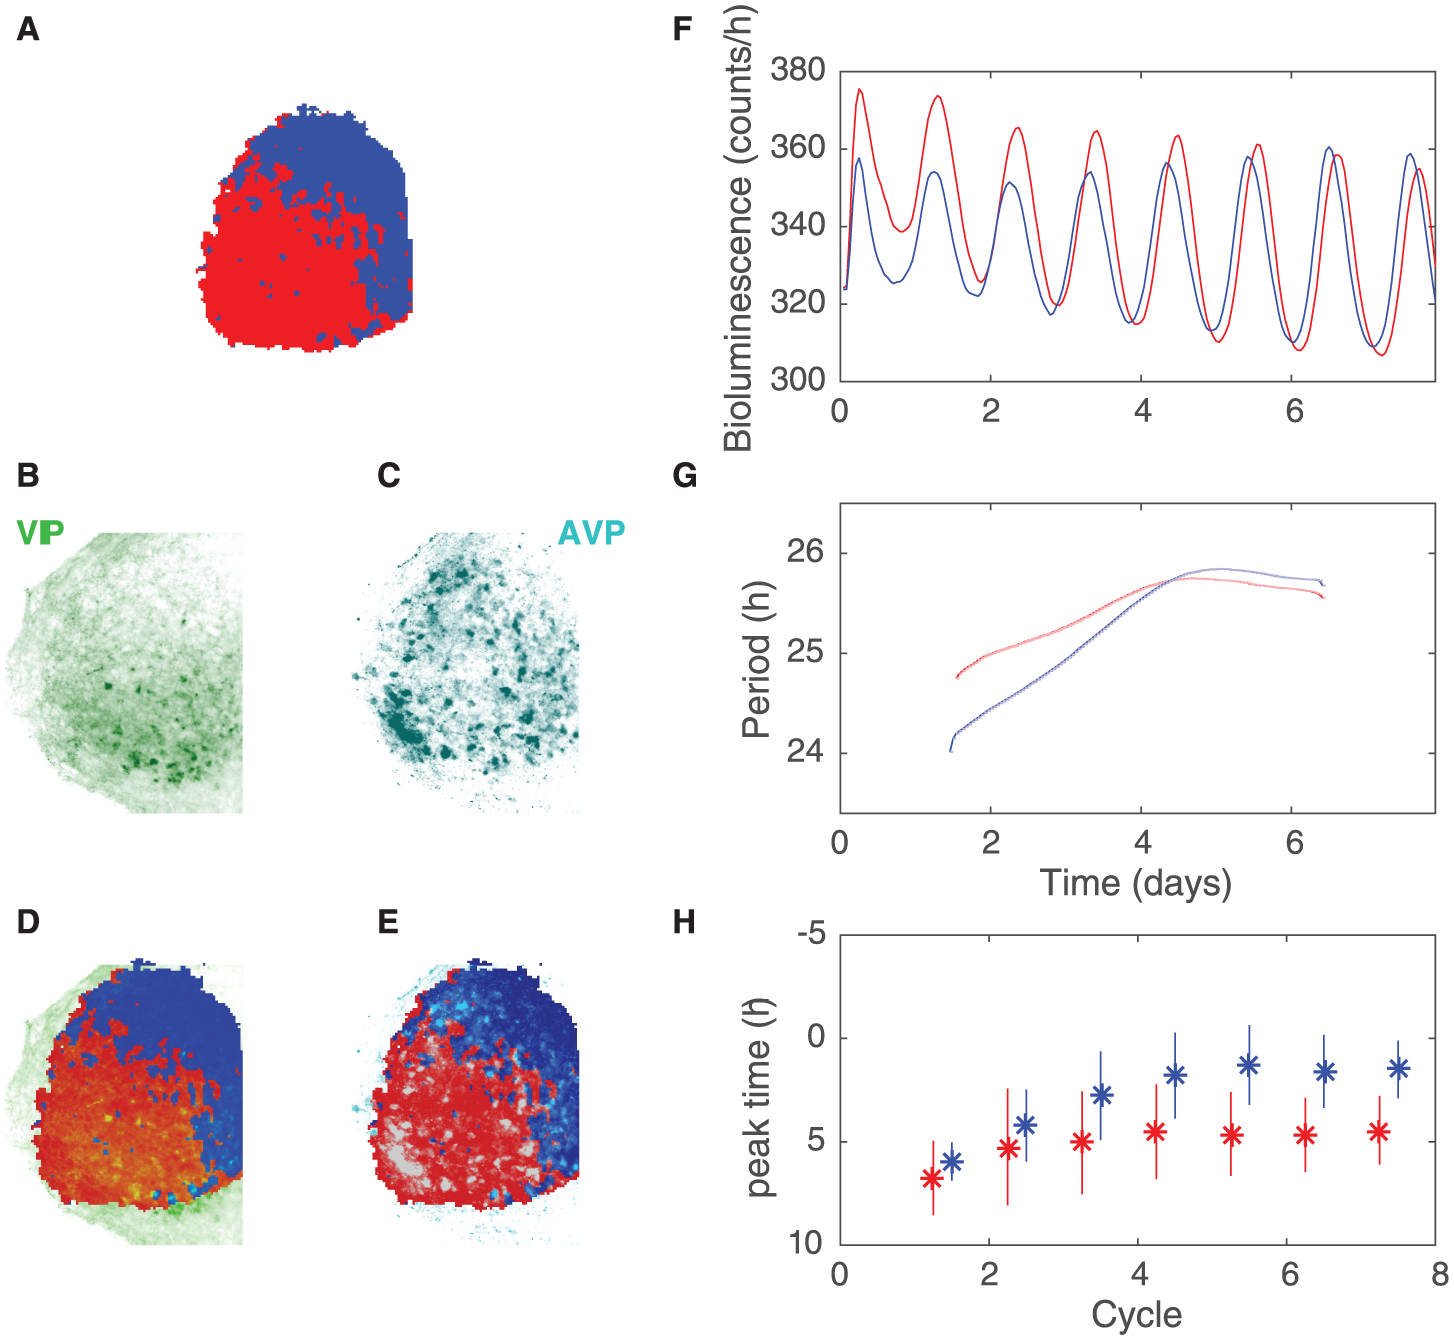
Automated clustering shows that, following removal of tetrodotoxin (TTX), the dorsal region attains a stable period after the ventral region and an earlier time of peak PERIOD2 (PER2) expression. (A) Clustering of cells in the left half of the representative suprachiasmatic nucleus (SCN) from Figure 1, based on the phasing of their PER2 expression (colors as in Fig. 1C). (B) Vasoactive intestinal polypeptide (VIP) and (C) Arginine vasopressin (AVP) immunolabeling. (D) VIP immunolabeling overlaid with PER2-based clustering indicates VIP (green) localizes predominantly within the red group of cells. (E) AVP (cyan) localizes within both clusters of cells. (F) The mean PER2 expression following removal of TTX within the ventral (red) and dorsal (blue) groups of cells. Note that PER2 expression within the dorsal cells gradually increases in amplitude and synchronizes to peak just before the daily peaks in the ventral cells. (G) The mean periods of cells in the ventral (red) cluster reaches a stable period sooner than those in the dorsal SCN (blue). (H) The peak times (mean ± SD) of daily PER2 expression gradually synchronized within the SCN so that, in steady state, dorsal (blue) cells peaked 2.4 h earlier than ventral cells (red).
To characterize oscillations intrinsic to the 2 groups, we quantified the mean period during hours 50 to 100 of TTX treatment for each super-pixel (Suppl. Table S1). During TTX exposure, the periods of the ventral group (25.0 [0.3] h; mean [SD]; n = 10 unilateral SCN) were consistently longer than those in the dorsal group (24.4 [0.5] h). We found similar results analyzing data from manually discriminated cells rather than automated superpixel analysis (n = 4 unilateral SCN; Suppl. Table S2). We conclude that ventral cells tend to express intrinsically slower circadian periods than dorsal SCN cells.
We then quantified the dynamics of circadian resynchronization. We found that the mean period of oscillations in both the ventral and dorsal groups stabilized after removal of TTX. We defined the time of period stabilization when the mean period remained within 0.25 h for the remainder of the recording. We found that the circadian period of the ventral cluster stabilized 30.0 (24.9) h before the dorsal cluster (mean [SD], n = 10 unilateral SCN; Suppl. Tables S1 and S2). Intriguingly, the greater the difference in the intrinsic periods between regions, the longer it took the dorsal cluster to stabilize its period to the period of the ventral cluster after removal of TTX (Suppl. Fig. S6A). Once the period stabilized, the time of peak PER2 expression in the dorsal cluster preceded the peak expression in the ventral cluster by 2.4 (0.9) h (Fig. 2, Suppl. Figs. S3, S4, S5, Suppl. Tables S1 and S2). We conclude that steady state synchrony within the SCN was obtained when the dorsal region had a stable circadian period and a daily peak in PER2 a few hours before the daily peak in the ventral SCN. Importantly, the reliable resynchronization of the dorsal SCN after the ventral SCN suggests that cells in the ventral SCN evoke the changes in the dorsal cells.
The Two Functionally Identified Regions Are Defined by Areas of High and Low VIP Expression
We sought to determine the relationship between VIP and AVP fluorescence with the ventral and dorsal phase-based clusters. After recording PER2 resynchronization dynamics for 8 days in one SCN culture, we fixed and immunolabeled the cells for VIP and AVP and quantified fluorescence above background levels (Fig. 2B and 2C). We found that the VIP fluorescence in the cell bodies and processes overlapped with 72% of the pixels in the ventral and 32% of pixels in the dorsal clusters (Fig. 2D and 2E). In contrast, AVP fluorescence colocalized with 74% and 65% of pixels in the ventral and dorsal clusters, respectively. This indicates that, whereas AVP is found about equally in both clusters, VIP is significantly more associated with the ventral region.
Models with Dense Connections Within and From the SCN Core Mimic PER2 Resynchronization Dynamics
To further test our hypothesis that the ventral SCN entrains the dorsal SCN during resynchronization, we used an established mathematical model of the SCN (Webb et al., 2012) to measure the effects of different network topologies on circadian resynchronization (Fig. 3). We compared the resynchronization properties of 1,320 networks that differed in the number of connections within or between 2 regions, the strength of the connections between these regions, and the distribution of the periods of each region (Fig. 4). In this way, we tested a core-shell model of the SCN for resynchronization dynamics with the full range of possible connectivity patterns and strengths, and a restricted range of intrinsic periods based on experimental data (Suppl. Table S6). We tested each topology with all 83 VRCs. We considered a particular topology to be realistic if the simulated core and shell matched the behaviors of our recordings of the ventral and dorsal clusters. Specifically, we sought models that fulfilled the following criteria: 1) The core stabilized its circadian period before the shell; 2) the stabilized period was between 24.9 h and 25.7 h (within 10% of the range of experimentally observed periods); 3) PER2 expression in the shell peaked at least 10 min earlier than the core at steady state; and 4) The mean synchronization index throughout the simulation after TTX removal was at least 0.9. For the first criterion, we applied a Student t test (p < 0.05) to the distribution of differences in stabilization times. For the remaining criteria, we used the average across the simulations for all VRCs. Topologies that met these criteria were rare (57 of 1,320). Networks that behaved like the SCN share the following 2 essential features: The core had denser connections (random within-region connections in addition to the nearest neighbor) than the shell, and stronger connections to the shell as compared with the shell-to-core connections. Surprisingly, neither the number of connections between the regions nor the strength of connections from the shell to the core was important for realistic simulations. In contrast, core-to-shell connections required 80% to 100% full strength for realistic results, implicating strong core-to-shell connections as necessary mediators of SCN resynchronization. We then further tested these networks to see if increasing the difference between the intrinsic periods would lead to a greater difference in period-stabilization time (as was observed experimentally, Suppl. Fig. S6A). It did, but only for networks with much stronger connections from the core to the shell than the reverse, strengthening our conclusion that core-to-shell connections are necessary for resynchrony (Suppl. Fig. S6B).
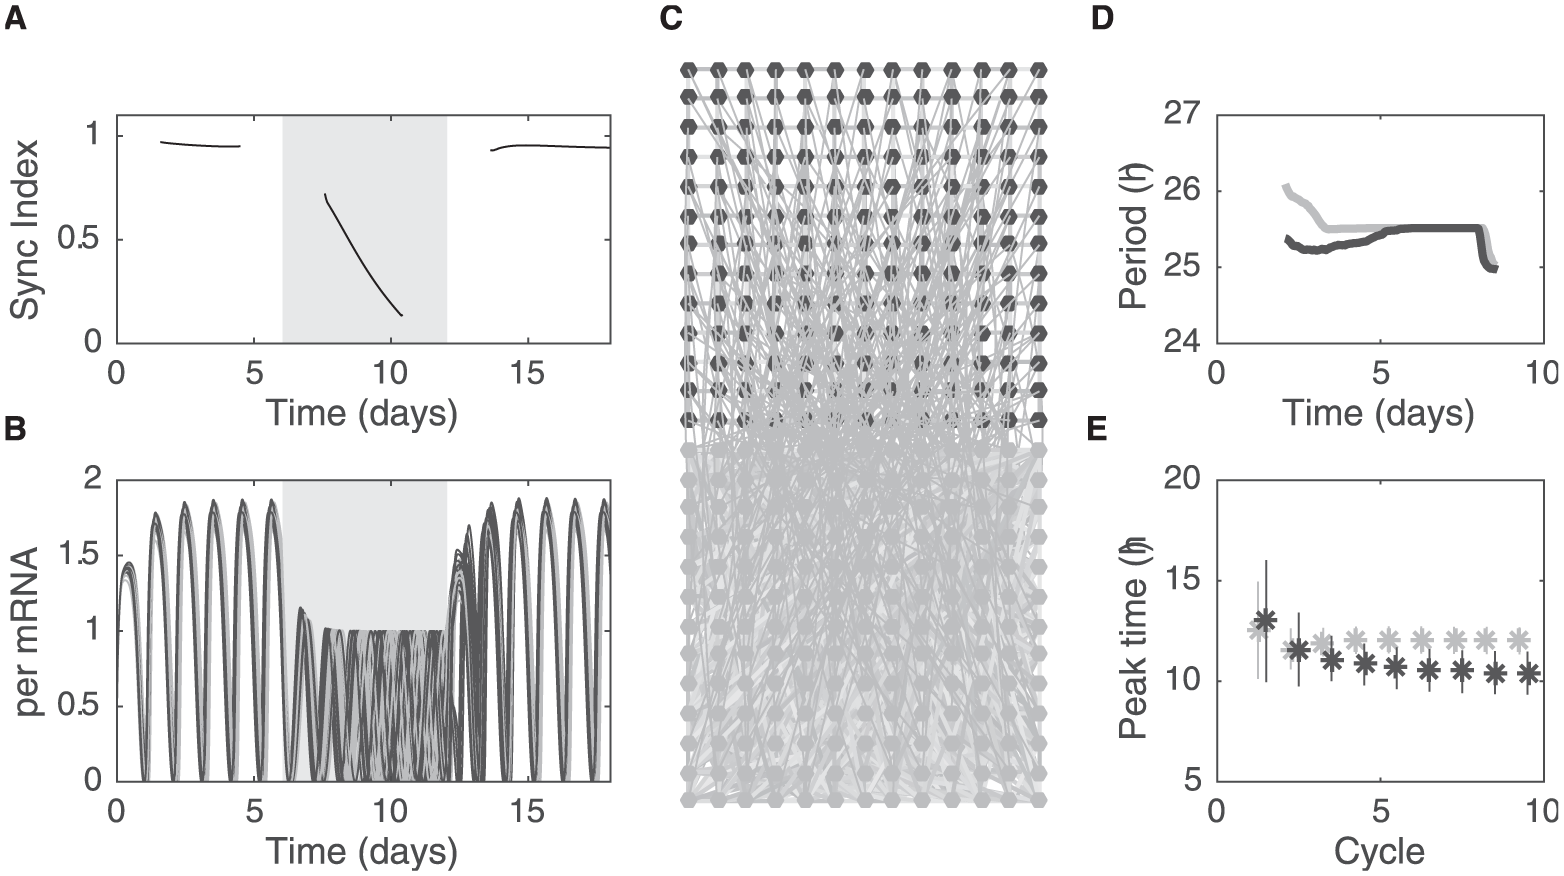
Mathematical model capturing the key characteristics of suprachiasmatic nucleus (SCN) resynchronization dynamics. Shown is a representative result from simulating the conditions before, during, and after tetrodotoxin (TTX) administration. (A) The synchronization index and (B) the simulated per mRNA traces for every 10th oscillator (core oscillators in gray, shell oscillators in black) show that oscillators lost amplitude and phase coherence during TTX treatment and regained both after the wash restored intercellular communication. (C) Representative network consisting of a 13 × 13 grid of core cells (gray, connected with a nearest-neighbor network and additional long-range connections) and a 13 × 13 grid of shell cells (black, connected with a nearest neighbor network). There is one connection to each shell cell from a randomly chosen core cell and one (weak) connection to each core cell from a randomly chosen shell cell. (D) The mean period over time and (E) mean peak time for each cycle (gray for core cells, black for shell cells) followed trajectories similar to those recorded from SCN slices. In particular, the mean period of core oscillators stabilized before that of the shell, and the daily peak PERIOD (PER) expression was highest in the shell cells earlier than those in the core.
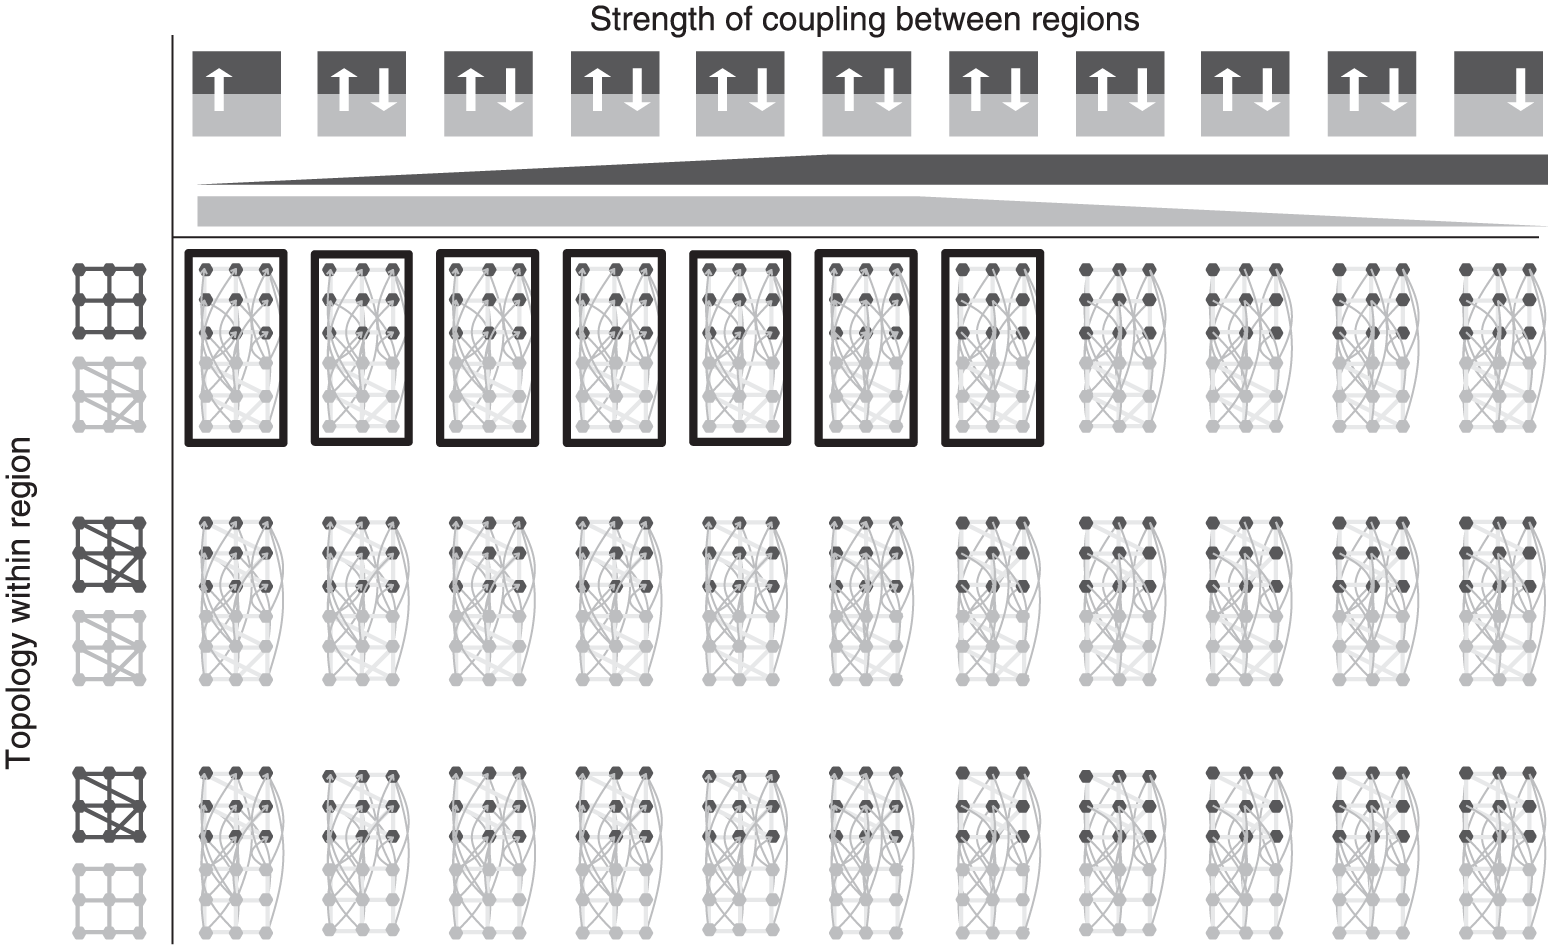
Network topologies that simulate realistic resynchronization dynamics have a denser network in the suprachiasmatic nucleus (SCN) core, a sparser network in the shell, and strong connections from the core to the shell. Of the 1,320 network topologies tested, those resulting in realistic resynchronization dynamics (black boxes) had dense connections (lines) between cells (dots) within the core region (gray), but not the shell (black). The representative network shown in Figure 3 is the second entry in the first row of model networks shown here. Networks with stronger connections from the core to the shell (arrow from gray to black regions) resynchronized similar to cells within the SCN. Networks varied in regional topology (rows) and the strength of coupling between regions (columns). The graphical labels above the first row indicate the strength (white arrow for full strength, transparent for zero strength; gray wedge at full height indicates full strength connections from core to shell; black wedge height indicates strength of connections from shell to core).
Other network features modulated the rate of resynchronization. When connections between the core and shell were of equal strength but the intra-regional connections differed in density, the region with the denser topology stabilized its period first. When the density was the same in both regions, the mean intrinsic period played a role: in 30 of 40 of the topologies with dense networks in both regions, the region with the faster average intrinsic period stabilized first. The average intrinsic period determined where per2 mRNA peaked first: in all 120 topologies, the faster region peaked first. Increasing the number of connections between the regions led to decreasing differences in core and shell peak times: for 118 of 120 topologies, the difference in peak times decreased for every rise in the number of connections.
Two Clusters Accurately Capture the Resynchronization Dynamics of the SCN
Although we could discriminate 2 spatially distinct clusters based on PER2 expression before and after TTX, it is possible that more groups contribute to the resynchronization dynamics of the SCN. Using both amplitude- and phase-based clustering with up to 10 clusters (k = 1 to 10), we analyzed the PER2::Luc bioluminescence from the 5 bilateral SCN (Suppl. Fig. S9). Before TTX was added, phase-based clustering revealed groups that were arranged along the dorsomedial to ventrolateral axis of the SCN (Suppl. Figs. S7A and S8A, Suppl. Information). This organization was lost during TTX treatment and restored after TTX removal. The largest decrease in cluster spread (evaluated as the sum of the squared correlation distances, or SSD, from each point to the center of its cluster) occurred when k increased from 1 to 2 (Suppl. Fig. S9). Although increasing the number of clusters further produced clusters with smaller spreads, the improvements were minimal (Suppl. Fig. S9). Similarly, amplitude-based clustering revealed 2 spatially distinct groups of cells regardless of the number of clusters sought (Suppl. Fig. S7B and S8B). We concluded that the dynamics of resynchronization were effectively captured by evaluating each SCN for 2 clusters of cells with similar phase trajectories.
Modeling Indicates that Network Reorganization Due to Light Entrainment Likely Requires Changes in the Network
Recent work examining the reorganization of the SCN following entrainment to long days was interpreted as evidence for communication in both directions between the central and dorsal SCN (Evans et al., 2013). The authors found that, for example, the dorsal SCN led the central SCN by approximately 2 to 4 h when taken from mice exposed to 12 h of light per day, but a 6 h lead by the central SCN when the mice were exposed to 22 h of light per day. We therefore tested the entrainment properties of our SCN models in daily photoperiods of 12, 14, 16, and 18 h (Fig. 5) (18 h was chosen as the longest photoperiod because the model was unable to entrain to longer photoperiods). Again, we used a nearest-neighbor network with additional long-range connections and longer periods for the core, and a nearest-neighbor network and shorter periods for the shell. We used the same values for the number and strength of inter-regional connections as considered above as well as the same 83 VRCs. We simulated entrainment for 15 days and considered the entrainment to be successful if the mean periods of both the core and shell were within 0.1 h of 24 h and if the mean synchronization index remained above 0.9. For simulations that entrained, the SCN followed the same trend observed by Evans et al. (2013)—the shell lost its lead with increasing photoperiod. However, the absolute changes in the model were smaller, so that the shell always peaked ahead of the core (Fig. 5B-5E). For example, Evans et al. (2013) observed a change in peak difference of approximately 5 h when the photoperiod increased from 12 h to 18 h. We observed a 0.8-h change in peak time difference for the same increase in photoperiod. The model thus captured the qualitative, but not absolute, changes in the core-shell phase relationships with lengthening photoperiod.
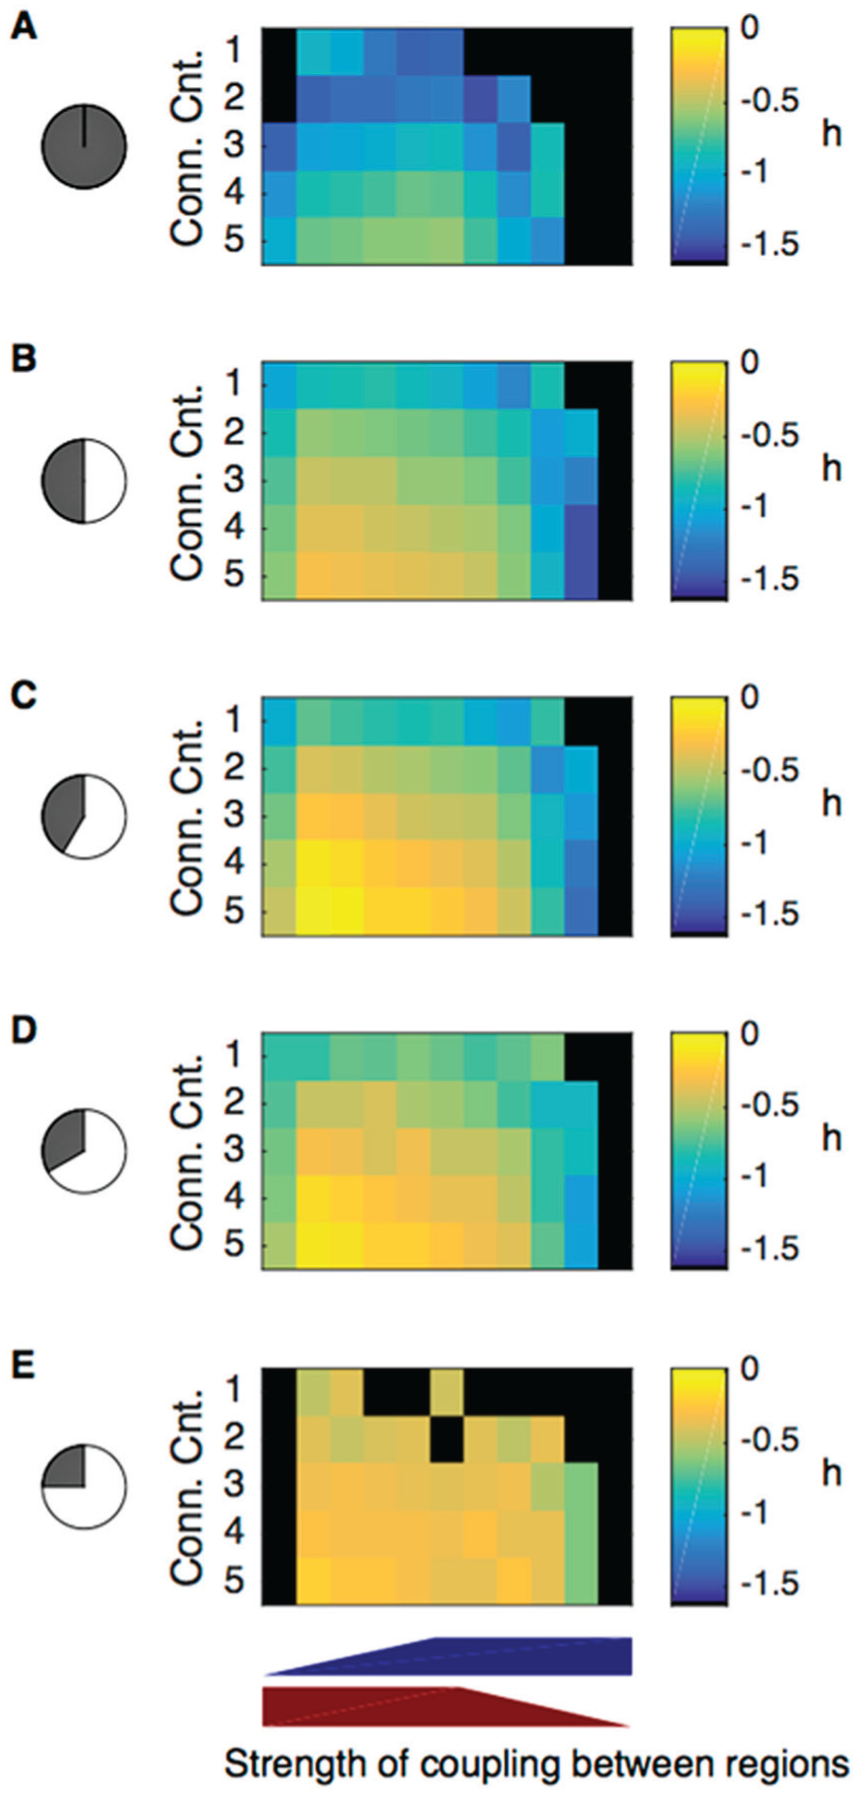
Simulated suprachiasmatic nucleus (SCN) networks that capture resynchronization dynamics also entrain with realistic photoperiodic properties. Shown are heat maps of spread in timing of core-shell peak PERIOD (PER) expression from simulated SCN networks under 5 LD conditions: (A) constant darkness, (B) LD12-12, (C) LD14-10, (D) LD16-8, and (E) LD18-6. Note that the peak time difference between the core and shell depended on the LD cycle (where negative values indicate the shell peaks earlier). For all simulations, the regional core network was dense, the shell was sparse, and shell oscillators were intrinsically faster than the core oscillators. Each cell in the heat map represents a given number and strength of connections between the regions (strength from core to shell indicated by red wedge, strength from shell to core indicated by blue wedge) and averages the results across simulations using all 83 velocity response curves (VRCs). Conn. Cnt., connection count.
The strength and number of inter-regional connections affected the ability to capture the trends in regional peak time differences with the model. Entrainment was successful for more photoperiods when the connections in both directions were at least 20% of their maximal strength. The peak time differences were more similar from VRC to VRC if the strength from the core to the shell was at 100% (the SD in peak time differences ranged from 0.3 h with more and stronger connections to 1 h with fewer and weaker connections from the core to the shell; Suppl. Fig. S10A). The change in peak-time difference was linear with respect to photoperiod (R2 > 0.8) for simulations with fewer connections between the core and shell and with weaker connections from the core to the shell (Suppl. Fig. S10B). The peak time difference altered most between simulated constant darkness and LD12:12 when the number of connections was 2 or 3 and the strength of inter-regional connections was unbalanced (Suppl. Fig. S10C). Increasing the photoperiod from 12 h to 18 h led to larger changes in regional peak time difference when the connections from the core to the shell were weaker (Fig. S10D). Thus, the relative strengths between the 2 regions had opposing effects. Greater strength from the core to the shell led to a more reliable and larger peak time difference. Greater strength from the shell to the core led to a more linear trend in peak time difference with respect to photoperiod. We, therefore, could not conclude which was more realistic for entrainment—an assumption in which the core had a strong influence on the shell or vice versa. We concluded that the model could not fully explain experimentally the observed adaptation to photoperiod.
Discussion
By following the dynamics of circadian oscillators in the SCN as they resynchronize to each other, we found evidence that the cells in the ventral SCN entrain those in the dorsal SCN. We found that TTX treatment resulted in reduced synchrony among SCN cells and that its removal allowed the circadian oscillators to resynchronize, consistent with prior reports based on Per1 or Per2 gene activity and intracellular calcium levels (Yamaguchi et al., 2003; Maywood et al., 2006; Aton et al., 2006; Rusnak et al., 2007; Baba et al., 2008; Webb et al., 2009; Ko et al., 2010; Enoki et al., 2012; Evans et al., 2013). During resynchronization, the period of the cells in the dorsal SCN gradually approached the period of the ventral SCN until they reached a steady-state phase relationship, with the ventral peaking after the dorsal SCN each day. Previous reports based on anatomical and physiological data had suggested that signaling within the SCN is primarily from the core to the shell (as reviewed in Antle and Silver, 2005; Albus et al., 2005). Computer simulations of our results indicated that the ventral SCN, which comprises densely connected cells with longer circadian periods, entrains the dorsal SCN, which comprises sparsely connected cells with shorter intrinsic periods. Importantly, these computer simulations showed consistent results across a wide variety of response characteristics (83 VRCs), indicating that the result is not dependent on the choice of model.
The automated analysis of the dynamics of PER2 expression revealed that the phases of cells within the dorsal SCN are more like each other than those in the ventral SCN. Similar dorsal-ventral clusters have been identified from the cultured SCN taken from mice maintained in different light cycles (Foley et al., 2011; Pauls et al., 2014). Intriguingly, we found that 2 clusters efficiently capture the PER2 resynchronization dynamics, with there being little evidence for additional cell clusters producing, for example, different phase trajectories. Independent clustering based on immunolabeling for 2 SCN neuropeptides indicated a striking correlation between the cells identified as the ventral group (based on their PER2 resynchronization patterns) and those with the highest VIP staining. This corresponds to the anatomically defined SCN core (Morin and Allen, 2006). Regions of the SCN with lower VIP corresponded to the dorsal group, as identified by slower PER2 resynchronization. Notably, AVP labeling was found in both groups clustered based on PER2 resynchronization dynamics. Thus, the functional characterization of the SCN during resynchronization supports a core-shell segregation of the SCN based on the location of VIP but, surprisingly, not AVP.
The phase relationships of SCN cells adjust to seasons (reviewed in Coomans et al., 2015). For example, longer photoperiods increase the phase separation between the dorsal and ventral SCN (Evans et al., 2014; Myung et al., 2015; but see also Inagaki et al., 2007 where anterior-posterior groups could be identified as changing with seasons). Our simulations with a densely interconnected core signaling to a sparsely connected dorsal SCN not only captured resynchronization dynamics but also showed the photoperiodic changes in phase relationships among the component circadian cells. Intriguingly, the phase relationships of the in silico model were not as large as those observed experimentally. Specifically, Evans and colleagues observed changes in the peak-time relationship from an approximate 1.3 h lead by the shell (constant darkness or after entrainment to LD12-12 h) to an approximately 3-h lead by the core (after LD18-6 h) (Evans et al., 2011, Evans et al., 2015). In our modeling examples, the shell led under all entrainment conditions but the lead shrank with increasing photoperiod. Thus, the model agreed qualitatively, but not quantitatively. The rigidity of the model’s phase relationships may be due to the static network—the coupling network’s topology and strength of connections is constant throughout the simulation. In contrast, the network in the SCN shows evidence of plasticity. For example, the relative influence of GABA and VIP on synchrony may change with seasons. Myung et al. (2015) used a combination of modeling and experiments to show that chloride homeostasis could modulate the effects of GABA and that it caused GABA to have asymmetric effects on inter-regional coupling (dorsal-to-ventral GABA signaling was phase-attracting while ventral-to-dorsal was phase-repelling). Likewise, signals at different time scales have been shown to play distinct roles. DeWoskin et al. (2015) demonstrated that fast GABA signaling likely regulated neuronal output whereas slow GABA signaling modulated synchrony. VIP has been shown to regulate entrainment at even longer timescales: the loss of VIP does not affect the acute response to light of period1 or electrical activity but significantly reduces long-term increases (Vosko et al., 2015). Our model did not include separate effects for GABA and VIP signaling or account for slow-scale changes in the network. In the future, we will adapt the model to consider such changes.
An important assumption in the interpretation of the results here is that TTX uncouples SCN cells from each other. While we have previously shown that TTX blocks firing and postsynaptic potentials in SCN neurons for up to 10 days of treatment (Aton et al., 2006), we do not have direct evidence that all cells, including, for example, astrocytes, are fully blocked from communicating circadian information to each other. It will be intriguing to monitor resynchronization following other treatments that have been reported to block specific cell-cell communication within the SCN, like antagonists of VIP signaling (Cutler et al., 2003; Jones et al., 2015), synaptic release (Deery et al., 2009) and G-protein signaling (Aton et al., 2006; Brancaccio et al., 2013).
It should be possible to test the prediction that the ventral SCN entrains the dorsal SCN. Optogenetic stimulation of VIP or AVP neurons daily could reveal whether neuronal excitation in the ventral or dorsal SCN can entrain specific regions of the SCN. Conversely, it would be intriguing to test if chronic optogenetic or chemogenetic silencing of neuronal firing in the dorsal SCN has any effect on the rhythmicity and synchrony of the ventral SCN neurons.
Footnotes
Acknowledgements
We thank Scott Pauls for image pre-processing code and John Abel, Matthew Tso, and Paula Nieto for helpful comments. This work was supported by a Clare Boothe Luce Assistant professorship (SRT, funded by the Henry Luce Foundation) and by an NIH grant R01GM096873 from the National Institute of General Medical Sciences (SRT and EDH).
Conflict of Interest Statement
The author(s) declared no potential conflicts of interest with respect to the research, authorship, and/or publication of this article.
Notes
References
Supplementary Material
Please find the following supplemental material available below.
For Open Access articles published under a Creative Commons License, all supplemental material carries the same license as the article it is associated with.
For non-Open Access articles published, all supplemental material carries a non-exclusive license, and permission requests for re-use of supplemental material or any part of supplemental material shall be sent directly to the copyright owner as specified in the copyright notice associated with the article.