
Abstract
Phase response curves (PRCs) for light or temperature stimuli have been shown to be most valuable in understanding how circadian clocks are entrained to daily environmental cycles. Nowadays, PRC experiments in which clock neurons are manipulated in a temporally restricted manner by thermogenetic or optogenetic tools are also useful to comprehend clock network properties. Here, we temporally depolarized specific clock neurons of Drosophila melanogaster by activating temperature-sensitive dTrpA1 channels to unravel their role in phase shifting the flies’ activity rhythm. The depolarization of all clock neurons caused a PRC resembling the flies’ light PRC, with strong phase delays in the first half of the subjective night and modest phase advances in its second half. However, the activation of the flies’ pigment-dispersing factor (PDF)-positive morning (M) neurons (s-LNvs) only induced phase advances, and these reached into the subjective day, where the light PRC has its dead zone. This indicates that the M neurons are very potent in accelerating the clock, which is in line with previous observations. In contrast, the evening (E) neurons together with the PDF-positive l-LNvs appear to mediate phase delays. Most interestingly, the molecular clock (Period protein cycling) of the depolarized clock neurons was shifted in parallel to the behavior, and this shift was already visible within the first cycle after the temperature pulse. We identified cAMP response element binding protein B (CREB) as a putative link between membrane depolarization and the molecular clock.
Animals possess circadian clocks in their brain in order to behaviorally anticipate periodic daily environmental changes. These clocks comprise a network of mutually coupled clock neurons. Although each clock neuron generates autonomous molecular rhythms by transcriptional and posttranscriptional feedback loops (reviewed by Brown et al., 2012; Özkaya and Rosato, 2012), for normal behavioral rhythms, the cooperative function of many if not all clock neurons appears necessary (Yoshii et al., 2012). The fruit fly Drosophila melanogaster is suited to unravel the neuronal communication within the clock network, as its clock comprises only 150 clock neurons expressing the canonical clock machinery and as most of them have been characterized individually (Helfrich-Förster et al., 2007a; Muraro et al., 2013; Hermann-Luibl and Helfrich-Förster, 2015). The clock neurons in the brain can be divided into lateral neurons (LPNs, LNds, 5th s-LNv, s-LNvs, and l-LNvs) and dorsal neurons (DN1a/ps, DN2s, DN3s) (Siwicki et al., 1988; Ewer et al., 1992; Helfrich-Förster, 2003, 2007b). Functionally, the clock neuronal groups can be defined as morning oscillators (M cells) and evening oscillators (E cells) (Grima et al., 2004; Stoleru et al., 2004, 2005, 2007; Rieger et al., 2006; Picot et al., 2007). The M cells are represented by the s-LNvs and are important for anticipatory morning activity as well as for free-running rhythms in constant darkness (DD). The latter role indicates that the M cells have a major function in the circadian system of the fruit fly. In contrast, the E cells, namely the LNds and the 5th s-LNv, are necessary for the timing of evening activity, not sufficient for free-running rhythms in DD, and are to some extent able to drive rhythmicity under constant light (LL). Even though this classification is widely accepted, recent studies challenge the dominant role of the M cells in Drosophila’s dual oscillator system by demonstrating a major role for the E cells in clock-neuron resynchronization after light pulses (Yoshii et al., 2015; Roberts et al., 2015). Furthermore, the l-LNvs, which are neither M cells nor E cells, appear to be particularly light sensitive and to mediate fly arousal and sleep (Shang et al., 2008; Sheeba et al., 2008a, 2008b). The LPNs and DN2s appear particularly temperature sensitive (Busza et al., 2007; Miyasako et al., 2007; Picot et al., 2009), and a subgroup of the DN1ps that are glutamatergic appear responsible for normal morning activity and robust rhythms in DD (Hamasaka et al., 2007; Zhang et al., 2010a, 2010b; Collins et al., 2012, 2014). Those cells targeted by the Clk4.1M-gal4 line additionally appear to integrate light and temperature inputs to control locomotor activity rhythms (Zhang et al., 2010b). Together, this suggests that the Drosophila clock network consists of multiple independent units that play different roles. These units are characterized by particular neuropeptidergic outputs, among which the pigment-dispersing factor (PDF) plays an essential role (Lin et al., 2004; Yoshii et al., 2009; Guo et al., 2014; Hermann-Luibl et al., 2014; Li et al., 2014; Yao and Shafer, 2014; Helfrich-Förster, 2014). PDF is expressed in the s-LNvs and the l-LNvs and seems to work as a crucial communication factor among the different clock neurons and as a light-input signal. Nevertheless, many details of the communication pathways in the clock network are still unclear.
Thermogenetics is a powerful approach in investigating the circuit mechanisms that shape behavior, because it allows one to selectively modulate the electrical activity of specific neurons in unrestrained animals (Bernstein et al., 2012). dTrpA1 has been successfully used in D. melanogaster for understanding locomotion, sleep, learning and memory, vision, and courtship (Parisky et al., 2008; Claridge-Chang et al., 2009; Krashes et al., 2009; von Philipsborn et al., 2011; Kohatsu et al., 2011; Bernstein et al., 2012; Bath et al., 2014). The method relies on temperature-sensitive cation channels of the transient receptor potential (TRP) family, whose conductance changes dramatically with temperature (Dhaka et al., 2006). dTrpA1 is a heat-responsive channel that opens above ~25 °C (Viswanath et al., 2003). In practice, temperatures from 25 to 31 °C or higher have been applied to provoke visible behavioral changes (reviewed in Bernstein et al., 2012).
Recently, dTrpA1 channels have been temporally activated in subgroups of clock neurons in order to unravel the neuronal communication within the clock network (Guo et al., 2014). After investigators activated the PDF-positive neurons (s-LNvs and l-LNvs) by 2-h temperature pulses (TPs) of 30 °C in the advance and delay zone of the flies’ phase response curve (PRC), phase shifts of the locomotor activity rhythm that resembled the known light PRC were observed (Guo et al., 2014). Nevertheless, an entire PRC for clock neuron activation by dTrpA1 channels is lacking so far. Furthermore, the phase-shifting capabilities of the s-LNvs (M cells) or the glutamatergic DN1ps alone are unknown. Therefore, our aim was to monitor entire PRCs for activation of all clock neurons, of the PDF-positive neurons, as well as partial PRCs for s-LNv or glutamatergic DN1p activation. In addition, we determined the molecular oscillations in the clock neurons after clock-neuron activation (via immunocytochemistry).
Material and Methods
Fly Stocks
All flies were reared on standard cornmeal/agar medium at 18 °C ± 0.2 °C and 70% Rh ± 5% Rh in a LD cycle of 12:12.
As experimental lines, virgins of w; clk856-GAl4 (Gummadova et al., 2009), y w; Pdf-GAL4 (Renn et al., 1999), y w; R6-GAL4 (Helfrich-Förster et al., 2007b), and w; clk4.1M-GAL4 (Zhang et al., 2010b) were crossed to w; UAS-dTrpA1 (Rosenzweig et al., 2005) males. These flies are designated as clk856>TrpA1, Pdf>TrpA1, R6>TrpA1, and clk4.1M>TrpA1 throughout this article. Furthermore, as controls, white1118 (w1118) or y w females were crossed to UAS-dTrpA1 males, and clk856-GAL4, Pdf-GAL4, R6-GAL4, and clk4.1M-GAL4 virgins were crossed to w1118 males to obtain heterozygous control flies for behavioral experiments as well as for immunocytochemistry. These flies are designated as UAS controls and GAL4 controls (clk856-GAL4, Pdf-GAL4, R6-GAL4, and clk4.1M-GAL4) respectively. To restrict dTrpA1 expression in clk856>TrpA1 flies to the PDF-negative neurons, Pdf-GAL80 (Stoleru et al., 2004) that represses GAL4 in the PDF neurons was combined with clk856-GAL4. Since the Pdf-GAL80 construct is located on the second chromosome, we had to use another dTrpA1 line that carried the same UAS-dTrpA1 construct as before, but on the third instead of the second chromosome. The exact crosses to obtain the experimental flies were the following: (1) w; Pdf-GAL8096A/CyO flies were crossed to w; CyO/Sco; UAS-dTrpA1/TM6B,Tb flies (Bloomington Drosophila Stock center, Bloomington, IN, USA) and to w; clk856-GAL4/CyO flies, respectively. (2) The offspring of both crosses that carried the relevant transgenes were crossed to each other. These flies are designated as clk856> PDF-GAL80>TrpA1. For positive controls, we used flies that carried the same UAS-dTrpA1 construct in all clock neurons but lacked the Pdf-GAL80 construct (w; clk856 flies crossed to w; CyO/Sco; UAS-dTrpA1/TM6B,Tb flies (Bloomington Drosophila Stock center). These are designated as clk856>TrpA1. As negative controls we used y w; Pdf-GAL8096A/UAS-dTrpA1, w; clk856-GAL4/PdfGAL80 as well as UAS-dTrpA1, and w; clk856-GAL4 flies crossed to w1118 flies, respectively. These are designated as controls.
Recording the Locomotor Activity of Flies and Application of TPs
Locomotor activity of individual male flies (age 3-6 days) was recorded photoelectrically in 1-min intervals using the commercially available Drosophila Activity Monitoring (DAM) System (Trikinetics, Inc., Waltham, MA, USA), counting the infrared light-beam crossings of each fly per interval during the whole recording time. For each monitor, 32 flies were transferred into recording tubes (65 mm × 5 mm), which were filled one third with agar/sugar medium (2% agar, 4% sucrose) and were closed by a polyurethane foam plug.
The activity monitors were placed into a cooling incubator (MIR-553; Sanyo Electric Co., Ltd., Osaka, Japan) to enable the entrainment to LD 12:12 at 20 °C ± 0.2 °C for 6 days and the application of a TP of 3 h of 32 °C ± 0.2 °C on the second day in constant darkness (DD). Illumination, derived from a white light 15-W fluorescence lamp, was set to ~ 500 lux (95 µW/cm2; Voltcraft MS-1300 digital luxmeter 0.1-50.000 lux). TPs were applied at different circadian times to obtain phase shifts for an entire PRC. Experimental genotypes as well as their respective controls were always recorded at the same time and in the same incubator, thus always experiencing the same experimental treatment.
CT0 was defined as the subjective beginning of the day and CT12 as the subjective beginning of the night. Thus, CT0 to CT24 represents 1 endogenous cycle (period, τ). The actual CT of the TP was calculated by multiplying the real hour by 24 h/τ for each individual fly (Johnson, 1990). Correspondingly, the phase shifts were indicated as circadian hours (actual hours were multiplied by 24 h/τ). Our temperature measurements within the fly tube showed that 32 °C was reached in the tube after 1 h of incubation; therefore, we chose 1 h after the beginning of the TP as the relevant time for our calculations. This time point was determined by measuring the temperature gradient of the TP inside the fly recording tubes using the digital thermometer PeakTech 5110 (with bead probe P TF-50).
Data Analysis
The raw data of individual flies were displayed as actograms using ActogramJ v0.9, (Schmid et al., 2011) a plugin of Fiji, v1.0 (Schindelin et al., 2012). For quantification of the responses to TPs, the phase of activity before and after the pulse was determined by the offset of the evening peak, as this peak was more reliable in constant conditions in comparison to the morning activity peak. Differences between the offset of the evening activity before and after the TP were measured by extrapolation of both phases by means of the Fiji tool “Activity on- and offset” for each fly individually. The time point of TP application was determined for each single fly separately as the TP was administered on the second day in DD. The phase shift of activity, which occurs when flies are released from LD in DD without any manipulation, was averaged and subtracted from the determined mean shift value for the pulsed flies of each genotype. Since the endogenous periods of the different fly lines were not significantly different and were close to 24 h, the mean phase shifts (±SEM) of all individual flies of each genotype were plotted against the time point of the TP application to enable the statistical comparison of the magnitude of the phase shifts between different genotypes. The calculation of the endogenous periods in DD of the different genotypes was done by χ2-periodogram analysis.
Statistics
Phase shifts after TPs were tested for significant differences in magnitude of phase shifting by a Wilcoxon signed rank test with Holm correction done in R (R.app GUI 1.62 [6558 Snow Leopard build], S. Urbanek and H.-J. Bibiko, R Foundation for Statistical Computing, 2012). Values were considered to be significantly different at p < 0.05, highly significant at p < 0.01, and most significant at p < 0.001. Significance levels are indicated by asterisks within the figures.
Assessing PER Cycling in the Clock Neurons
Three- to 6-day old males were used and entrained for at least 5 days to 12:12 LD at 500 lux at 20 °C and collected at the referred circadian times (CTs) in DD. Corresponding to the strongest effects in the behavioral PRC experiments, a TP was applied in the delay zone (CT12-15) or in the advance zone (CT21-24), respectively. The long time series of PER immunocytochemistry spanning 3 days was achieved by performing 3 subsequent experiments. To ensure the continuity of the whole experiment, the data sets were performed by overlapping time-points. The first data set ranged from hour 23 to hour 39 in DD and was followed by overlapping of the time-points hour 37 and hour 39 of the second experiment, which went on to hour 67 in DD. The third experiment started at hour 65 in DD, ending with hour 93.
Immunocytochemistry and Quantification of PER- and CREB-Staining Intensity
Experimental flies and controls were fixed in 4% paraformaldehyde (PFA) in phosphate buffer with 0.1% Triton X-100 (PBT 0.1%; pH 7.4) at room temperature in the dark on a tube rotator. After 3 h of fixation, the flies were washed twice with phosphate buffer for 15 min each and then once with phosphate buffer with 0.5% Triton X-100 (PBT 0.5%) for 15 min. The brains were dissected in PBT 0.5% and blocked in 5% normal goat serum (NGS) in PBT 0.5% at 4 °C overnight.
For PER-staining experiments, the primary antibodies rabbit anti-PER (1:2000) and mouse anti-PDFc7 (1:2000) were incubated for 72 h at 4 °C. The secondary fluorescence-conjugated antibodies Alexa Fluor 488 goat anti-rabbit IgG (H+L) and Alexa Fluor 635 goat anti-mouse IgG (H+L) were diluted 1:200 in PBT 0.5% with 5% NGS and incubated for 3 h. For CREB staining, the monoclonal primary rabbit anti-CREB antibody (1:1000), mouse anti-PDFc7 (1:2000), and polyclonal guinea pig antiserum against the clock protein VRI (1:3000) were used to counterstain and identify clock neurons. The brains were incubated for 72 h at 4 °C. The secondary fluorescence-conjugated antibodies Alexa Fluor 488 goat anti-rabbit IgG (H+L), Alexa Fluor 555 goat anti-guinea pig IgG (H+L), and Alexa Fluor 647 goat anti-mouse IgG (H+L) were diluted 1:200 in PBT 0.5% with 5% NGS and incubated for 3 h.
Afterwards, the brains were rinsed 3 times for 15 min in PBT 0.5% and once in PBT 0.1% and subsequently were embedded in the mounting medium Vectashield 1000 (Vector Laboratories, Burlingame, CA, USA). For each experiment, all brains were processed in exactly the same way during the entire staining protocol to enable comparison among different genotypes.
Microscopy and Image Analysis
For PER quantification, brains were analyzed by laser confocal microscopy using a Leica TCS SPE confocal microscope (Leica Microsystems, Wetzlar, Germany). Single confocal stacks of 2 µm thickness were taken with 400 Hz using the 488-nm laser to visualize PER (Alexa Fluor 488) and the 635-nm laser to visualize PDF (Alexa Fluor 635). All brains were processed similarly, and the same settings were kept for all of the scans, time points, and genotypes. The intensity of PER protein levels was calculated in at least 8 to 12 hemispheres of different individual brains per genotype and time point, using the measuring tool in Fiji. Mean PER values of the different cell groups were measured in grayscale units, ranging between 0 (black; no staining) and 255 (white; saturated staining) in a square-shaped area of 3 × 3 pixels in the brightest focal plane. The background staining was measured similarly. After background correction, mean PER intensity values (±SEM) were plotted against the time of collection for each neuronal subgroup and genotype.
For CREB quantification, confocal images were obtained by using a Leica SP8 confocal microscope. All samples were processed in the same way, and all laser settings were kept exactly the same for the whole experiment. CREB staining intensity was quantified as done for PER staining but using the “Freehand selections” tool of Fiji. Regions of interest (ROIs) for CREB quantification were defined by revolving the PDF-positive large lateral neurons (l-LNvs) using the PDF-immunoreactivity signal in the infrared channel. The mean intensity of the ROIs was averaged, background corrected, and plotted against the time point of collection for the large ventral neurons (l-LNvs).
Mean values of PER and CREB staining intensity in the different clock cell clusters of different time points, treatments, and genotypes were statistically compared using the Wilcoxon rank sum test in R with Holm correction (R.app GUI 1.62).
Results
TPs in the Delay and Advance Zone of Drosophila’s Light Phase Response Curve
Since Guo et al. (2014) found that activation of dTrpA1 in the PDF-positive neurons led to phase shifts comparable to those obtained by light-pulses at CT15 and CT21 (3 h and 9 h after lights-off, respectively), we began by applying TPs around these time points (CT12-15 and CT21-23, respectively). Figure 1 shows the typical phase-delaying and phase-advancing behavior of flies with dTrpA1 activation in all clock neurons (clk856>TrpA1), only in the PDF-positive LNvs (Pdf>TrpA1), only in the PDF-positive s-LNvs (R6>TrpA1), and only in the glutamatergic DN1ps (clk4.1M>TrpA1) compared with respective controls. We found that all flies significantly phase shifted their locomotor activity rhythm, even the ones that were only exposed to TPs without depolarization of the respective clock neurons. In all fly strains, the phase shifts were accomplished on the first day after the TP. In clk4.1M>TrpA1 flies, there was no significant difference between the flies that were only subjected to TPs and the flies that underwent clock neuron depolarization in addition to the TPs, neither in the advance nor in the delay zone (p > 0.05) (Fig. 1C). This was also true when we compared the effects at the individual time points (CT12, CT13, CT14, CT15 and CT21, CT22, CT23) separately between control and experimental flies. Pdf>TrpA1 and R6>TrpA1 flies exhibited significant phase advances after clock-neuron depolarization between CT21 and CT24 but no phase delays between CT12 and CT15. The phase advances caused by depolarization of the s-LNvs (R6>TrpA1 flies) were significantly larger than those caused by depolarization of all PDF neurons (Pdf>TrpA1 flies), suggesting that the l-LNvs have an inhibiting effect on the s-LNvs. Also in the phase-delay region, there was a difference between R6>TrpA1 and Pdf>TrpA1 flies, although this is not visible in Figure 1 but became only evident after comparing the effects at CT12, CT13, CT14, and CT15 separately. Whereas R6>TrpA1 flies lacked significant phase delays at any of the 4 CTs, Pdf>TrpA1 flies showed significant phase delays at CT14 and CT15 (see also Fig. 2A, B). The depolarization of all clock neurons using clk856>TrpA1 flies yielded significant phase advances at CT21-24 and highly significant phase delays at CT12-15 as compared with the controls.
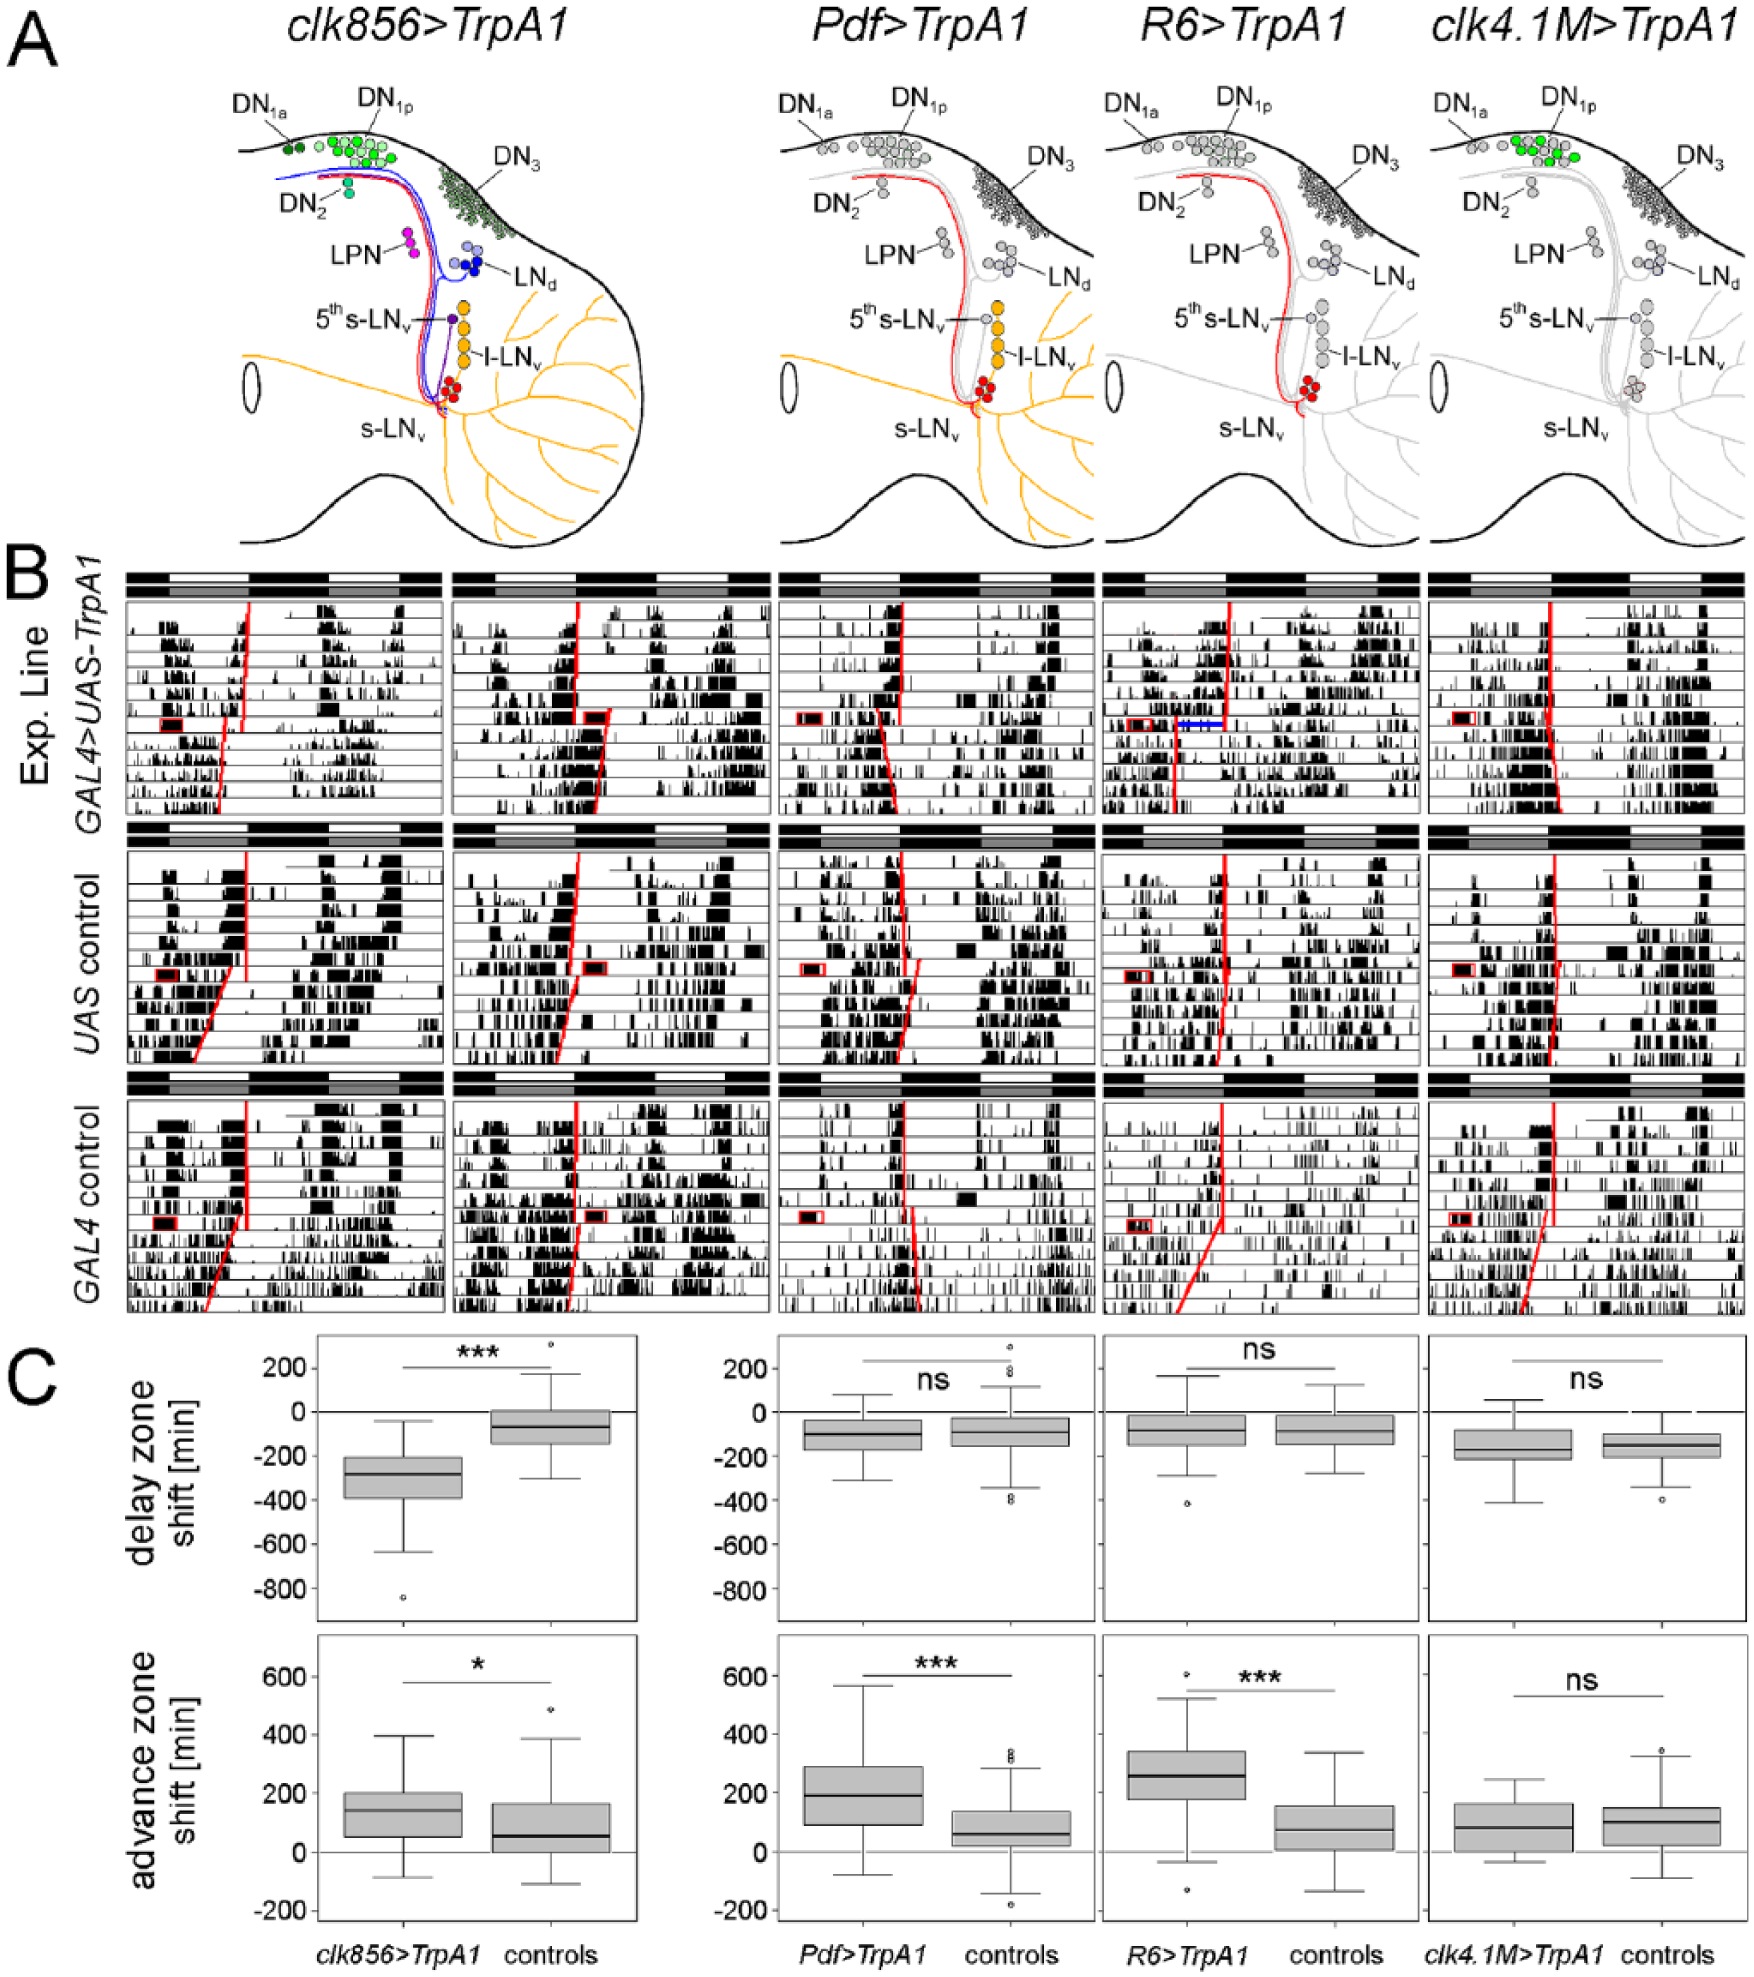
Phase shifting ability of clk856>TrpA1, Pdf>TrpA1, R6>TrpA1, and clk4.1M>TrpA1 and respective controls after TPs in the delay zone (CT12-15) and advance zone (CT21-24). (A) clk856>TrpA1 depolarizes all clock neurons (marked in different colors), Pdf>TrpA1 only the PDF-positive LNs (marked in yellow and red), R6>TrpA1 only the PDF-positive s-LNvs (marked in red), and clk4.1M>TrpA1 only the glutamatergic DN1ps (marked in green). (B) Typical examples of actograms. The TP is indicated as a red square and the calculated activity offsets before and after the TP as red lines. The phase shift was calculated on the first day after the TP, as indicated by the blue line in the R6>TrpA1 fly that received a phase-advancing TP. TPs in the delay zone (CT12-15) caused significant phase delays in clk856>TrpA1 flies relative to controls (C). TPs in the advance zone (CT21-24) caused significant phase advances in clk856>TrpA1, Pdf>TrpA1, and R6>TrpA1 flies compared with controls. No significant phase shifts were observed in clk4.1M>TrpA1 (C). (Wilcoxon rank sum test, *p < 0.05, **p < 0.01, ***p < 0.001; ns = no significant difference; number of flies included in each box plot n ≥ 26.) For clarity we pooled GAL4 and UAS controls in the diagrams. However, the statistical tests were also performed between each experimental line and its 2 respective controls and yielded the same results.
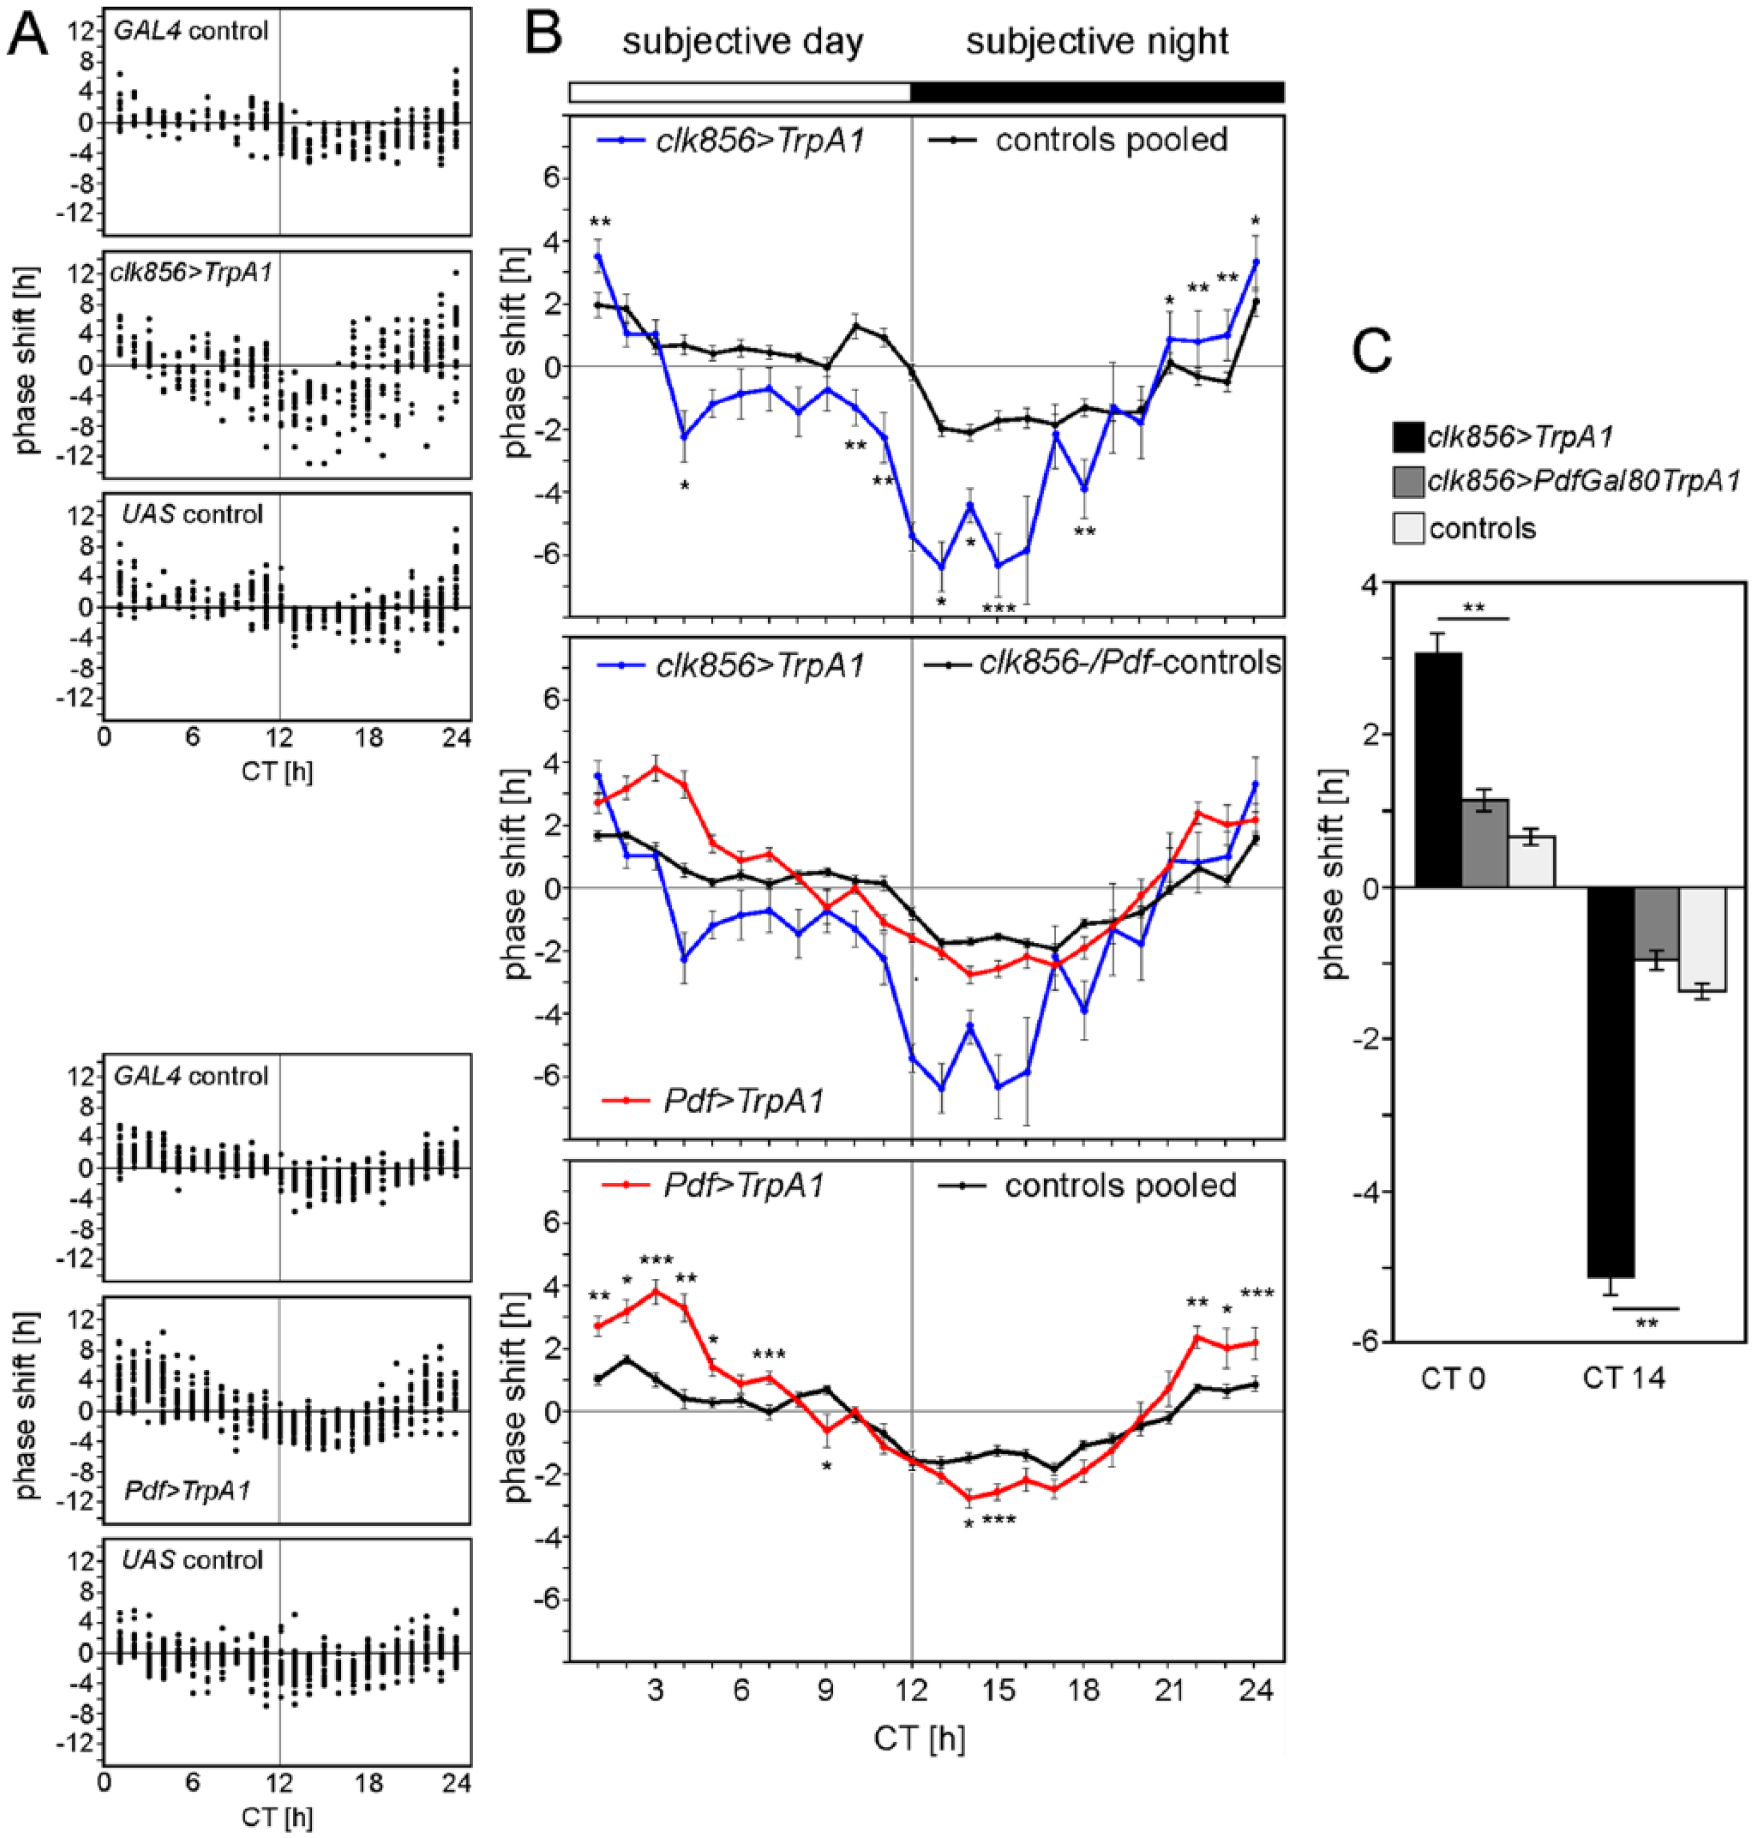
Entire PRCs of clk856>TrpA1 and Pdf>TrpA1 flies with respective controls. Phase shifts of individual flies are depicted as dots in Part A and as means ± SEM in Part B. (A) The experimental flies (clk856>TrpA1 and Pdf>TrpA1) were significantly different from their respective GAL4 and UAS controls, whereas the controls did not differ from each other. Therefore, the GAL4 and UAS controls of each experimental line were pooled to give the respective PRC curves in Part B (upper and lower diagrams). (B) The upper diagram depicts the PRCs of clk856>TrpA1 flies and controls, the lower diagram depicts the PRCs of Pdf>TrpA1 flies and controls, and the middle diagram depicts the PRCs of clk856>TrpA1, Pdf>TrpA1, and all controls pooled for better comparison. The middle diagram shows that the activation of all clock neurons (clk856>TrpA1) causes larger phase delays than does the activation of the PDF neurons (Pdf>TrpA1). In contrast, the depolarization of the PDF neurons causes prominent phase advances that extend into the usual dead zone of a typical light PRC. White and black bars above the PRCs indicate subjective day and night. (C) Restricting the depolarization to the PDF-negative neurons in clk856>PdfGAL80 TrpA1 reduces phase shifts of locomotor activity rhythms to the control levels. Also in this experiment, the 4 controls are not significantly different from each other and are therefore pooled. Asterisks indicate significant differences between experimental and control flies at the given CT. (Wilcoxon-rank sum test, *p < 0.05, **p < 0.01, ***p < 0.001).
Together these results indicate that the circadian clock network is sensitive to TPs as well as to clock-neuron depolarization and that the latter is dependent on the type of clock neuron subgroup that is activated and on the time the depolarization takes place.
Conducting Entire PRCs for TPs and Clock Neuron Depolarization
The only way to assess the sensitivity of the circadian system to TPs and clock neuron depolarization in more depth is to conduct entire PRCs. For that purpose we used clk856>TrpA1 and Pdf>TrpA1 flies and respective controls (Fig. 2A). TPs alone led to a weak PRC with a “delay zone” during the first fraction of the subjective night and an “advance zone” from the end of the night to the middle of the subjective day. The additional depolarization of all clock neurons (clk856>TrpA1 flies) slightly enhanced the advance zone and strongly enhanced the delay zone. In contrast, the additional depolarization of the PDF-positive LNvs (Pdf>TrpA1 flies) predominantly enhanced the advance zone but only marginally affected the delay zone (Fig. 2A, B). Most remarkably, the advance zone of Pdf>TrpA1 flies covered half of the day, where the light PRC usually has its dead zone.
To further decipher the role of the PDF-positive neurons in clk856>TrpA1 flies in phase shifting, we excluded the depolarization of the PDF-neurons by means of PdfGAL80. In such flies (clk856>PdfGAL80 TrpA1), the phase shifts in the advance and delay zone were reduced to the level of controls that received only TPs (Fig. 2C). This indicates the importance of the PDF-positive s-LNvs and l-LNvs in depolarization-mediated phase advances and delays.
Temporal Depolarization of All Clock Neurons in the Delay Zone Phase Delays PER Cycling in Drosophila’s M and E Cells and Induces PER in the Large PDF Cells
Next, we aimed to see whether the behavioral phase delay observed after depolarizing all clock neurons by a TP is accompanied by a phase delay in the molecular oscillations of the clock neurons. To this purpose we dissected flies for 3 circadian cycles, immunostained their brains with anti-PER, and counterstained against PDF. We then analyzed PER staining intensity in almost all clock neurons (Fig. 3). The TP occurred 36 to 39 h after the transfer of the flies into DD, hitting them in the delay zone at around CT12-15 during the minimum of PER (Fig. 3A, B).
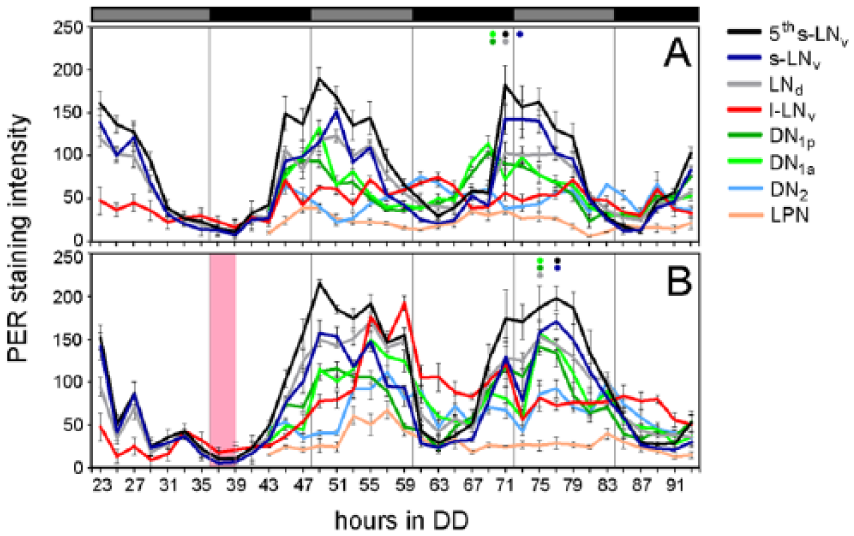
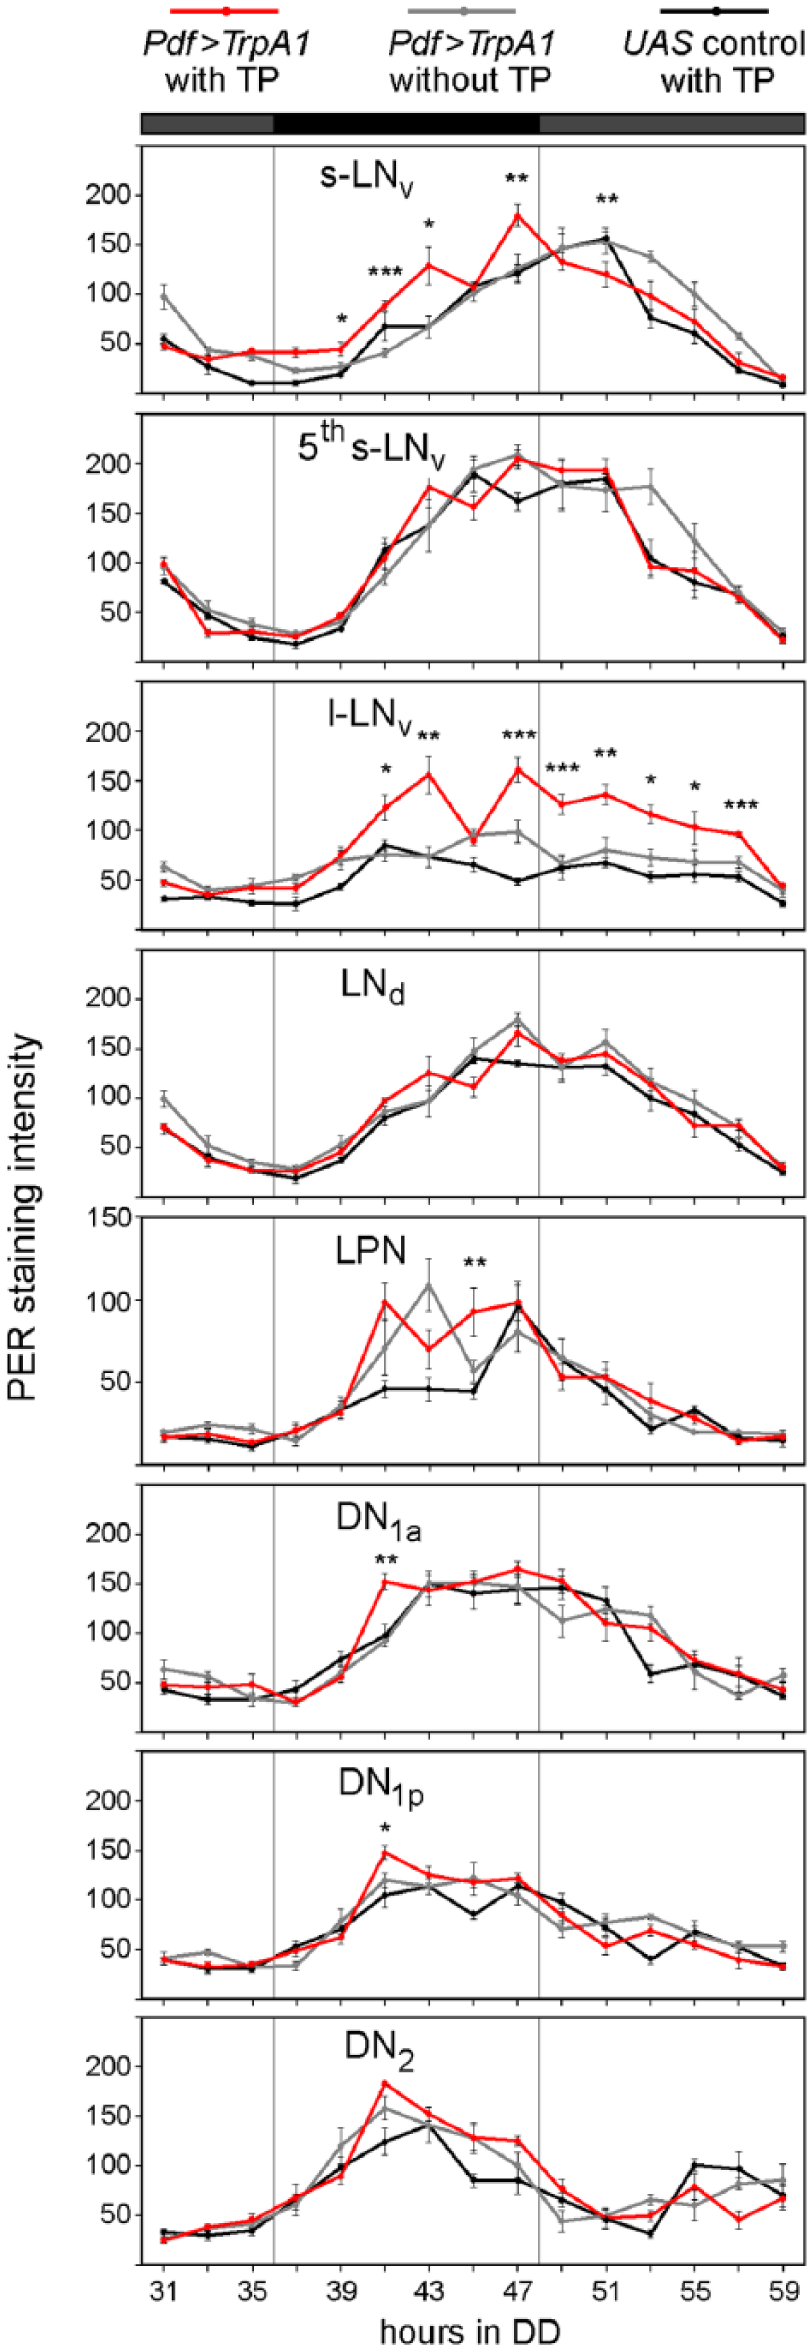
PER cycling in the clock neurons of clk856>TrpA1 flies with and without application of a TP in the delay zone. PER staining intensity was quantified on 3 consecutive days in DD in each clock cell cluster (of ≥8-12 hemispheres per time point). Without TP, PER levels oscillated in all clock neurons except for the l-LNvs and DN2s. After the TP (red bar), oscillations were phase delayed in most clock neurons and, in the l-LNvs, PER strongly increased reaching a maximum ~20 h after the TP and then slowly decreased again. The colored dots on top of the curves in A and B mark the maxima of PER on day 2 in the neurons with high-amplitude PER cycling, showing that these occur at least 3 h later in clk856>TrpA1 flies subjected to a TP. PER staining in the different clock neurons is given as mean (±SEM) in pixel intensity (ranging from 0 to 255). Gray and black bars on top of the diagrams indicate subjective day and night in DD. The red box indicates the time of TP application.
First, we compared PER cycling in all clock neuron groups of non-temperature-pulsed clk856>TrpA1 flies with that of temperature-pulsed ones (Fig. 3A, B). For better comparison, PER protein cycles of each neuronal group of non-temperature-pulsed clk856>TrpA1 flies, temperature-pulsed UAS controls, and temperature-pulsed clk856>TrpA1 flies were plotted separately in Figure 4.
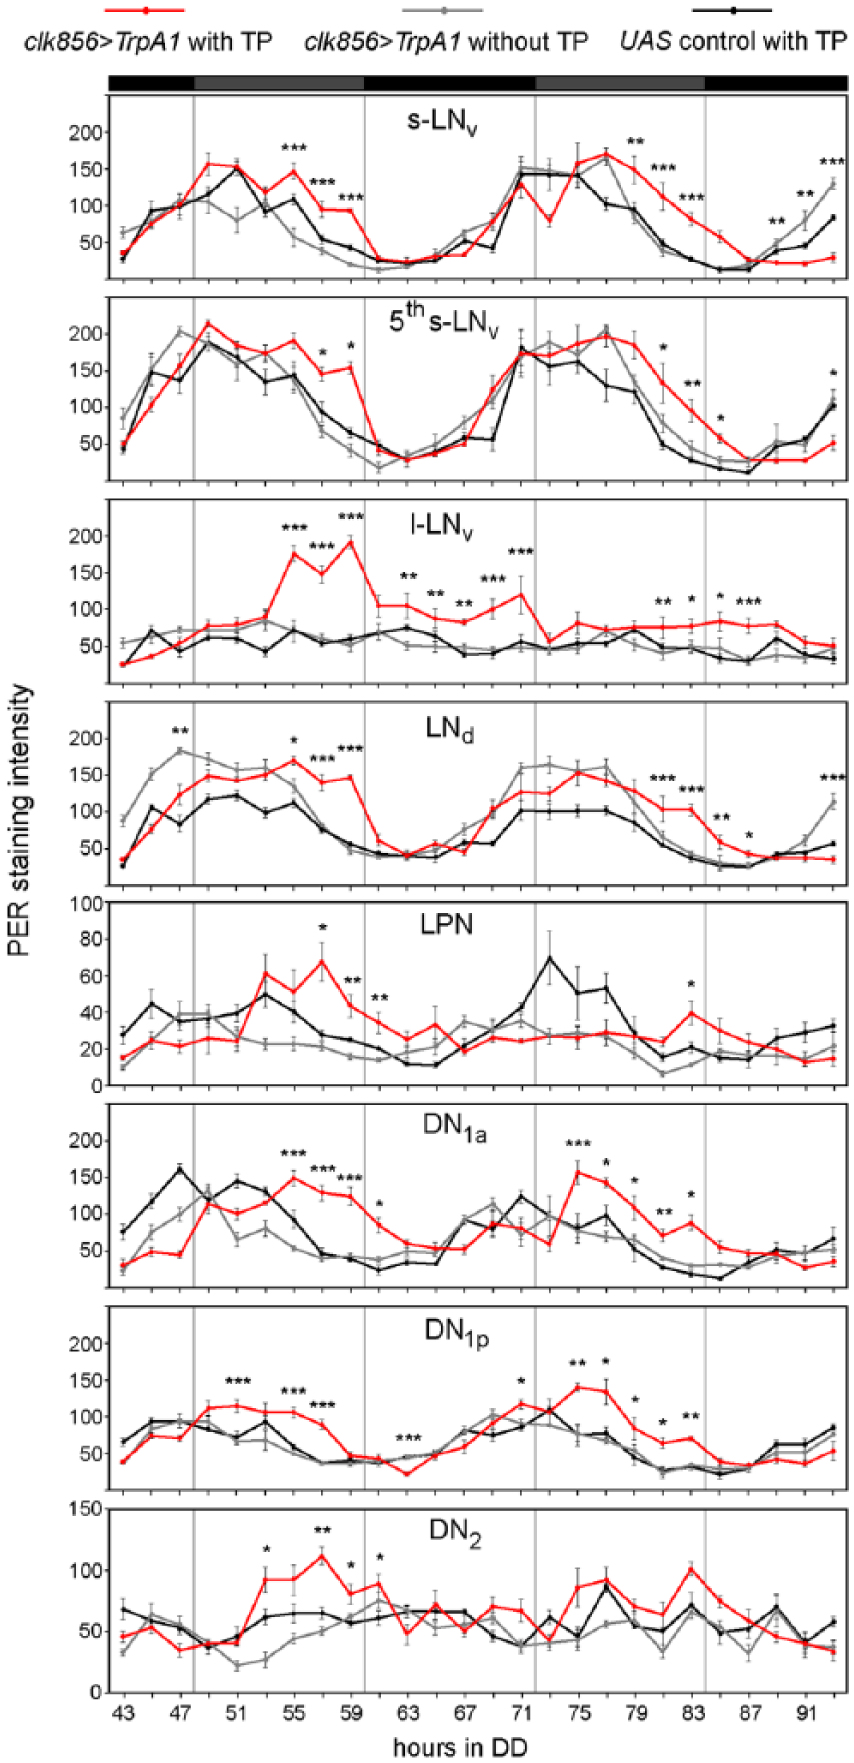
Quantification of PER staining intensity in different clock neuron clusters on the third and fourth day in DD (20 °C) after activation of all clock neurons in the delay zone (≥8-12 hemispheres per time point and genotype). Red lines indicate experimental flies clk856>TrpA1, gray lines clk856>TrpA1 without TP, and black lines UAS controls with TP. PER oscillations of most clock neurons were significantly delayed in experimental flies compared with both controls. In controls, PER in the l-LNvs did not cycle during the investigated time window but showed a strong increase in the experimental flies ~20 h after the TP. Asterisks indicate significant differences in PER levels in comparison to both controls (Wilcoxon rank sum test with Holm correction, *p < 0.05, **p < 0.01, ***p < 0.001). PER cycling is shown at different scale in the LPNs and DN2s). Labeling as in Figure 3.
Non-temperature-pulsed clk856>TrpA1 flies revealed clear PER oscillations in all clock neurons except for the l-LNvs and the DN2s that appeared to dampen during the second day of DD (Fig. 3A). The LPNs oscillated, but with a low amplitude. After having activated all clock neurons via TrpA1, PER oscillations immediately changed. The most conspicuous change occurred in the l-LNvs, in which PER rose to very high levels and then decreased again. A similar temporal increase of PER occurred in the DN2s; however, it appeared to be more moderate than in the l-LNvs. In all other clock neurons, the decrease in PER occurred significantly later in the experimental flies than in the 2 controls, and this was already true at the first subjective day after the TP (Fig. 4). In the DN1as, not only the decrease of PER was delayed, but also the PER increase was later than in the controls. Together, our data show that PER oscillations are delayed and that the delay is already achieved during the first cycle after the TP.
Immediate PER Phase Delays and Advances Appear to be Restricted to the Manipulated Neurons
Having clarified that clock neuron depolarization provoked significant PER phase shifts in each manipulated group of clock neurons already 1 day after the TP, we then aimed to investigate whether these PER phase shifts were cell autonomous and thus restricted to the PDF-positive LNvs in Pdf>TrpA1 flies. For this purpose, we immunostained Pdf>TrpA1 brains and the relevant controls just at the time points in DD, at which the delay was most evident in clk856>TrpA1 flies (hour 55 to 61 in DD). We found significantly higher PER staining intensities in the PDF-positive l-LNvs and s-LNvs of experimental flies compared with controls (data not shown), suggesting that the fast response to delay zone TPs is restricted to the PDF-positive LNvs.
Since the delays in locomotor activity rhythms provoked by activation of the PDF-positive LNvs were small, we aimed to verify the shift of PER oscillations for the advance region. We applied the TP from CT0 to CT3 (hours 24-27 in DD) and quantified PER staining intensity in all clock cells for the first cycle in DD (hours 31 to 59 in DD). The l-LNvs increased PER staining intensity as they did in the delay zone (Fig. 5). However, the PER maximum was now 47 h after lights-off instead of 59 h after lights-off as it was after the delaying TP, meaning that the induction of PER in the l-LNvs occurred in both cases 20 h after the TP. Consistent with the behavioral results, the s-LNvs exhibited significant advances of PER oscillations (Fig. 5).
Quantification of PER staining intensity in different clock neuron clusters on the third day in DD (20 °C) after activation of the PDF-positive LNs in the advance zone (≥8-12 hemispheres per time point and genotype). After the depolarization in the advance zone, PER cycling in the PDF-positive neurons is substantially phase-advanced relative to controls. In the l-LNvs, PER levels increased ~20 h after the TP, as was the case after activation of all clock neurons in the delay zone. PER cycling is shown in different scale in the LPNs. Labeling as in Figure 3 and 4.
Depolarization-mediated Increases in PER Levels Coincide with Increases in CREB Levels in the l-LNvs
Since increases in PER levels in the l-LNvs appear to be caused by a cell-autonomous depolarization after dTrpA1 activation, we looked for a putative molecular link between neuronal electrical activation and the molecular clock. cAMP is an important second messenger: It is elevated upon different signals at the postsynaptic membrane, and it is linked to the molecular circadian clock of flies via binding of the cAMP responsive element binding protein, CREB, to CRE sequences in the upstream region of per (Belvin et al., 1999). Recently, cAMP has even been shown to stabilize PER in flies (Li et al. 2014). To address the possibility of whether cAMP is involved in mediating the signal of membrane depolarization to the molecular clock, CREB staining experiments were performed after TPs were applied in clk856>TrpA1 and Pdf>TrpA1 flies and respective controls. We determined CREB levels immunocytochemically in the l-LNvs for 2 reasons: (1) the l-LNvs showed a strong and rather immediate increase in PER after depolarization, and (2) due to their large size, CREB immunostaining was easily detectable and measurable in them. The time point of sampling was set to the time point when the PER levels increase in the l-LNvs, 9 h after the beginning of the TP in the advance and delay zone, respectively (Fig. 6A). We found that both experimental lines showed significantly higher CREB levels in the l-LNvs after depolarization relative to controls in the delay as well as in the advance zone, suggesting an involvement of cAMP and the cAMP pathway in mediating phase adjustments of the clock. CREB might constitute the missing link between neuronal activation and the molecular clock, as increases in PER levels coincide with increases of CREB levels. Furthermore, CREB abundance in the l-LNvs appears to be under circadian regulation, as CREB levels were twice as high in the advance zone compared with the delay zone irrespective of the genotype and treatment in DD (Fig. 6B).
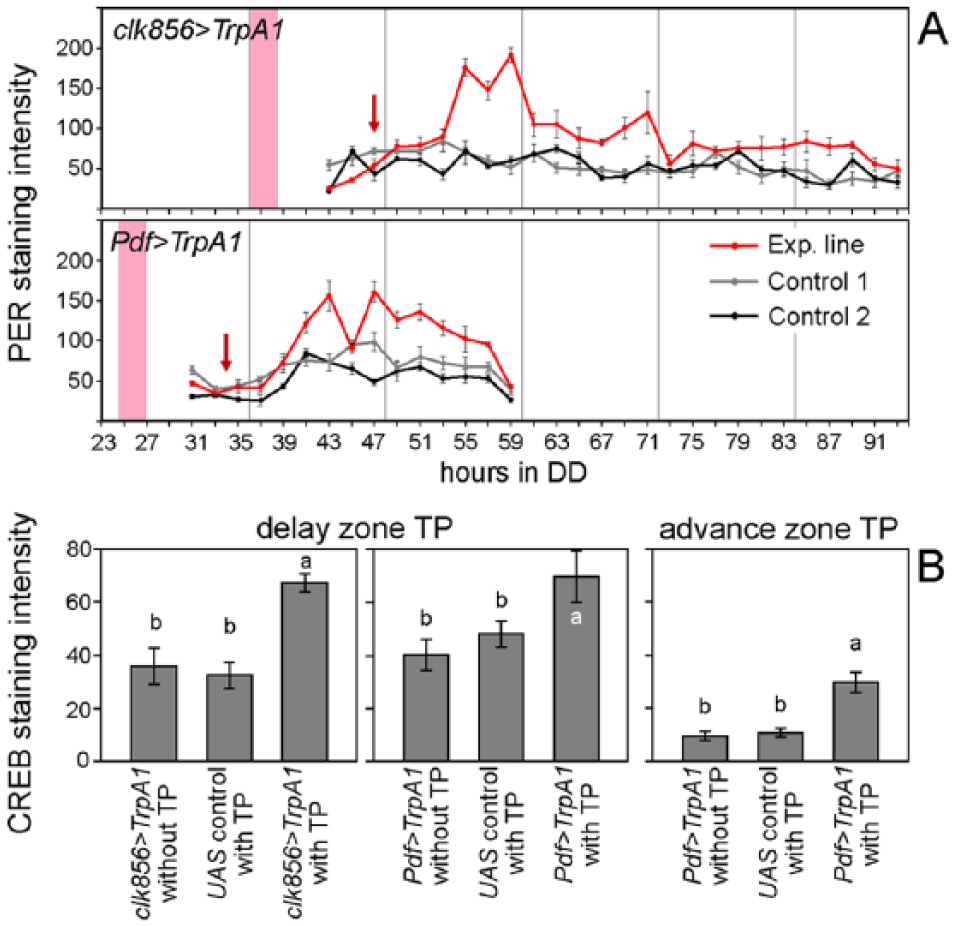
Comparison of PER oscillations and CREB levels in the l-LNvs after a delaying TP in clk856>TrpA1/Pdf>TrpA1 and an advancing TP in Pdf>TrpA1. (A) The depolarization strongly increased PER levels in the l-LNvs of both experimental lines (red lines) compared with the corresponding controls (gray lines). Red arrows indicate the beginning of the increase in PER levels as well as the time point of sampling for CREB staining (9 h after the TP). (B) Quantification of CREB levels in the l-LNvs after depolarization in the delay or in the advance zone (≥20 hemispheres per time point and genotype). After depolarization, CREB levels are significantly higher in experimental flies relative to controls independent of the time of the depolarization. In addition, there is a time-of-day dependent alteration in overall CREB levels, being higher during the advance than during the delay zone. Different letters in Part B indicate significant differences in CREB levels (Wilcoxon rank sum test with Holm correction, p < 0.01). Otherwise, labeling as in Figure 3.
Discussion
Depolarization of Most Clock Neurons by TPs Causes Larger Phase Shifts than TPs Alone
In our study we used the powerful thermogenetic tool dTrpA1. With spatially restricted TrpA1 expression and temporally controlled TPs, neurons can be depolarized. We were able to manipulate the circadian network and further specified some aspects of the circadian clock of Drosophila. Although TPs in combination with TrpA1 are known to efficiently manipulate the network, it is nonetheless difficult to deal with TPs in the chronobiological context. In fact, as we observed in our control flies, TPs alone were able to induce weak phase shifts. However, even taking genetic background effects into account, our data yield interpretable results that are consistent with and add to earlier independent non-TrpA1 experiments. Former work has shown that TPs per se can phase shift the clock, especially in the early night (Edery et al., 1994; Sidote et al., 1998; Kaushik et al., 2007).
Therefore, one of our aims was to monitor a complete PRC for TPs, which can then be compared with the PRCs obtained by clock neuron activation via dTrpA1 channel expression. Consistent with the previous studies, we found that TPs alone can phase delay and advance the activity rhythm for up to 2 h, whereby the phase delay zone was considerably larger (reaching from CT0 to CT21) than the phase advance zone (reaching from CT21 to CT4) (Fig. 2). A prominent dead zone was present between CT5 and CT11.
The additional activation of dTrpA1 channels in all clock neurons (clk856>TrpA1) resulted in significantly larger phase delays and advances than those provoked by TPs alone. The obtained PRC had strong phase delays (up to 6 h) between CT10 and CT18 and smaller phase advances (up to 4 h) between CT21 and CT0 and resembled a type 1 light PRC (see, for example, Kistenpfennig et al., 2012).
The activation of dTrpA1 channels in the PDF-positive LNvs (Pdf>TrpA1) also provoked phase advances of up to 4 h, but the phase delays reached maximally 3 h. These results are quite consistent with those of Guo et al. (2014), who applied TPs of 30 °C for 2 h at CT21 and CT15 and found phase advances and delays of comparable magnitude. Most interestingly, in our study, the provoked phase delays were only significantly different from those of the control flies at CT14 and CT15. Already when we pooled the phase delays between CT12 and CT15, the significant differences between Pdf>TrpA1 flies and the respective controls disappeared (Fig. 1). We conclude that the method of neuronal activation by dTrpA1 channels works but that the PDF-positive LNvs can only provoke phase delays during a limited time window.
In contrast, the activation of the PDF-positive s-LNvs in R6>TrpA1 flies did not lead to phase delays at any of the tested times but led to prominent phase advances clearly indicating that these neurons are important for phase advancing the clock (see also below). The activation of the glutamatergic DN1ps in clk4.1M>TrpA1 flies neither yielded significant phase delays nor caused advances at the tested times, indicating that the depolarization of these clock neurons alone cannot phase shift the activity rhythm.
Temporal Depolarization of the M Cells Is Sufficient for Phase Advances Whereas Depolarization of the E Cells and the l-LNvs Is Required for Phase Delays
As discussed above, depolarization of the PDF-positive s-LNvs (M cells; R6>TrpA1) led to significant phase advances but not to delays. The general ability of the M cells to drive phase advances is also evident from experiments performed under constant light (LL) by Rieger et al. (2006). Under such conditions, the fly’s locomotor behavior splits into 2 free-running components of activity, one with a longer period and one with a shorter period. The component free-running with a short period turned out to be controlled by the s-LNvs. Obviously, constant light permanently phase advances the s-LNvs, leading to a short free-running period. Whether light leads to a depolarization of the s-LNvs is still unknown but is quite likely. The s-LNvs are contacted by the Hofbauer-Buchner (H-B) eyelets (Helfrich-Förster et al., 2002) that signal via the excitatory neurotransmitter acetylcholine as well as the inhibitory neurotransmitter histamine (Burg et al., 1993; Pollack and Hofbauer, 1991; Yasuyama et al., 1995; Yasuyama and Salvaterra, 1999). Since the s-LNvs do not express inhibitory histamine receptors (HisCl) (Hong et al., 2006) but do respond to acetylcholine with an increase of cAMP and Ca2+ levels (Lelito & Shafer, 2012; Wegener et al., 2003), they appear to be activated (depolarized) by light signals coming from the H-B eyelets. In addition, they may be activated by PDF, stemming from the l-LNvs, which also leads to an increase of cAMP in the s-LNvs (Mertens et al., 2005; Shang et al., 2008; Shafer et al., 2008).
In contrast to the M cells, the PDF-negative neurons (or E cells) appear mainly responsible for phase delays: The activation of all clock neurons produces much larger phase shifts than the activation of the PDF neurons alone. Again, the general ability of the E cells to drive phase delays is underlined by experiments performed under constant light (LL), in which designated E cells, the LNd and 5th s-LNv, free-run with long period (Rieger et al., 2006). Putative light-input pathways that depolarize the E cells may work via CRY (Tang et al., 2010; Vinayak et al., 2013; Yoshii et al., 2015) as well as via PDF from the l-LNvs (Yoshii et al., 2009; Helfrich-Förster, 2014; but see Shang et al., 2008, for a different view). Here, we show that the delays do indeed strongly depend on the depolarization of the PDF neurons, as phase delays occurred only when the PDF-positive neurons had been activated. This indicates that the cooperative action of both PDF-positive and PDF-negative neurons is required to evoke strong phase delays. Among the PDF-positive neurons, the l-LNvs appear to mediate the delaying signal to the PDF-negative neurons (or E cells), as R6>TrpA1 flies were unable to phase delay.
The idea that M cells mediate phase advances and E cells phase delays is not new but was raised earlier by Stoleru et al. (2007), Shang et al. (2008), and Tang et al. (2010) following different manipulations of M and E cells. Here, we show by more direct methods—the depolarization of M or E cells—that this hypothesis holds true. We finalize this point of view by adding the importance of the l-LNvs for phase delays, as their exclusion from depolarization did not result in significant phase delays. Only a recent study of Roberts et al. (2015) seems to speak against this view, but this is only true at a first glance. Roberts et al. (2015) measured the responses of individual clock neurons to an advancing light pulse in cultured brains via period-luciferase-reporter cycling. The investigators found that individual clock neurons within a group responded to light pulses by a temporal desynchronization resulting in a decrease of overall cycling amplitude. The l-LNvs showed the strongest response and never came back to a normal and synchronized cycling, which fits their role as most light-responsive neurons. The s-LNvs also responded strongly and took several cycles until they resumed a normal cycling with advanced phase. The LNds, in contrast, resumed a high-amplitude cycling with advanced phase already 1 cycle after the light pulse. The authors concluded from this fast resetting that the LNds are the ones that respond most strongly to phase-advancing light pulses. However, when one compares the phase advances accomplished by the LNds and the s-LNvs, it becomes evident that the LNds phase advanced very little, whereas the s-LNvs phase advanced by almost 12 h. Therefore, we interpret these data differently: The s-LNvs are the cells that respond strongly to a light-pulse in the phase-advance zone. This is evident not only from the large phase advance that they accomplish but also from the strong and longer-lasting decrease in cycling amplitude after the light-pulse.
The PRC Obtained after Depolarization of the PDF-positive LNvs Differs from a Typical Light PRC
Although the PRC obtained after depolarization of all clock neurons resembles a light PRC, the one after depolarization of the PDF-positive LNvs does clearly not. The main difference is the pronounced advance zone in the first half of the subjective day (between CT0 and CT6) in Pdf>TrpA1 flies, which is absent in a light PRC (dead zone). In turn, this means that the s-LNvs are not electrically active in wild-type flies during this time. There are 2 possibilities as to how they may be inhibited: either by light or by the activity of the other clock neurons. Indeed, Picot and colleagues (2007) showed that light has inhibiting effects on the rhythmic behavioral output of the PDF-positive neurons and that this inhibition by light highly depends on the visual system. Nevertheless, an inhibition of the s-LNvs by the other clock neurons is more likely, because the activation of all clock neurons abolishes phase advances during the usual dead zone and this works without any light. Potent candidates for this type of inhibition are the glutamatergic DN1ps, as they have been shown to inhibit the s-LNvs via metabotropic glutamate receptors, hence blocking morning activity and robust rhythmicity under DD (Hamasaka et al., 2007; Collins et al., 2012; 2014).
Behavioral Phase Shifts Are Accompanied by Fast Molecular Phase Shifts in the Depolarized Clock Neurons
To see how the molecular oscillations in clock neurons respond to temporal depolarization, we determined PER oscillations by immunocytochemical means for 1 to 2 days after the TP. We detected phase shifts in the molecular oscillations already during the first cycle after the TP, showing that the molecular clock in the depolarized neurons is reset very quickly, a phenomenon that corresponds to the fast shifting of locomotor activity rhythms.
The delay at CT12-15 after depolarization of all clock neurons was mainly achieved by delaying PER degradation (Fig. 4). Only in the DN1as was PER accumulation additionally delayed from the beginning; in the s-LNvs, the 5th s-LNv, the LNds, and the DN1ps, PER accumulation appeared to be delayed from the third day onward after the TP. A delay in PER degradation may be achieved by stabilization of PER through activation of protein kinase A (PKA), as recently shown in S2 cells as well as in vitro in isolated fly brains (Li et al., 2014; Seluzicki et al., 2014). PKA is activated by cAMP, and after addition of cAMP to isolated brains, PER was found to stay stable even 4 h after lights-on (Li et al., 2014). In the presence of highly accumulated PER, SUPERNUMERARY LIMBS (SLMB), an E3 ubiquitin ligase, preferentially interacts with TIM and causes its degradation (Grima et al., 2012). But due to the high accumulation and protein levels of PER, the degradation process takes longer, which causes the delay of the molecular clock. Furthermore, CULLIN-3 (CUL-3), another ubiquitin ligase, is putatively involved in promoting the observed delay zone phase shifts (Guo et al., 2014). CUL-3 has recently been reported to interact with low-phosphorylated TIM, allowing its accumulation by forming a complex (Grima et al., 2012; Guo et al., 2014). A prerequisite for this mechanism is that PER protein is present at very low levels, which is indeed the case at the beginning of the subjective night. By forming the CUL-3:TIM complex, CUL-3 allows TIM to accumulate in the night (Grima et al., 2012). Since TIM stabilizes PER by forming stable heterodimers and preventing degradation by the proteasome, the accumulation of TIM also increases the accumulation of PER, thus allowing the clock to phase delay.
In contrast, the advance at CT0-3 after depolarization of the PDF neurons was accomplished by an advanced PER accumulation (Fig. 5). An advanced PER accumulation can be achieved by an earlier start of per transcription/translation during the day and early night. In mammals, the depolarization of clock neurons leads to an increase of cAMP that activates PKA, which in turn is able to phosphorylate and thus activate cAMP response element binding protein B (CREB) (Ginty et al., 1993). Phosphorylated CREB binds to cAMP-responsive elements (CRE) in the per1 and per2 promoters and induces transcription (Ding et al., 1997). In Drosophila, 3 CREB binding sites are described upstream of the per gene, and mutations in the Drosophila CREB gene affect per expression, suggesting that a similar mechanism can enhance transcription of per in flies (Belvin et al., 1999). The expression of per may also be induced indirectly: for example, by the CREB-binding protein (CBP) that influences transcriptional activity of the CLK/CYC heterodimer and then activates per transcription (Lim et al., 2007; Hung et al., 2007). Indeed, Mizrak et al. (2012) showed that hyperexcitation of Drosophila’s M cells induces Clk gene expression, among the expression of other circadian genes, and that CREB transcription factors mediate this effect. In any case, the direct or indirect activation of per transcription may advance the M neurons.
Our study does not answer whether PER cycling in the other clock neurons is affected some days after depolarization of the PDF neurons, since we only measured PER during the first cycle after the TP. Nevertheless, this appears most likely, because PDF is released after LNv depolarization, activates the PDF receptor of the other clock neurons, and increases their cAMP levels as has been shown before (Lin et al., 2004; Yoshii et al., 2009; Li et al., 2014; Lear et al., 2005; Hyun et al., 2005; Yao et al., 2012; Shafer et al., 2008).
CREB Might Be Involved in the Fast Resetting of the Molecular Clock
As discussed above, cAMP is a likely second messenger involved in resetting the molecular clock either after depolarization of the clock neurons or by PDF signaling to them. Furthermore, CREB transcription factors may be involved in mediating this effect. To find out whether CREB is increased after clock neuron depolarization, we stained and quantified CREB in the l-LNvs, as these neurons showed a strong increase in PER levels 20 h after the TP. Indeed, the time of PER protein increase in the l-LNvs coincided with significantly higher CREB levels relative to controls, suggesting an activation of CREB in these cells in response to the depolarization. Apart from this induced CREB increase, we observed CREB to cycle in a circadian manner. Belvin et al. (1999) did not see such a significant circadian cycling in CREB levels in whole head extracts of wild-type flies, but a more tissue-specific analysis of CREB activity by means of a CRE-luc reporter revealed clear circadian oscillations of CREB in glia cells and specific neurons (Tanenhaus et al., 2012). This suggests a circadian regulation of CREB in specific subsets of neurons. Here, we measured and quantified CREB levels in the l-LNvs for the first time. CREB exhibited much higher levels at the end of the subjective night compared with the end of the subjective day, irrespective of genotype or treatment (temperature-pulsed or non-temperature-pulsed). This opens an additional avenue of circadian modulation of per or Clk transcription by CREB that might, for example, serve as a molecular gate for phase adjustment, allowing it to occur at particular times of the circadian cycle but inhibiting it at other times (e.g., during the dead zone). This hypothetic function of CREB, constituting a molecular gate for fine adjustment the circadian molecular cycling, was already assumed in mammals (Tischkau et al., 2000). CREB-dependent mechanisms appear to be highly conserved across the animal kingdom, thus making CREB a suitable candidate to connect the neuronal excitatory state with the molecular clock, hence allowing further fine-tuning of the clock.
Leaving all speculation aside, we show here that the molecular clock can be quickly phase shifted by depolarization of the clock neurons. cAMP, PKA, and CREB might be involved in transducing the signals from the membrane to the clock machinery, but the precise mechanisms still have to be clarified. We also show that the M cells are very potent in advancing the activity rhythm, whereas the E cells are dominant in phase delaying it but depend on PDF from the l-LNvs. Finally, we demonstrate that the M neurons are normally inhibited during the first half the day, not to provoke phase advances during the dead zone in the PRC. This inhibition is most likely achieved by other clock neurons in the clock network.
Footnotes
Acknowledgements
We thank Ralf Stanewsky for the anti-PER antiserum and Paul Hardin for the anti-VRI antiserum. We thank André Klarsfeld and Christian Wegener for scientific discussion and Marta Beauchamp for language corrections. We thank Melanie Horn and Frank Schubert for assistance with the vast fly dissections. This study was funded by the German Research Foundation (DFG), collaborative research center SFB 1047 “Insect timing,” project A3.