
Abstract
Several tools use prior biological knowledge to interpret gene expression data. However, existing enrichment tools assume that variables are monotonic and incorrectly measure the distance between periodic phases. As a result, these tools are poorly suited for the analysis of the cell cycle, circadian clock, or other periodic systems. Here, we develop Phase Set Enrichment Analysis (PSEA) to incorporate prior knowledge into the analysis of periodic data. PSEA identifies biologically related gene sets showing temporally coordinated expression. Using synthetic gene sets of various sizes generated from von Mises (circular normal) distributions, we benchmarked PSEA alongside existing methods. PSEA offered enhanced sensitivity over a broad range of von Mises distributions and gene set sizes. Importantly, and unlike existing tools, the sensitivity of PSEA is independent of the mean expression phase of the set. We applied PSEA to 4 published datasets. Application of PSEA to the mouse circadian atlas revealed that several pathways, including those regulating immune and cell-cycle function, demonstrate temporal orchestration across multiple tissues. We then applied PSEA to the phase shifts following a restricted feeding paradigm. We found that this perturbation disrupts intraorgan metabolic synchrony in the liver, altering the timing between anabolic and catabolic pathways. Reanalysis of expression data using custom gene sets derived from recent ChIP-seq results revealed circadian transcriptional targets bound exclusively by CLOCK, independently of BMAL1, differ from other exclusive circadian output genes and have well-synchronized phases. Finally, we used PSEA to compare 2 cell-cycle datasets. PSEA increased the apparent biological overlap while also revealing evidence of cell-cycle dysregulation in these cancer cells. To encourage its use by the community, we have implemented PSEA as a Java application. In sum, PSEA offers a powerful new tool to investigate large-scale, periodic data for biological insight.
Keywords
Adaptations to planetary cycles are ubiquitous among living organisms. In humans, circadian disruption affects glucose homeostasis and lipid metabolism, alters cardiovascular function, and influences chemotherapeutic sensitivity (Martino et al., 2008; Scheer et al., 2009; Buxton et al., 2012). Mutations in genes controlling the circadian clock increase sensitivity to mutagens (Fu et al., 2002; Hoffman et al., 2010). Shift work is epidemiologically linked to an increased risk of obesity (De Bacquer et al., 2009), diabetes (Maury et al., 2010), cardiovascular disease (Faraut et al., 2012), and several internal cancers (Davis et al., 2001; Grundy et al., 2013; Flynn-Evans et al., 2013; Viswanathan et al., 2007; Sahar and Sassone-Corsi, 2009; Parent et al., 2012). Of course, circadian rhythms are but one of many important periodic biological phenomena. Other well-studied rhythms include the non-REM/REM sleep cycle, the somite clock (Jiang et al., 2000), larval development of Caenorhabditis elegans (Spencer et al., 2011; Monsalve et al., 2011; Hendriks et al., 2014), the menstrual cycle, and the cell cycle (Kastan and Bartek, 2004).
However, despite growing appreciation for the significance of biological rhythms, translation into medically actionable knowledge has been elusive. Which diseases modulate rhythms? How do rhythms affect the appropriate timing of medications or onset of symptoms? More simply, how do rhythmic processes influence cellular physiology? This deficiency in understanding is not due to a simple lack of data. Scores of time-series gene expression studies examining a variety of tissues and experimental conditions have been published (e.g., Zhang et al., 2014; Bossé et al., 2012; Ptitsyn and Gimble, 2011; Hughes et al., 2009; Sukumaran et al., 2011). The complex temporal relationships between hundreds to thousands of rhythmic transcripts (or metabolites) make high-level understanding of the biology difficult. Better analytical tools are needed to interpret rhythmic data in a biological context.
Many databases of functional gene annotations exist, including Gene Ontology (Gene Ontology Consortium, 2008). Similarly, KEGG (Kanehisa et al., 2014) and Reactome (Croft et al., 2014) identify genes that work as part of defined pathways. Genes that share functional or pathway annotations can often be considered usefully as a set. For example, genes involved in the Krebs cycle might form 1 set, while genes associated with Parkinson’s disease form another. The Broad Institute maintains a comprehensive database of biologically important gene sets called the Molecular Signatures Database (MSigDB) (Subramanian et al., 2005). Often researchers want to discover how these gene sets behave in various conditions, including periodic biology.
Overrepresentation tools, like DAVID (Huang et al., 2009b) and GoMiner (Zeeberg et al., 2003), are commonly used to identify the influence of a perturbation on gene or metabolite sets. Set members and nonmembers are partitioned into differentially expressed and normally expressed groups (Huang et al., 2009b). Overrepresentation is then assessed with the chi-square or Fisher’s exact test. However, overrepresentation analysis has several recognized disadvantages, and replicate studies often show poor overlap (Huang et al., 2009a; Irizarry et al., 2009). Foremost among these disadvantages is the need for strict, often arbitrary, significance cutoffs. Time-series data are even more difficult to analyze. Temporal data are binned into discrete temporal windows or approximate clusters with each bin analyzed independently (e.g., 0-4 h, 4-8 h, etc.). Both suboptimal binning and the requisite corrections for multiple testing reduce the statistical power of these techniques.
More recently, aggregate score methods have been developed. These approaches allow each individual gene to contribute incrementally to the score of the entire set. Aggregate score tools remove the need for strict cutoffs and are more robust against small variations. Tools based on the z-score (Tian et al., 2005) or t-test (Tian et al., 2005) have been developed. The most popular method, Gene Set Enrichment Analysis (GSEA) (Subramanian et al., 2005), uses a weighted Kolmogorov-Smirnov (K S) test.
However, current aggregate-score tools analyze periodic data poorly. These tools assume that data are measured using a monotonic metric with small values (e.g., 0 h) far away from larger ones (e.g., 24 h). In periodic data, circadian time (CT) 0 is the same as CT24 because the end of 1 cycle is the start of the next. Thus, GSEA and similar methods incorrectly measure the temporal distance between the phases. These methods aren’t appropriate for analyzing periodic phase data where the critical question is when things happen.
In this paper, we describe a new method and associated software package, Phase Set Enrichment Analysis (PSEA), to solve this problem and gain a better understanding of periodic biological systems. PSEA requires users to input a file that contains a list of cycling transcripts and their peak phases of expression. This file is then analyzed in the context of annotated gene sets and pathways. PSEA uses the gene matrix transpose (GMT) file format to define gene sets so that the entire collection of annotated sets available in the MSigDB (Subramanian et al., 2005) is immediately available for testing. PSEA evaluates each selected gene set for evidence of temporally coordinated transcription. It provides summary statistics describing these gene sets and produces summary diagrams depicting the results. We used simulated data to verify the reliability of this approach. We then applied PSEA to several published circadian and cell-cycle datasets to investigate standing biological questions. These topics are presented as 4 case studies. Each case study highlights a different use of PSEA to gain new insights in biological rhythms. Finally, we have developed an open source software package to enable biologists to analyze their own periodic data and pose new biological questions.
Materials and Methods
The Phase Set Enrichment Analysis (PSEA) Algorithm
PSEA involves 3 steps. The first step is to identify biologically related gene sets consisting of genes transcribed rhythmically and with nonuniformly distributed phases. Because phase is a periodic variable and small phase values are adjacent to large ones, this identification should rely on a test that is appropriate for such data. The test statistic should be independent of the arbitrary time marking the end of 1 cycle and the beginning of the next. Moreover, it should be equally sensitive in discriminating phase sets concentrated at any time in the periodic cycle. The Kuiper test (Kuiper, 1962)—a nonparametric test that assesses the discrepancy between a sample cumulative probability distribution and a background distribution—meets these criteria. The Kuiper test totals the magnitudes of D+ and D−, the maximal positive and negative discrepancies between the sample and background cumulative distribution functions. Shifting the point that marks the beginning of a cycle changes D+, but this change is always balanced by a reciprocal change in D−. Thus, the test is invariant to cyclic translations of the independent variable. The null hypothesis is that sample is drawn from the given background distribution. The significance of the test statistic can be evaluated by comparison with the Kuiper metrics produced from random gene sets of the same size sampled from the given background.
As implemented in PSEA, the Kuiper test statistic is used to compare a given set to both a uniform background distribution and the empirical background of all other cycling transcripts in the data. These tests ask fundamentally different questions and can give different results. For example, in several tissues, the majority of cycling transcripts demonstrate peak expression within a narrow temporal window (e.g., dawn). A gene set with temporally coordinated transcription near dawn would be significantly different from a uniform distribution but might not be different from the background. If the goal is to find gene sets that behave differently from the mass of other cycling transcripts, the empirical background is appropriate. If the goal is to identify temporal synchronization, a comparison with a uniform background is suggested. The ability to test against a nonuniform background is particularly important in analyzing temporal shifts following a perturbation. In such experiments, a likely null hypothesis is that there is no shift (i.e., a coherent shift of 0 h) as opposed to a uniform distribution of shifts.
After a set is identified either as having nonuniformly distributed phases or as being significantly different from background, the second step is to find the circular mean phase of the entire set (Fisher, 1995). The circular (sometimes called vector) mean has both a phase and magnitude. The phase of the circular mean is a measure of the timing of the biological process or gene set. The magnitude provides a measure of the temporal cohesiveness of the set. Sets strongly clustered about a single phase have a large magnitude. Sets with significantly, nonuniformly distributed phases but with small magnitudes display multimodal phase clustering. Multimodal phase clustering is known to arise in certain biological contexts. For example, several important pathways are composed of genes or proteins that peak at either dusk or dawn (Zhang et al., 2014; Hughes et al., 2009).
Finally, the third step is to quantify the relative contribution of each gene in the set toward the set’s nonuniformity. We implemented a “leave-one-out” approach for this step. A gene is removed from the set, and the Kuiper test statistic is calculated for the remainder of the set. The gene is then replaced, another gene is removed, and the Kuiper statistic is recalculated. This process is repeated until each gene has been removed once from the set. The removal of genes having greater contribution toward phase clustering results in greater reductions in the Kuiper statistic, allowing the subset(s) of genes comprising the main phase cluster(s) to be readily distinguished.
Benchmarking the Kuiper Test
To verify key features of the Kuiper test, we applied the test repeatedly to synthetic gene sets, drawn from a variety of simulated von Mises distributions. These pseudorandom sets were generated from the specified distributions using the Colt Open Source Library for Technical Computation developed by CERN (European Organization for Nuclear Research). The synthetic gene sets were compared with a uniform reference distribution. The von Mises distribution, also known as the circular normal distribution, takes 2 parameters: mean (µ) and reciprocal variance or concentration parameter (κ). In our simulations, we systematically changed both µ and κ to produce a gamut of von Mises distributions. Changes to µ produce cyclic translation, while increases to κ increase departure from uniformity.
We generated thousands of synthetic gene sets of different sizes (N = 10, 20, 30, 40, and 50) and evaluated the power of the Kuiper test as a function of µ, κ, and N. For comparison, the KS test, the basis of GSEA, was also examined. These simulations were then repeated to assess performance against a nonuniform background, replacing the uniform reference distribution with von Mises reference distribution (µ = π, κ = 2). We also benchmarked a typical binning-followed-by-overrepresentation approach. Using the same synthetic data, we tested 4 common binning strategies (2, 4, 6, and 12 equally spaced bins). Fisher’s exact test was used to evaluate overrepresentation, and p values were Bonferroni corrected for the required repeat testing (i.e., for 2, 4, 6, or 12 tests).
Java Implementation
The Java implementation of PSEA requires the user to input a list of cycling transcripts, their phases of peak expression, and a library of annotated gene sets. The program uses the GMT file format used for the gene sets available in the MSigDB. It compares the acrophases of the cycling transcripts (or metabolites) belonging to each annotated gene set to both a uniform background and the empirical distribution of acrophases in the entire data set. In addition to providing the summary statistics described above, the package creates image files to display both a summary of robustly cycling gene sets within the tissue and a more detailed picture of the genes involved in each set.
Java 1.6 was used for implementation of the PSEA algorithm and for all validation simulations presented. The empirical null distribution for the Kuiper test metric is generated by bootstrap. Test sets of the same size as the set under evaluation are drawn from either the uniform distribution or the empirical distribution of phases in the complete data set. These sets are compared with the corresponding full distributions with the Kuiper statistic. Repeating this procedure generates the empirical null distribution for the Kuiper test statistic. PSEA generates the null distributions for the Kuiper statistic dynamically. The program starts with a null distribution of sample size 100. If the p value generated from testing the data against this null distribution is less than or equal to 0.2, the null distribution will be expanded to sample size 1000 and the Kuiper test is re-performed. Otherwise, the program will return the current p value. If the p value generated from the expanded distribution equals 0, or if the difference between the newly generated p value and the p value generated from the unexpanded distribution exceeds a specified threshold, the number of permutations used to create the null distribution is further expanded by a factor of 10. The process continues until the criteria are met or the maximum number of random samples (set by the user) is reached. The user can change the specific values for each of these parameters within the PSEA program interface.
For the validation studies presented in this paper, 1 million values were randomly sampled to construct each null distribution, and the median result of 10,000 simulations is shown in Supplementary Figures 1 through 3. All false discovery rate (FDR) calculations were carried out using the Benjamini-Hochberg procedure (Yekutieli and Benjamini, 2001).
Case Study 1: Circadian Pathway Analysis across Murine Tissues
We recently published an atlas of the mouse circadian transcriptome, examining circadian gene expression in 12 different mouse organs (Zhang et al., 2014). Here, we used PSEA to reanalyze these data. Circadian gene lists were downloaded directly from the published supplementary materials of Zhang et al. Kuiper tests were performed with FDR threshold of q < 0.05. To evaluate the influence of different primary rhythm detection methods, JTK_CYCLE (v2.1) (Hughes et al., 2010) and Lomb-Scargle (Glynn et al., 2006) were both applied to normalized expression data downloaded from the supplementary materials of Hughes et al. Detection parameters for both algorithms were specified so as to fit the data to a 24-h period. A significance threshold of q < 0.05 was used to bound results from both the JTK_CYCLE and Lomb-Scargle analyses. Gene sets were downloaded from MSigDB C2 (“Canonical Pathways”). Sets containing fewer than 5 rhythmic genes were ignored during gene-phase set enrichment analysis. As the MSigDB contains human genes, murine gene symbols arising in case studies 1 and 2 were mapped to homologous human gene symbols using the Ensembl system (Flicek et al., 2014).
Case Study 2: Intraorgan Shifts in Response to Temporally Restricted Feeding
The time of feeding can synchronize the circadian clocks of peripheral tissues and can induce the liver clock to run 12 h out-of-phase with locomotor rhythms. Comparing their own data to those of Hughes et al. (2009), Vollmers et al. (2009) showed that restricting the feeding of nocturnal mice to the subjective day preserves the cycling of most rhythmic genes but shifts their expression. It has been hypothesized that this shifting results in interorgan desynchrony—that is, between metabolic programs in liver, fat, and skeletal muscle. However, a set-level analysis of the intraorgan synchronization within the liver has not been published.
We applied PSEA to this problem and the temporal shifts in gene expression. Affymetrix CEL files describing microarray results from both Vollmers et al. (2009) and Hughes et al. (2009) were downloaded from NIH GEO and processed using the gcRMA algorithm (Wu et al., n.d.) as implemented in R bioconductor (Gentleman et al., 2004). JTK_CYCLE (v2.1) was used to assess transcript cycling and to assign transcript phase. Analysis was limited to transcripts that cycled (q < 0.05) in both conditions. For each such transcript, the difference between the acrophases observed in the 2 conditions was computed. Gene sets and enrichment analysis settings were the same as for Case Study 1.
Case Study 3: Exclusive Targets of Core Circadian Transcription Factors
The core circadian transactivators, CLOCK and BMAL1, act together as a heterodimer and are repressed by various combinations of the repressors, PER1/PER2/PER3 and CRY1/CRY2. Recently, Koike et al. (2012) reported that each individual core factor also binds rhythmically to its own unique subset of genes, without other core clock factors. We questioned whether the exclusive binding of a single circadian transcription factor represented true circadian biology or was largely an artifact of the imperfect sensitivity and specificity of the ChIP-seq assay used.
We hypothesized that temporal coordination may support a true biological function for exclusive clock factor binding. To consider whether these potential biological groupings shared temporal organization, we used the data of Koike et al. (2012) to create a custom library of annotated gene sets composed of genomic loci with promoters bound exclusively by each isolated factor (i.e., a CLOCK set, a BMAL1 set, etc.). Lists of target genomic loci for each core clock transcription factor were obtained from the “Master peak list” within the supplementary materials of Koike et al. (2012). Exclusive targets were bound by the specified circadian transcription factor but were not bound by any of the other tested factors. These custom gene sets were then input to the PSEA program for analysis of the liver transcriptome as reported by Hughes et al. (2009) and analyzed using JTK_CYCLE. Kuiper tests were performed with FDR threshold of q < 0.05. For each set, a custom background gene set containing all genes rhythmically bound by the same clock factor, but without regard to exclusivity, was generated.
Case Study 4: Phases of the Cell Cycle in Two Cancer Cell Lines
Phase set enrichment analysis can be used in many other contexts involving biological periodicity. The cell cycle, a phenomenon centrally relevant to cancer, is a prime example (Kastan and Bartek, 2004). In 2002, Whitfield et al. published a seminal dataset of periodically expressed genes in the HeLa cervical cancer cell line. More recently, Grant et al. (2013) published a similar dataset for the U2OS osteosarcoma cell line. Both studies used the same experimental design to identify hundreds of cell-cycle periodic genes, and both studies used DAVID to discover pathway enrichment. We reanalyzed these 2 datasets using PSEA to compare cell-cycle timing between the 2 cancer lines (Figure 5).
Lists of cell-cycle periodic genes and their phases, in radians, were downloaded from the supplementary materials of Whitfield et al. (2002) and Grant et al. (2013). Kuiper tests were performed with FDR threshold of q < 0.05. Domain positions for S and M phases of the cell cycle were derived from computing the phase vector-average angle of the representative gene sets “KEGG_DNA_REPLICATION” and “REACTOME_MITOTIC_PROMETAPHASE,” respectively. Positions for G1 and G2 were then inferred midway between S and M positions.
Results
Benchmarking the Kuiper Test
The KS test demonstrated wildly fluctuating statistical power across a cyclic domain, achieving maximum power at only 2 positions in the domain while failing elsewhere. In contrast, the Kuiper test not only was uniformly powerful across a cyclic domain but also was considerably more powerful than the KS test throughout (Suppl. Figs. 1 and 2). Even after we replaced the reference uniform distribution with a reference von Mises distribution, the results were similar (Suppl. Fig. 3). Thus, Kuiper’s test outperforms the KS test for periodic data. Comparing with binning strategies, our results showed, as expected, that different binning windows are more effective depending on the width of the gene set of interest. Moreover, the sensitivity of this strategy also showed marked fluctuation across the cyclic domain. Sets centered near the transition points separating adjacent temporal bins were more easily missed (Suppl. Fig. 4). Within the broad parameter range tested, all 4 binning strategies were inferior to Kuiper’s test (Suppl. Fig. 5).
Case Study 1: Circadian Pathway Analysis across Murine Tissues
We found that many important physiological pathways were clock-regulated and peaked at certain times of the day. Examples from brown fat (Fig. 1) and skeletal muscle (Suppl. Fig. 6) are shown. In both, extracellular matrix organization and leukocyte transendothelial migration pathways clustered near subjective dawn. This result is notable because subjective dawn corresponds to the CT0/24 breakpoint over which existing gene set enrichment methods fail, but PSEA does not. Neither GSEA nor DAVID identified most of these pathways. A small minority of pathways clustered at other times of the day in these 2 organs. For example, in brown fat, glycerophospholipid metabolism concentrated during midday. Lipid and lipoprotein metabolism pathways had bimodal phase clustering concentrated at both dusk and dawn. Again, GSEA and DAVID did not detect these bimodally distributed gene sets and pathways at the requisite p value cutoff. Supplemental Table 1 provides the complete PSEA results from all 12 organs in this study.
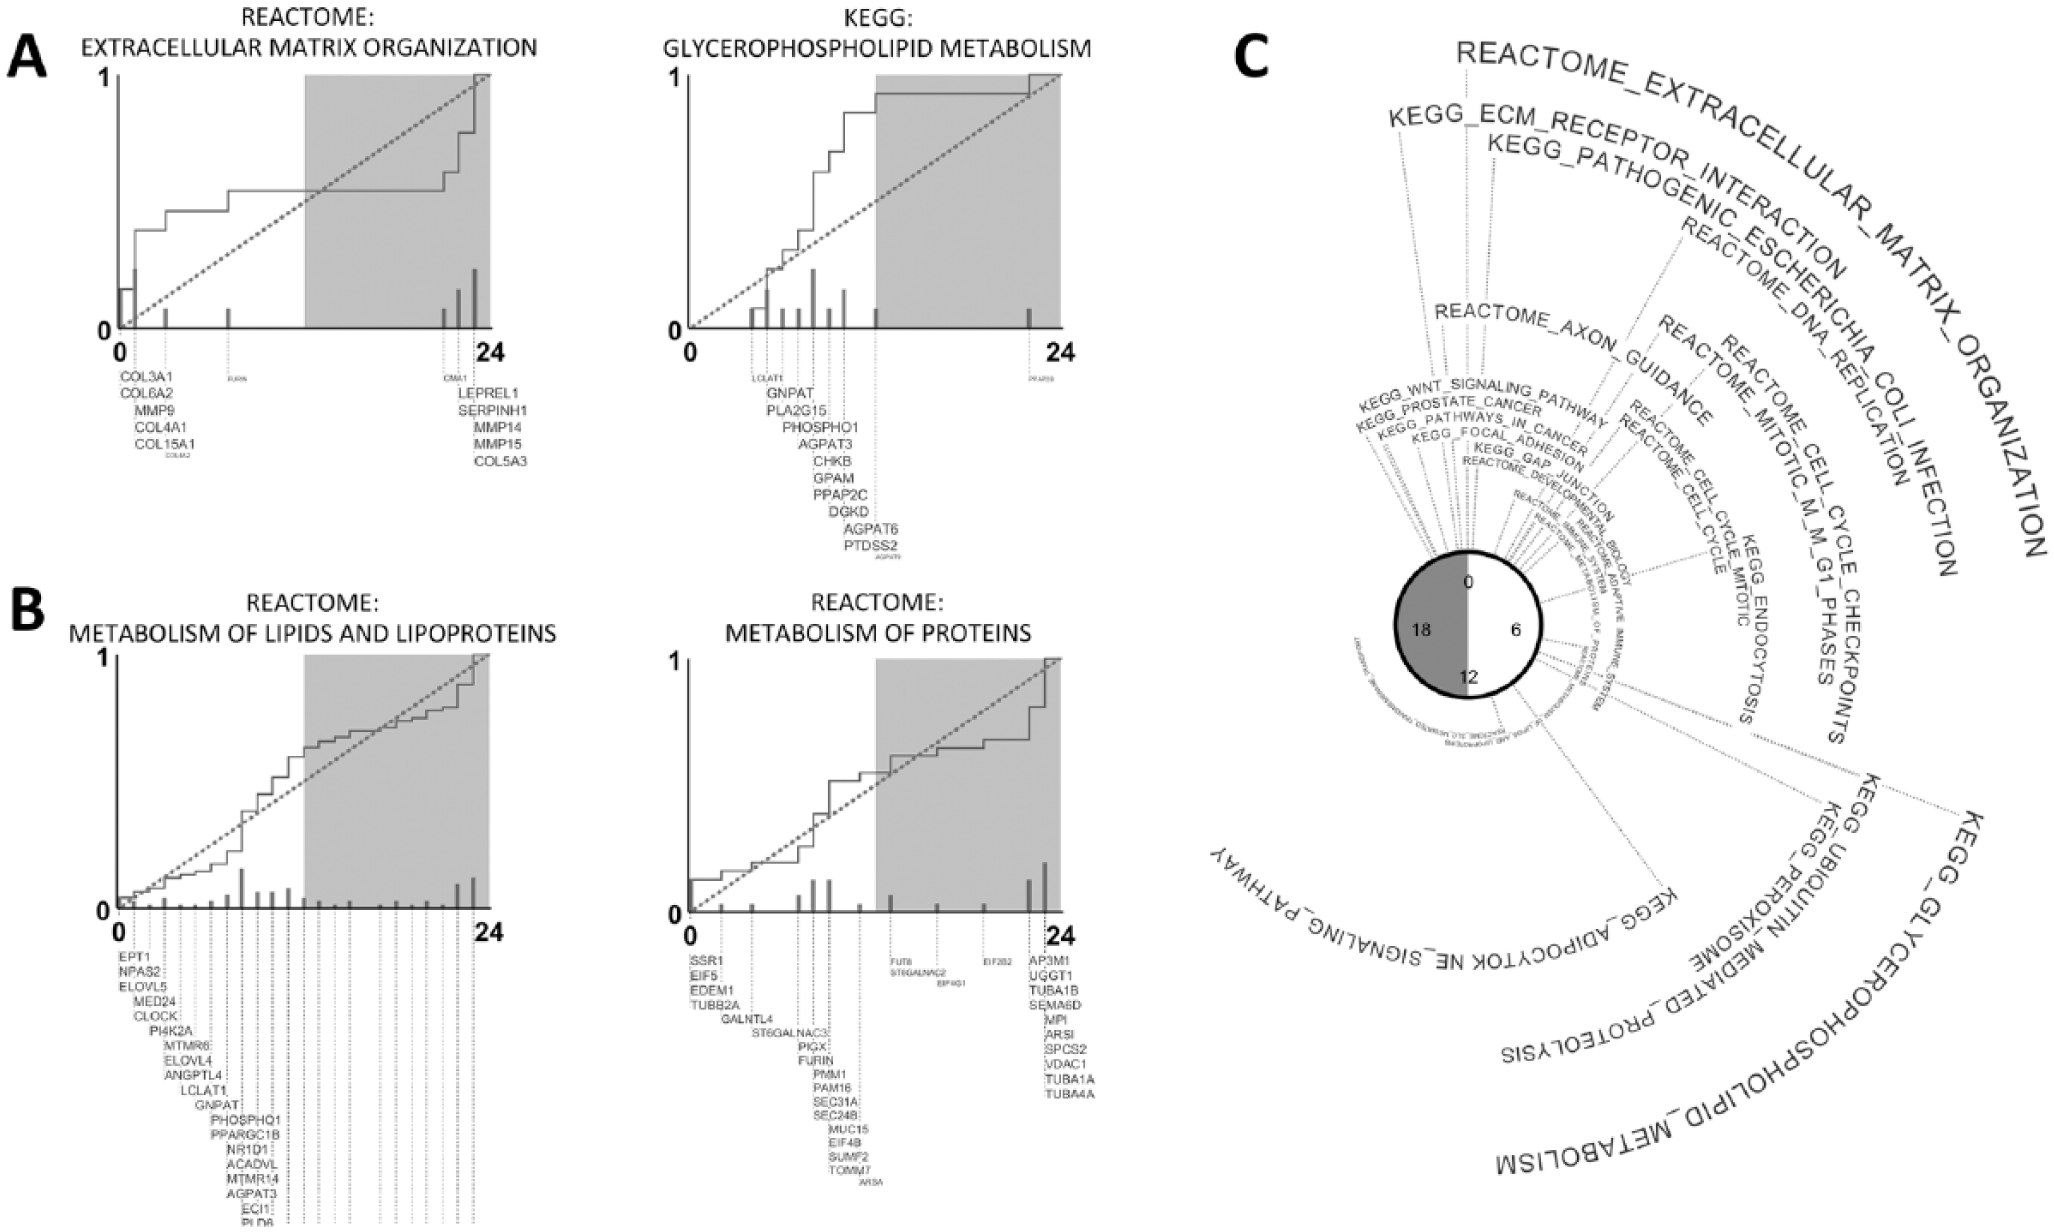
Phase-clustered pathways in mouse brown fat. Examples of (A) 2 unimodally phase-clustered pathways and (B) 2 bimodally phase-clustered pathways. The empirical cumulative distribution of phases belonging to genes in the pathway is shown in dark gray. Acrophases are measured in circadian time (CT). A dotted line depicts the uniform distribution. The Kuiper test is used to compare these distributions and test for nonuniformity. Individual gene names are shown as permitted by figure space, with larger font-size of a gene name indicating greater contribution by that gene to the overall phase clustering of a pathway. (C) Summary of significantly phase-clustered (q < 0.05) pathways in mouse brown fat. Circular axis (angle) represents the vector-average phase (circadian time) of all circadian genes in a pathway. Larger font-size of a pathway name indicates a larger magnitude of the vector-average (more unimodally clustered).
Several pathways and gene sets, including those describing the immune system, metabolism of lipids, metabolism of proteins, and cancer, demonstrated circadian orchestration in multiple tissues (Fig. 2). Interestingly, pathways that were clock regulated in multiple tissues were timed differently in the lung and aorta compared with other tissues. Disparate timing in lung physiology is an interesting finding demonstrating the importance of tissue-specific factors in circadian timing. However, in the context of widespread circadian regulation of the cell cycle, it becomes especially noteworthy. It has been well established that the efficacy of several cell-cycle-targeted chemotherapeutics varies as a function of administration time (Lévi et al., 2010). Our results suggest that the optimal dosing period for lung cancers may be different than that for other solid organ tumors. Similarly, immunomodulator therapy is now being used for a growing list of disorders. Our results suggest that these agents may also benefit from timed administration and that the optimal timing may depend upon tissue. PSEA analysis also recovered known physiology. For example, metabolism of carbohydrates was about 6 h out of phase between liver and skeletal muscle, consistent with the different roles these organs have in energy production and consumption (Berg et al., 2002).
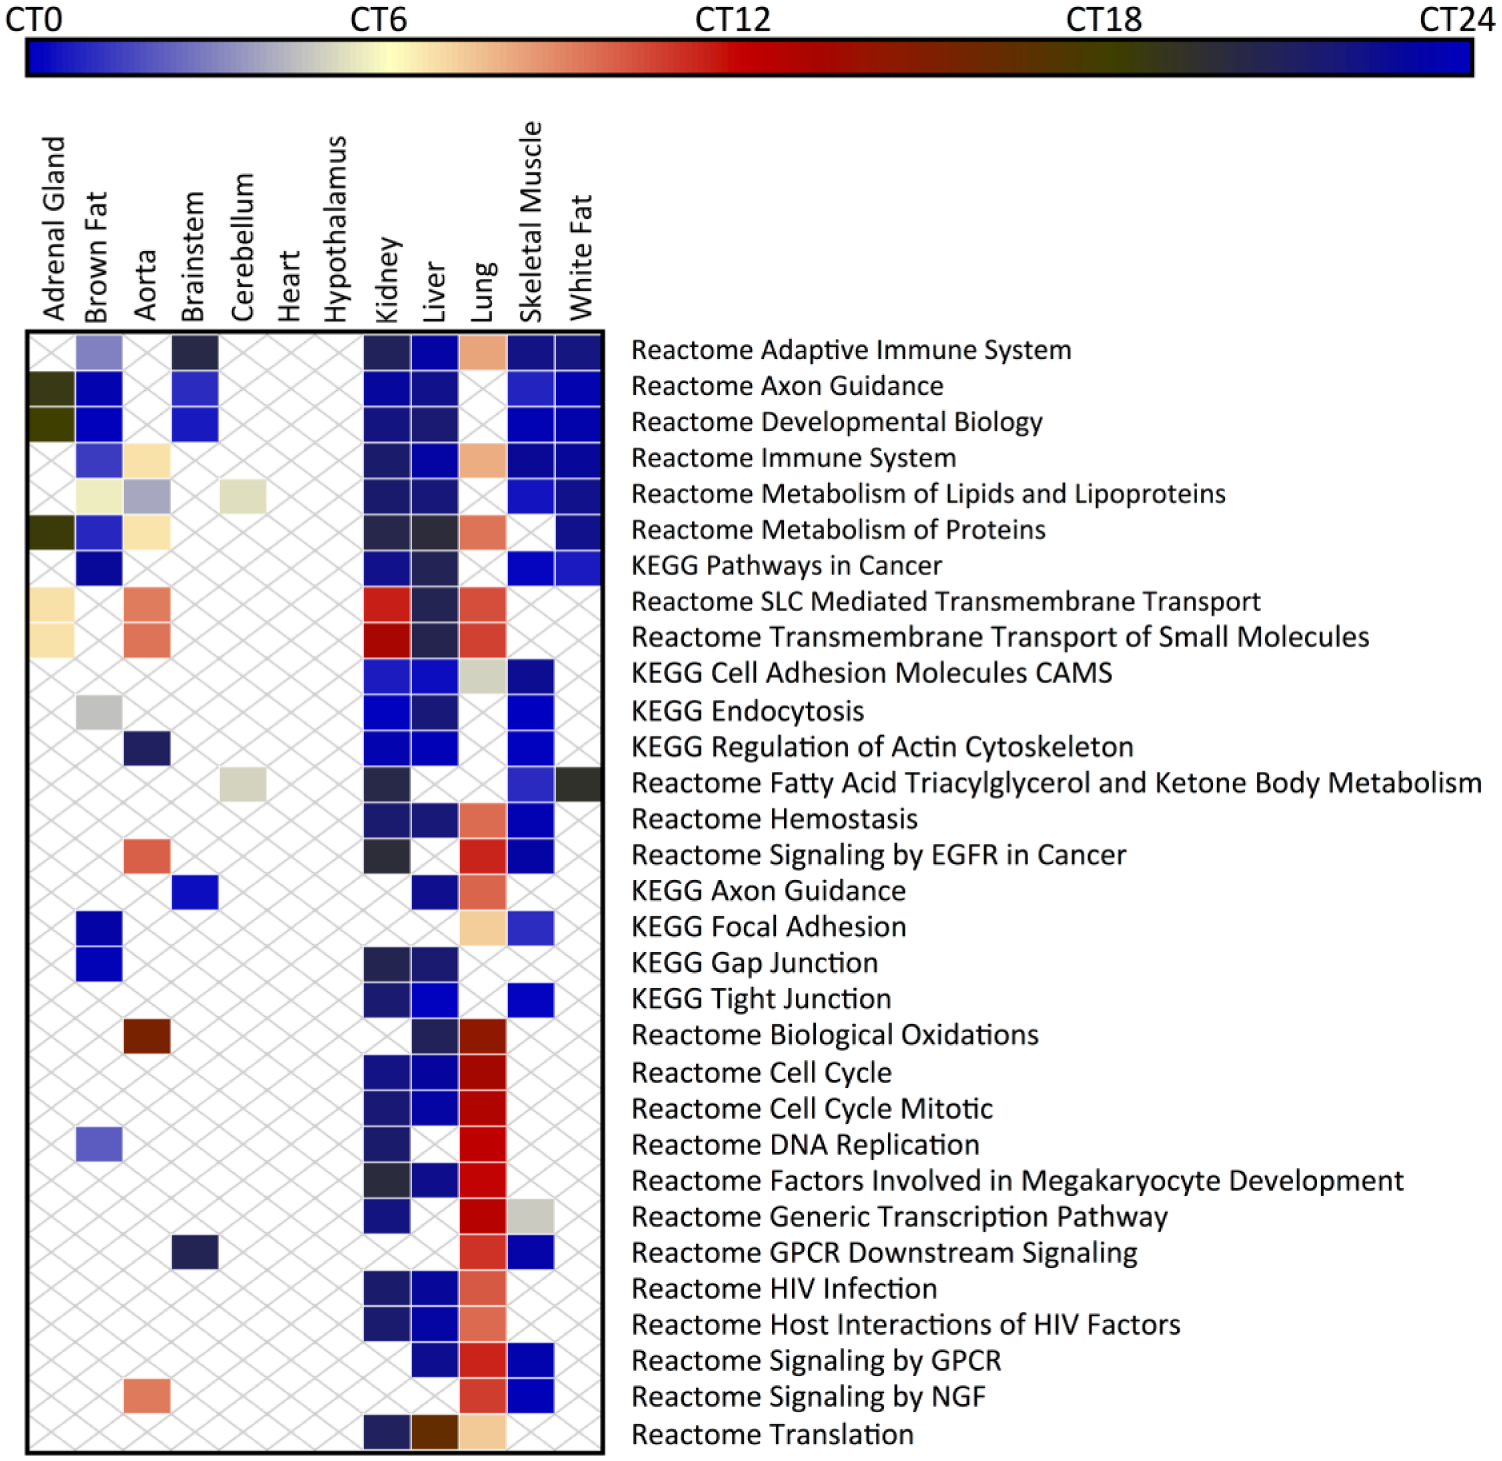
Overview of circadian-phase-clustered pathways in the mouse atlas of circadian transcription. Pathways (gene sets) consist of the C2 “Canonical Pathways” entries from MSigDB. Color is used to represent the vector-average phase of the pathway in the listed organ. Only pathways with significant phase clustering (q < 0.05) in 3 or more organs are shown. Complete results are provided in Supplemental Table 1.
We also investigated the mouse liver circadian transcriptome dataset from Hughes et al. (2009). We applied PSEA twice, performing the analysis using gene-level cycling parameters as estimated JTK_CYCLE (Hughes et al., 2010) or Lomb-Scargle (Glynn et al., 2006). Despite some disagreement between individual cycling genes and phases as estimated from the 2 algorithms (Deckard et al., 2013), PSEA produced nearly identical results (Suppl. Fig. 7). Pathways for the metabolism of drugs, purines, pyrimidines, and many others clustered in the subjective night, while NOTCH regulation and extracellular matrix interactions peaked during the day. Thus, PSEA was robust to small gene-level differences as well as the algorithms used to estimate phase.
Case Study 2: Intraorgan Shifts in Response to Temporally Restricted Feeding
Altered feeding time induces significant weight changes in mice (Turek et al., 2005), and, in humans, nighttime eating and shift work are linked to obesity and metabolic dysfunction (Gluck et al., 2001; Striegel-Moore et al., 2006; De Bacquer et al., 2009). Thus, the data of Vollmers et al. (2009) on the transcriptional changes in mouse liver in response to temporally restricted feeding have clear biomedical relevance. Here, we applied PSEA not to gene phases themselves but rather to gene-phase differences, or shifts, between ad libitum and restricted feeding conditions. In the liver, 84% of the individual circadian output genes that cycled in both conditions shifted in phase by 6 h or more. However, using PSEA, we found that 100% of phase-clustered pathways shifted by 6 h or more (Fig. 3). The core circadian oscillator pathway shifted phase by 12 h when feeding time was changed, as did pathways for immune signaling, endocytosis, and various other components of cell-cell communication. Unexpectedly, the circular median shift of annotated anabolic pathways, including gluconeogenesis and synthesis of bile salts, ATP, steroids, and fatty acids, was about 13 h, while the median shift of annotated catabolic pathways, including degradation of E3 ubiquitin ligase, CDH1, CDC20, and glycosaminoglycans, was 10 h (Fig. 3 and Table 1). This significant difference (circular ANOVA, p < 0.001) was surprising because synthesis and degradation are generally coupled events whose temporal relationship is tightly controlled. When feeding time was perturbed, however, this coupling was disrupted, possibly leading to an altered balance of metabolites over time. In reviewing these results, we find that a core subset of genes implicated in targeted protein degradation is involved in many different catabolic pathways and appears largely responsible for this discrepancy. Therefore, intraorgan desynchrony, in addition to desynchrony between organs, may contribute to metabolic problems associated with shifted feeding patterns.
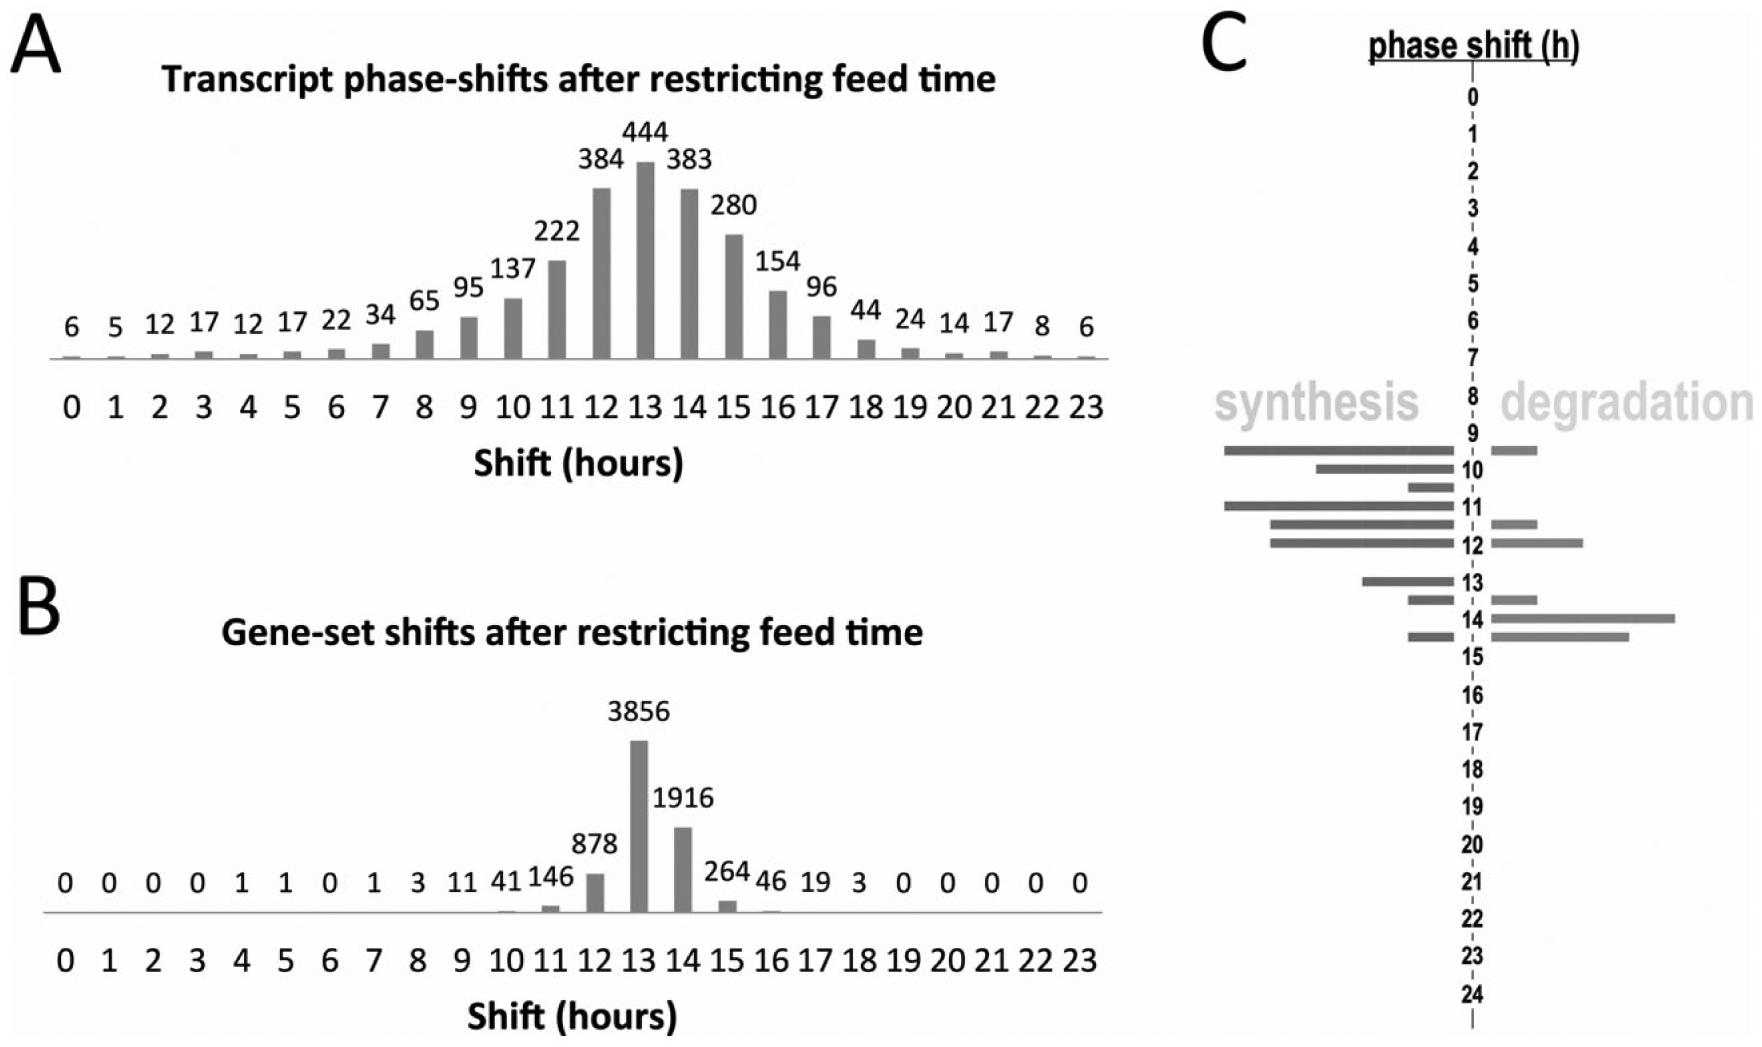
Phase shifts in mouse liver after perturbation of feeding time. The phase shift observed in each cycling gene after restricted feeding was calculated using data from Vollmers et al. (2009) and Hughes et al. (2009). Set level shifts were evaluated using the PSEA package. (A) A histogram depicting the number of cycling genes shifted by the specified amount is shown. (B) Histogram showing phase shifts at the pathway (gene set) level. (C) Histogram showing the shifts in anabolic and catabolic pathways. Anabolic sets are shown on the left and catabolic sets are shown on the right.
Phase shifts for catabolic and anabolic pathways following temporally restricting feeding.
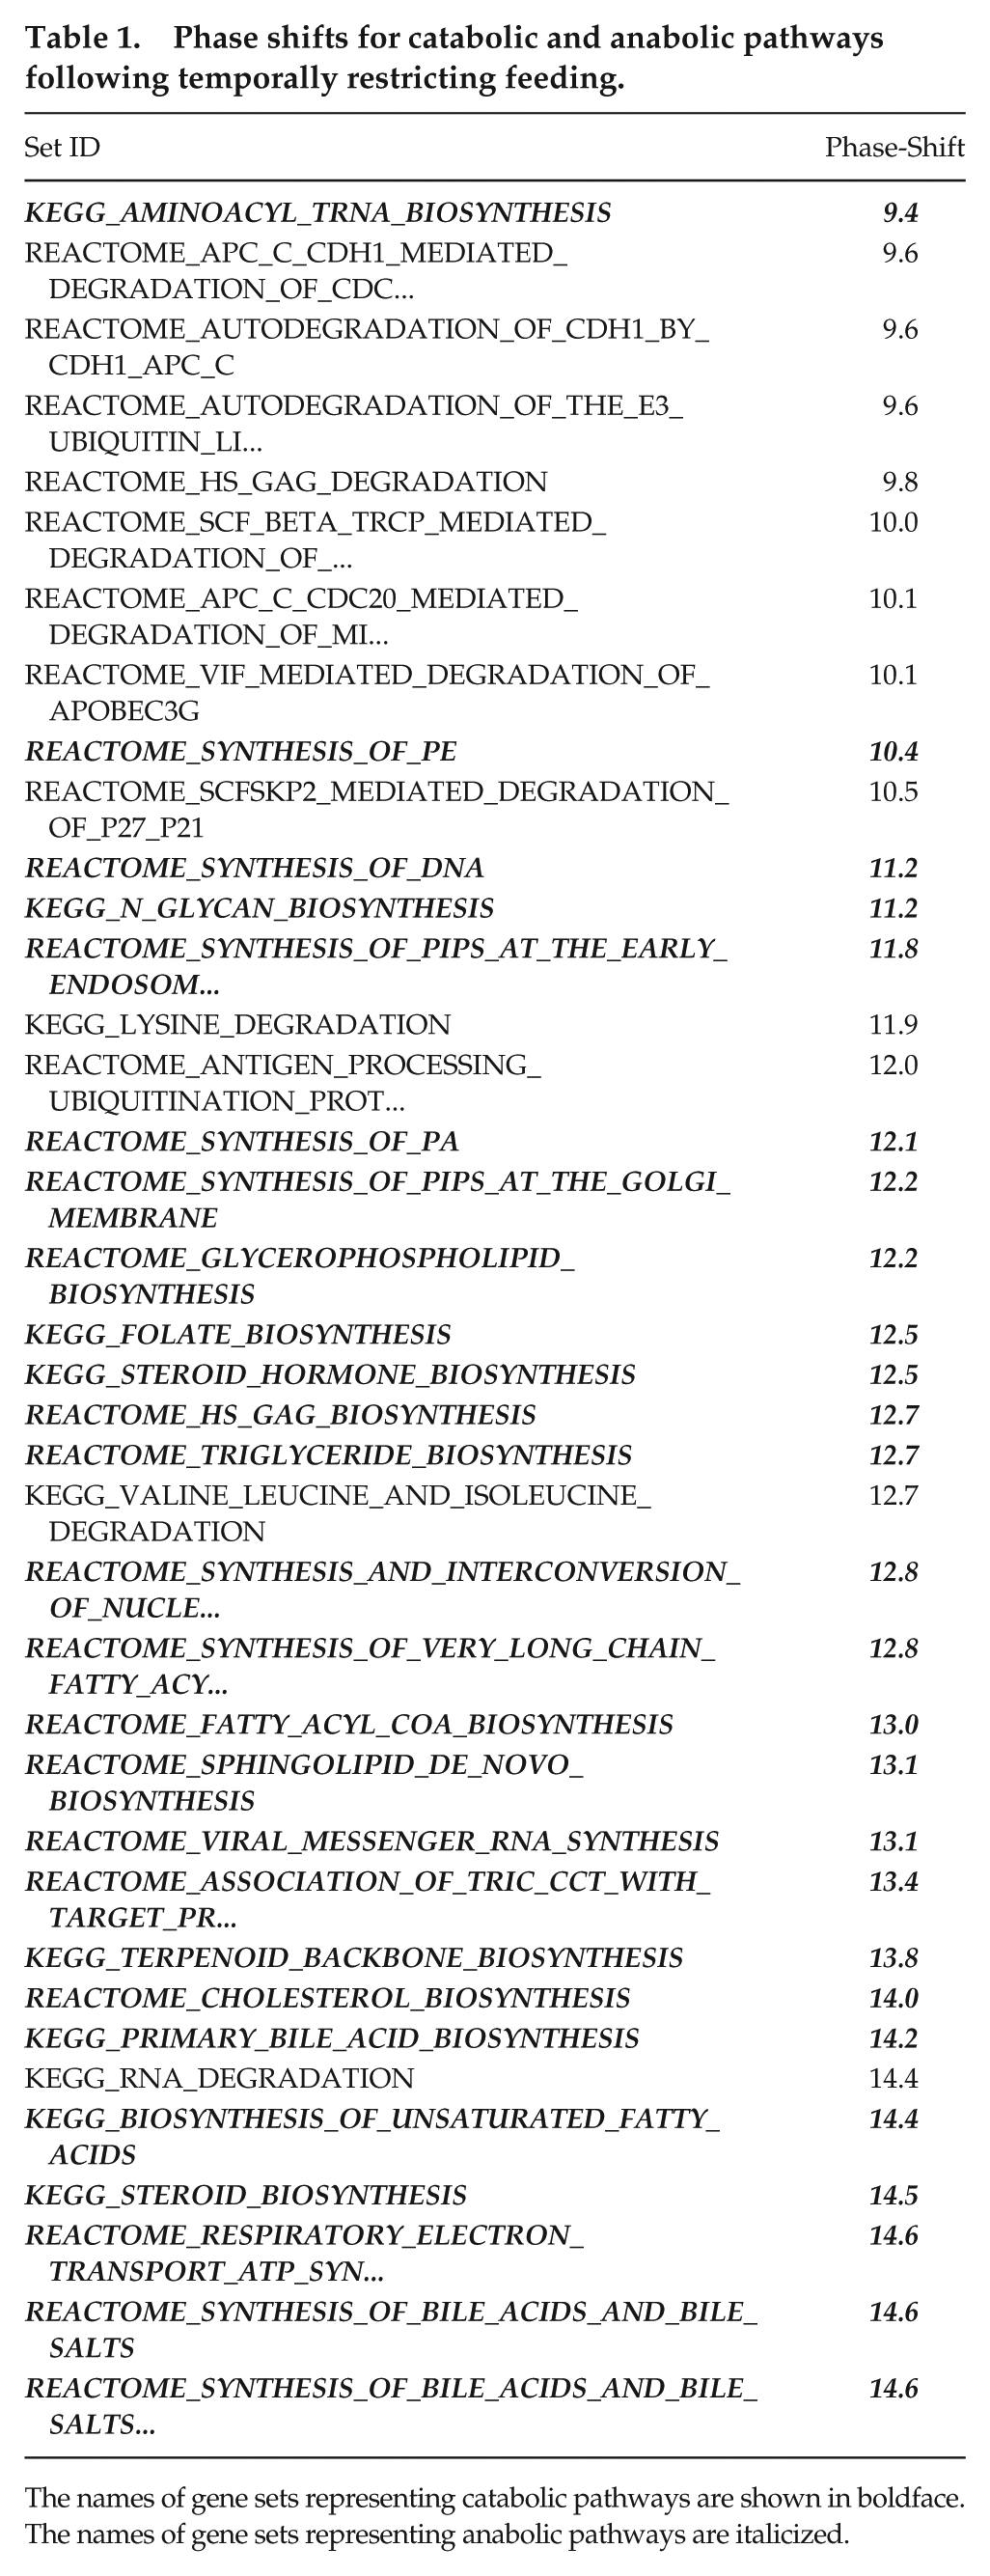
The names of gene sets representing catabolic pathways are shown in boldface. The names of gene sets representing anabolic pathways are italicized.
Case Study 3: Exclusive Targets of Core Circadian Transcription Factors
In all but 1 case, transcriptional targets of a single isolated clock factor did not demonstrate phase enrichment. Genes exclusively bound by the transcription factor CLOCK were the notable exception. Rhythmically transcribed genes whose promoters were exclusively bound by CLOCK had a significantly different acrophase distribution when compared with either the uniform distribution or the background set of all rhythmically transcribed genes bound by CLOCK (p < 0.001, Fig. 4). Fifteen such genes were identified: Alg6, Gnb2l1, Atp5c1, Pkig, Poc1b, Angel2, Zfp354b, Arl16, Med21, Mphosph6, Mrps6, Ifitm2, Rps6kb1, Sept10, and 3110001i22rik. Nearly all had peak transcript levels clustering in the early night. In contrast, exclusive targets of CLOCK’s canonical partner, BMAL1, demonstrated no identifiable phase clustering. The exclusive targets of other core factors investigated by Koike et al. (2012) also showed no phase clustering (Suppl. Fig. 8).
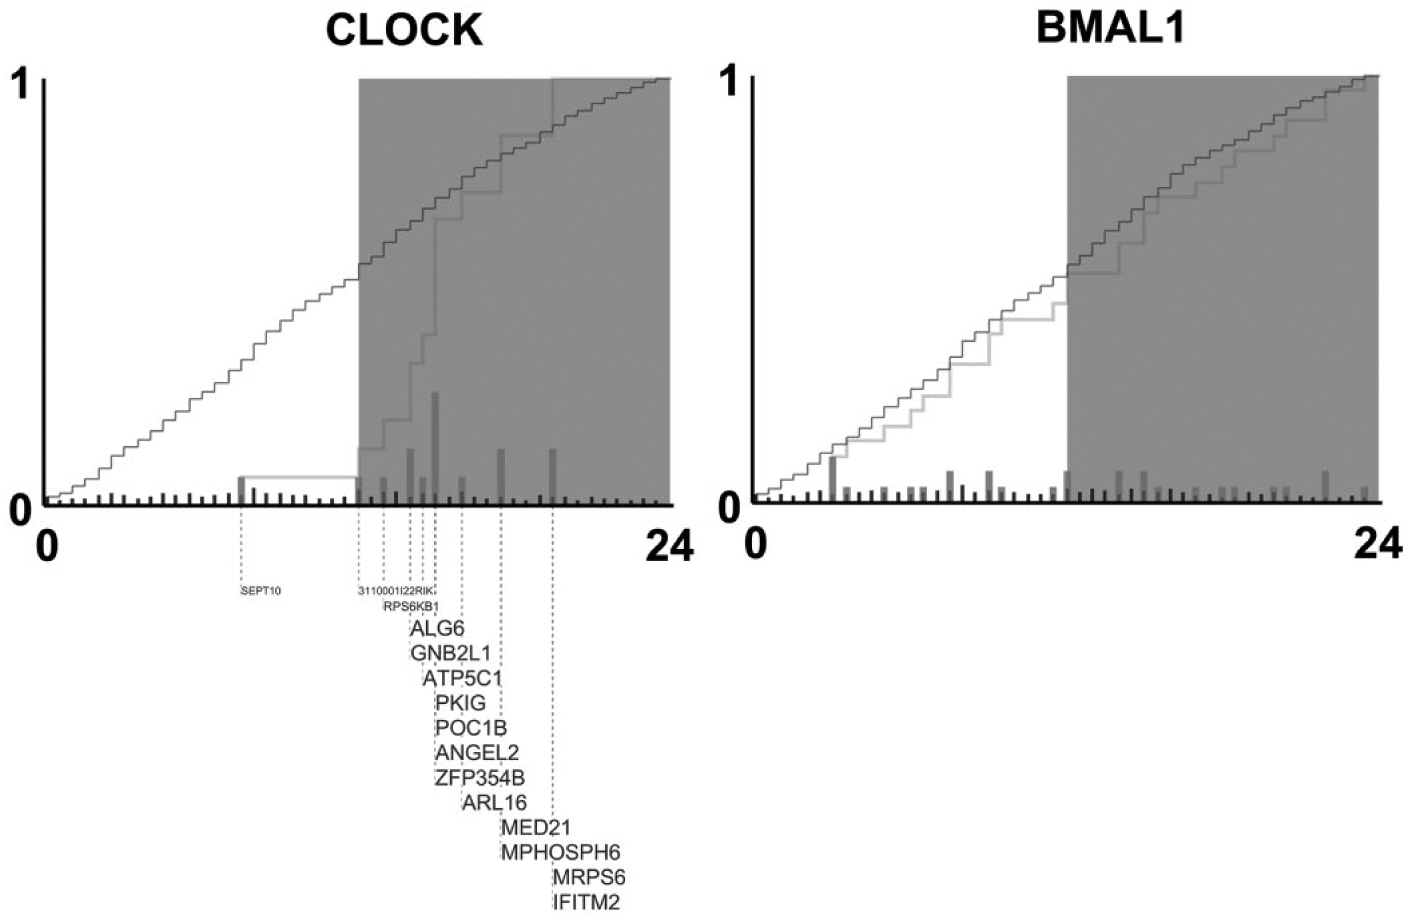
Cumulative distribution functions describing phases of exclusive targets of CLOCK and BMAL1. Subplots show the empirical cumulative distribution functions (ECDFs) of the acrophases of transcriptional targets of the listed transcription factors. Acrophase, displayed on the horizontal axis, is measured in circadian time (CT). The dark gray curves show the ECDF corresponding to the set of all cycling transcripts that are direct transcriptional targets of the specified transcription factor. The light gray curve shows the ECDF corresponding to the set of cycling transcripts that were exclusively bound by the listed circadian transcription factor. Circadian transcription factor binding data were obtained from Koike et al. (2012). Exclusive targets were found to be bound by the listed factor but were not bound by any of the other tested circadian transcription factors (CLOCK, BMAL1, PER1, PER2, CRY1, CRY2, and NPAS2). Light gray bars indicate the expression acrophases of the individual circadian output genes exclusively targeted by the listed transcription factor. Dark gray bars indicate the expression acrophases of all circadian genes targeted by the transcription factor. Gene names are shown as permitted by figure space. Larger font size indicates a greater contribution by a gene to the overall phase clustering in a gene set.
Case Study 4: Phases of the Cell Cycle in Two Cancer Cell Lines
As Whitfield et al. (2002) and Grant et al. (2013) noted, the fraction of individual cell-cycle periodic genes shared in common between HeLa and U2OS cells was surprisingly small. Our analysis revealed that the fraction of functional overlap was substantially larger at the pathway level (Fig. 5, A and B). Nearly all shared pathways concerned cell-cycle-related processes such as mitosis and DNA synthesis. Thus, as in Case Study 2, enrichment at the set level clarified the underlying biology. In both cell lines, we used the phase vector average of a prometaphase gene set and a DNA replication gene set to define the approximate positions of the M and S checkpoints along the cyclic time domain. Positions for the G1 and G2 cell-cycle phases were then inferred on either side of M and S. We found that G1 comprised a much larger proportion of the HeLa cell cycle than of the U2OS cell cycle, while the opposite was true for G2 (compare Fig. 5, C and D). This behavior is consistent with presence and absence of p16 in these 2 cell lines and the known role of p16 in decelerating the progression of the G1 to S transition (McLaughlin-Drubin et al., 2013).
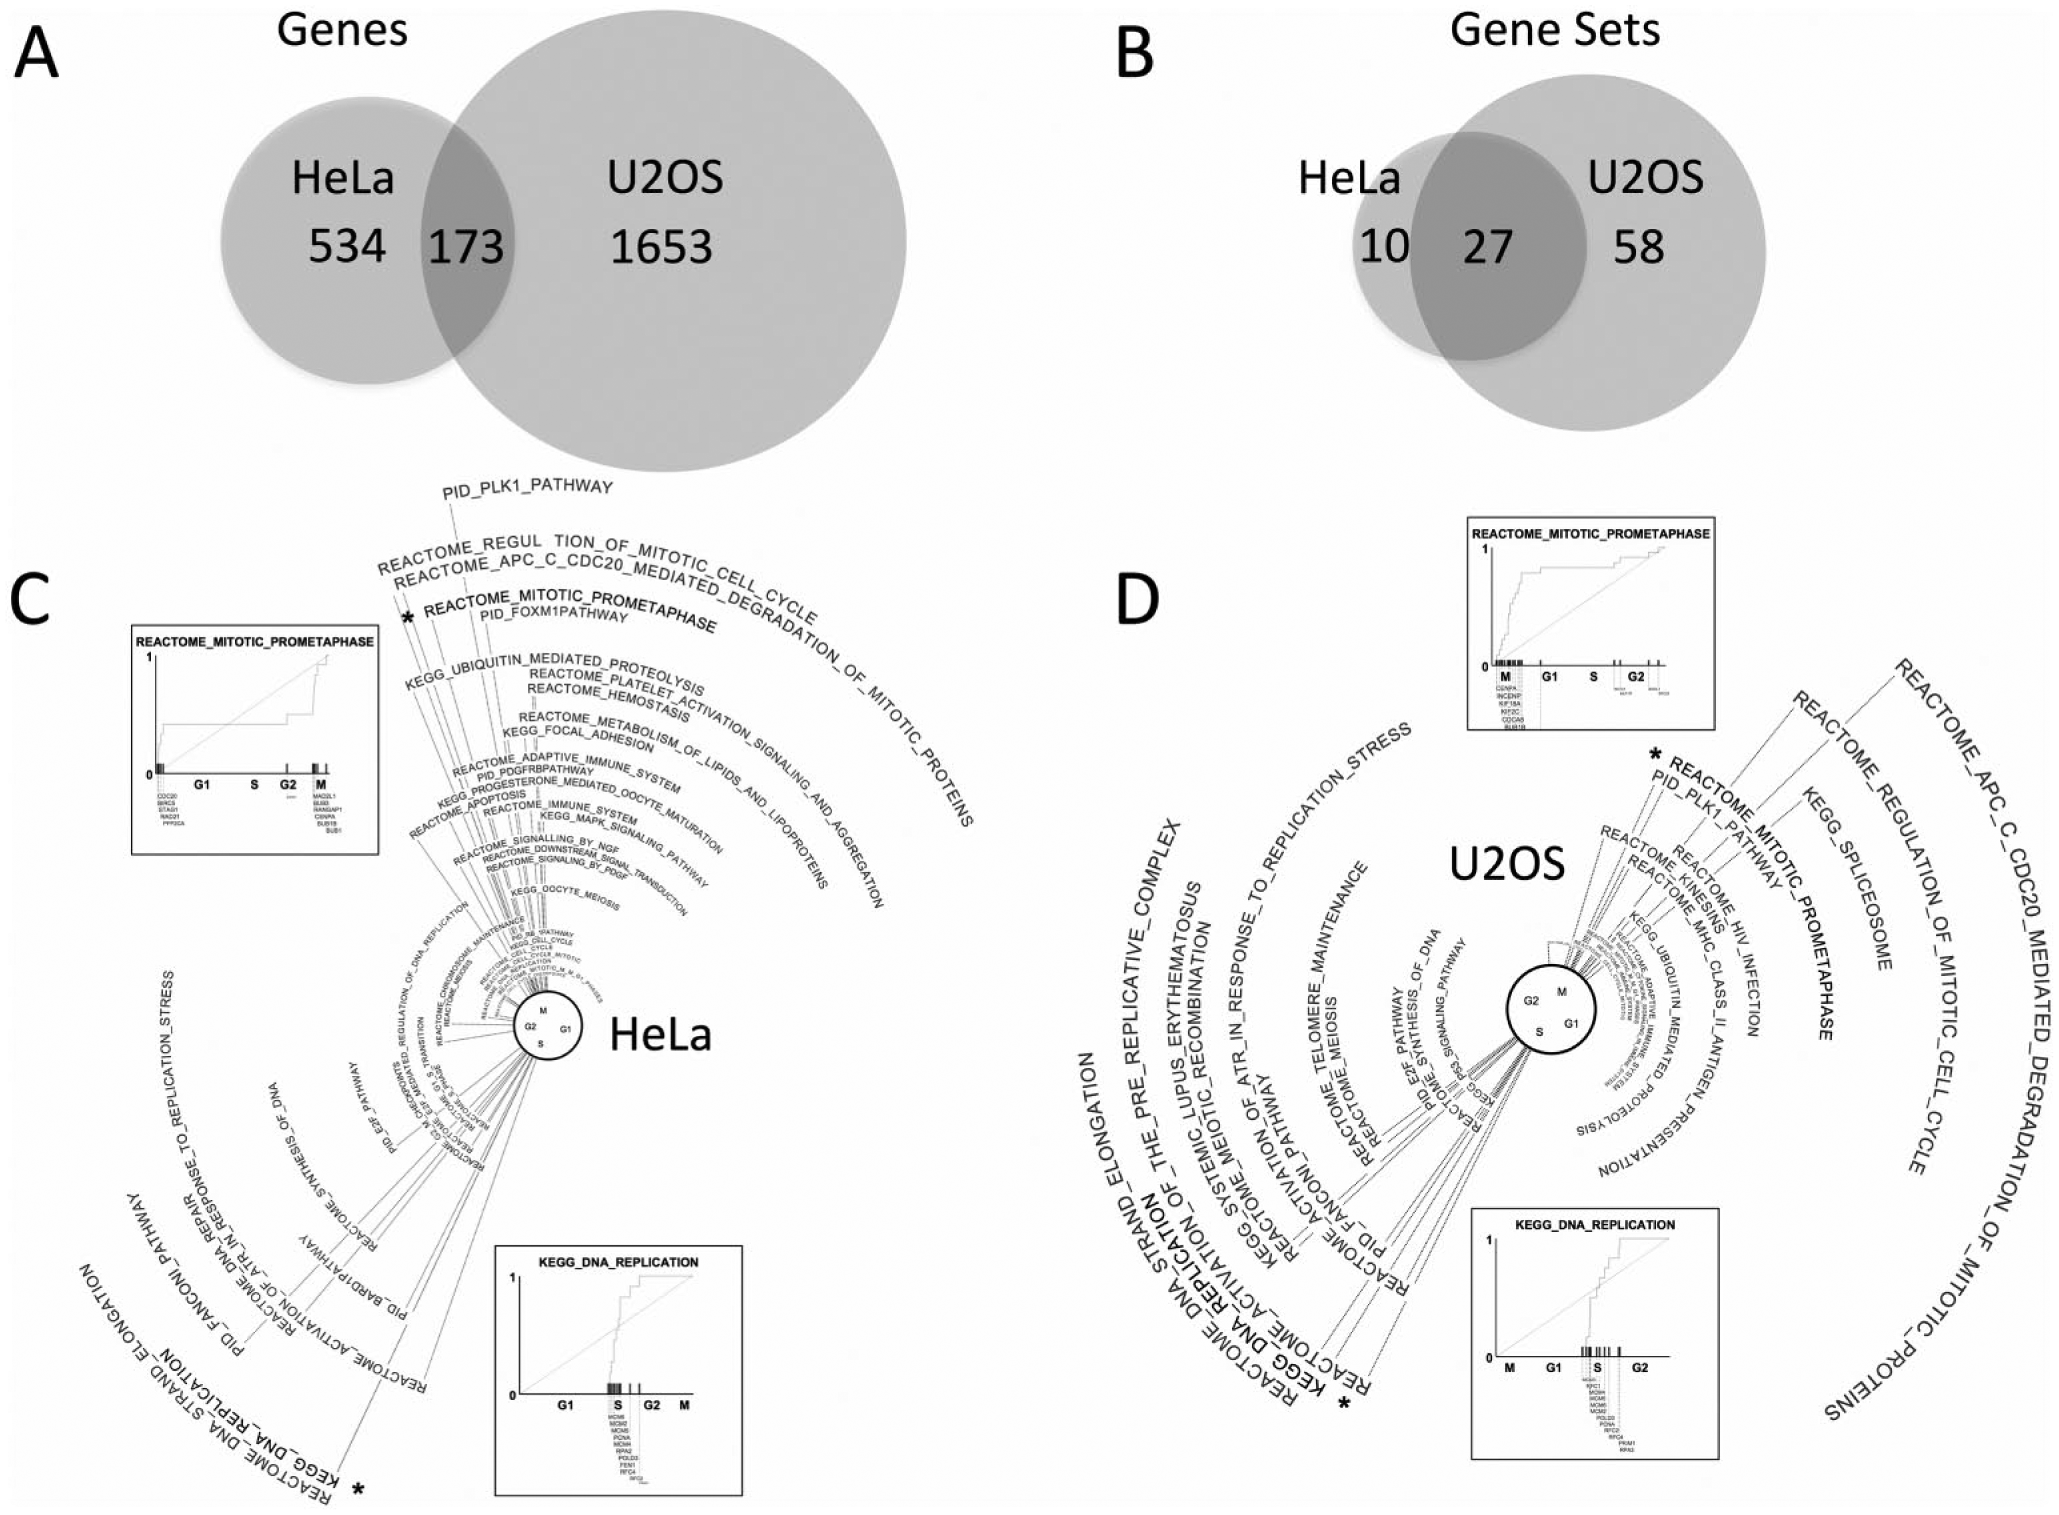
Overlap of cell-cycle periodic genes and pathways between HeLa and U2OS cells.
Both cell lines shared most of the phase-clustered sets we identified. Pathways identified uniquely in 1 cell line but not the other may be dysregulated in the latter cell line. Pathways uniquely identified in the HeLa line involved MAPK signaling, FAS signaling, and base excision repair. Of note, the MAPK signaling cascade is known to play a role in regulating the important FOXM1 transcription factor that correspondingly cycles in HeLA cells but not U2OS cells (De Olano et al., 2012). In contrast, pathways demonstrating temporal coordination in U2OS cells but not HeLa cells involved E2F, chromosome maintenance, telomere maintenance, spliceosome, kinesins, and p53 signaling. Indeed, the relative disruption of p53 signaling in HeLa cells has been experimentally established and has been ascribed to the HPV E6 protein (Thomas et al., 1999; Gao et al., 2009).
Discussion
We have presented an approach for detecting phase set enrichment, filling an important gap in the emerging fields of periodic biological systems. Moreover, our recent analysis of the mouse transcriptome shows that nearly half of the mammalian transcriptome is clock-regulated in at least 1 tissue—add this cohort to transcripts driven by the cell cycle and a majority of gene transcripts oscillate in mammals. We have only scratched the surface of how these transcriptional rhythms translate into rhythmic physiology and behavior. We believe this approach will become a key tool for researchers extracting this type of biological meaning from periodic data and will have increasing utility as a growing number of large-scale circadian, cell-cycle, and other biologically rhythmic datasets are generated. Our results with synthetic data demonstrate that PSEA outperforms its competitors in the setting of periodic expression data. Using real data from our own laboratory and others, we demonstrated the ability of PSEA to detect new patterns in biological data by analyzing either phases or phase shifts. Thus, PSEA represents a substantial advance for the field.
PSEA is based on Kuiper’s test, a well-established tool in circular statistics. While existing R packages offer this test (Lund et al., 2013; Lund and Agostinelli, 2012), the implementation in PSEA offers several important advantages. PSEA offers the ability to compare gene expression results to a nonuniform background distribution and offers the fast, dynamic computation of statistical significance—not a simple look-up table giving broad statistical ranges. To our knowledge, these features are not available in other implementations. Of equal importance, PSEA offers a simple user interface, the ability to natively interface with hundreds of well-annotated gene sets, graphical representations of results, and publication-quality summary figures. The MSigDB provides an authoritative collection of annotated gene sets immediately available for testing with PSEA. Of particular note, MSigDB gene sets are developed from the human genome, and the analysis of nonhuman transcriptome data requires that homologous human genes be identified. There may, of course, be important biological differences between humans and the experimental animals. However, it is our goal to view mice as a model to explore relevant human physiology. Accordingly, we restricted our analysis to mouse transcripts that have clear human homologues. Other databases, including GO and KEGG, also maintain distinct, annotated gene sets for mice and other model organisms.
Our analysis of the circadian gene expression atlas reveals that several important pathways show circadian orchestration across multiple tissues. At the gene-set level, timing across tissues appears relatively well conserved with the notable exceptions of the lung and aorta. This finding suggests that the optimal time for medication dosing may be different when these tissues are targeted. Moreover, PSEA uncovered several important pathways with bimodal temporal expression patterns missed by traditional tools.
Set-level analysis clarified the biological consequence of the restricted feeding paradigm of Vollmers et al. (2009). Without exception, temporally restricted feeding shifted the timing of gene sets in the liver. Yet in the liver, anabolic and catabolic pathways shifted by different amounts. This result suggests that in the liver, intraorgan metabolic synchronization may be influenced by the timing of food intake. The hypothesis that restricted feeding alters interorgan synchrony in metabolism has been presented before. However, to our knowledge, the identification of large scale intraorgan desynchrony is a novel observation that required set-level analysis of the data. This insight has direct medical implications. Shift work and human disorders involving shifts in feeding time, including night eating syndrome and nocturnal sleep-related eating disorder, have been directly linked to a number of adverse health outcomes including obesity (Schenck and Mahowald, 1994; Birketvedt et al., 1999).
The finding that transcriptional targets exclusively bound by CLOCK have clustered expression phases, while transcripts targeted exclusively by other core circadian transcription factors do not, is also intriguing. These data suggest that CLOCK may have the capacity to act as a functional circadian regulator independent of its partner BMAL1. Such activity could be easily explained either by the presence of an alternative partner (BMAL2 or other bHLH-PAS orphans) or by homodimeric CLOCK activity. While homodimeric CLOCK binding has been linked to palindromic E-box structure (Hogenesch et al., 1998), a preliminary informatics analysis suggests that the exclusive targets of CLOCK did not contain palindromic E-box sequences in their promoter regions. Similarly, these genes did not share any other obvious promoter elements when analyzed by 2 promoter analysis tools in the public domain: Homer (Heinz et al., 2010) and SCOPE (Carlson et al., 2007). Thus experimental validation and a more detailed informatics analysis will be required to confirm and explain these results. However, exclusive CLOCK binding adds a new potential mechanism controlling the timing of circadian output genes.
The application of PSEA to other biological rhythms was demonstrated with cell-cycle data. PSEA clarified the underlying rhythmic biology and highlighted the overlap in cell-cycle-regulated processes among the different cell lines. Moreover, differences observed at the set-level corresponded to known biology. The relative temporal dysregulation of several pathways in each cell type was consistent with known cell-line mutations.
To facilitate the use of the PSEA, we have developed a freely available Java package. The PSEA algorithm overcomes the shortcomings of existing gene-set enrichment tools (inappropriate for cyclic data) and offers improved sensitivity in comparison to existing overrepresentation tools. In sum, PSEA is an easily used tool that facilitates the interpretation of rhythmic biological data at the genome scale.
Footnotes
Acknowledgements
Jacki Growe, Lauren J. Francey, Gang Wu, Nicholas F. Lahens, Maja Bucan, Warren J. Ewens, Christian J. Stoeckert Jr., and Rafael A. Irizarry provided intellectual feedback on the project. The authors also thank Michel Hughes for stimulating discussion that motivated parts of this project. This work was supported by the Defense Advanced Research Projects Agency (DARPA-D12AP00025 to John Harer, Duke University) and the National Institute on Aging (2P01AG017628-11 to Allan I Pack). The effort of A.A.P. was supported as an employee of Merck & Co.
Authors’ Contributions
R.C.A. and A.A.P. conceived of the research. R.Z. and R.C.A. developed the gene-phase set enrichment algorithm. R.Z. developed software and performed data analysis. J.B.H provided computational resources. R.Z., A.A.P, J.B.H, and R.C.A. interpreted the data and wrote the paper.
Conflict of Interest Statement
The author(s) declared no potential conflicts of interest with respect to the research, authorship, and/or publication of this article.
Funding
The author(s) received no financial support for the research, authorship, and/or publication of this article.
Notes
References
Supplementary Material
Please find the following supplemental material available below.
For Open Access articles published under a Creative Commons License, all supplemental material carries the same license as the article it is associated with.
For non-Open Access articles published, all supplemental material carries a non-exclusive license, and permission requests for re-use of supplemental material or any part of supplemental material shall be sent directly to the copyright owner as specified in the copyright notice associated with the article.