
Abstract
Sleep loss affects human behavior in a nonuniform manner, depending on the cognitive domain and also the circadian phase. Besides, evidence exists about stable interindividual variations in sleep loss–related performance impairments. Despite this evidence, only a few studies have considered both circadian phase and neurobehavioral domain when investigating trait-like vulnerability to sleep manipulation. By applying a randomized, crossover design with 2 sleep pressure conditions (40 h sleep deprivation vs. 40 h multiple naps), we investigated the influence of a human adenosine deaminase (ADA) polymorphism (rs73598374) on several behavioral measures throughout nearly 2 circadian cycles. Confirming earlier studies, we observed that under sleep deprivation the previously reported vulnerable G/A-allele carriers felt overall sleepier than G/G-allele carriers. As expected, this difference was no longer present when sleep pressure was reduced by the application of multiple naps. Concomitantly, well-being was worse in the G/A genotype under sleep loss when compared to the nap protocol, and n-back working memory performance appeared to be specifically susceptible to sleep-wake manipulation in this genotype. When considering psychomotor vigilance performance, however, a higher sensitivity to sleep-wake manipulation was detected in homozygous participants, but specifically at the end of the night and only for optimal task performance. Although these data are based on a small sample size and hence require replication (12 G/A- and 12 G/G-allele carriers), they confirm the assumption that interindividual differences regarding the effect of sleep manipulation highly depend on the cognitive task and circadian phase, and thus emphasize the necessity of a multimethodological approach. Moreover, they indicate that napping might be suitable to counteract endogenously heightened sleep pressure depending on the neurobehavioral domain.
Keywords
Interindividual differences in sleep-wake regulation, particularly in neurobehavioral functioning in response to sleep loss, have been shown in several studies (Chee and Chuah, 2008; Maire et al., 2013) and may play an important role in how an individual performs at night or under condtions of extended wakefulness, such as during shiftwork. These trait-like differences can be traced back to variability among individuals in 2 interacting processes underlying sleep-wake regulation (Van Dongen et al., 2012). Circadian oscillations originating in cells of the suprachiasmatic nuclei modulate subjective sleepiness (Wyatt et al., 1999), well-being (Birchler-Pedross et al., 2009), and cognition (Schmidt et al., 2007) in a nearly 24-h fashion. An additional important factor impinging on these variables is the homeostatic sleep drive (Birchler-Pedross et al., 2009; Schmidt et al., 2007; Wyatt et al., 1999). It increases during wakefulness and dissipates during sleep, and may reflect at the molecular level the accumulation and subsequent degradation of so-called sleep factors, such as adenosine (Porkka-Heiskanen and Kalinchuk, 2011). Importantly, evidence for a mutual interaction between homeostatic and circadian aspects has been detected in multiple dimensions, ranging from molecular (Franken and Dijk, 2009) and electrophysiological levels (Cajochen and Dijk, 2003; Wyatt et al., 1999) to the modulation of cognitive functions (Dijk et al., 1992; Wyatt et al., 1999, 2006) and their underlying cerebral correlates (Schmidt et al., 2009; Vandewalle et al., 2009).
Increasing evidence indicates that there are substantial interindividual differences in performance declines secondary to total sleep deprivation, which have been associated with the polymorphic nature of genes implicated in circadian and sleep homeostatic mechanisms (Franken et al., 2001; King et al., 2009; Landolt, 2011). Among others, the human c.22G>A polymorphism (rs73598374) in the gene encoding adenosine deaminase (ADA) has been studied. This enzyme degrades the sleep factor adenosine (Porkka-Heiskanen and Kalinchuk, 2011) and differs in its activity depending on the genotype (Battistuzzi et al., 1981; Riksen et al., 2008). In humans, genetically reduced enzymatic activity of ADA has been linked to a longer duration of deep sleep and an enhanced electroencephalographic (EEG) activity in the slow-wave range, both indexes of elevated homeostatic sleep pressure levels (Bachmann et al., 2012; Mazzotti et al., 2012; Retey et al., 2005). Moreover, G/A-allele carriers, associated with less active ADA, indicated higher subjective sleepiness, thus appearing more susceptible to the detrimental effects of sleep loss, and showed impaired vigilance throughout sleep deprivation (SD; Bachmann et al., 2012).
Interindividual differences in neurobehavioral vulnerability to SD do not appear to be homogeneously reflected in all behavioral variables. Van Dongen and colleagues (2004) identified 3 distinct dimensions of sleep loss–related interindividual variability in neurobehavioral performance, clustering around self-evaluation of sleepiness, mood, and fatigue; cognitive processing; and behavioral alertness as measured by the psychomotor vigilance task (PVT). These findings point to distinct underlying neurocognitive subsystems, being differentially affected by extended wakefulness as also evidenced by neuroimaging studies (Chee and Chuah, 2008).
Even though the literature suggests that the behavioral impact of sleep-wake manipulation highly depends on circadian phase, individual constitution of sleep-wake-regulation, and the investigated cognitive task, only a few studies applied a multimethodological approach to simultaneously investigate these variables. Here, we studied 2 matched groups of healthy young individuals, solely differing with regard to their c.22G>A genotype of ADA, to compare the influence of 2 different levels of trait-like vulnerability to sleep pressure on subjective sleepiness, well-being, and on performance in 2 different cognitive tasks, challenging either mainly attentional vigilance (PVT) or working memory storage performance (n-back). A combined application of a 40-h SD and a 40-h multiple-nap protocol (Cajochen et al., 2001; Knoblauch et al., 2002; Sagaspe et al., 2012) served to systematically investigate not only conditions and times of day at which an endogenously heightened sleep pressure appears to be specifically detrimental but also if, when, and in which neurobehavioral tasks a counteraction by napping might be possible. According to previous literature reports, we expected higher subjective sleepiness levels as well as impaired vigilance performance under SD in the G/A genotype. Moreover, we hypothesized that, compared to SD, differences among genotypes will be reduced when participants are allowed to sleep during the nap protocol, at least during the biological night. As interindividual differences in sleep-wake-specific modulations of cognitive performance depend on the according cognitive domain (Van Dongen et al., 2004), we expected that, compared to vigilance and subjective sleepiness, higher order working memory performance, as measured by the n-back task, might be differentially affected by the experimental condition, time of day, and genotype. Finally, since sleep homeostatic mechanisms can majorly affect the circadian timing system, it might be expected that genotypes also differ in circadian regulation at both the physiological and behavioral levels.
Materials and Methods
The study was approved by the local ethics committee (Ethikkommission beider Basel) and performed according to the Declaration of Helsinki. All participants gave written informed consent before participation. For procedures of recruitment and genotyping see the supplemental online material.
Study Protocol
A total of 12 heterozygous and 12 homozygous volunteers agreed to participate and completed the laboratory part of the study. All participants indicated good subjective sleep quality (Pittsburgh Sleep Quality Index [PSQI] ≤ 5; Buysse et al., 1989), a habitual sleep duration of 8 ± 1 h, and no symptoms of clinical depression (Beck Depression Inventory [BDI-II] < 9; Beck et al., 1996). The genotype groups were matched for the sex distribution within the groups, and did not differ according to age, BMI, sleep quality, and chronotype, variables possibly confounding sleep-wake regulation (see Table 1). As well, groups were balanced according to the PERIOD3 polymorphism, shown to affect behavioral vulnerability in response to sleep loss (Viola et al., 2007). To allow habituation to laboratory conditions and to screen for major sleep disturbances, volunteers slept in the laboratory for 1 night before study participation. They underwent a medical check and a drug screen (Drug-Screen-Multi 6, nal von minden, Regensburg, Germany) to guarantee basic physical and mental health. One week before starting the laboratory part, participants kept a fixed sleep-wake cycle for 7 days (8 h sleep at night and no daytime naps) to ensure sufficient sleep and stable circadian entrainment before starting the laboratory part. Sleep-wake times were derived from a 3-week actimetry field study and individually adapted to the participants’ professional duties. Compliance to the regimen was verified by means of actigraphic recordings. Participants were instructed to abstain from alcohol and caffeine during this week to prevent withdrawal effects, especially in the adenosinergic system. All women were tested for pregnancy before the laboratory study started and were required to participate during their luteal phase (3 of 16 participating women) unless they were taking hormonal contraceptives.
Demographic data, questionnaire scores, and actimetrical data (means and standard deviations) split by genotype.
F = female; m = male; y = years; BMI = Body Mass Index; PSQI = Pittsburgh Sleep Quality Index; ESS = Epworth Sleepiness Scale (Johns, 1981); MEQ = Morningness-Eveningness Questionnaire (Horne and Östberg, 1976); MCTQ = Munich Chronotype Questionnaire (Roenneberg et al., 2003); MSF sc = mid-sleep-free days, sleep corrected; MSF sac = mid-sleep-free days, sleep and age corrected. Habitual caffeine consumption was assessed by sleep diaries during 3 weeks; wake time, sleep time, and sleep duration were derived by actimetrical data collected during 3 weeks. p-values were derived from χ2-(gender ratio) and t-tests (all other variables).
The laboratory part comprised 2 conditions of 40 h each, separated by at least 1 week and implemented as a within-subject, randomized, crossover design. While the high sleep pressure condition consisted of 40 h of total SD, the low sleep pressure condition encompassed 10 short sleep-wake cycles each of 80 min of a sleep opportunity (i.e., a nap) alternating with 160 min of wakefulness (Fig. 1). The first cycle started 120 min after wake up. Duration of wakefulness in the last cycle was restricted to 40 min in order to ensure a start of the recovery night at habitual sleep time. This procedure has already been used repeatedly to measure the effect of low (nap protocol) versus high (SD protocol) homeostatic sleep pressure levels at many circadian phases (e.g., Birchler-Pedross et al., 2009; Cajochen et al., 2001; Knoblauch et al., 2002; Sagaspe et al., 2012). Both conditions were controlled with regard to light influence (illuminance < 8 lux during wakefulness and 0 lux during sleep), caloric intake (standardized meals every 4 h), and body posture (semirecumbent position during scheduled wakefulness and recumbent during naps) to minimize potential masking effects on the sleep-wake regulatory system. Participants were not allowed to stand up except for regularly scheduled bathroom visits and did not have any indications of time of day. Social interaction was restricted to communications with study helpers. Note that EEG was monitored over the course of both protocols and functional magnetic resonance imaging (fMRI) data were collected at 5 specific time points in both conditions. These data will be published elsewhere.
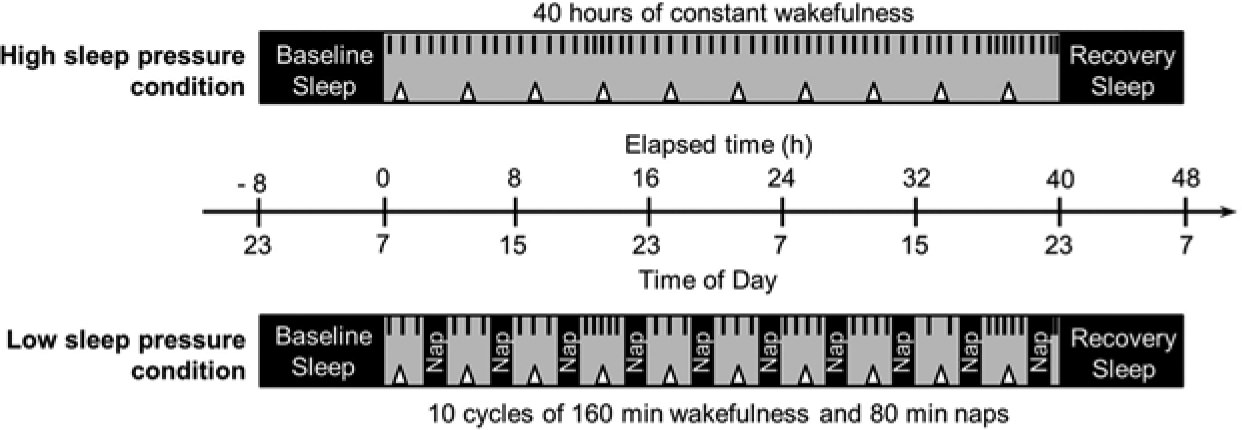
Schematic illustration of laboratory study. The high sleep pressure condition consisted of 40 h of constant wakefulness (gray), whereas the low sleep pressure condition comprised 10 short sleep-wake cycles, each encompassing 160 min of wakefulness (gray) alternating with 80 min of naps (black) to keep the homeostatic sleep pressure at low levels. Both conditions were preceded and followed by 8 h of sleep (black). Subjective sleepiness, well-being, and salivary melatonin (black short lines), as well as psychomotor vigilance task and n-back performance (triangles), were assessed during scheduled wakefulness.
Melatonin
Salivary melatonin was collected throughout the entire 40 hours, with an average sampling rate of 53 min starting 20 min after wake up. Sampling rates dynamically changed with circadian phase, such that during daytime, when no melatonin secretion was expected, sampling rates were lower (~60 min) as compared to the evening hours and nighttime (~45 min), when we aimed at tracking changes in melatonin secretion. A sampling rate of 30 min on average, as reported in other studies (i.e., Cajochen et al., 2001), was not implemented due to test bouts and naps longer than 30 min. Melatonin levels were analyzed by a direct double-antibody radioimmunoassay (validated by gas chromatography–mass spectroscopy with an analytical least detectable dose of 0.65 pm/ml; Bühlmann Laboratory, Schönenbuch, Switzerland). For estimation of amplitude, dim-light melatonin onset (DLMO), dim-light melatonin offset (DLMoff), and phase angle, a bimodal skewed baseline cosine function was fitted to raw values as described in Kolodyazhniy et al. (2012). Amplitude was defined as the maximum difference of the fitted waveform to its baseline. DLMO and DLMoff were defined as the times when the melatonin level crossed 50% of the maximum at the rising and falling limbs of the curve, respectively (Benloucif et al., 2008). The phase angle was calculated as the difference between the wake-up time and DLMO. The DLMO served as a marker of circadian phase position (Lewy and Sack, 1989), and the phase angle of entrainment indicated the relationship between the timing of the circadian clock and an environmental time cue (Duffy and Wright, 2005).
Self-Evaluation of Sleepiness and Well-Being
Subjective sleepiness was assessed at regular intervals (mean length of sampling interval: 65 min) by the Karolinska Sleepiness Scale (KSS; Akerstedt and Gillberg, 1990), the Karolinska Sleepiness Symptom Checklist (KSScl; Birchler-Pedross et al., 2009; Bromundt et al., 2013), and a visual analogue scale (VAS) ranging from 0 (extremely awake) to 100 (extremely tired). Assessments were more frequent when dynamic changes in sleepiness were expected and occurred less often during daytime. Values collected in the SD condition were excluded from analysis if no corresponding value in the nap condition was available (i.e., at times when napping was scheduled). The protocol encompassed an assessment of subjective sleepiness immediately after awakening from each nap. Here, we report values of a composite score ((KSS + KSSCL + (VAS / 10)) / 3) (Bromundt et al., 2013) collapsed into 4-h bins following the duration of 1 short sleep-wake cycle (160 min of wakefulness and an 80-min nap) in the nap protocol.
Together with subjective sleepiness, subjective well-being was measured by means of 3 VASs, each with a range from 0 to 100, assessing tension (ranging from extremely relaxed to extremely tense), physical comfort (ranging from extremely comfortable to extremely uncomfortable), and mood (ranging from in very bad mood to in very good mood). A mean of these scales (as calculated by (VAStension + VASphysical comfort + (100 − VASmood)) / 3) served as an indicator of well-being (Birchler-Pedross et al., 2009) and was pooled for analysis to 4-h bins.
Neurobehavioral Performance
After 1 hour of wakefulness, neurobehavioral performance was assessed by a modified version of the PVT (Dinges and Powell, 1985) and the n-back working memory paradigm. Both tests were repeatedly administered every 4 h, every other time in an MRI scanner.
During the 10-min PVT, participants were instructed to press a response button as fast as possible as soon as a millisecond counter appeared on the computer screen, which was displayed at random intervals with an interstimulus interval of 2 to 10 seconds. Feedback was provided by displaying the reaction time (RT) for 1 sec following the response. The dependent variables were median RTs, the fastest 10% and slowest 10% of RTs, as well as the number of lapses (RT > 500 msec, transformed by √x + √x + 1 according to Kuna et al. [2012] to stabilize variances), which were z-transformed due to different testing environments (every other session in the MRI scanner with a different response keypad).
The n-back consisted of the visual presentation of a series of consonants. Participants were asked to decide and indicate by differential button presses, whether the consonant depicted is the same as n trials before (target) or whether this is not the case. The task lasted for approximately 20 min and comprised a 3-back and a 0-back version. Five different variants of the task were presented throughout the protocol in a pseudo-randomized order. Each variant consisted of 9 blocks of a 3-back version and 5 blocks of the 0-back version, presented in a randomized order, each comprising 30 stimuli thereof 10 targets. Each stimulus was presented for 1.5 seconds with an interstimulus interval of 0.5 seconds.
A training session in the evening before the study ensured that participants were able to reach 70% of correct responses in the 3-back to prevent effects due to baseline differences in comprehension and transfer of instructions. One participant, however, performed 3 interquartile ranges lower than the 25th percentile during the entire course of the first condition such that performance values of this person were excluded from analyses as outliers. Hit targets (true positive) and missed targets (false negative) were analyzed as output measures in both the 3-back and the 0-back. Values reported represent z-standardized differences between 3-back and 0-back to account for baseline differences in basic attentional resources and to target working memory storage capacities.
Statistical Analysis
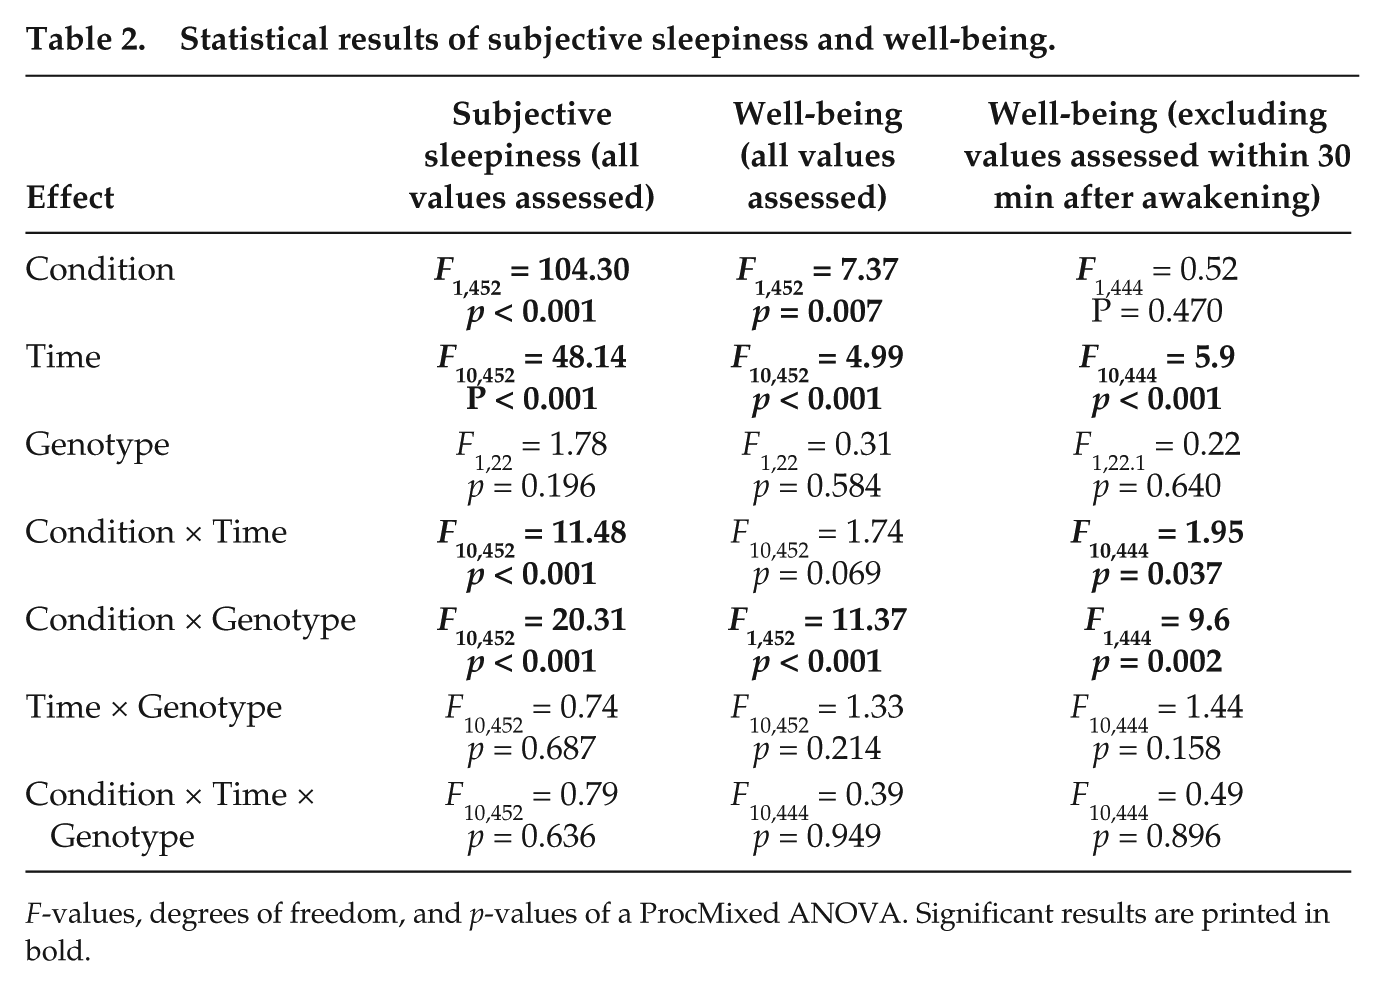
If not stated otherwise, statistical analyses were performed with SAS 9.3 software (SAS Institute, Cary, USA), using a mixed-model analysis of variance for repeated measures, with the factors Genotype (G/A and G/G genotype), Condition (SD and nap), and Time (11 bins in case of subjective scales and 9 bins when analyzing performance). Contrasts were calculated with the LSMEANS statement. Degrees of freedom of all p-values are based on an approximation described by Kenward and Roger (1997). The p-values of multiple post hoc comparisons were adjusted according to the false discovery rate procedure (Curran-Everett, 2000).
Results
Salivary Melatonin
Irrespective of the sleep pressure condition, phase angle differed significantly between G/A- and G/G-allele carriers (F1,22 = 4.34; p = 0.049) with a 53 ± 13 min (mean ± standard error [SE]) wider phase angle in participants with the G/A genotype compared to homozygous participants. Concomitantly, DLMO appeared by trend to occur 48 min later in G/A- compared to G/G-allele carriers (at 10:42 p.m. ± 2 min; F1,22 = 4.14; p = 0.054) (Fig. 2A). Moreover, the experimental conditions affected the timing of the melatonin increase, such that, overall, phase angle was 24 ± 14 min (SE) narrower in the nap compared to the SD condition (F1,22 = 6.79; p = 0.016). Likewise, the DLMO was detected 24 min earlier (at 10:06 p.m. ± 12 min [SE]) in the nap protocol compared to total SD (F1,22 = 6.85; p = 0.016). Based on these results, all other parameters were adjusted to each participant’s DLMO to compare data acquired at similar circadian phases.
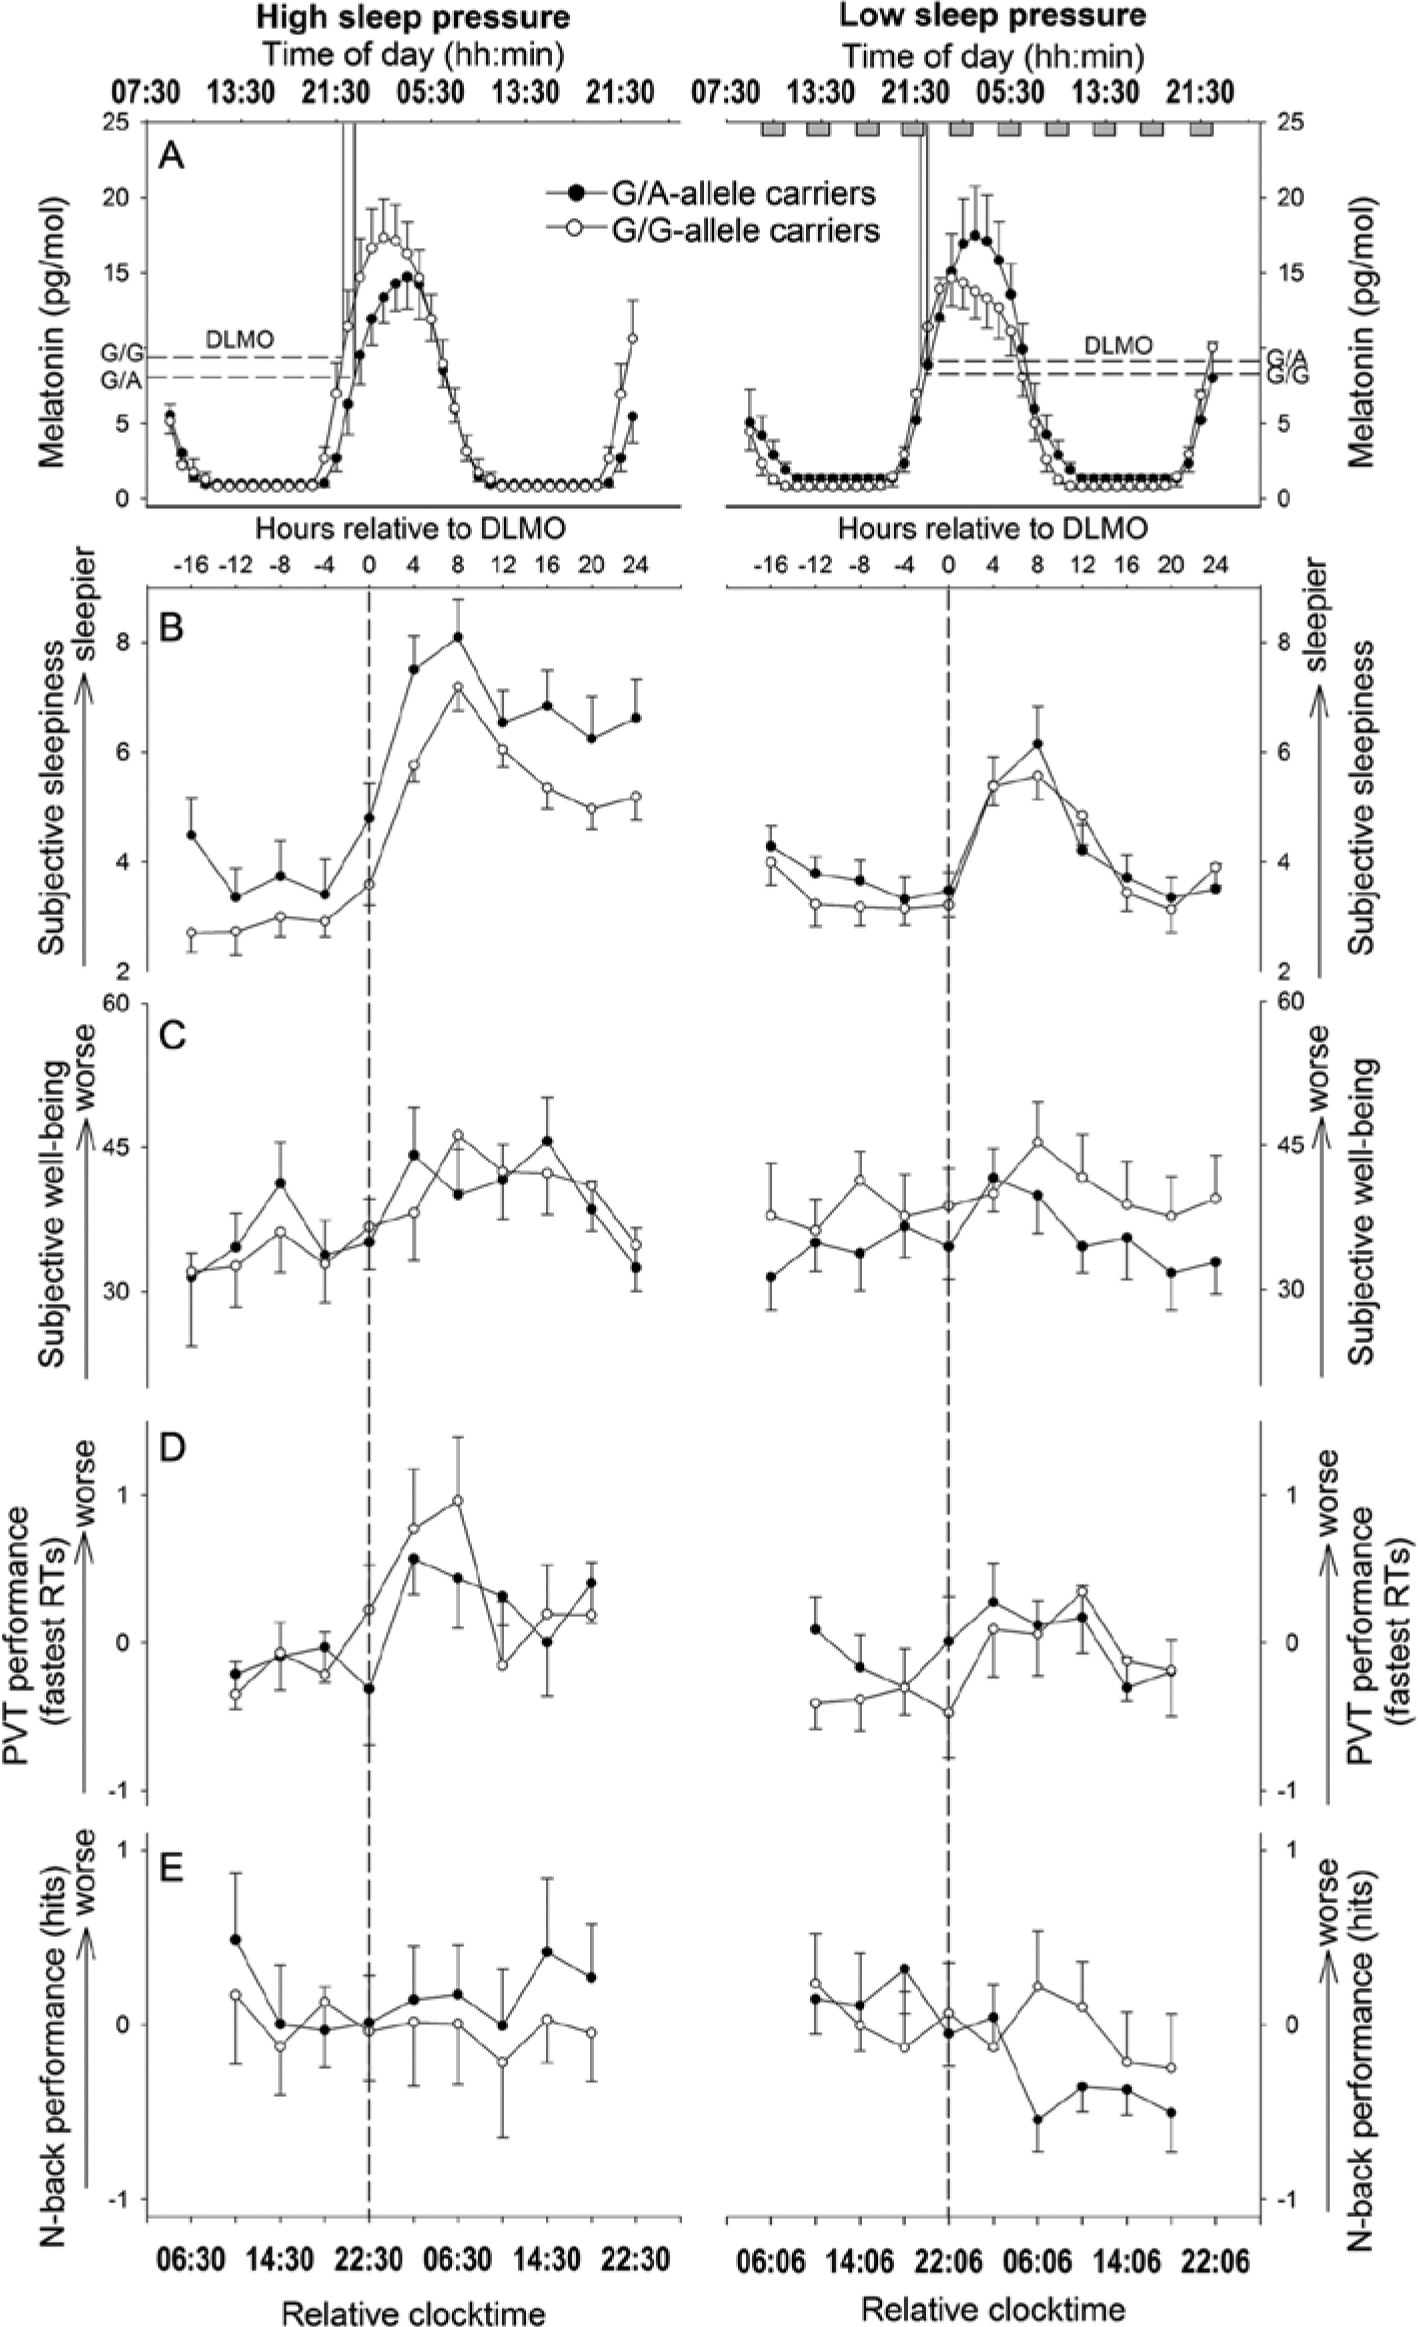
Time courses of dependent variables (means and standard errors) during high (left panel) and low (right panel) sleep pressure conditions in G/A- (filled dots) and G/G-allele carriers (open dots). (A) Time course of melatonin: dashed lines indicate the dim-light melatonin onset (DLMO) per genotype as calculated by 50% of the maximum. Gray rectangles during the low sleep pressure condition represent 10 nap sleep episodes each of 80 min. (B) and (C) Time courses of subjective sleepiness and subjective well-being (assessed earliest 30 min after waking up from scheduled sleep), respectively, both plotted relative to the DLMO. (D) and (E) Neurobehavioral performance profiles (z-values) of peak performance in vigilant attention (10% fastest RTs in PVT; [D]) and working memory (hit targets, and the difference between 3-back and 0-back; [E]) plotted relative to DLMO.
The amplitude of melatonin as well as DLMoff did not differ significantly among genotypes or conditions nor did the analysis point to a significant interaction between genotype and condition (pall > 0.1).
Self-Evaluation of Sleepiness and Well-Being
As expected, participants felt sleepier during SD compared to the nap protocol (mean ± SE: SD: 5.08 ± 0.15; nap: 3.99 ± 0.10) (Table 2). Furthermore, sleepiness displayed a circadian pattern modulated by the sleep pressure condition (Table 2): Subjective sleepiness increased during the biological night with a higher peak during SD compared to the nap protocol. Moreover, the subsequent decrease in the morning hours during the second day was weakened when participants were sleep deprived compared to when they were asked to nap regularly (Fig. 2B). As depicted in Figure 3A, the influence of genotype on the overall time course in subjective sleepiness depended on the sleep pressure condition (Table 2), such that G/A-allele carriers indicated higher sleepiness during SD compared to G/G-allele carriers (p = 0.033), whereas the genotypes did not significantly differ during the nap protocol (p = 0.736).
Statistical results of subjective sleepiness and well-being.
F-values, degrees of freedom, and p-values of a ProcMixed ANOVA. Significant results are printed in bold.
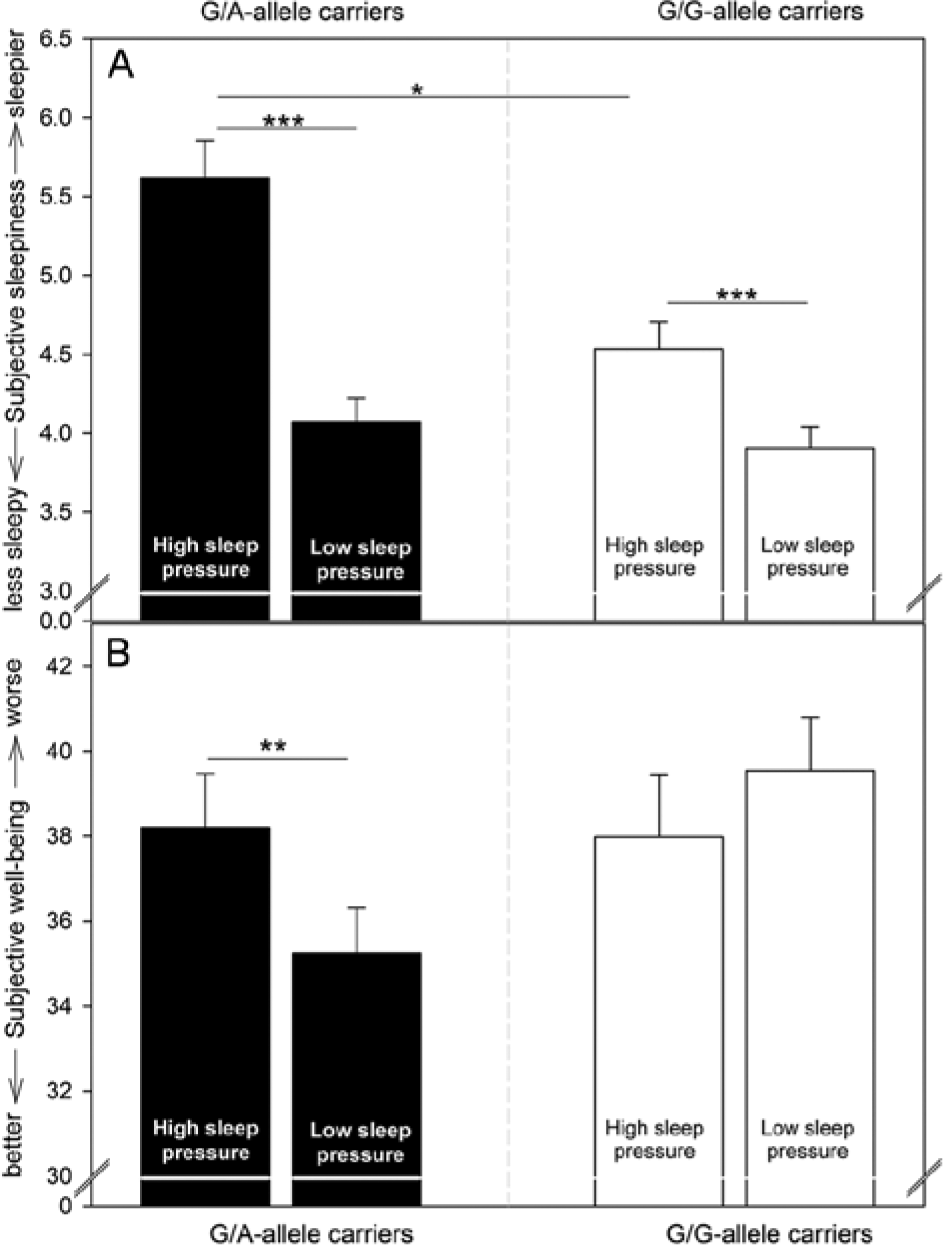
Means and standard errors of subjective sleepiness and subjective well-being per genotype and condition. (A) Under high sleep pressure conditions, G/A-allele carriers indicated significantly higher sleepiness compared to G/G-allele carriers. All participants felt sleepier during high compared to low sleep pressure (nap protocol). (B) Subjective well-being was significantly worse in participants with the G/A genotype during the high compared to the low sleep pressure condition, while G/G-allele carriers’ well-being did not differ significantly between conditions. Note that the values plotted were assessed earliest 30 min after waking up after scheduled naps during the low sleep pressure condition and at corresponding times during sleep deprivation. *p < 0.05; **p < 0.01; ***p < 0.001.
In general, subjective well-being was better during high compared to low sleep pressure conditions (mean ± SE: SD: 36.97 ± 0.86; nap: 38.75 ± 0.80) (Table 2) and modulated by circadian phase (Table 2). Participants showed an overall decrease in well-being during nighttime in both protocols, which remained at low levels until the evening hours of the second day. Genotype-dependent effects appeared in interaction with the sleep pressure manipulation (Table 2), such that G/G-allele carriers felt worse in the nap condition compared to SD (p < 0.001; mean ± SE: nap: 41.16 ± 1.22, SD: 37.06 ± 1.33), while G/A-allele carriers’ well-being did not differ between conditions (p = 0.640; mean ± SE: nap: 36.38 ± 1.00, SD: 36.89 ± 1.10).
The result of reduced well-being during the nap condition compared to SD, which was specifically pronounced in G/G-allele carriers, is contrary to what has been reported previously (Birchler-Pedross et al., 2009). To explore a potential reason, we calculated a separate model only containing data collected earliest 30 min after each wake up, to exclude values possibly influenced by sleep inertia (Tassi and Muzet, 2000), that is, a “short period of confusion and degraded mood/performance immediately after awakening from sleep” (Naitoh et al., 1993, p. 110). Again, an overall circadian pattern with a trough during the biological night was observed that was particularly visible under SD (Table 2 and Fig. 2C). Moreover, we observed that specifically the well-being of G/A-allele carriers was significantly affected by the sleep pressure condition (Table 2). G/A-allele carriers indicated worsened well-being during SD compared to the nap condition (p = 0.007), while well-being did not significantly differ between conditions in the group of G/G-allele carriers (p = 0.097; Fig. 3B).
Neurobehavioral Performance: Vigilant Attention
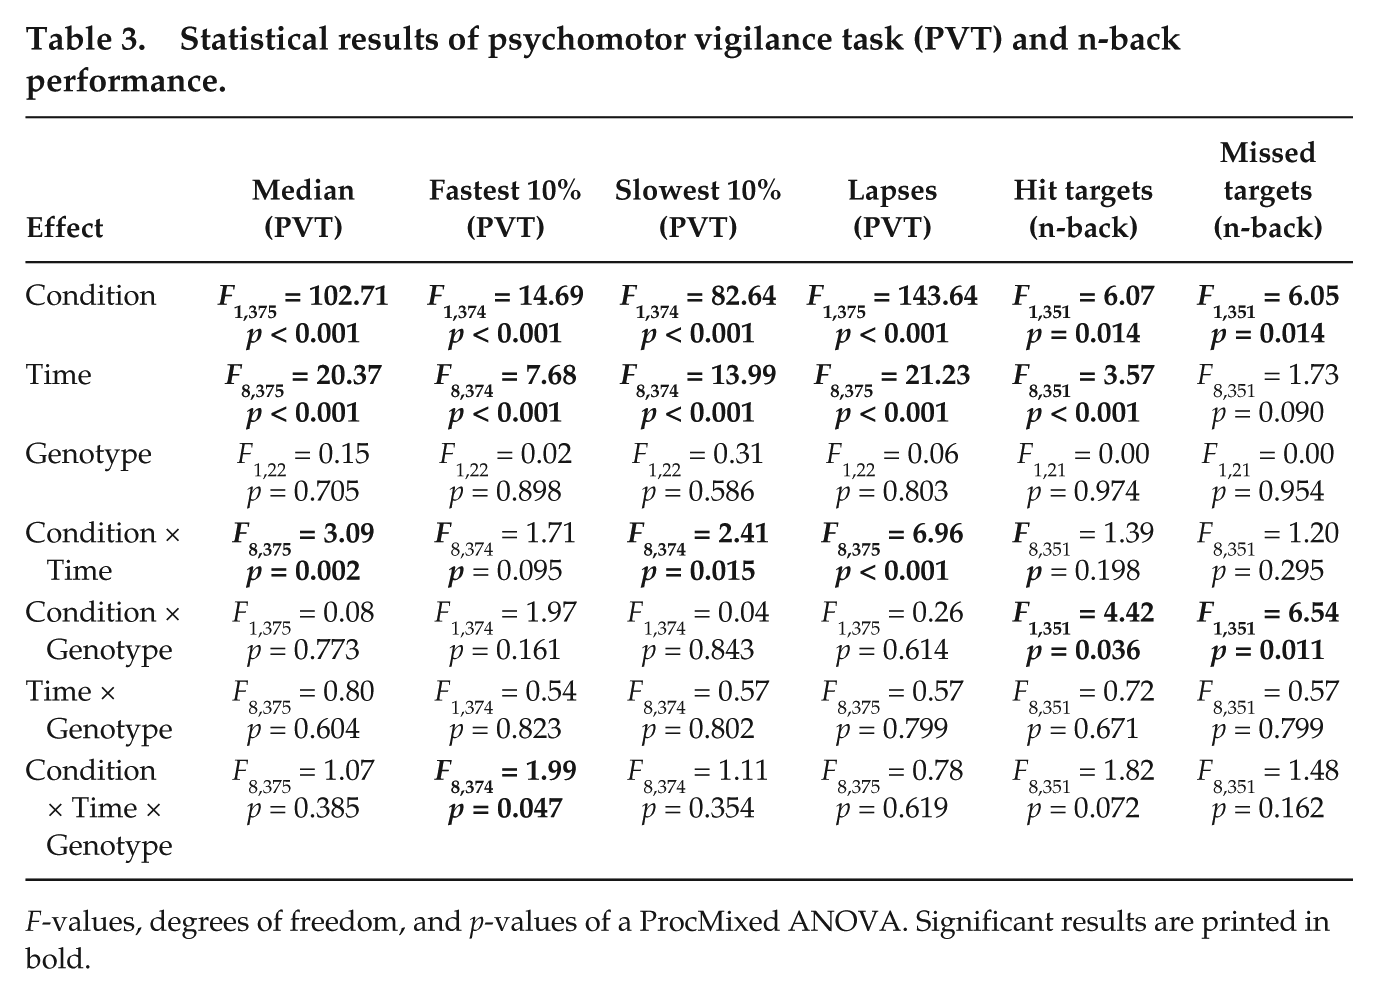
Performance in the PVT, as assessed by median RTs, the 10% slowest RTs, the 10% fastest RTs, and lapses, was overall attenuated by SD (see Suppl. Table S1 for mean ± SE, Table 3 for statistics, and Fig. 4A for the fastest RTs) and revealed a circadian pattern with performance decrements during nighttime (see Table 3 for statistics; for the main effect of time in the fastest 10% RTs, see Suppl. Fig. S2; split by genotype and condition shown in Fig. 2D). These performance deteriorations did not fully recover during the second day, particularly during SD (interaction of Time × Condition; Table 3). The impact of genotype became apparent specifically in the fastest RTs and was modulated by sleep pressure as well as circadian phase (Table 3): Specifically, at the end of the biological night, G/G-allele carriers performed better during the nap protocol compared to SD (p < 0.001), whereas optimal performance of participants with the G/A genotype did not differ significantly at any time between sleep pressure conditions.
Statistical results of psychomotor vigilance task (PVT) and n-back performance.
F-values, degrees of freedom, and p-values of a ProcMixed ANOVA. Significant results are printed in bold.
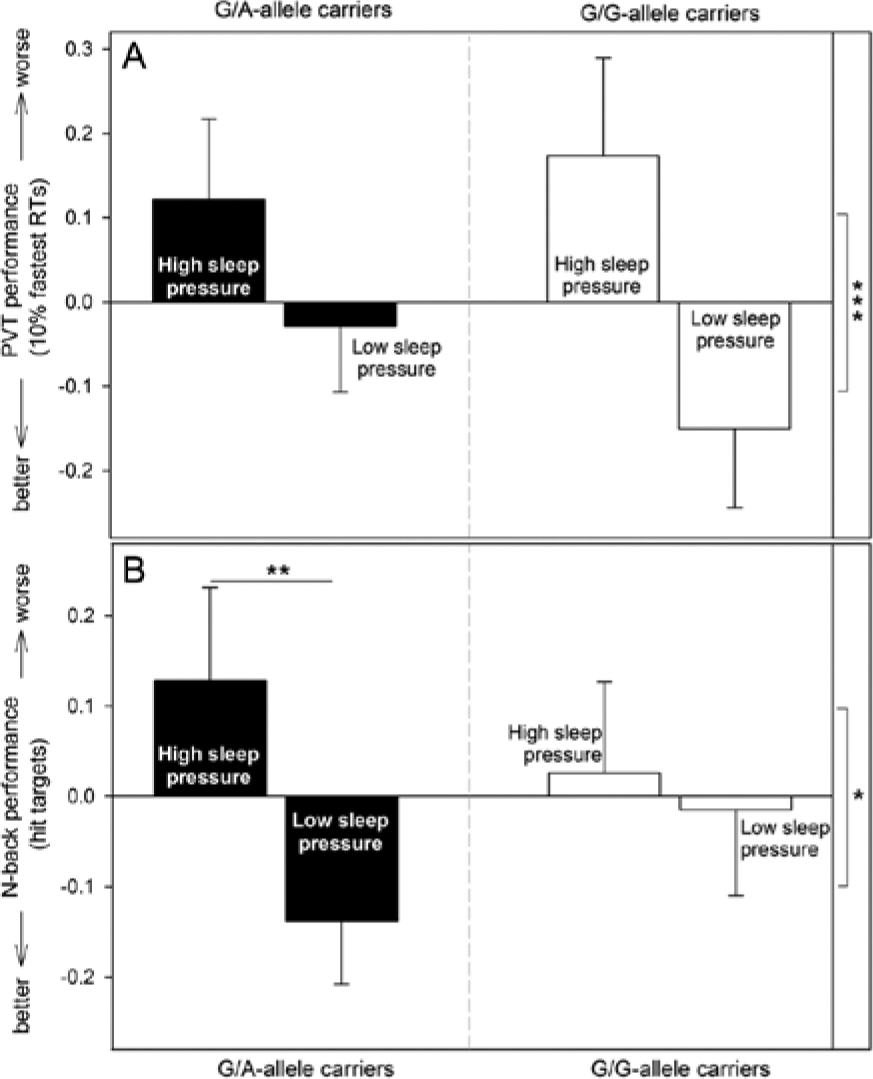
Neurobehavioral performance (means and standard errors of z-standardized values) per genotype and condition. (A) Peak performance in vigilant attention, as indicated by the 10% fastest reaction times in the psychomotor vigilance task, differed significantly between conditions. This difference was not, however, modulated by genotype independent of circadian phase. (B) Overall, working memory performance (hit targets, difference between 3-back and 0-back) was worse during high compared to low sleep pressure and was modulated by genotype: G/A-allele carriers performed significantly worse during high compared to low sleep pressure conditions, while performance of G/G-allele carriers did not differ according to condition. *p < 0.05; **p < 0.01; ***p < 0.001.
Neurobehavioral Performance: Working Memory Capacity
During SD, accuracy was lower as compared to the nap protocol (fewer hit targets and more missed targets; see Suppl. Table S3 for mean ± SE; and see Table 3 for statistics). Furthermore, performance was worse (fewer hit targets) at the beginning of both protocols, specifically during the first test compared to results achieved toward the end (Table 3 and Fig. 2E). The genotype-dependent influence was modulated by the experimental condition (Table 3): During the nap protocol, G/A-allele carriers performed better compared to SD (more hit targets: p = 0.002, Fig. 4B; fewer missed targets: p < 0.001, mean ± SE: nap: –0.13 ± 0.07, SD: 0.16 ± 0.11), while G/G-allele carriers’ performance did not vary significantly according to the sleep pressure condition (hit targets: p = 0.795, Fig. 4B; missed targets: p = 0.623, mean ± SE: nap: –0.02 ± 0.11, SD: –0.01 ± 0.11).
Discussion
In this study we investigated the time course of vulnerability to variations in sleep pressure based on genetic differences, associated with changes in ADA activity. In G/A-allele carriers, exhibiting reduced ADA activity (Battistuzzi et al., 1981; Riksen et al., 2008), changes in sleep pressure levels became apparent in subjective sleepiness and well-being as well as in working memory performance. Optimal vigilance performance at the end of the night, however, appeared to be a sensitive indicator for variations in sleep pressure in G/G-allele carriers. Our data suggest that the implication of ADA on neurobehavioral susceptibility to modulations of sleep-wake history depends on the investigated cognitive task and on circadian phase. They highlight the importance of a multimethodological approach applied during the entire circadian cycle when aiming at characterizing trait-like interindividual differences in vulnerability to sleep manipulation.
It has been suggested that higher adenosine levels due to reduced ADA activity in heterozygous individuals contribute to higher sleep pressure levels in this genotype (Bachmann et al., 2012; Landolt, 2008; Retey et al., 2005). At the level of subjective sleepiness, we could confirm a higher impact of homeostatic sleep pressure under sleep loss in G/A-allele carriers (Bachmann et al., 2012). Importantly, differences between genotypes were no longer present when experimentally reducing sleep pressure, further indicating an implication of the ADA polymorphism in sleep regulation. Subjective well-being values, corrected for possible influences of the awakening process, also mirrored potentially higher sleep pressure levels in the G/A genotype through impaired well-being during SD (Birchler-Pedross et al., 2009). This result indicates that specifically G/A-allele carriers benefit in well-being from the reduction of sleep pressure by multiple naps. Importantly, condition-driven but also genotype-dependent differences in subjective well-being strongly depended on the temporal distance between the assessment of well-being and the last awakening from a scheduled sleep episode: If one includes values measured shortly after waking up, well-being appeared to be dampened during low compared to high sleep pressure, specifically in participants with the G/G genotype. Overall, such an effect might have been induced by a genotype-specific reaction to the repetitive disruption of sleep and wakefulness during the circadian cycle. This is inherent to the nap protocol and has the potential to affect well-being, especially if investigated immediately after awakening. It remains to be elucidated whether the negative impact of a close awakening on well-being could be traced back to potential genotype-specific changes in sleep inertia (assessed usually through cognitive performance), sleep characteristics prior to awakening (Tassi and Muzet, 2000), or other factors systematically appearing closely to waking up, such as stress due to the awakening process.
As suggested, self-evaluation of sleepiness and mood showed similar sleep loss–related trait-like patterns. By adopting a factor analytic approach, Van Dongen and colleagues (2004) revealed that these subjective measures do not inevitably resemble systematic interindividual differences in cognitive processing capabilities or vigilance during SD. For vigilant attention, we observed that homozygous participants showed increased performance in the fast RT domain at the end of the biological night under low compared to high sleep pressure conditions. Fastest RTs reflect peak performance in sustained attention, which is phasically delivered above and beyond baseline levels based on the ability to enhance the recruitment of attentional resources (Drummond et al., 2005). The negative impact of acute SD on vigilance is usually most likely observed in slowest RTs and lapses, reflecting momentary task disengagement and attentional failures (Lim and Dinges, 2008). These measures showed the well-known circadian and homeostatic pattern in our study, but they were not affected by genotype under high sleep pressure as has been previously reported, albeit with ambiguous results (lapses: Bachmann et al., 2012; Kuna et al., 2012). Intriguingly, fast RTs have been recently reported to be more likely influenced by chronic SD (Basner and Dinges, 2011), which amplifies the detrimental effects of acute sleep loss on attentional performance (Cohen et al., 2010). This kind of interaction between short- and long-term homeostatic processes might influence attentional networks underlying peak performance in a genotype-specific manner.
It has to be emphasized that G/G genotype–dependent attentional performance modulation specifically occurred at the end of the biological night when comparing high with low sleep pressure conditions. The markedness of the typical circadian performance trough at this time of the day has been shown to be dependent on time spent awake (Dijk et al., 1992; Wyatt et al., 1999). In this perspective, our result points toward a differential interaction of circadian and homeostatic influences according to the ADA polymorphism. The polymorphism was also associated with differences in circadian phase angle, suggesting that the circadian timing system is differentially modulated in G/A- compared to G/G-allele carriers. With regard to the similar sleep-wake times of the 2 genotype groups, these differences might mirror a shift in circadian phase position reliably estimated from salivary melatonin samples (Benloucif et al., 2008). Circadian phase is influenced by several zeitgebers, such as light (Zeitzer et al., 2000), food (Feillet, 2010), motor activity (Escames et al., 2012), or sleep per se (Danilenko et al., 2003; Wyatt et al., 1999). Importantly, all these influences were kept constant between genotype groups. Therefore they cannot account for the later phase position of G/A-allele carriers, which is reminiscent of the phase delay induced by moderately heightened sleep pressure during partial SD (Lo et al., 2012). With regard to the G/A genotype, it is thus tempting to speculate that circadian factors adapt to a habitually higher level of sleep pressure to ensure consolidated periods of wakefulness of the same quality and length as in G/G-allele carriers. Importantly, we adjusted for genotype-dependent differences in circadian regulation in all neurobehavioral measures so that they do not confound the results in these variables.
The n-back task was originally designed to study working memory performance, even though its construct validity as pure working memory measure has been criticized (Kane et al., 2007; Jaeggi et al., 2010). Successful completion of the task also requires other cognitive abilities, such as sustained attention. The cognitive domains challenged during the 2 tasks investigated in the present study thus are not mutually exclusive, even though they tap mainly into different cognitive domains. The analyzed data indicate genotype-dependent differences between the 2 tasks regarding the susceptibility to sleep pressure variations: In contrast to what we observed in PVT peak performance, an enhanced reactivity of G/A-allele carriers to manipulations of sleep pressure was measured in n-back performance. The latter pattern of susceptibility to both high and low sleep pressure levels mirrors our findings in subjective sleepiness and well-being, and is in accordance with the suggested pronounced reactivity of G/A-allele carriers to sleep loss (Bachmann et al., 2012). Moreover, it indicates a genotype-dependent beneficial potential of napping in the ability to temporarily store and manipulate information. Indeed, while sleep in general (Kuriyama et al., 2008; Steenari et al., 2003) as well as slow wave sleep in particular (Scullin et al., 2012) have been associated with working memory improvements in accuracy and span, respectively, it remains to be investigated whether genotype-dependent variations in nap sleep modulate the stronger modulation in working memory storage performance of G/A-allele carriers secondary to sleep-wake manipulation.
Importantly, we solely detected genotype-specific performance effects by comparing 2 conditions, in which we experimentally induced high and low homeostatic sleep pressure levels. Indeed, with such a systematic homeostatic state manipulation, our protocol might be more sensitive to unravel mechanisms for neurobehavioral susceptibility to sleep manipulation than using SD protocols only.
Studies comparing cerebral correlates underlying performance in a sleep-deprived state with the ones during rested baseline conditions revealed both task-related blood-oxygen-level dependent activity decreases as well as compensatory mechanisms resulting in activity increases (Chee and Chuah, 2008). The task-specific cognitive domain, task complexity, and interindividual differences in vulnerability to sleep loss have been ranked as factors accounting for the observed discrepancies (Chee and Chuah, 2008). Whether and to what extent the task- and genotype-specific modulations at the behavioral level observed here can be mirrored at the cerebral level remains to be explored.
Our results suggest that a genetically enhanced susceptibility to sleep loss does not become uniformly apparent among cognitive tasks. Such tasks require a differential implication of arousal- and cognition-related brain areas, the successful recruitment of which might depend on the specific individual trait. The data further implicate that the detrimental effects of a trait-like endogenously heightened sleep pressure might be counteracted by nap sleep. Moreover, they underline (Van Dongen et al., 2012) the importance of considering the circadian timing system when assessing interindividual vulnerability to sleep pressure manipulation, entailing a comparison of dependent variables assessed at the same circadian phase. Otherwise sleep loss–related effects on cognitive performance might be underestimated or even ignored.
Limitations of the Study
The individuals participating in our study were young, healthy, and free of any sleep complaints. Together with the small sample size, these strict selection criteria might reduce the generalizability of our study results to the general population. Through this selection process and the highly controlled study routine regarding external influences on circadian and sleep homeostatic processes, however, we aimed to provide an undistorted view of the impact of the ADA polymorphism on circadian and homeostatic regulation mechanisms. In real-life situations, this influence might be counteracted on a behavioral level, such that the transfer of the present results to less controlled or noncontrolled conditions might be done cautiously.
Furthermore, while our nap protocol allows the investigation of waking functions under low sleep pressure during the entire circadian cycle, it does not allow for the investigation throughout a complete waking period, which classically covers 16 h of wakefulness. Likewise, compared to the more effortful forced desynchrony paradigm, sleep does not occur in a consolidated fashion during an entire 8-h period but is fragmented during day- and nighttime, such that ultradian processes, for example, cannot take place (Schmidt et al., 2007). Nevertheless, combined with total SD, the applied paradigm appears suitable to gain important insights into the mechanisms governing interindividual modulations in response to homeostatic sleep challenges during the course of the circadian cycle.
Footnotes
Acknowledgements
The authors thank Sebastian Holst, Jurian Zürcher, Nikolaus Schäfer, Wolfgang Berger, Kim-Dung Huynh, and Christian Vogler for their help in genotyping; Claudia Renz, Giovanni Balistrieri, Marie-France Dattler, Susanne Timus, Catherine Malgat, Stefanie Lisibach, Marc van Oostrum, Diana Hinninger, Janine Weibel, Sarah Chellappa, and Amandine Valomon for their help in data acquisition; Julia Krebs for medical screenings; and the volunteers for participating.
Conflict of Interest statement
The authors report no conflicts of interest. The authors alone are responsible for the content and writing of the article. The work was supported by the Swiss National Foundation #310030_130689, the L. & Th. La Roche-Stiftung, and the Niklaus und Bertha Burckhardt-Bürgin-Stiftung.
Notes
References
Supplementary Material
Please find the following supplemental material available below.
For Open Access articles published under a Creative Commons License, all supplemental material carries the same license as the article it is associated with.
For non-Open Access articles published, all supplemental material carries a non-exclusive license, and permission requests for re-use of supplemental material or any part of supplemental material shall be sent directly to the copyright owner as specified in the copyright notice associated with the article.