
Abstract
In mammals, the central clock in the suprachiasmatic nucleus (SCN) controls physiological and behavioral circadian rhythms and is entrained to the external light-dark cycle. The ability of the SCN to entrain can be measured by exposing the animal to a light-dark cycle with a duration that deviates from 24 h (T-cycles); a wider entrainment range reflects a higher ability to entrain. The neurons of the SCN are either light responsive or light unresponsive and are mutually synchronized. The coupling and synchronization between individual SCN neurons and between groups of neurons within the SCN influence the SCN’s ability to entrain. Some studies suggest that enhanced coupling decreases the entrainment range, whereas others suggest that enhanced coupling increases the entrainment range. The latter results are surprising, as they are not consistent with the prevalent assumption that the SCN is a limit cycle oscillator that has larger phase shifts when the amplitude is smaller. Here, we used the Poincaré and Goodwin models to test entrainment properties using various proportions of neurons that are responsive to an external stimulus. If all neurons receive external input, the SCN shows limit cycle behavior in all conditions. If all neurons do not receive light input, we found that the entrainment range of the SCN was positively related to coupling strength when coupling was weak. When coupling strength was stronger and above a critical value, the entrainment range was negatively correlated with coupling strength. The results obtained from our simulations were confirmed by analytical studies. Thus, the limit cycle behavior of the SCN appears to be critically dependent on the coupling strength among the neurons and the proportion of neurons that respond to the entraining stimulus.
As a consequence of the earth’s rotation around its axis, virtually every organism has developed circadian rhythms in physiology and behavior. In mammals, these circadian rhythms are controlled by the suprachiasmatic nucleus (SCN), which serves as the central pacemaker and is located at the base of the brain. The SCN contains approximately 20,000 neurons and receives light input from the retina through the retinohypothalamic tract (Welsh et al., 2010). SCN neurons are autonomous single-cell oscillators, generating an intrinsic 24-h rhythm via an internal molecular feedback loop (Welsh et al., 1995; Reppert and Weaver, 2002; Herzog, 2007; Webb et al., 2009). These single-cell oscillators are mutually coupled and synchronized (Okamura, 2003; Quintero et al., 2003; Schaap et al., 2003; Honma et al., 2004; Aton et al., 2005; Welsh et al., 2010; Mohawk and Takahashi, 2011).
The endogenous rhythm of the SCN is entrained to the external light-dark cycle. Light information is received through the retina and is transmitted to the ventrolateral aspect of the SCN. The ability of the SCN to entrain can be analyzed by varying the length of the external cycle (T-cycles). The entrainment range is defined as the difference between the shortest and longest T-cycles to which the SCN can entrain and varies both between and within animal species; for example, the range is 22.5 to 25.5 h for Arvicanthis niloticus and 20.5 to 29.0 h for humans (Wever, 1983).
The entrainment range is believed to depend on the ratio between the amplitude of the oscillator and the strength of the external entraining stimulus (zeitgeber) (Pittendrigh et al., 1991; Abraham et al., 2010). The amplitude of the SCN rhythm depends both on the amplitude of the individual neuronal oscillators and on the coupling strength between SCN neurons (Abraham et al., 2010). Tighter coupling increases phase synchrony (Abraham et al., 2010). If the neurons are tightly coupled and are closely synchronized in phase, the amplitude of the SCN rhythm will be large. On the other hand, if the coupling is weak and the cells are poorly synchronized, the amplitude of the SCN rhythm will be small (Schaap et al., 2003; Rohling et al., 2006b; Abraham et al., 2010). Therefore, a high degree of coupling between SCN neurons is predicted to result in a narrow entrainment range (i.e., a low capacity to synchronize to external cycles that deviate from 24 h). Indeed, the SCN has a narrower entrainment range than tissue with weakly coupled oscillators such as the lung, and this is consistent with the finding that the SCN network is more tightly coupled than lung tissue (Abraham et al., 2010).
On the other hand, some results suggest that a decrease in coupling and in synchronization corresponds with a smaller, not larger, phase-shifting capacity and with a smaller entrainment range (Colwell et al., 2003; Aton et al., 2004; vanderLeest et al., 2009; Farajnia et al., 2012). For example, mice that lack vasoactive intestinal polypeptide (VIP) show reduced coupling among neurons, and these mice have a smaller amplitude phase-response curve, whereas overexpression of VIP and enhanced synchrony lead to faster resetting (Colwell et al., 2003; Cao et al., 2013). Furthermore, the amplitude of the SCN rhythm is diminished in older animals due to desynchronization among the neurons (Farajnia et al., 2012; Chang and Guarente, 2013), and old animals have more difficulty entraining to a 22-h T-cycle than young animals (Aton et al., 2004). In addition, animals that are housed under long photoperiods have a lower amplitude of the SCN rhythm than animals housed under short photoperiods because of decreased synchronization within the SCN (vanderLeest et al., 2009). Nevertheless, the SCN of mice exposed to long days has a smaller phase-shifting capacity (vanderLeest et al., 2009; Ramkisoensing et al., 2014). These results are contradictory to the expectation that low-amplitude rhythms show larger phase shifts than high-amplitude rhythms in response to the same perturbation.
Several factors can determine the phase-response properties of the SCN. For example, it is easier to entrain the SCN to extreme T-cycles (i.e., 22 and 26 h) if a higher proportion of neurons are responsive to the zeitgeber (Gu et al., 2012). Here, we mathematically explored the impact of changing the proportion of neurons that receive the external stimulus on limit cycle oscillator behavior in an attempt to resolve discrepancies between previous results. We used numerical simulations utilizing both the Poincaré and Goodwin models, and we also explored this issue analytically.
We found that when 100% of the neurons are responsive to the stimulus, a monotonic relationship was revealed between coupling strength and entrainment range. On the other hand, when fewer than 100% of the neurons are responsive to the stimulus, the response characteristics became dependent on the coupling strength between the neurons and showed an optimum curve as a function of coupling strength. Thus, the proportion of neurons that respond to an external stimulus determines whether the system behaves as a typical limit cycle oscillator. This finding can help resolve the differences in the results that have been observed in previous studies.
Materials and Methods
Two types of models that are often used to describe the SCN oscillatory network are the Poincaré model (Abraham et al., 2010; Bordyugov et al., 2011; Gu et al., 2013) and the Goodwin model, which describes oscillators in terms of a genetic feedback loop (Ruoff et al., 1999; Gonze et al., 2005; Locke et al., 2008; Gu et al., 2009; Xu et al., 2012). We used the Poincaré model in addition to the Goodwin model because it is better suited for mathematical analysis when the oscillators are part of a system of coupled oscillators. The analytical studies were performed because they lead to precise mathematical formulations that can be used for the entire domain of parameters, while in the simulations, it is only 1 set of parameters that is explored. The approaches are complementary.
Poincaré Model
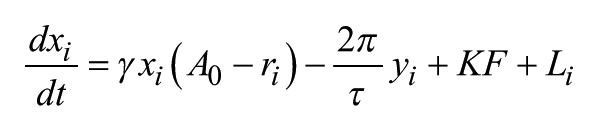
The Poincaré model is a generic model containing 2 variables: x and y for each neuron. The coupled model is defined as follows:
and
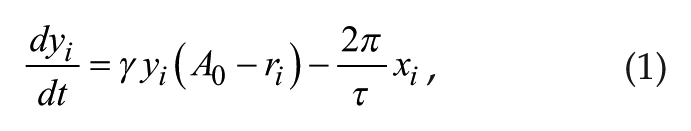
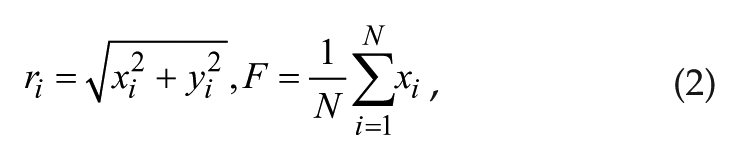
where γ represents the relaxation parameter; A0 and τ represent the amplitude and period, respectively, of 1 isolated individual oscillator; and i represents the ith oscillator (i = 1, . . ., N). The individual oscillators are coupled via the coupling term KF, where K represents coupling strength and F is the mean field value of variable x; r is the amplitude of a single oscillator. r and F are defined as follows:
Li represents the input of light (or any other external stimulus) as follows:
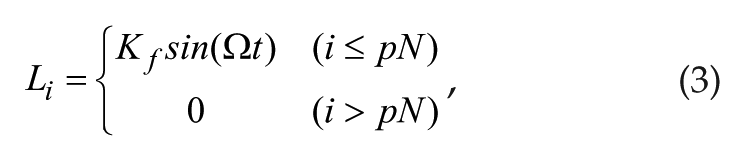
where p represents the proportion of neurons that are responsive to the light signal (0 < p ≤ 1), Kf represents light intensity, and Ω is the angular frequency of the light-dark cycle. When K = 0 and Li = 0, then r = A0. The following parameter settings were used:
In experimental conditions, the light-dark cycle has a square waveform rather than a sinusoidal function. We chose to use the sinusoidal function because it is easier to analyze mathematically. When we simulated light intensity changes by a square waveform, we obtained similar results (Suppl. Fig. S1).
Goodwin Model
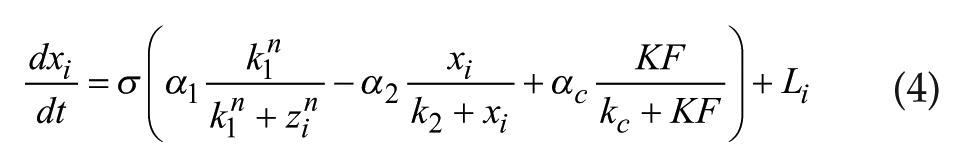
The Goodwin model is widely used to describe mathematically the molecular negative feedback loop that generates circadian rhythms in mammals. In the model, the feedback loop comprises 3 variables: clock gene mRNA (x), a clock protein (y), and a transcriptional inhibitor (z). Together, these 3 variables represent 1 single oscillator, and different oscillators are coupled through the mean field (F) of neurotransmitter concentration (V). A Goodwin model consisting of N oscillators is defined as follows:
and


where the state variables for clock gene mRNA xi, clock protein yi, and transcriptional inhibitor zi form a negative feedback loop and constitute oscillator i. In this model, the neurotransmitter concentration Vi is induced by mRNA xi of neuron oscillator i. The oscillators are coupled through the mean field F, which is the mean of Vi, and coupling strength K represents the sensitivity of each individual oscillator to the mean field and is assumed to be identical for every oscillator.
The light term is defined as stated above for the Poincaré model, with Kf = 0.01.
The following parameter set is the same set as described previously (Gonze et al., 2005):
α1 = 0.7 nM/h, k1 = 1.0 nM, n = 4.0, α2 = 0.35 nM/h, k2 = 1.0 nM, k3 = 0.7 /h, α4 = 0.35 nM/h, k4 = 1.0 nM, k5 = 0.7 /h, α6 = 0.35 nM/h, k6 = 1.0 nM, k7 = 0.35 /h, α8 = 1.0 nM/h, k8 = 1.0 nM, αc = 0.4 nM/h, kc = 1 nM, N = 20.
Definition of the Entrainment Range
The entrainment range of the SCN network is represented by its lower limit of entrainment (LLE) (Abraham et al., 2010). If the period difference between the endogenous cycle and the exogenous T-cycle is less than 0.000001 h, the SCN network is considered to be entrained to the T-cycle.
To compare the effect of differing coupling strengths on the entrainment range, it is necessary to make the free-running period uniform for various coupling strengths, as coupling strength K can affect the free-running period (Gonze et al., 2005; Gu et al., 2009; Abraham et al., 2010).
Here, we defined the normalized LLE in both the Poincaré and Goodwin models (Abraham et al., 2010; Gu et al., 2012) as follows:
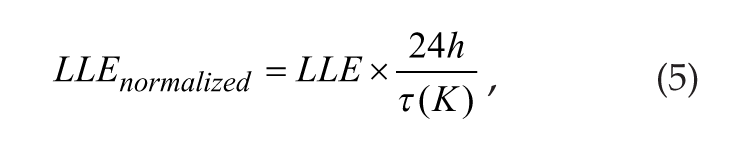
where τ(K) is the free-running period of the SCN with coupling strength K. When K = 0, the neurons are not coupled, and the intrinsic period of each individual neuron is 24 h. For simplicity, we use the LLE to represent LLEnormalized throughout the article.
We confirmed the results obtained for the LLE using the upper limit of entrainment (ULE) with the Poincaré and Goodwin models and with analytical studies. Furthermore, we added simulations in which SCN neurons show enhanced light responses during the night by introducing a circadian modulation of the light sensitivity parameter. Also, we investigated the impact of a heterogenous, as opposed to homogenous, population of neurons on our results by 1) varying the intrinsic periods of individual neurons from 23 h to 25 h and 2) varying the coupling strengths according to a normal distribution (mean ± standard deviation = 1 ± 0.02).
Simulation Details
To numerically calculate the equations, we used the fourth-order Runge-Kutta method with time increments of 0.01 h. The initial 1,000,000 time steps were neglected in order to avoid the influence of transients. The number of oscillators (N) was 20. The initial conditions for each variable were selected randomly from a uniform distribution in the range (0-1) for x and y in the Poincaré model and for x, y, z, and V in the Goodwin model. We also calculated the results using N = 100 and time increments of 0.001 h.
Results
We used the Poincaré model to evaluate how the proportion of SCN neurons that are responsive to a zeitgeber (e.g., light or temperature) determines the SCN’s ability to entrain. We performed numerical simulations using 5 different proportions (10%, 25%, 50%, 75%, and 100%) of neurons that receive the external signal, where 25% (i.e., p = 0.25) (see Materials and Methods) corresponds to normal light input of the SCN (Sawaki, 1979; Meijer et al., 1986; Cui and Dyball, 1996; Jiao et al., 1999). To estimate the entrainment range of the SCN, we determined the LLE as described previously (Abraham et al., 2010). A larger deviation of the LLE from 24 h corresponds with a wider entrainment range.
We examined the response properties of the SCN with respect to varying both coupling strength (K) and the proportion of neurons that receive the external signal (Fig. 1 and Fig. 2A [ULE]). When 100% of the neurons receive the external signal (i.e., p = 1), the entrainment range decreases as coupling strength increases; thus, a tightly coupled system will have a narrower entrainment range than a weakly coupled system. However, a different result is obtained when a smaller proportion of neurons receive the external signal. With weak coupling strength, the entrainment range increases as a function of K and shows an optimum at the critical value (Kc), which is approximately 0.08. Above this critical value, the entrainment range then decreases as a function of K.
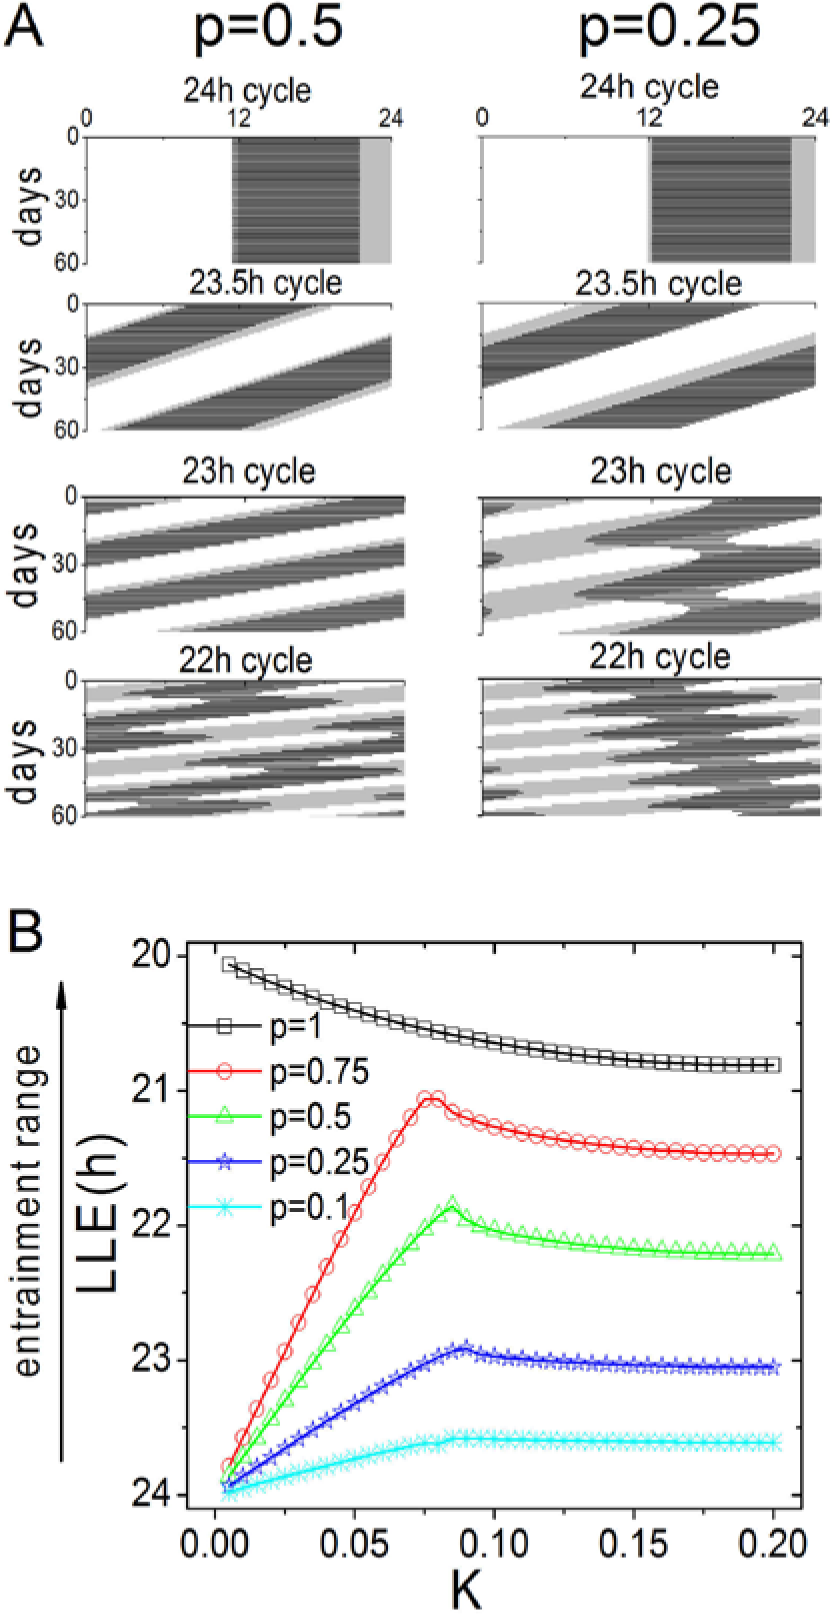
The entrainment range depends on both the proportion (p) of neurons that receive the entrainment signal and the coupling strength (K) among the neurons. (A) Simulated activity rhythms for p = 0.5 and p = 0.25 for different T-cycles, with coupling strength K = 0.10. The rhythm entrains to a T-cycle of 23 h when p = 0.5 but not when p = 0.25. The light-dark cycle is shown as a white-gray background. (B) The LLE is plotted against the coupling strength for different p values. When p = 1, the entrainment range is a monotonic negative function of K. In contrast, when p < 1, the entrainment range follows a biphasic relationship with respect to K. When K is below a critical value (Kc), the entrainment range increases as coupling strength increases; when K is above this critical value, the entrainment range decreases as coupling strength increases. Here, Kc is approximately 0.08. The data were simulated using the Poincaré model (see Materials and Methods).
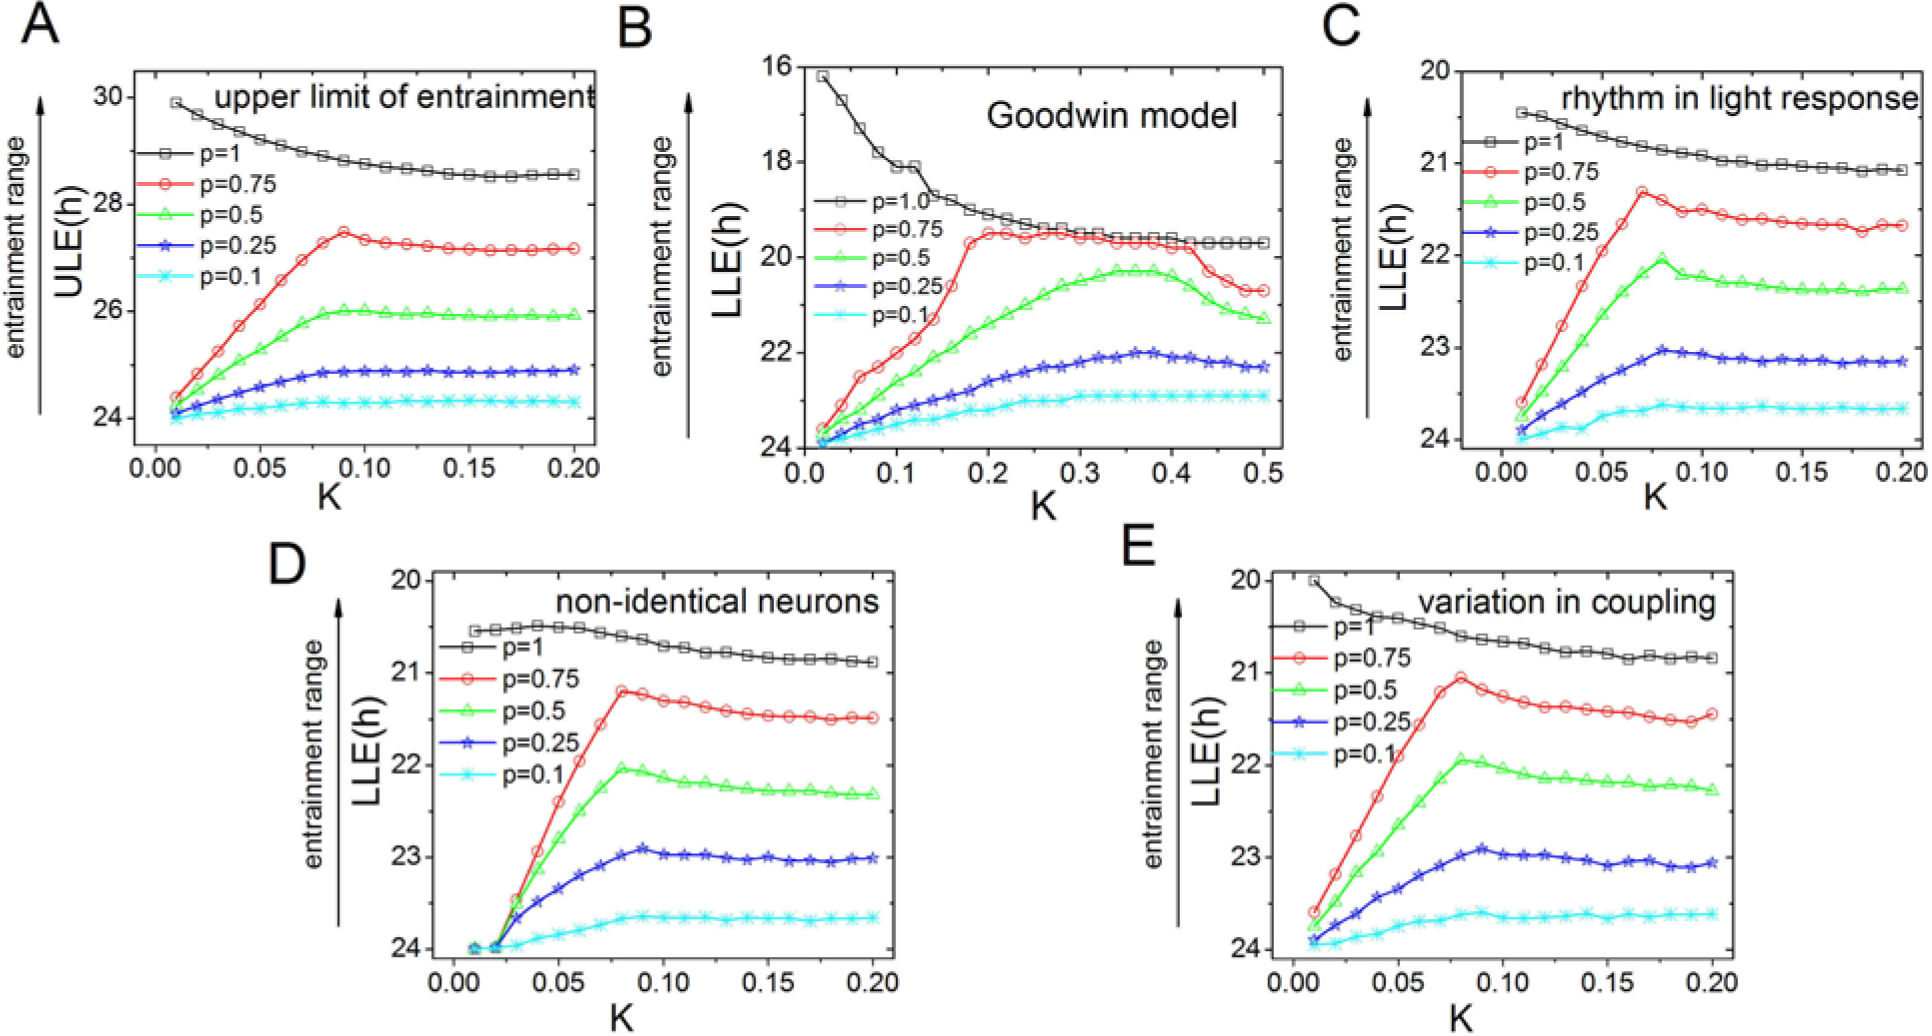
The entrainment range is dependent on both the proportion (p) of light-receiving neurons and coupling strength for different conditions. (A) The ULE for the Poincaré model. The ULE is plotted against the coupling strength for different values of p. The results are very similar to the results obtained for the LLE, and Kc = 0.08. (B) The LLE for simulations of the Goodwin model, plotted as a function of coupling strength, for different p values. (C) The LLE simulated with cells that are more sensitive to light during the night and less sensitive during the day for different p values. (D) The LLE simulated for nonidentical cells with intrinsic periods, ranging from 23 to 25 h, for different p values. (E) The LLE simulated for nonidentical coupling strengths between the neurons for different p values. All results are qualitatively similar to the results obtained with the Poincaré model (see Fig. 1).
To verify the outcome of our simulation of the Poincaré model using a secondary approach, we also applied the Goodwin model (Fig. 2B). The results obtained using the Goodwin model are consistent with the results obtained with the Poincaré model. When p = 1, the entrainment range decreased as a function of coupling strength; however, when p < 1 and with low coupling values, the entrainment range increased as a function of K, whereas the entrainment range decreased as a function of K with higher coupling values.
We performed 2 additional simulations: one in which the SCN neurons show enhanced light responses during the night (Meijer et al., 1998; Brown et al., 2011), and one in which the neurons are heterogenous with respect to their period and coupling strength (Gu et al., 2012; Gu et al., 2013). The results were very similar to our main results (Fig. 2C-E).
Analytical Studies
To obtain insight into our simulation results, we performed a series of analytical studies. The details of these analytical studies are provided in the online supplementary material. We used equation S7 when K ≤ Kc and equation S10 when K > Kc to show the analytical results, utilizing p = 0.25 to mimic light input of the SCN (Sawaki, 1979; Meijer et al., 1986; Cui and Dyball, 1996; Jiao et al., 1999) (Fig. 3A). The results of the theoretical analysis are similar to the simulation results and yielded a unimodal curve that contained a critical transition point Kc. To further investigate Kc, we plotted the LLE as a function of the proportion of neurons that receive input (Fig. 3B). When K < Kc (i.e., <0.08), we observed a sharp and steep jump in the entrainment range as p approaches 1, indicating a fundamental difference in response behavior between partial and full sensitivity to the external signal when coupling is weak. If coupling strength is higher than the critical value (K > 0.08), we observed a gradual and consistent increase in the entrainment range as a function of p. In other words, an increase in p corresponded with a near-linear increase in the entrainment range.
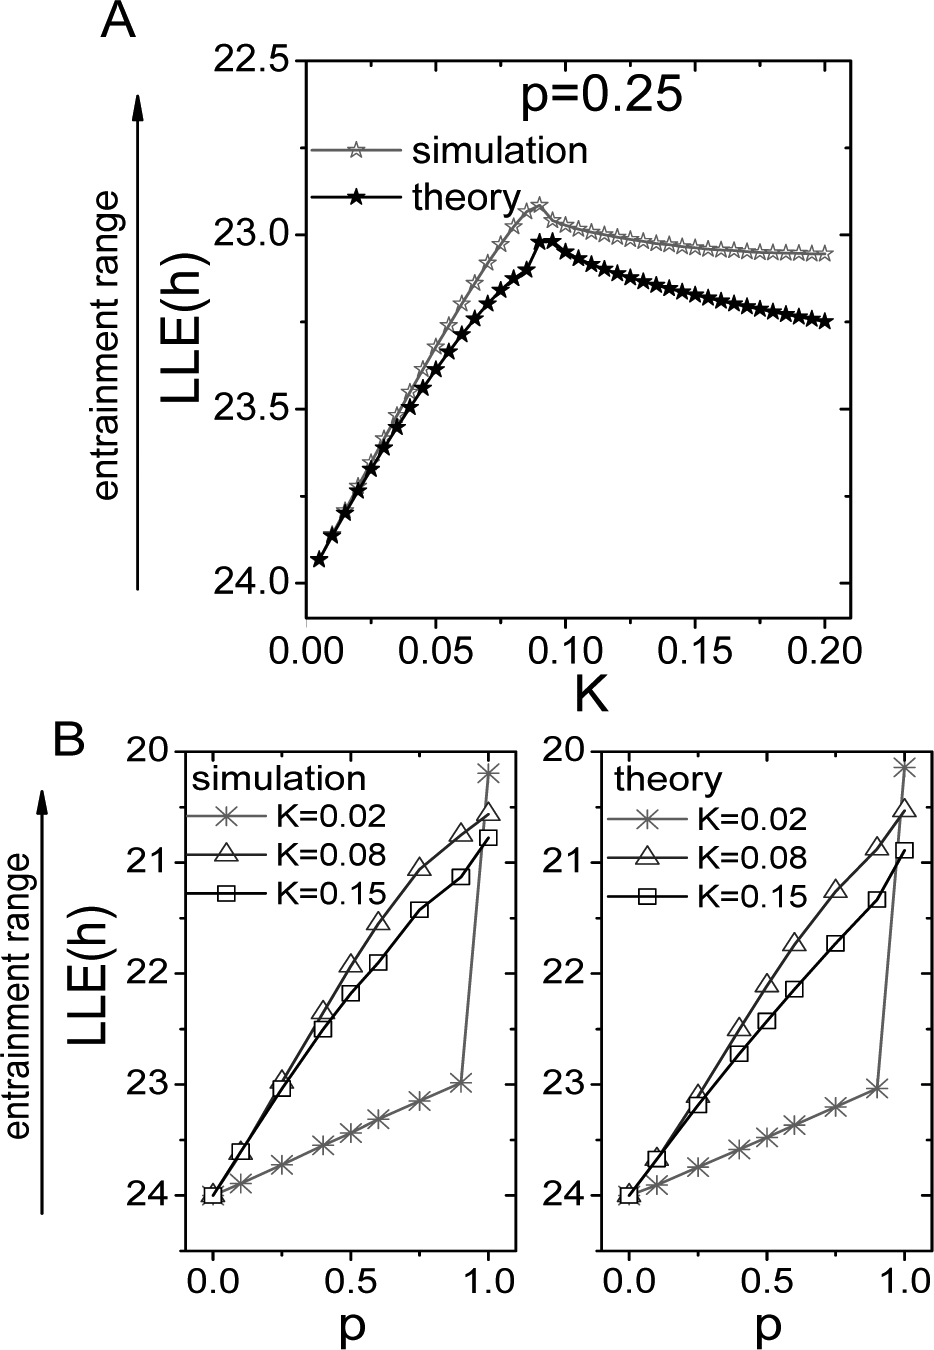
Comparison between the theoretical analysis and numerical simulations. (A) The results from Figure 1 were theoretically analyzed for p = 0.25. The simulation data are repeated from Figure 1 (note the change in the y-axis scale from Fig. 1). (B) The relationship between the entrainment range and the proportion (p) of neurons that receive the entrainment signal for K < Kc, K = Kc, and K > Kc. The left figure shows the results of the numerical simulation, and the right figure shows the results of the theoretical analysis. In both the simulation and theoretical analysis, the entrainment range is positively correlated with p. When K = 0.02 (i.e., K < Kc), the entrainment range changes abruptly from p = 0.9 to p = 1.0.
We analytically determined the parameter domain of K and confirmed the existence of Kc when p < 1. When K < Kc, equation S7 shows that Ω
LLE
is proportional to K. Because Kf and K are substantiallysmaller than A0, it follows that
The value of Kc is obtained using equation S10 and is positively dependent on the value of p. We attributed a value to p in equation S10 as follows:
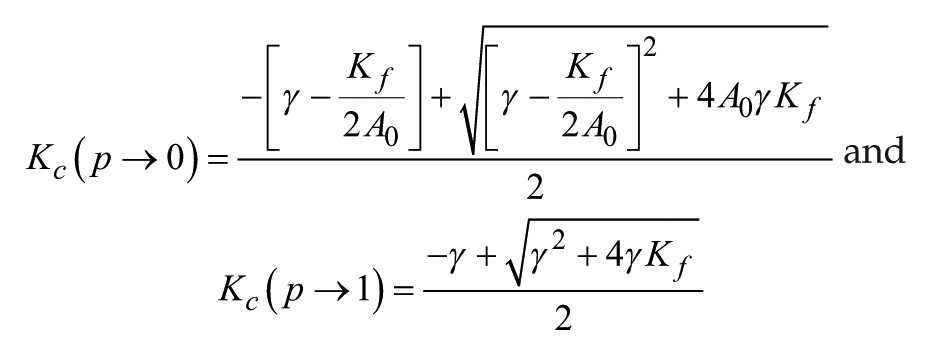
We substituted the values of other parameters and obtained Kc(p → 0) = 0.10 and Kc(p → 1) = 0.07. Consistent with the results shown in Figure 1, Kc decreases as p increases. Note that when p is infinitely close to 1, Kc is 0.07; however, when p = 1, no critical value (Kc) emerges. All of our analytical results are fully consistent with our simulation results obtained using either the Poincaré model or the Goodwin model.
Discussion
In response to a given perturbation, low-amplitude rhythms are generally expected to cause a greater phase shift than high-amplitude rhythms. Although some studies support this expectation, other studies do not. Here, our aim was to investigate the conditions that determine the response properties of the SCN, to evaluate the influence of the proportion of neurons that receive the external stimulus, and to identify the role of coupling strength between neurons. Two models were used to examine the effects of external stimuli on SCN response properties. First, a modified Poincaré model was used, and these results were further tested and confirmed using a Goodwin model. Both models revealed that when all neurons receive the external signal, increasing coupling strength decreases the SCN’s entrainment range. However, qualitatively different results were obtained when the proportion of neurons that receive the external signal drops below 1; specifically, the entrainment range is no longer a monotonic function of coupling strength but has a maximum at a critical value of K (Kc, the transition point). When coupling strength increases from 0 to the critical value, the entrainment range of the SCN first increases; however, when coupling strength is higher than this critical value, the entrainment range decreases with increasing coupling strength. These simulation results were verified using analytical approaches.
Perturbing Stimuli: Temperature and Light
Although the circadian clock can compensate for changes in temperature, external temperature can serve as a weak zeitgeber (Edery, 2010). However, in homeothermic animals such as mammals, the influence of external temperature on the pacemaker’s phase is extremely small, and changes in external temperature have only a minimal influence on the phase of the pacemaker (Refinetti, 2010). The effect of temperature on the SCN can be investigated, however, in vitro by changing the temperature of the bath medium in which the tissue explant is cultured. As expected from the Goldman equation, temperature will affect the amplitude and frequency of action potentials of individual SCN neurons (Ruby and Heller, 1996; Ruby et al., 1999; Herzog and Huckfeldt, 2003). Such changes in temperature will affect all neurons and may occur during exercise or sleep (Franken et al., 1991; Deboer and Tobler, 1997; Nybo, 2012). However, we regard this primarily as an experimental manipulation that enhances our insight in the response properties of the system. If 100% of the neurons in the SCN respond to a change in temperature, this would correspond to a situation in which p = 1. This result is consistent with the findings of Abraham and colleagues (2010), who observed that when peripheral oscillators (fibroblasts) are weakly coupled, they have a wider entrainment range to temperature cycles than the network of the more strongly coupled SCN. In addition, weakening coupling within the SCN network by the application of N-(Cis-2-phenyl-cyclopentyl) azacyclotridecan-2-imine-hydrochloride (MDL) or tetrodotoxin (TTX) increases the entrainment range of the SCN to temperature cycles (Abraham et al., 2010).
Retinal stimulation causes acute changes in the discharge levels of light-responsive SCN neurons. Single-cell in vivo recordings in anesthetized animals have yielded the most reliable and consistent estimates of the proportion of light-responsive neurons within the SCN, and all studies obtained values between 20% and 30% (Sawaki, 1979; Meijer et al., 1986; Cui and Dyball, 1996; Jiao et al., 1999). If only a fraction of SCN neurons is responsive to an external stimulus, changes in coupling strength will have an unpredictable effect on the entrainment range, as Kc is unknown. These results raise the question of whether we can estimate Kc. Although we cannot currently determine Kc with absolute precision, it might be possible to use existing empirical data to determine whether coupling strength within the SCN is weaker or stronger than Kc.
When days are relatively short (i.e., the light period is shorter than 12 h), neurons in the SCN are more closely synchronized in phase than during long days (Hazlerigg et al., 2005; Rohling et al., 2006a; Rohling et al., 2006b; Inagaki et al., 2007; VanderLeest et al., 2007; Naito et al., 2008; Brown and Piggins, 2009). Moreover, on short days, the phase shifts are larger than on long days (Pittendrigh et al., 1991; Refinetti, 2007; vanderLeest et al., 2009), and the SCN of short-day animals has enhanced synchrony and readjusts more rapidly to a shift of the light-dark cycle (Ramkisoensing et al., 2014). The increased phase synchrony by exposure to short days leads to an enhanced phase shift in response to light stimuli, while decreased phase synchrony leads to a decrease in the phase-shifting response.
Similar to the effect of exposing animals to long days, aged animals experience a reduction in phase synchrony, as revealed by electrophysiological techniques (Nygard et al., 2005; Duncan, 2007; Nakamura et al., 2011; Farajnia et al., 2012; Sellix et al., 2012; Chang and Guarente, 2013). This reduced phase synchrony in aged animals is associated with reduced intercellular communication, reduced GABAergic activity, and reduced electrical activity. Thus, in aged animals, a decrease in communication within the SCN network has been clearly established. Of note, aged animals have a reduced phase-shifting capacity, even in response to saturating light intensities (Valentinuzzi et al., 1997; Biello, 2009; Farajnia et al., 2012; Sellix et al., 2012). Interestingly, when aged mice were exposed to a shift in the light-dark cycle, the shift in the expression of Per1 was attenuated, whereas the shift in Per2 expression was enhanced (Kolker et al., 2003; Sellix et al., 2012). The latter result is surprising, as an enhanced amplitude in the Per2 expression rhythm of single cells was observed as well as decreased synchrony between the cells in old animals (Sellix et al., 2012). Not only in animals but also in elderly humans has a reduced ability to adjust to new cycles been observed, as evidenced by a decreased ability to work in shifts (Duffy et al., 2007; Sletten et al., 2009). Conversely, transgenic mice with enhanced SCN coupling, as a consequence of overexpressing the type 2 vasoactive intestinal peptide (VPAC2) receptor rapidly, resynchronize in response to an advance in the light-dark cycle (Shen et al., 2000; Cao et al., 2013).
The finding that aging and entrainment to long days result in lower magnitude phase shifts indicates that the circadian system operates on a trajectory in which coupling strength is positively correlated with the entrainment range. This suggests that under “normal” conditions (i.e., young adult animals housed under 12:12 light-dark conditions), the coupling factor K is lower than Kc, as a decrease in coupling will lead to a decrease in the entrainment range only when K is lower than Kc (Fig. 4).
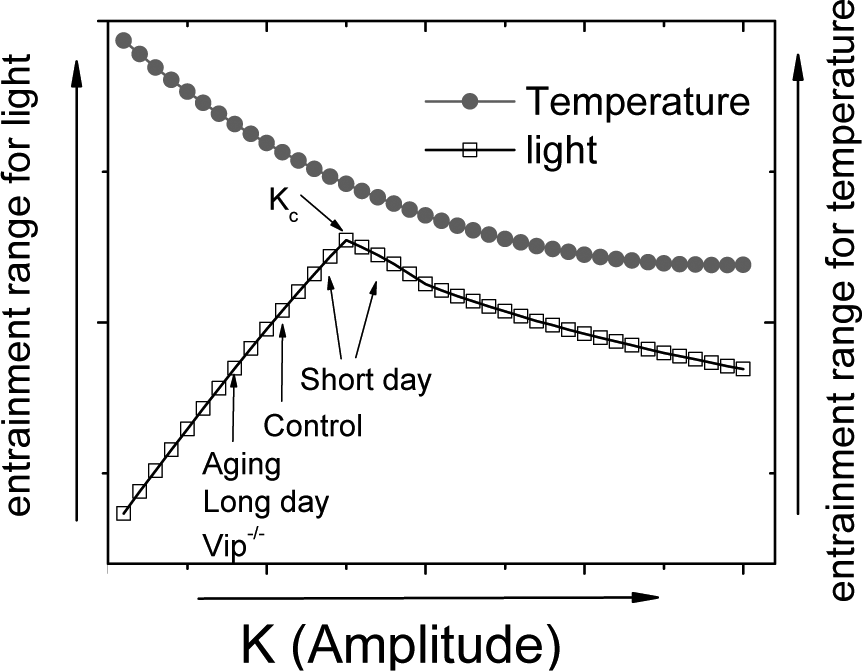
Differences in the entrainment range under various conditions can be explained by our model. For temperature, p = 1 (as all of the neurons will respond to a change in temperature). For external light, p = 0.25. Kc is indicated, and the effects of the various conditions on K are indicated. “Control” refers to normal conditions (young mice housed under 12:12 light-dark conditions). Note that the 2 curves have different y-axes and cannot be compared quantitatively.
Several studies have suggested that coupling within the SCN is weak (Liu et al., 1997; Honma et al., 2004; Indic et al., 2008; Myung et al., 2012). Weak coupling is defined as the condition in which coupling has little effect on the amplitude of single neuron oscillators but has a large effect on the phase of single neuron oscillators (Kuramoto, 1984; Strogatz, 2000; Winfree, 2001; Acebrón et al., 2005). In constant light conditions, the amplitude of a single neuron’s oscillations changes little, despite considerable desynchronization among the neurons (Ohta et al., 2005).
Additional evidence supporting weak coupling within the SCN was obtained from phase-shifting studies. Following a phase-resetting light pulse or a shift in the external light-dark cycle, resetting of the rhythm is often accompanied by transient cycles, which are believed to reflect reorganization in the phase relationships between the underlying oscillators. Because many cycles are required to complete the reorganization (which can take 3-6 days), coupling among SCN cells is believed to be relatively weak (Yamazaki et al., 2000; Reddy et al., 2002; Nagano et al., 2003; Davidson et al., 2009; Sellix et al., 2012). Taken together, the experimental results suggest that under normal circumstances, the SCN neurons are weakly coupled, which is consistent with the coupling factor being lower than Kc.
Entrainment Range
In our study, we distinguished mathematically between oscillators that are responsive to an external stimulus and oscillators that are not directly responsive to a zeitgeber. Entrainment is achieved if the zeitgeber-responsive neurons and, indirectly, the zeitgeber-unresponsive neurons are able to entrain to the T-cycle (de la Iglesia et al., 2004; Schwartz et al., 2010; Gu et al., 2012). It is an inherent property of the models that, within the limits of entrainment, the zeitgeber-responsive neurons are entrained to the zeitgeber. For the SCN, this may not be the case, which would decrease the effective contribution of light to the SCN, resulting in a further decrease of the entrainment range (corresponding with a lower p value in our model). When 100% of the neurons in the SCN are zeitgeber responsive, all oscillators in the model are mathematically uniform. However, when fewer than 100% of the neurons are zeitgeber responsive, the mathematical difference between zeitgeber-responsive and zeitgeber-unresponsive oscillators in our model accounts for the difference in entrainment below and above the critical coupling strength Kc.
When coupling strength is higher than Kc, the strength of the coupling will be strong enough to ensure that the zeitgeber-responsive and zeitgeber-unresponsive neurons will remain synchronized in phase, essentially forming 1 functional group of cells. Thus, the range of T-cycles to which the network can entrain will depend solely on the coupling strength of the network, which is reflected in its amplitude. If the network amplitude is extremely high, the network will become too rigid to be entrained to an external T-cycle (Abraham et al., 2010). Thus, a higher amplitude leads to a narrower entrainment range, and a lower amplitude leads to a wider entrainment range. On the other hand, when coupling strength is lower than Kc, coupling between the zeitgeber-responsive oscillators and the zeitgeber-unresponsive oscillators is weak. Consequently, the zeitgeber-responsive neurons will be unable to synchronize the zeitgeber-unresponsive neurons to short T-cycles, resulting in dissociation between the 2 groups of neurons in the network (de la Iglesia et al., 2004). Thus, the entrainment range depends on whether the zeitgeber-unresponsive neurons can be entrained by the zeitgeber-responsive neurons, from which follows that the entrainment range increases when coupling strength is increased.
Evidently, for all values of K, tighter coupling leads to more synchronization of the neuronal groups within the network and therefore to a larger amplitude of the network oscillation (Suppl. Fig. S2). However, we show here that the amplitude of the SCN and the entrainment range do not follow a monotonous relationship. Thus, for models that contain nonuniform oscillators (in which one group of neurons is zeitgeber responsive and another group of neurons is zeitgeber unresponsive), a critical coupling value (Kc) functions as a transition point between either entrainment determined by synchrony within the network (K < Kc) or entrainment controlled by the strength (i.e., the amplitude) of the network oscillations (K > Kc).
Amplitude of the SCN Network
Importantly, the amplitude of the SCN is the product of 1) single-cell amplitude and 2) neuronal synchrony. It is very likely that individual SCN cells behave as limit cycles and that cells with high-amplitude rhythms shift less than cells with low-amplitude rhythms. Intuitively, this would correspond with a pendulum with a long cord, which is more difficult to shift as compared to a pendulum with a short cord. Several studies have shown that a reduced amplitude of the SCN (at the population level) was associated with an enhanced phase-shifting capacity (Vitaterna et al., 2006; An et al., 2013; Guilding et al., 2013). In some studies, the population amplitude was reduced not as a result of desynchrony but as a result of a decrease in single-cell amplitude (Vitaterna et al., 2006; Guilding et al., 2013). These studies, therefore, are not in disagreement with the present study. In another study, the population amplitude was decreased as a result of both a reduction in single-cell amplitude and desynchronization (An et al., 2013). In such a case, it becomes unpredictable whether the phase-shifting capacity will increase or decrease, as it depends on the relative changes in these 2 variables.
In short and long photoperiods, only phase synchrony between the neurons is altered, while the single-cell amplitude is not significantly different (VanderLeest et al., 2007). In this case, the phase-shifting capacity decreases when the rhythm amplitude of the population is lower. This is in accordance with the predictions of this study and in contrast to the behavior of the individual components. Thus, when limit cycle oscillators are brought together, new properties arise in the behavior of the ensemble.
Can we still regard the SCN network as a limit cycle oscillator, or are these findings in conflict with the properties of a limit cycle oscillator? In the circadian rhythm field, amplitude has become closely associated with a limit cycle oscillator, and it is generally believed that high-amplitude limit cycle oscillators have a smaller phase-shifting capacity than low-amplitude limit cycle oscillators (Pittendrigh et al., 1991). We show that high-amplitude rhythms can shift more if the high amplitude is the result of enhanced synchrony among the neurons. Our results suggest, therefore, that the SCN at the network level has more complex properties, which were not directly anticipated. These response properties of the SCN appear to follow logically from both the coupling strength of the SCN network and the proportion of neurons that respond to the perturbing external signal.
Footnotes
Acknowledgements
The authors thank Tom Deboer and Stephan Michel for their useful comments on this article. They also thank the anonymous reviewers for their excellent suggestions. This research was supported by the Netherlands Organization for Scientific Research (complexity grant no. 645.000.010).
Conflict of Interest Statement
The author(s) declared no potential conflicts of interest with respect to the research, authorship, and/or publication of this article.
References
Supplementary Material
Please find the following supplemental material available below.
For Open Access articles published under a Creative Commons License, all supplemental material carries the same license as the article it is associated with.
For non-Open Access articles published, all supplemental material carries a non-exclusive license, and permission requests for re-use of supplemental material or any part of supplemental material shall be sent directly to the copyright owner as specified in the copyright notice associated with the article.