
Abstract
This publication presents a new analysis of experiments that were carried out in human subjects in isolation from time cues, under supervision of Jürgen Aschoff and Rütger Wever at the Max Planck Institute for Behavioural Physiology (Erling-Andechs, Germany, 1964-1974). Mean rectal temperatures (tb) were compared between subjects who showed internal desynchronization (ID) and internal synchronization (IS) of the endogenous rhythms of sleep-wakefulness and of body temperature. The results showed that tb was reduced in long ID (circadian sleep-wake cycle length [τSW] > 27 h) and increased in short ID (τSW < 22 h) relative to IS. In subjects with both ID and IS sections in the complete record, these differences were also found when comparing only the IS sections: Low tb during IS predicts the later occurrence of long ID, and high tb predicts the incidence of short ID. While this association is associated with sex differences in tb, it also occurs within each sex. To the extent that the variation in tb reflects the variation in heat production (metabolic rate), the results are consistent with the proposition that the spontaneous frequency of the human sleep-wake oscillator is associated with the metabolic rate, as suggested on the basis of the proportionality of meal frequency and sleep-wake frequency. The finding thus has implications for our views on spontaneous sleep timing.
Keywords
Human subjects in prolonged isolation from external time cues often show internal desynchronization (ID) (Wever, 1979). This is a state in which the alternation of sleep and wakefulness is no longer in synchrony with the circadian rhythm of body temperature; that is, the 2 rhythms simultaneously exhibit different frequencies. The phenomenon was first observed by Aschoff (1965) shortly after he established the endogenous nature of human circadian rhythms (Aschoff and Wever, 1962). Its occurrence has been confirmed by several other laboratories (Colin et al., 1968; Jouvet et al., 1974; Weitzman et al., 1979) and was claimed to occur in about one third of all subjects living in isolation from external time cues (Wever, 1979). In ID, the cycle length of the sleep-wake rhythm is highly variable between individuals. It can be either much shorter (16-20 h; “short ID”) or much longer (29-68 h; “long ID”) than the circadian body temperature rhythm, which retains periods virtually always between 24 and 26 h (Wever, 1979). It is quite unusual for other circadian rhythms to display such a large variability in the period as the sleep-wake rhythm in humans. As the processes leading to sleep and those leading to wakefulness still elude our scientific understanding, it would be of great interest to better understand physiological correlates of the period of the sleep-wake rhythm, here indicated by τSW.
Aschoff and colleagues (1984, 1986) have speculated that there might be an association of the cycle length with the overall rate of metabolism. This hypothesis was based on patterns of meal timing during ID rather than on direct measurements of the metabolic rate. Their analysis yielded intriguing results. The authors reported that subjects retained the habit of taking 3 meals per wake episode when the latter became greatly compressed or expanded in ID. The intervals between breakfast, lunch, and dinner were reduced or increased in proportion to the duration of wakefulness (Aschoff et al., 1986). Hence, subjects eat breakfast, lunch, and dinner once per τSW of, say, 18 h in “short” ID and once per τSW of, say, 34 h in “long” ID (these values are the means reported by Wever [1979]). If meals had the same size in the different situations of internal synchronization (IS) and ID, this would lead to a substantial increase in overall food intake in short ID and to a large decrease in long ID. Aschoff et al. (1986) deplored that no precise quantitative measurement had been taken of food intake and body weight in their experiments. The limited data on body weight demonstrated no loss or gain following ID (Aschoff, 1989). The authors suggested that there may have been differences in the metabolic rate associated with meal frequency. This speculation gained support in a study on 8 subjects by Green et al. (1987a, 1987b). These authors did analyze meal timing, meal size, and body weight and concluded that in long ID, the caloric intake rate decreased on average by 21%, without negatively affecting body weight. In their sample, short ID did not occur. Green et al. (1987b) indeed shared the view that the mechanism responsible for the timing of sleep and waking is also important for the timing of meals. In an analysis of the timing of defecation, Aschoff (1994) further showed that the interval from the main evening meal (or from wake-up) until the first defecation expanded proportionally with the circadian period, suggesting that bowel movement slowed down in long ID.
Aschoff’s (1993) suggestion of a change in the metabolic rate was further supported by his analysis of the locomotor activity of subjects in isolation, measured by motion sensors underneath the floor carpets in the isolation unit. These data demonstrated that the total amount of activity per wake episode was independent of the duration of wakefulness (α) and that activity per hour was inversely proportional to α (Aschoff, 1993). Since this activity can account only for a small part of the metabolic rate, Aschoff (1993) suggested that basal metabolism must also have been reduced in long ID. If this were true, one might hypothesize that the sleep-wake cycle is controlled by the same process that controls heat production and, while normally entrained to approximately 24 h by the circadian pacemaker, can assume widely different period lengths under the influence of the overall energy metabolic rate in conditions of isolation. This would provide new insight into the nature of the buildup and breakdown of sleep need during wakefulness and sleep (“Process S”) (Borbély, 1982; Daan et al., 1984).
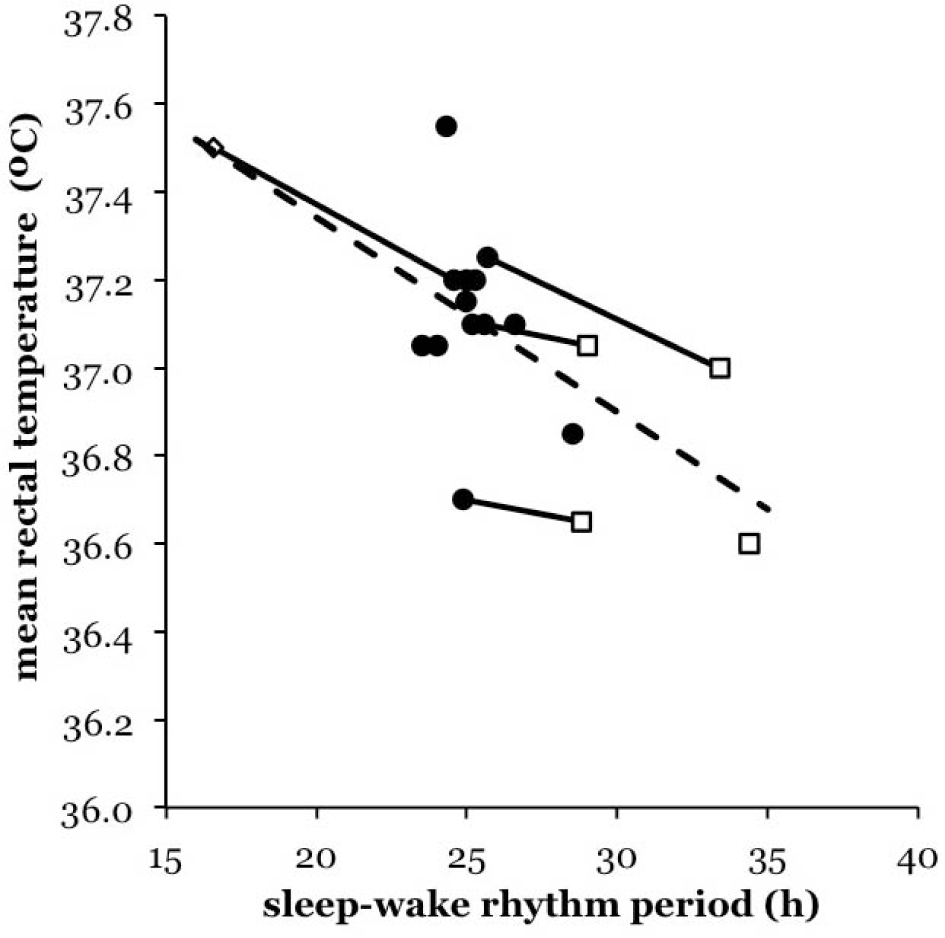
No direct measurements of the human metabolic rate during prolonged isolation from time cues exist to put this hypothesis to the test. Since body temperature is a potential correlate of metabolic heat production, we have looked for a possible relationship between the mean core body temperature and τSW in ID in existing data. The core body temperature has nearly always been recorded in human circadian experiments. Its analysis, however, usually focused on the timing of peaks and troughs in the temperature rhythm and virtually never on the mean values. We first analyzed the extensive data published by Wever (1979) in his monumental book. Encouraged by these initial results (Fig. 1), we proceeded to the original data of Aschoff and Wever and performed an analysis of a sizeable sample of their experiments.
Relationship between
Database
The data that we used are all derived from the experiments performed by Professors Jürgen Aschoff and Rütger Wever in the first isolation facility specifically built for the purpose of studying human circadian rhythms. In this facility, at the Max Planck Institut für Verhaltensphysiologie in Erling-Andechs, Germany, experiments were performed from July 6, 1964 until December 21, 1989. The facility and the experiments until 1978 have been described in detail by Wever (1979). In total, 485 experiments were carried out here. Most of these involved a subject staying in complete isolation for 4 weeks. The experimental conditions varied considerably over the years. The behavior of subjects was studied to assess responses of free-running rhythms to different constant conditions as well as entrainment responses to potential zeitgebers such as light, temperature, electromagnetic fields, and others. The paper archive of these experiments and the data collected have recently been largely restored. 1 It is now hosted by the Institute for Medical Psychology, University of Munich (head: Prof. Dr. M.W. Merrow), and made accessible to researchers worldwide. The digitized archive has not been retrieved so far.
In a pilot approach, we used the data on 14 subjects reported on by Wever (1979) in his book. This analysis used all 14 figures in which the author plotted the mean circadian sine wave curves fitted to the rectal temperature records of an individual in constant conditions. From this, we derived the overall mean rectal temperature (tb) and compared it in Figure 1 with the τSW provided in the figure legends by Wever (1979). In the original data archive, a larger subsample (48 subjects) was selected first for the absence of any zeitgebers. In particular, subjects were preferentially selected who showed both IS and ID (see supplementary online material). We attributed record sections to IS or ID on the basis of τSW as in Figure 37 in Wever (1979). A τSW below 22 h was interpreted as short ID and above 27 h as long ID; IS sections all had a τSW between 22 and 27 h. This corresponded to individual records with the assignment by Wever and Aschoff in notes and publications, and indeed, the τSW values were mostly obtained from them. Since sections always lasted 8 or more days, this means that the body temperature and sleep-wake rhythm shifted at least 1 full cycle relative to each other. Since the original digitization of the data by Wever is no longer available, rectal temperature records (1 value per half-hour) and sleep-wake alternations (each reported onset and end of sleep) were digitized (with half-hour resolution). We then computed the overall mean tb over the same section of the record for which τSW was calculated. Such sections were typically in the order of 10 cycles long and defined from onset until onset of wakefulness. In the case of ID, this natural number of cycles for the sleep-wake rhythm means that there is no whole number of complete tb cycles. Although this theoretically causes a bias, we have made computed estimates of the error, which is maximally in the order of 0.015 °C, that is, less than the symbol size in our figures. Another potential source of error is the temperature changes with the menstrual cycle in female subjects. As this was not recorded in the experiments, we simply use long-term overall mean values.
Results
We first looked at the data extracted from Wever’s (1979) book in Figure 1. This suggests an interesting pattern. First, with an increase in τSW, there appears to be an overall decline in the mean tb between subjects. The linear regression tb (°C) = 38.21 – 0.044 * τSW (h) is a first approximation of this trend. This association is statistically significant when formally tested as though all data points were independent (Pearson r = −0.666 [p = 0.003]; Spearman ρ = −0.529 [p = 0.024]; n = 18). Values of tb during long ID appear to be lower, while in the single case of short ID (Fig. 28 in Wever [1979]), the mean tb is near the upper range of mean tb values observed. This can be no more than a preliminary indication for a tendency of tb to be associated with τSW in humans. In all 4 of the subjects who showed both an episode of IS and an episode of ID, this negative association was also seen within the individual, possibly suggesting a causal relationship. This led us to address the question of the relationship between τSW and tb in humans more completely.
The dataset that we then selected from the archive comprises 48 subjects (including those in Wever’s [1979] book, which were partly reanalyzed). In these subjects, there were 65 sections, from each of which 1 mean value for tb and 1 value for τSW were determined (Fig. 2A). Overall, these 2 parameters were indeed significantly negatively correlated, again when formally tested and pooling intraindividual and interindividual associations (Pearson r = −0.254 [p = 0.041]; Spearman ρ = −0.402 [p = 0.001]; n = 65). In Figure 2B, we show interindividual association alone by summarizing the data with the overall mean values for each of 6 groups, that is, 3 groups for each sex: short ID, IS, and long ID. Here, we did not include sections with IS when a section with ID for the same individual was also present to avoid multiple data from the same individuals. Regression of tb on circadian period and sex (male = 1, female = 0) yields tb = 37.92 – 0.019 * τSW – 0.389 * sex (n = 48; τSW: t = −2.182 [p = 0.034]; sex: t = −3.235 [p = 0.002]). Correlation coefficients for tb and τSW in this smaller dataset are the following: Pearson r = −0.349 (p = 0.015) and Spearman ρ = −0.440 (p = 0.002). The partial correlation of tb and τSW after controlling for sex is r = −0.309 (p = 0.034). Hence, females have a higher mean core temperature than males in the dataset, and the mean core temperature is negatively associated with the period of the sleep-wake cycle. Female and male subjects were differentially distributed over short ID (3 females, 3 males), IS (9 females, 10 males), and long ID (3 females, 20 males). Although this distribution is significantly different from random (χ2 = 6.83; p = 0.033), this is not reliable evidence, as the records analyzed were selected partly on the basis of the incidence of ID. The deviant distributions for the sexes are consistent with results reported earlier by Wirz-Justice et al. (1984) on partly the same data.
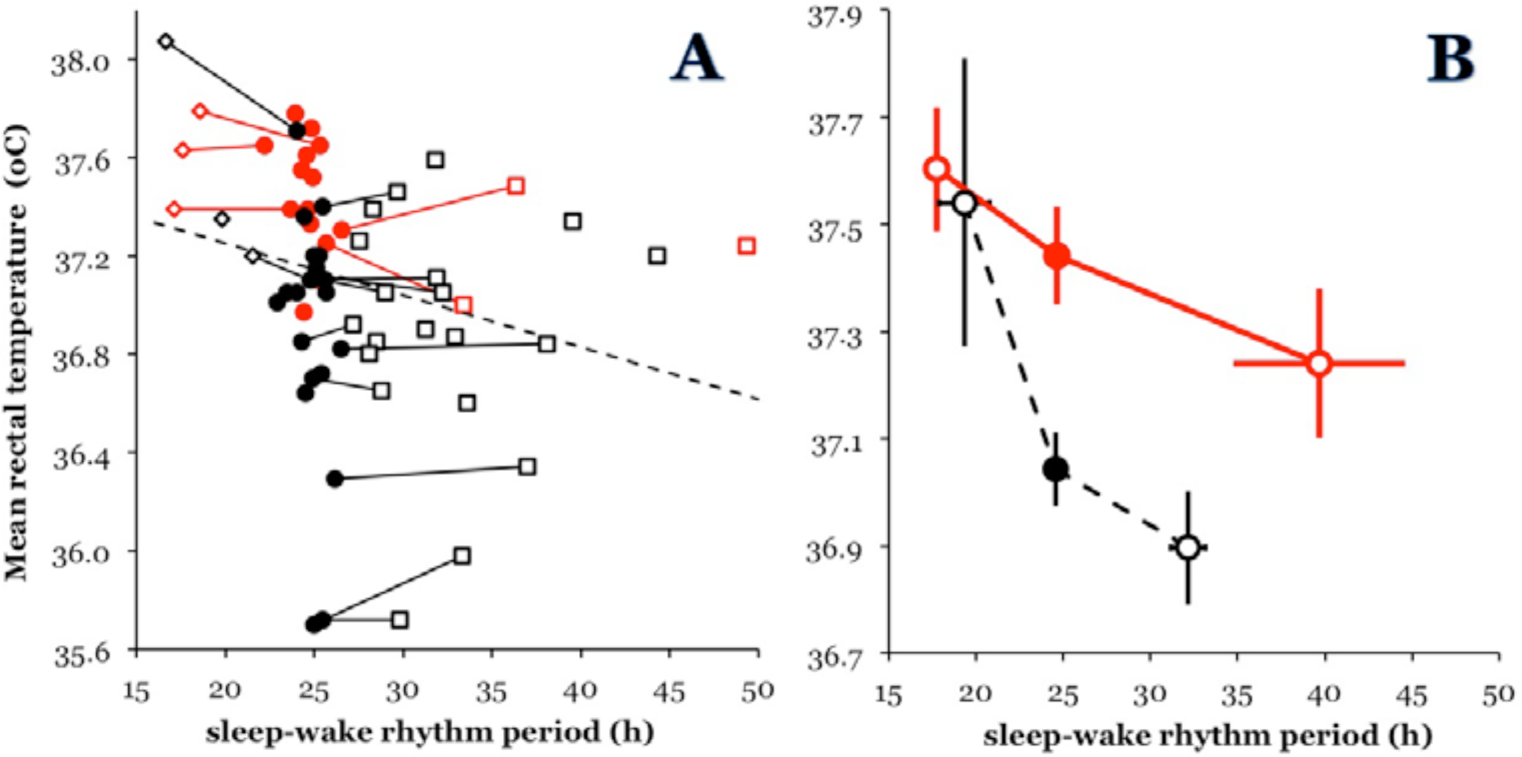
Relationship between τSW (h) and the mean tb (°C). The data are taken from 48 individual subject records in the bunker archive from the Max Planck Institut für Verhaltensphysiologie, Abteilung Aschoff. (A) Individual data points. Solid symbols = IS; open symbols = ID. Black = males; red (or shaded) = females. Lines connect 2 points of the same individual when both an IS section and an ID section were present. (B) Mean values per sex and IS status. Each individual contributes 1 value; if sections with IS and ID are present within an individual, the ID section is chosen. Error bars are ±1 SEM.
In 17 subjects, there were 2 sections in the record: 1 with IS and 1 with ID. These allow us to test whether the mean tb also changes systematically within individuals with τSW when the τSW lengthens or shortens in ID. Figure 3 shows the mean tb values for 5 individuals who had both IS and short ID sections and for 12 individuals who had both IS and long ID sections. The figure shows that there is neither a systematic increase in individual tb with short ID nor a systematic decrease in long ID, as was suggested by Figure 1. Intraindividual differences between the mean tb recorded in IS and ID (groups 1 and 3) were tested and found to be not significant by a paired t test: t = 1.418 (n = 17; p = 0.175).
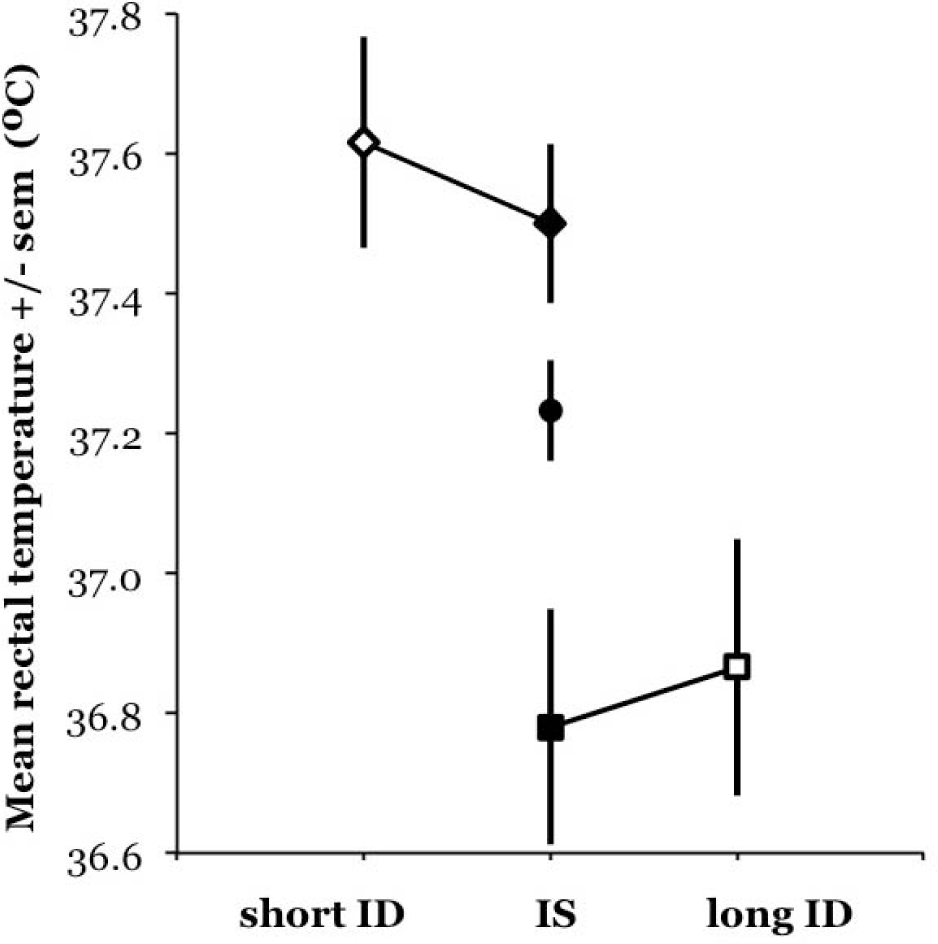
Mean ± SEM values for tb for 3 subgroups of subjects. Group 1 (diamonds): subjects who had IS during 1 section of the record and short ID during another section (3 females, 2 males). Group 2 (circles): subjects with only IS (8 females, 11 males). Group 3 (squares): subjects with IS and long ID (2 females, 10 males). Solid symbols = IS; open symbols = ID.
Apparently, the differences in core temperature between subjects displaying short or long ID are already present during the state of IS that usually precedes ID. During IS (Fig. 3, solid symbols), the negative association of tb with group (1 = subject also has a short ID section; 2 = only IS; 3 = subject also has a long ID section) is indeed highly significant: Pearson r = −0.529 (p = 0.001; n = 36) and Spearman ρ = −0.488 (p = 0.003; n = 36).
The association between tb and τSW in these 36 individual subjects during IS is analyzed in Figure 4. There is again a negative relationship between core temperature and the period of the sleep-wake cycle in the IS situation alone, both in females and in males. The correlation between τSW and tb during IS, although indicated in both sexes, is not significantly different from zero: Pearson r = −0.307 (p = 0.068, not significant) and Spearman ρ = −0.263 (p = 0.121, not significant). This holds also for the partial correlation after controlling for sex: r = −0.278 (p = 0.106, not significant). Only with 1-tailed criteria, defendable on the basis of the theoretical prediction, the overall Pearson r = −0.307 is interpreted as p = 0.034. We consider the significance of the association nonetheless marginal.
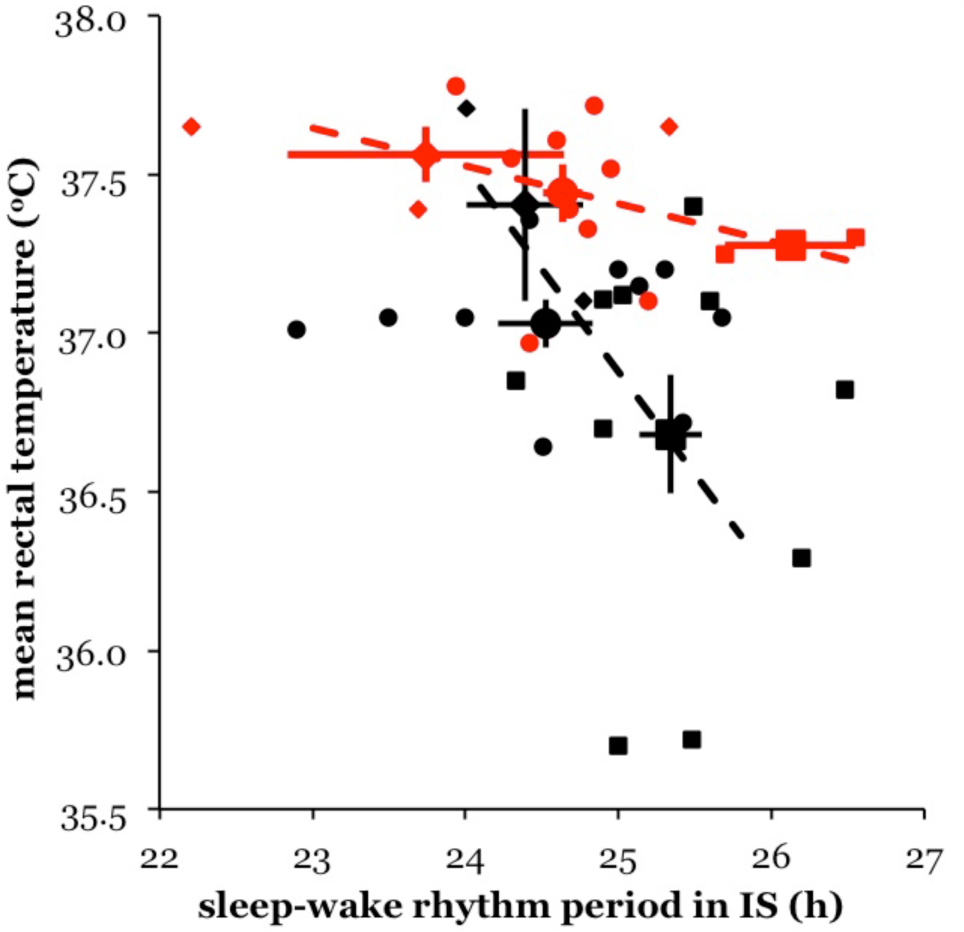
Relationship between τSW (abscissa) and tb (ordinate) among 36 subjects during IS. Red (or shaded) = females; black = males. Closed symbols = individuals; large symbols = mean τSW and mean tb (both with SEM) for 3 groups per sex. Group 1: subjects who showed short ID in a different section of the record (diamonds). Group 2: subjects without ID (circles). Group 3: subjects who showed long ID in a different section of the record (squares). Dashed lines = regression through the means in females (red or shaded) and males (black) separately.
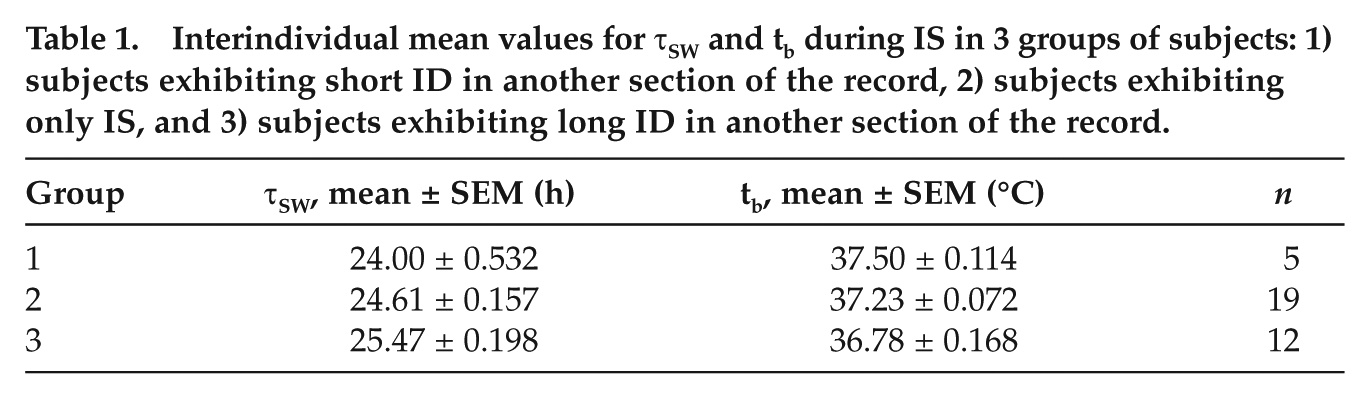
If we distinguish again between 3 groups of individuals as above, τSW during IS, like tb, also turns out to be associated with group: Pearson r = 0.566 (p = 0.000) and Spearman ρ = 0.559 (p = 0.000). The mean values and SEMs for both tb and τSW are shown in Table 1.
Interindividual mean values for τSW and tb during IS in 3 groups of subjects: 1) subjects exhibiting short ID in another section of the record, 2) subjects exhibiting only IS, and 3) subjects exhibiting long ID in another section of the record.
The data thus show that the subjects developing ID did already behave differently during IS. Both mean temperature and circadian period during IS, although only marginally correlated with each other in this set, are reliable predictors of the probability of desynchronizing by shortening (hot individuals) or lengthening (cool individuals).
Discussion
The data of Aschoff and Wever evaluated here with respect to one particular aspect unequivocally demonstrate a remarkable association. Human subjects with a relatively high mean core body temperature have a tendency to develop short ID, and those with a low core temperature often develop long ID. One might presume that the core temperature is partly a consequence of ID because ID affects the overall proportion of time spent in wakefulness and since wakefulness is associated with a higher core temperature than sleep. This is problematic since long ID is associated with an increase in the proportion of wakefulness (Aschoff et al., 1984; Wirz-Justice et al., 1984) and short ID with a decrease (Aschoff, 1992). Long ID would thus be expected to be characterized by a higher tb, and short ID by a lower tb, whereas the opposite is true. More specific speculations concern the calorigenic effect of food, which should be higher in short ID with a higher meal frequency and less frequent heat-generating postural changes in long ID (Wever, 1979). However, all of these explanations fail because the analysis in Figure 3 shows that individuals do not change their tb when going from the IS state to the ID state. Rather, the pattern is generated by differentiation between individuals with a different mean core temperature. In the state of IS, warmer subjects tend to have slightly shorter circadian periods, and they also more often enter the state of short ID. Cooler subjects tend to have slightly longer circadian periods in IS and are more prone to enter the state of long ID (Table 1).
The tendency towards long and short ID in subjects with a long and short τSW during IS, respectively, has been described in detail by Wever (1975, 1979 [Fig. 29]). Wever (1979 [Fig. 29]) found that IS subjects who later showed long ID had a mean τSW (and also τtemp) of 25.55 h and those who later showed short ID had a period of 24.47 h. He explained this significant distinction by a difference in the endogenous period in a sleep-wake oscillator between the 2 subject groups. In people with a slow sleep-wake oscillator, the temperature oscillator period was lengthened in IS, and in those with a fast sleep-wake oscillator, it was slowed down. This explanation is internally consistent with all of Wever’s data and also with our finding that the patterns are generated by differences between individuals rather than attributable to effects of desynchronization. Wever’s (1979) model is of an abstract mathematical nature and does not specify how individuals may physiologically vary to generate different directions of ID.
The pattern is partly related to sex differentiation. Sex differences in circadian periods have been established before. Females have shorter free-running rhythms in IS than males (Wever, 1984). They also show slightly (6 min) shorter temperature/melatonin rhythms under forced desynchrony protocols (Duffy et al., 2011). Female subjects in our analysis had a significantly higher mean tb (37.42 °C; n = 15) than males (36.90 °C; n = 21) (t = 3.720; p = 0.001). This is in agreement with some other studies under different conditions (Bittel and Henane, 1975; Cunningham et al., 1978; Schellen et al., 2012). A core temperature difference is not found when men are compared with women in the preovulatory phase under thermoneutral conditions (Gagnon and Kenny, 2011). In the postovulatory phase (Bittel and Henane, 1975), and following exercise (Kenny and Jay, 2007; Gagnon and Kenny, 2011), the female mean core temperature is elevated above that of men. The differences in thermoregulation are probably due to lower basal metabolism, more effective insulation, and thermogenic effects of progesterone (Ogawa, 1996). The increased tendency for females to enter short ID and for males to enter long ID has been reported before (Wirz-Justice et al., 1984). The overall relationship of the tendency towards ID with temperature cannot solely be attributed to this gender difference since the association also holds for each of the sexes (Fig. 4).
The core temperature is determined by the balance between heat production and heat loss. The association of a tendency towards ID with high and low core temperatures might be hypothetically attributed to either heat production or heat loss or to both. The association with heat production, that is, energy metabolism, is what Aschoff proposed in several publications (Aschoff et al., 1986; Aschoff, 1990, 1993). His arguments were based on systematic differences in the food intake rate (meals per hour), confirmed in terms of calories per hour by Green et al. (1987b), and also in locomotor activity per hour as, between individuals, τSW became much longer or much shorter than 24 h. Indeed, Aschoff (1990, 1993) suggested that the activity per cycle remained constant over a wide range of cycle lengths.
The extent of the difference in core body temperature involved in the huge differences between τSW values in ID (by a factor of 2-3 when comparing short and long ID) may seem small. The coefficient of τSW is only –0.019 °C/h, corresponding to a variation of only about 0.5 °C over the τSW range of 16 to 48 h. This, however, is not incompatible with considerable changes in the metabolic rate. Studies on seasonal adaptation in other large mammals such as the Alpine ibex and red deer have recently shown that large (>50%) changes in overall metabolism are strongly positively correlated with core temperatures varying over less than 1 °C (Signer et al., 2011; Turbill et al., 2011). This result points to temperature variability that is indeed induced by the variation in metabolism but buffered by changes in thermal conductance. Similarly, in humans, the circadian variation in heat production has been estimated as 324 kcal/d or 324/1915 = 17% for a tb range of only 0.44 °C (Kräuchi and Wirz-Justice, 1994). Recent studies have shown strong interindividual correlations in mean human tympanic (r = 0.82) and rectal (r = 0.83) temperatures with the overall daily energy expenditure (Van Marken Lichtenbelt et al., 2001, 2002).
Curiously, the hypothesis of metabolic determination of τSW is consistent with data on tau mutant hamsters: Oklejewicz et al. (1997, 2000) measured heat production by indirect calorimetry in homozygote, heterozygote, and wild-type Syrian hamsters in free-running conditions. They found that basal metabolism and the circadian cycle length are inversely proportional. Although their results may be related to associated variations in body mass (Refinetti, 2007), it is possible that the overall metabolic rate may affect the velocity of an oscillation that is controlling the alternation of sleep and wakefulness. The latter may be a behavioral relaxation oscillator in which wakefulness leads to sleep and sleep leads to wakefulness, such as the homeostatic sleep drive Process S in the 2-process model of sleep regulation (Borbély, 1982; Daan et al., 1984). It may also be a more or less localized internal oscillator (Nakao et al., 2002), possibly in the brain, such as the oscillator involving the orexin neuronal system postulated by Phillips et al. (2011). In the first case, lower metabolism might cause a slower rate of Process S buildup and hence a longer τSW, tending towards long ID; in the second, it may lead to increased orexin tone with the same consequences. The present analyses do not allow further speculations on the mechanism.
While such roles for energy metabolism are speculative, the suggestion ties in with a stream of recent literature pointing to a role of the circadian system in energy metabolism (Bass and Takahashi, 2010; Froy, 2011; Albrecht, 2012; Stubblefield et al., 2012). This also entails links between circadian anomalies and human health problems that are related to energy metabolism (Rüger and Scheer, 2009; Maury et al., 2010; Wyse et al., 2011; Reiter et al., 2012; Roenneberg et al., 2012). Despite intense recent research efforts, there is, however, not a consistent effect of sleep on energy metabolism across many recent studies (Klingenberg et al., 2012).
An alternative suggestion might be that the core temperature itself rather than heat production would be instrumental in determining the period of the circadian sleep-wake cycle. This is most unlikely. The linear regression through our complete dataset is τSW = 140.10 – 3.044 * tb (p = 0.041; n = 65) (Fig. 2A). For temperatures around 37 °C, this would translate to a Q10 of 3.5. This is high for biochemical processes in general and extremely high for circadian oscillations that are generally buffered against temperature variation. If the sleep-wake cycle were so sensitive to core temperature, it would easily be entrained by and thus retain synchrony with the daily cycle of temperature.
Therefore, Aschoff’s (1993) hypothesis that not the core temperature per se but rather the metabolic rate has such a dramatic influence on the sleep-wake cycle seems preferable. If so, the metabolic rate would apparently leave the circadian pacemaker in the SCN unaffected, just as it is resistant against temperature changes (Buhr et al., 2010), so that body temperature oscillations remain in the circadian range, while τSW varies from about one half to twice the circadian τ. The old data that we have evaluated here were not collected with the aim to test such hypotheses and can at best help generate them. The data also have their limitations that are related to the time at which they were collected. There was initially no high-resolution digital data collection, and what is left is only the paper records. There was no recording of sleep electroencephalograms, so we have only self-reported sleep data. The protocols allowed subject control over illumination: initially over ceiling light and later still over bed reading lights. Even if such self-control can never constitute a zeitgeber, this is not how the experiments would be conducted today. Yet, the long series of experiments performed in the “bunker” in Andechs has yielded a wealth of pioneer insights into the human circadian system and can hardly be redone according to modern standards. We hope this reanalysis may serve as a stimulus towards a new look at the intriguing phenomenon of ID in the new light of the interconnections between the metabolic rate and circadian organization.
Footnotes
Acknowledgements
S.D. is deeply grateful to the Heiwa Nakajima Foundation for a guest professorship, hosted by K.H. and S.H. in Sapporo (2010), where this study was conceived. The authors gratefully acknowledge the efforts of Gayline Manalang in digitizing a large part of the temperature data and Eduardo Mendoza for helping to organize this. In addition, S.D. acknowledges the help of Drs. Anna Wirz-Justice, Reimer Lund, Jürgen Zulley, and Barabara Helm in securing the bunker archive and transferring this on loan to Drs. Till Roenneberg and Martha Merrow to host the archive at the Institute for Medical Psychology of Munich University.
This article is dedicated to the memory of Jürgen Aschoff and Rütger Wever, pioneers of human circadian rhythms research, on whose data the work is based.
Conflict of Interest Statement
The author(s) declared no potential conflicts of interest with respect to the research, authorship, and/or publication of this article.
Notes
References
Supplementary Material
Please find the following supplemental material available below.
For Open Access articles published under a Creative Commons License, all supplemental material carries the same license as the article it is associated with.
For non-Open Access articles published, all supplemental material carries a non-exclusive license, and permission requests for re-use of supplemental material or any part of supplemental material shall be sent directly to the copyright owner as specified in the copyright notice associated with the article.