
Abstract
Amplitude modulation in limit cycle models of circadian clocks has been previously formulated to explain the phenomenon of temperature compensation. These models propose that invariance of clock period (τ) with changing temperature is a result of the system traversing small or large limit cycles such that despite a decrease or an increase in the linear velocity of the clock owing to slowing down or speeding up of the underlying biochemical reactions, respectively, the angular velocity and, thus, the clock period remain constant. In addition, these models predict that phase resetting behavior of circadian clocks described by limit cycles of different amplitudes at low or high temperatures will be drastically different. More specifically, this class of models predicts that at low temperatures, circadian clocks will respond to perturbations by eliciting larger phase shifts by virtue of their smaller amplitude and vice versa. Here, we present the results of our tests of this prediction: We examined the nature of photic phase response curves (PRCs) and phase transition curves (PTCs) for the circadian clocks of 4 wild-type fruit fly Drosophila melanogaster populations at 3 different ambient temperatures (18, 25, and 29 °C). Interestingly, we observed that at the low temperature of 18 °C, fly clocks respond to light perturbations more strongly, eliciting strong (type 0) PRCs and PTCs, while at moderate (25 °C) and high (29 °C) temperatures the same stimuli evoke weak (type 1) responses. This pattern of strong and weak phase resetting at low and high temperatures, respectively, renders support for the limit cycle amplitude modulation model for temperature compensation of circadian clocks.
Circadian rhythms can be entrained to environmental cycles by shifting their phase in response to time cues. Such phase shifts are typically represented in the form of phase response curves (PRCs—a plot of phase shifts as a function of the phase of perturbation; Pittendrigh and Minis, 1964). PRCs usually comprise a delay portion for delaying the phase of rhythms whose free-running periods (τ) are shorter than the external cycles and therefore are exposed to light during the early subjective night. The advance portion of the PRC is used for resetting rhythms with τ longer than the external cycles, which experience light during the late subjective night. The part of the PRC, which is relatively insensitive to light and covers most of the subjective daytime, is referred to as the dead zone (Pittendrigh and Daan, 1976a). Apart from minor differences in the extent of the dead zone and advance and delay zones, PRCs are qualitatively similar across a wide range of organisms and rhythms (Pittendrigh and Daan, 1976a; Johnson, 1990). Based on the magnitude of phase shifts, PRCs have been categorized as weak or type 1, with relatively small phase shifts and continuous transition between delays and advances, and strong or type 0, characterized by large phase shifts with abrupt transition between delays and advances (Winfree, 1980). The sharp transition between delays and advances is indicative of the inaccessibility of certain new phases in the strong phase resetting scenario, while all new phases are covered when the magnitude of phase resetting is small. Increasing the strength of the stimulus is believed to lead to a transition of PRCs from weak to strong type (Winfree, 1980). Strong type PRCs are indicative of a greater range of entrainment and of rapid re-entrainment to phase shifted environmental cycles (Johnson, 1992). Since phase shifts determine the maintenance of a stable phase relationship with external cycles, the shape of PRC also has distinct consequences for the stability of entrainment (Pittendrigh and Daan, 1976b). Furthermore, it is predicted that a decrease in the amplitude of the limit cycles describing circadian rhythms will result in strong type phase resetting responses (Lakin-Thomas et al., 1991). Therefore, strength of phase resetting and, correspondingly, the nature of PRCs (type 0 or type 1) can be used as an indicator of the amplitude of the limit cycle describing circadian rhythms.
The τ of circadian rhythms, although subject to variation among individuals within a species-specific range, remains largely unaltered under a range of physiologically tolerable temperatures (Pittendrigh, 1954). This is particularly surprising considering that mechanisms underlying such rhythms are composed of biochemical reactions which themselves are subject to changes in reaction rates with increase or decrease in temperature. This ability of circadian clocks to prevent proportionate change in τ with changes in temperature is referred to as temperature compensation (Bruce and Pittendrigh, 1956; Hastings and Sweeney, 1957).
Although molecular feedback loops are able to explain, to a large extent, the self-sustainment and phase resetting of circadian pacemakers (Aronson et al., 1994; Hardin et al., 1990; Zeng et al., 1996; Hunter-Ensor et al., 1996), molecular and physiological correlates of temperature compensation are still lacking. Early mathematical models describing circadian timing systems attempted to provide some explanation for the possible mechanisms of temperature compensation (Zimmerman et al., 1968; Pavlidis et al., 1968).
Temperature compensation of circadian clocks is compromised in certain strains of Neurospora that carry mutations on the frequency (frq) gene (frq-3, frq-7, frq-8, and frq-9; Gardner and Feldman, 1981; Loros and Feldman, 1986). Based on the evidence from these frq mutants, suggesting a correlation between τ and the extent of phase shift in circadian rhythms, and corresponding defects in their temperature compensation, a limit cycle amplitude modulation model for circadian timing systems was formulated (Lakin-Thomas et al., 1991). The authors proposed that alteration in a single parameter of the oscillator (amplitude) can account for the effects of temperature on the τ and the extent of phase shift in circadian rhythms. They used a time-delay oscillator model consisting of a feedback loop comprising an activator that controls the breakdown of a biochemical intermediate, which in turn determines the rate at which the activator is produced. Assuming that mutations at the frq locus modify the extent of time delay, changes in τ can be attributed to an amplitude of FRQ oscillation that was greater at high temperatures, which was indeed found to be comparable to experimentally obtained FRQ levels (Liu et al., 1998). A study by Ruoff and coworkers (2005) demonstrated that frq mutants that show greater stability of FRQ protein also have longer τ and enhanced sensitivity of τ to temperature, which is consistent with the predictions from a modified version of the Goodwin oscillator model (Ruoff and Rensing, 1996). The change in amplitude of the limit cycle as a result of differences in the rate of FRQ degradation could also contribute to the differences in the extent of phase resetting by light in frq mutants (Ruoff et al., 1999). While this prediction has not been corroborated by empirical evidence in model organisms other than Neurospora, the authors speculated that absence of evidence for differential phase resetting at low and high temperatures, reported in a few contemporary studies, may be due to saturating intensity of stimuli used (e.g., 4-h blue light pulses of ~6700-lux intensity on Gonyaulax bioluminescence rhythm; Johnson and Hastings, 1989).
In the present study, we have examined phase resetting of the activity-rest rhythm in fruit flies Drosophila melanogaster to light stimuli at low (18 °C), moderate (25 °C), and high (29 °C) temperatures, to test the predictions from a limit cycle amplitude modulation model for temperature compensation of circadian rhythms, similar to the one described previously (Lakin-Thomas et al., 1991). We expected that even in wild-type fruit flies D. melanogaster, phase resetting due to a given stimulus would be large at low temperatures and small at high temperatures. We performed experiments to obtain PRCs and phase transition curves (PTCs) due to brief light stimuli at ambient temperatures of 18, 25, and 29 °C. The results, based on 4 genetically independent, large outbred wild-type populations of fruit flies D. melanogaster, revealed a strong (type 0) phase resetting in the circadian activity-rest rhythm at low (18 °C) temperature and weak (type 1) resetting at moderate (25 °C) and high (29 °C) temperatures.
Materials and Methods
Fly Population Maintenance
Four populations of fruit flies D. melanogaster were maintained for several generations under 12:12-h light-dark (LD) cycles at 25 °C on banana-jaggery food medium (Sheeba et al., 1998). A total of 1200 breeding adults per population, with roughly equal number of males and females, were reared as large outbred populations in Plexiglas cages with banana-jaggery medium as food source. After 6 days, yeast acetic acid paste was applied on a food plate and provided as food source. Three days later, eggs were collected and dispensed into vials (18-cm height × 2.4-cm diameter) at a density of about 300 eggs containing 10 mL of food and reared under 12:12-h LD (100-lux) at 25 °C. Flies emerging between 9 and 12 days after egg collection were collected into Plexiglas cages containing a petri dish of banana-jaggery medium. All the 4 populations were maintained on a 21-day discrete generation cycle.
Recording of Activity-Rest Rhythm and Administration of Light Pulses
We constructed PRCs and PTCs by exposing fruit flies from all the 4 replicate populations to light stimuli at various circadian phases at ambient temperatures of 18, 25, and 29 °C. We recorded locomotor activity of flies using the Drosophila Activity Monitor (DAM) system (TriKinetics Inc., Waltham, MA, USA). Freshly emerging virgin males were separated and introduced individually into glass activity tubes. These tubes were placed in the DAM monitor, which records interceptions of an infrared beam passing through the center of the tube as locomotion of the fruit fly.
All flies were maintained under 12:12-h LD cycles (using a cool white light source of intensity ~50-lux) at the respective temperatures for 6 days prior to the administration of light pulses. Flies were given food change on the fifth day of being in LD cycles. After the initial LD exposure, we introduced flies into continuous darkness (DD) at ZT12 (zeitgeber time 12 is the time of lights-off under 12:12-h LD cycles) on the sixth day of LD and exposed separate batches of individuals to a light pulse of 1-h duration and ~2500-lux intensity, every 2-h from CT0 to CT22 (also, CT17 and CT19 at 18 °C) on the first cycle of DD, the type 2 PRC protocol (Aschoff, 1965). Each batch of experimental flies was exposed to light pulse only once in its lifetime and had its own batch of disturbance controls to which no light pulse was administered. After the administration of light pulse, we continued to record the activity of flies under DD for the next 8 to 10 days.
To calculate the Q10 values to show temperature compensation, the average period of the flies that served as disturbance controls to the subjective day pulsed flies (or all controls from 29 °C) were compared across 18, 25, and 29 °C. The ratios of these values were raised to the power of 10 divided by the difference in the temperatures to obtain the Q10 values.
To obtain phase shifts at each time point, we used 3 activity monitors (each monitor had 32 flies) for light pulse exposure and 2 for controls. The monitors in the experimental group were removed from the incubator under DD and transferred to another incubator, placed inside the same chronocubicle, and maintained at the same temperature at appropriate phases, and light pulses of 2500-lux were administered for 1 h. Dim red light of λ > 650-nm was used to identify and move the monitors for light pulse exposure at a given time point. The control flies, in contrast, were taken out and placed within the same incubator, under dim red light, only in a manner similar to the experimental flies so that the only effective difference of treatment between experimental and controls flies would be the light pulse. A total of about 70 flies (out of an initial 96 derived equally from 4 populations) were used to obtain phase shift data for each time point of the PRCs at 18 °C and 25 °C, and about 30 flies each were used for the PRC at 29 °C due to greater mortality at this temperature. Overall, 1024 flies were used to calculate phase shifts over 14 time points at 18 °C, 784 flies across 12 time points at 25 °C, and 136 flies over 4 time points at 29 °C.
Estimation of Phase Shifts and Construction of PRCs and PTCs
Avoiding 3 to 4 days of transients post light pulse exposure, we visually estimated offsets for the free-running activity rhythm and drew a regression line extrapolating back to the day of the light pulse. The extrapolated phases on the day of the pulse were thus obtained for the experimental and control flies. At each time point, the phases of each individual fly from the experimental group were subtracted from the average phase of the controls, and this value was taken to be the net phase shift due to the light pulse exposure for that fly. At a few time points where there were large phase shifts that caused ambiguity in determining whether they were advances or delays, the net phase shift values of individual flies exceeding 12-h in any direction were converted into shifts within 12-h in the opposite direction by adding or subtracting 24-h and were classified distinctly as advances or delays. All phase shift values used for the analysis have been categorized as advances or delays only after the calibration with the phase shift in the control flies. The PTCs were constructed by plotting the average postperturbed steady-state phases as a function of preperturbed phases. The regression line of the PTC at 18 °C was calculated by subtracting 24-h from the postperturbed phases after the transition to illustrate the slope of the curve. The phase shifts in the disturbance controls were calculated by subtracting the free-running phase from the phase of entrainment on the day of treatment.
Statistical Analyses of the Phase Shift Data
Two-way ANOVA on the phase shift data was performed considering ambient temperature and phase of perturbation as fixed factors and replicate population as random factor. ANOVA was followed by post hoc multiple comparisons using the Tukey HSD test. Error bars are standard error of mean of the average phase shifts of the 4 replicate populations at each time point. Regression analyses and goodness of fit were performed on the PTCs to test similarity of the curves to a line of slope 1 (for type 1 PRCs or PTCs) or of 0 (for type 0 PRCs or PTCs). All statistical analyses were implemented on Statistica for Windows Release 5.0 B (StatSoft 1995, Tulsa, OK, USA).
Results
Strong (Type 0) Phase Resetting in the Activity-Rest Rhythm of Wild-Type Fruit Flies D. Melanogaster at Low (18 ° C) Temperature
The circadian clock underlying the activity-rest rhythm of flies was temperature compensated with Q10 values of 1.033, 1.028, and 1.031, when the τ values under different ambient temperatures were compared between 18 and 25 °C, 25 and 29 °C, or 18 and 29 °C, respectively. Phase shifts in the activity-rest rhythm of fruit flies D. melanogaster during the subjective night at 18 °C were clearly larger than at 25 and 29 °C (Fig. 1). ANOVA on the phase shift data of 18 °C and 25 °C revealed a statistically significant effect of phase (P) (F11,72 = 68.52, p < 0.001), temperature (T) (F1,72 = 20.17, p < 0.001), and T × P interaction (F11,72 = 8.26, p < 0.001; Fig. 1). At 18 °C, the phase delays at CT18 and CT19 were significantly greater than those at all other time points except CT14 and CT16, whereas the phase advances at CT18 and CT19 were significantly different from those at all other time points including the late subjective night (CT20 and CT22; Figs. 1-3). Phase shifts at time points during the subjective day were small and did not differ from each other, although this excludes CT12 at 18 °C, which happens to be a part of the dead zone in the 25 °C PRC (Figs. 1 and 2, Suppl. Fig. S1, available online). The features of the PRC at all 3 temperatures were consistent across 4 genetically independent large outbred replicate wild-type populations of D. melanogaster (Suppl. Fig. S2), which reduces the possibility of the results being those of an isolated group of flies showing unusual trends owing to random genetic drift and implies larger validity of our results.
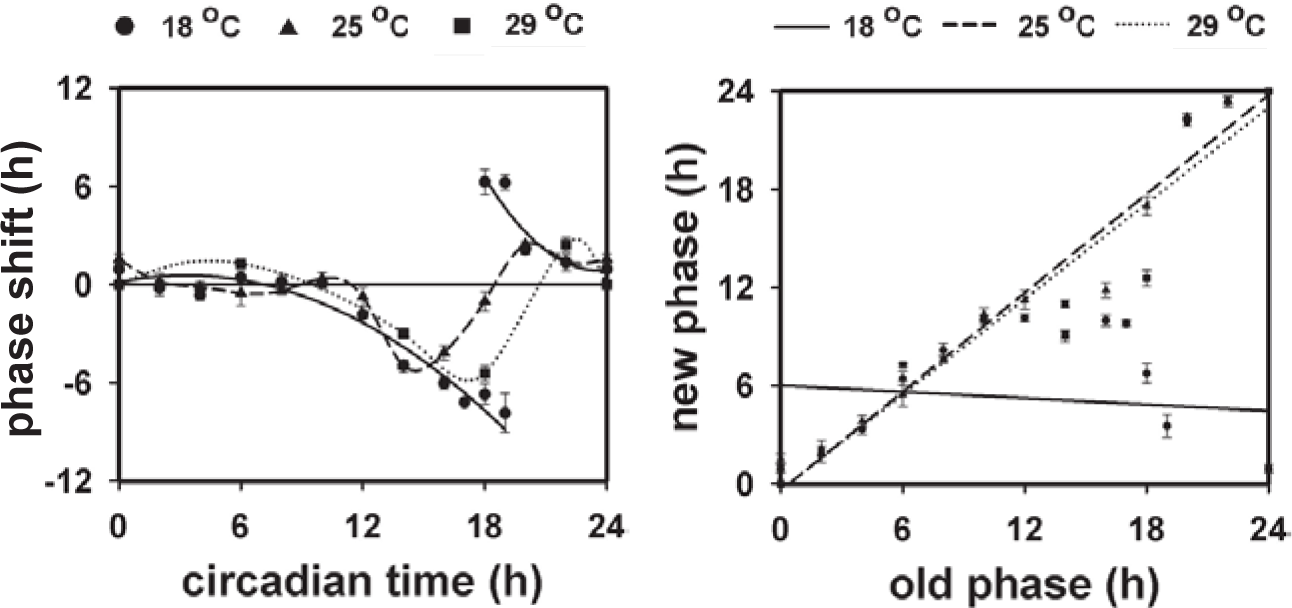
Phase response curves (PRCs) and phase transition curves (PTCs) at low (18 °C), moderate (25 °C), and high (29 °C) temperatures. (Left panel) PRCs at 18, 25, and 29 °C. The PRC at 18 °C shows a discontinuous transition from advance to delay portion with CT18 and CT19 showing both delay and advance phase shifts. (Right panel) PTCs at 18, 25, and 29 °C. PTC at 18 °C shows a better fit to a line of slope 0 (mean square error = 17.26, mean absolute error = 3.66, mean relative squared error = 0.47, mean relative absolute error = 0.61) than to a line of slope 1 (mean square error = 143.23, mean absolute error = 8.26, mean relative squared error = 0.33, mean relative absolute error = 0.44, correlation coefficient = −0.27). PTC at 25 °C shows a closer fit to a line of slope 1 (mean square error = 4.53, mean absolute error = 1.48, mean relative squared error = 0.02, mean relative absolute error = 0.10, correlation coefficient = 0.96) than to that of slope 0 (mean square error = 99.08, mean absolute error = 7.58, mean relative squared error = 2.75, mean relative absolute error = 1.26). PTC at 29 °C also shows a closer fit to a line of slope 1 (mean square error = 11.49, mean absolute error = 3.03, mean relative squared error = 0.04, mean relative absolute error = 0.20, correlation coefficient = 0.87) than to that of slope 0 (mean square error = 102.60, mean absolute error = 7.82, mean relative squared error = 2.85, mean relative absolute error = 1.30).
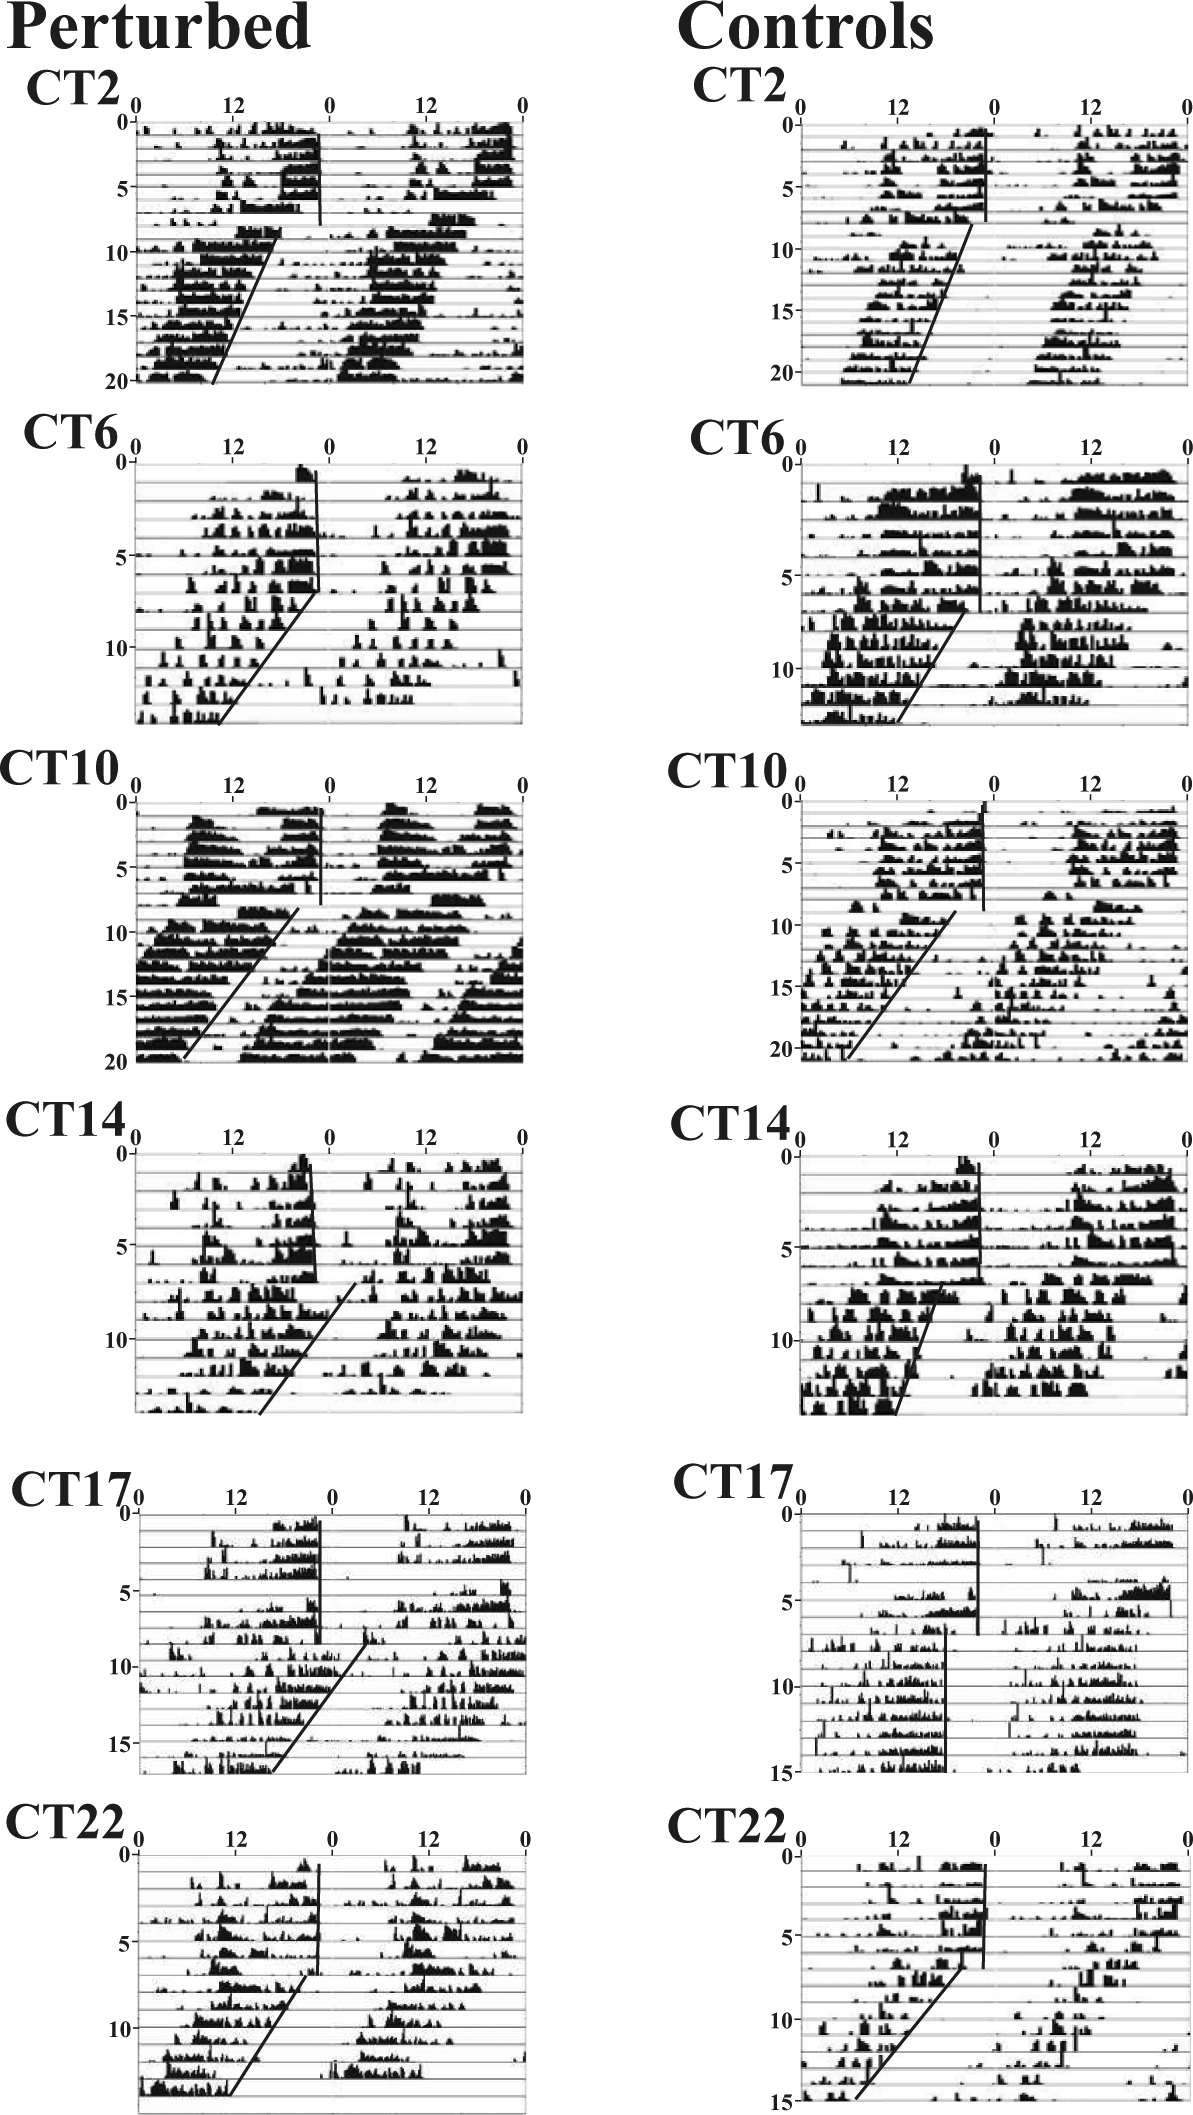
Actograms showing phase shifts of individual flies for CT2, 6, 10, 14, 17, and 22 at 18 °C. The offsets before and after the day of the light pulse are indicated by regression lines. The panels on the left represent flies that were exposed to the light pulse, and the panels on the right represent those that served as handling controls. The x-axis is time of the day (double-plotted), and y-axis represents days. Negligible shifts are seen in the day, indicating the dead zone of the PRC. Delay shifts are seen at CT14 and CT17, whereas advances are seen at CT22. Disturbance controls show uniform advance shifts with respect to the entrained phase.
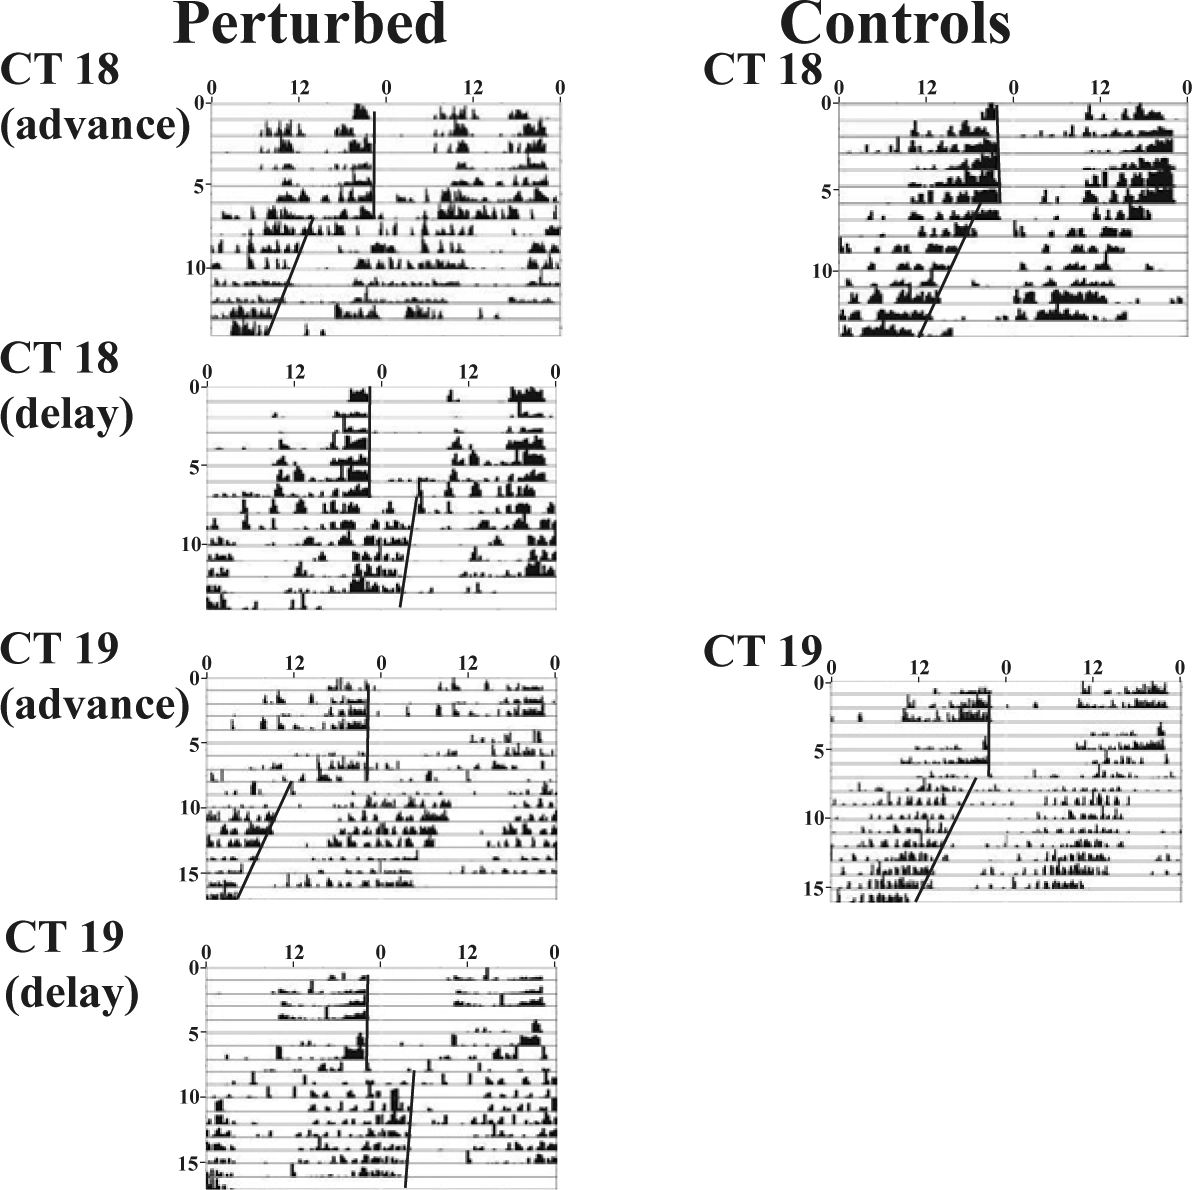
Actograms showing phase shifts of individual flies for CT18 and CT19 at 18 °C. At these time points, flies showed large phase shifts that could be classified as delays or advances not exceeding 12-h. Rest of the details same as Figure 2.
While comparing phase shifts at the same phase across 2 temperatures (18 and 25 °C), it was observed that only phase shifts at CT18 (both delays and advances at 18 °C compared with the delays at 25 °C) were significantly different between the 18 and 25 °C PRCs (p < 0.001; Figs. 1 and 3, Suppl. Fig. S3). While at 18 °C, large phase advances and delays were seen in response to light pulses at CT18; shifts at the same phase in the 25 °C PRCs were much smaller and not different from those encountered during the subjective day. Thus, transition between delay and advance zones in the PRCs was clearly different between the 2 temperatures. Additionally, while at 25 °C, phase shifts at CT12 (the start of the subjective night) were similar to those during the subjective day; there was a significant delay at this time point in the 18 °C PRC (Figs. 1 and 2, Suppl. Figs. S1, S3, and S4). Overall, both the amplitude and shape of the PRCs are dependent on the ambient temperature, with the 18 °C PRC showing greater amplitude as well as a larger advance zone compared with the 25 °C and 29 °C PRC (Fig. 1).
It was noted that at 18 °C, even the disturbance controls incurred advance phase shifts of 2 to 4 h (Fig. 2, Suppl. Fig. S5). However, these phase shifts did not depend on the phase of perturbation. Similarly, phase shifts due to disturbance during handling of flies at moderate and high temperatures were also not phase specific, although they were minimal and barely different from zero (Suppl. Fig. S5). This suggests that disturbances associated with the control treatments do not have a time-dependent effect on the circadian clocks although they evoke different phase shifts at different temperatures. Therefore, it would not be possible for flies to entrain to and maintain a stable phase relationship with such stimuli.
PTCs Illustrate Strong (Type 0) Phase Resetting at Low Temperature and Weak (Type 1) Phase Resetting at Moderate and Warm Temperatures
Due to the nature of large phase shifts being attributable equally to advances or delays, we plotted the PTCs at all the 3 temperatures (Fig. 1). Regression analysis on the PTCs at 25 °C revealed an estimate of beta regression parameter of 0.95 with a high value of R2 = 0.91 (p < 0.001), which suggests that it resembles a line of slope of 1. Similarly, the PTCs at 29 °C yielded a beta regression parameter of 0.87 with R2 = 0.75 (p > 0.05), a value which again resembles a line of slope 1. However, the beta regression parameter for PTCs at 18 °C was –0.10 with R2 = 0.01 (p > 0.05), which suggests that it does not have a slope of 1. A goodness-of-fit test (see Fig. 1 legend) for each of the PTCs with lines of slope 1 and 0 further confirmed that the PTCs at 25 or 29 °C resemble more closely a line of slope 1 than of slope 0, whereas the 18 °C PTCs were similar to a line of slope 0. These results show that light evokes a strong (type 0) response in the activity-rest rhythm of wild-type D. melanogaster at low temperature of 18 °C and weak (type 1) response at moderate (25 °C) and warm (29 °C) temperatures.
Discussion
Results from the present study demonstrate that in 4 replicate wild-type D. melanogaster populations, PRCs for circadian clocks underlying activity-rest rhythm switch from weak (type 1) to strong (type 0) type when the ambient temperature is lowered from 25 °C to 18 °C. Strong phase resetting was first described by Winfree (1980) for the adult emergence rhythm of D. pseudoobscura. He proposed that while weak light perturbations would cause weak (type 1) phase resetting, an increase in the strength of the stimuli would evoke strong (type 0) phase resetting. A study on cockroaches reported that the light pulse PRC switches from weak to strong type when the duration of a 240-µW/cm2 white light pulse used to construct the PRC was increased from 3-h to 12-h, yielding phase shifts of up to 12-h compared with 4-h of delays or advances when exposed to a 3-h light pulse (Saunders and Thomson, 1977). There has also been a report of strong type phase resetting in humans (Czeisler et al., 1989), although this interpretation has been challenged on account of the unusual protocol of using 3 light pulses on 3 consecutive days to achieve a large enough phase shift (Beersma and Daan, 1993).
PRC experiments on Drosophila were carried out in previous studies (Kistenpfennig et al., 2012; Saunders et al., 1994). Both studies were done at an ambient temperature of 20 °C, and the PRCs were very similar to those that we observed in our present study at 25 °C and to that reported previously by Dushay et al. (1990), which suggests that the temperature effect on light pulse PRC is not strong. Therefore, it is surprising to find that 18 °C is a critical temperature for eliciting a strong type PRC. Also, the light intensity for the pulse used appears unlikely to cause a strong-type PRC because higher light intensity does not cause stronger PRC beyond a saturation limit (Tang et al., 2010; Vinayak et al., 2013). However, it is possible that ambient temperature of 18 °C enhances the photic sensitivity of Drosophila locomotor activity clock whereas temperature of 20 °C or more does not. This is clearly more likely, keeping in mind the model of Lakin-Thomas et al. (1991), given that large amplitude phase shifts (equivalent to the type 0 PTCs) are seen only when the limit cycle becomes so small that the light pulse can push the oscillatory trajectory of the system beyond the point of singularity. This phenomenon is unlikely to be linear; there may be a critical temperature beyond which the limit cycle will become small enough, and at temperatures slightly higher than the critical limit, the same light pulse will no longer be able to push the system beyond the point of singularity. Our observations, based on large sample sizes, on 4 independent wild-type Drosophila populations seem to suggest a critical effect of low temperature (18 °C) and strength of the stimuli (2500-lux per 1-h) in evoking strong-type PRCs.
Our results corroborate the limit cycle amplitude modulation model for temperature compensation of circadian clocks with strong type PRCs and PTCs observed at the low temperature of 18 °C and weak-type PRCs and PTCs at moderate and high temperatures (Fig. 1), although it may be not be appropriate to conclude the nature of the PTCs for high (29 °C) temperature based on phase shift data from only 4 time points. This extends the validity of the model to wild-type D. melanogaster where until now such models have not been tested. Strong type phase resetting due to light stimuli has been reported in the short period double-time (dbts) and period (pers) mutants of D. melanogaster (Konopka, 1979; Bao et al., 2001), which we propose may also be due to change in the amplitude of the circadian oscillator rather than modulations in the light input pathways. The effects on PER stability due to these mutations and the corresponding effect on the period of the circadian clocks are in concordance with the view that such effects may be mediated via changes in the amplitude of the circadian oscillator. Indeed, this appears to be the case as demonstrated in a recent study by Li and Rosbash (2013), where faster degradation of the PERS protein was found to be responsible for strong-type phase resetting seen in the short period mutants. Strong type phase resetting with shorter dead zone and abrupt transitions seen in these mutants are also key features of the PRCs of wild-type flies at low temperature (Fig. 1).
In the absence of any direct evidence from biochemical substrates, the phenomenon of temperature compensation has relied largely upon mathematical models for explanation. A common thread of thought suggests the role of temperature dependence of relative abundance of isoforms or of dimers of protein products (Liu et al., 1997; Huang et al., 1995). The qualitative differences in these alternative protein products may alter the amplitude of the circadian rhythms at different temperatures. A study by Goldbeter (1995) that modeled the negative feedback loop of PER transcription, translation, and repression also found that the rate of PER degradation is a determinant of the period of the oscillator. Smith and Konopka (1982) also pointed to the role of per gene dosage, which was observed to bear an influence on the circadian clocks of Drosophila. Furthermore, the co-dominance of frq mutations with their wild-type allele in Neurospora led to the speculation that the frq locus regulates the levels of some gene product that affects the τ of the circadian oscillator (Feldman and Hoyle, 1975). Therefore, variations in the levels and/or activity of the clock gene products could affect the amplitude and period of the clock and also account for the observed differences in phase resetting behavior (Lakin-Thomas et al., 1991). Thus, change in a single parameter (amplitude) could, in principle, explain most of the observed circadian behaviors in the frq mutants.
The shift in the phase of free-running rhythm in the disturbance controls, particularly at low temperature, is another important finding of our study (Suppl. Fig. S1). A possible cause for such shifts may be the physical disturbance to which these flies are subject and/or exposure to dim red light used for their handling. However, since such physical disturbance and exposure brought about by the experimental protocol are expected to be the same across all temperatures, this is not a very likely explanation of the potential cause of the differential effect seen across temperatures. A more likely explanation for the observation is that the duration of activity of flies (or alpha) at lower temperature is different between the entrained and free-running states. This could lead to apparent phase shifts in the rhythm quite independent of the timing of the disturbance such as those observed in the present study. Therefore, the phase shifts displayed by the control flies (Suppl. Fig. S5) are unlikely to represent the real response of the circadian oscillator. To minimize the errors resulting from this problem, we have calculated the phase shifts as the difference between the phases of the free-running rhythms of the experimental and control flies, extrapolated back to the day of perturbation. It is nevertheless of interest to note that enhanced phase shifts in control flies are seen only under 18 °C. Furthermore, we speculate that shorter activity duration seen in postperturbation free-running rhythm at 18 °C may represent reduced amplitude of the limit cycle, which is only evident under DD in contrast to the similarity of entrained rhythms under the different temperatures in LD where such differences may be masked.
Another potential confounding factor in the estimation of phase shifts is the change in the period in response to light stimuli. This can result in the underestimation of phase shifts when the period change is in the same direction as the phase shift (i.e., advances accompanied by period shortening or vice versa). Although such changes are difficult to avoid considering the relatively long-term nature of after-effects, minimizing this error would only lead to further substantiation of our claims of larger phase shifts. It is also not possible to rule out the direct effect of temperature associated with high-intensity light pulse, even though the ambient temperature was maintained constant. Although such effects would confound the interpretations of the nature of PRCs and PTCs, it is nonetheless pertinent to note the modulation of phase resetting due to the ambient temperature.
It is evident from theoretical considerations that changes in the amplitude of a limit cycle oscillator at different temperatures can explain not only temperature compensation of clock period but also the observed differences in phase resetting response to perturbations of the same strength. However, in the absence of molecular correlates that determine such differences in amplitude of the state variables of the model, the interpretation of strong type phase resetting at low temperature as a consequence of amplitude changes is still tentative. Also, having discovered a strong type or type 0 resetting at 18 °C, it would be possible to identify the singularity at some intermediate temperature and/or different intensity or duration of light at the same temperature. This would be useful to clarify whether individual flies assume all possible phases, thus giving no clear average shift, or whether there is suppression of amplitude of the rhythm in the individual fly. Although attempts have been made to attribute singularity to either of the mechanisms of amplitude damping or desynchronization of individual oscillators at the cellular level, the results provide partial evidence for both phenomena (Pulivarthy et al., 2007; Huang et al., 2006).
Our study shows a strong (type 0) phase resetting in the activity-rest rhythm of wild-type D. melanogaster. We also find support for a generalized limit cycle amplitude modulation model to explain periodicity, temperature compensation, and phase resetting behavior in the circadian rhythms of wild-type populations of D. melanogaster. Importantly, we demonstrate the role of temperature in modulating the sensitivity of circadian clocks of fruit flies D. melanogaster to phase resetting by light stimuli.
Footnotes
Acknowledgements
The authors thank CSIR and UGC for financial assistance in the form of research fellowship to V.V. and N.N.K. They also thank 3 anonymous reviewers for carefully reading our manuscript and suggesting some very useful changes. This work was supported by funding from the Jawaharlal Nehru Center for Advanced Scientific Research, Bangalore, India, which also supported N.M. with a summer research fellowship.
Conflict of Interest Statement
The author(s) declared no potential conflicts of interest with respect to the research, authorship, and/or publication of this article.
Notes
References
Supplementary Material
Please find the following supplemental material available below.
For Open Access articles published under a Creative Commons License, all supplemental material carries the same license as the article it is associated with.
For non-Open Access articles published, all supplemental material carries a non-exclusive license, and permission requests for re-use of supplemental material or any part of supplemental material shall be sent directly to the copyright owner as specified in the copyright notice associated with the article.