
Abstract
Menegazzi P, Vanin S, Yoshii T, Rieger D, Hermann C, Dusik V, Kyriacou CP, Helfrich-Förster C, and Costa R (2013)
In the print version of the above article, the images and captions for Figures 2, 3, and 4 were mismatched. The correct figures and captions are shown here and in the final online version of the article, available at http://jbr.sagepub.com/content/28/1/3.full.pdf+html.

Total and nuclear staining in LNs (s-LNv, 5th s-LNv, l-LNv, and LNd) and DNs (DN1 and DN2). (A-C) PER and TIM total (nuclear plus cytoplasmic) staining in LN and DN clock neurons under different natural seasonal conditions. (D, E) Nuclear staining profiles in LN and DN clock neurons in August and September. Vertical dotted lines refer to nautical dusk (red: PER experiments; blue: TIM experiments), respectively. The yellow vertical line refers to nautical dawn (0). X-axis represents the time (hours) before (negative values) and after (positive values) nautical dawn.

Averaged peak time of PER and TIM (±SEM) in the different clock neurons pooled across seasons. The y-axis represents the time at which the mean peak antigenicity was recorded with reference to the nautical dawn (0). ANOVA showed that PER and TIM peak time depended on the group of clock neurons (PER: F5,638 = 8.63, p < 10−3; TIM: F6,890 = 7.41, p < 10−3), and post hoc analysis revealed that the dorsal neurons (DN1 and DN2) and for TIM also the lateral posterior neurons (LPN) peaked significantly earlier than the lateral neurons (s-LNv, 5th s-LNv, l-LNv) (asterisks).
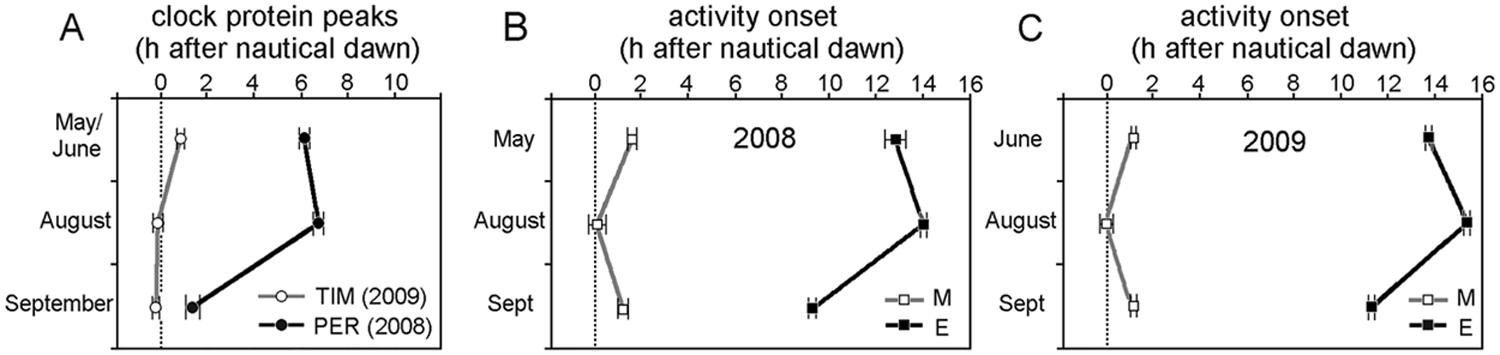
Peak phases of PER and TIM (A) and phases activity onset of M and E activity bouts (B, C) in different seasons referred to nautical dawn (0). TIM peak phases should only be compared with the phases of M and E onset in 2009 (C), whereas those of PER should to be compared with M and E onset in 2008 (B). The timing of E onset roughly parallels the timing of the PER peak.