
Abstract
Diet carbonated soft drinks (CSDs) were introduced to help consumers lower caloric intake. However, critics suggest that these drinks can provide an excuse to consume more calories, a so-called “Big Mac and Diet Coke” mentality that is consistent with behavioral theories such as moral licensing (e.g., combining a healthy eating choice with an indulgent, less healthy one). Using individual-level food and drink consumer panel data from a major fast-food restaurant chain, the authors empirically examine meals with a regular CSD versus a diet CSD. Results after controlling for drink size and demographics show that consumers generally do not order higher total calories from a meal with a diet CSD; rather, the authors find significant reductions in calorie count, suggesting that within a single meal, diet CSDs can help consumers unwilling to stop drinking CSDs to reduce calories. So, despite popular beliefs to the contrary, policy makers can consider diet CSD availability as a “calorie-reduction” strategy to lower calorie consumption within a meal.
The United States and many other countries are facing an “obesity crisis” in which the proportion of people who are obese has grown dramatically. For example, obesity in the United States rose from 12% in 1990–1991 (CDC Newsroom 1999) to 30.5% in 1999–2000 and to 42.4% in 2017–2018 among adults (Hales et al. 2020). Given the widespread knowledge that obesity poses serious health risks, researchers and policy makers are seeking the causes of weight gain and ways to reverse this trend. One major factor in weight gain is the frequent consumption of high-sugar, high-calorie drinks, including carbonated soft drinks (CSDs) (Vartanian, Schwartz, and Brownell 2007). As a result, policy makers have turned to actions such as limiting the size of drinks containing sugar or high-fructose corn syrup at, for example, fast-food restaurants and imposing a tax on those drinks. Typically, these bans and taxes (Zheng, Huang, and Ross 2019) exempt non-sugar-sweetened (NSS) low- or zero-calorie (commonly known as “diet”) soft drinks. While not a perfect replacement for regular soft drinks (sweetened with either sugar or high-fructose corn syrup), diet drinks provide a convenient lower-calorie substitute for people seeking a flavored carbonated beverage. This was the premise behind the first diet drink, No-Cal Ginger Ale, introduced in 1952, and continues to be the promotion platform to this day for diet brands. 1 According to this logic, diet CSDs can play a role in controlling calories within a meal and thus offer a practical “calorie-reduction” strategy to reduce the consumption of regular (sugary) soft drinks. While drinking water is the best replacement for a sugar-sweetened beverage (SSB) from a health perspective, our analyses indicate that water is infrequently chosen as a drink to accompany a meal when eating in restaurants.
Interestingly, even though NSS products have been on the market for nearly 70 years, research on efficacy and debates on regulatory policies are still ongoing. The claimed benefits of diet drinks are often challenged in news headlines (e.g., “Diet Drink Linked to Weight Gain” [Huffington Post, May 27, 2013], “Death by Diet Soda” [The New York Times, September 6, 2019]). One popular argument against diet drinks is that they harm consumers by encouraging overconsumption justified by a “Big Mac and Diet Coke” mentality, where a healthy or low-calorie choice in one part of a meal “licenses” or permits an unhealthy choice in another part of the meal. Psychological theories such as licensing (e.g., Khan and Dhar 2006) help explain such behaviors. As these behavioral theories focus on meals and other settings in which multiple items are consumed, it is necessary to study within-meal consumption to determine whether the lab studies that support these theories generalize to an important real-world setting, such as fast-food restaurants, where 85 million people (37% of U.S. adults) dine per day (Fryar et al. 2018). In other words, is diet drink choice linked to greater consumption in other parts of the meal, suggesting that there are no short-term benefits from choosing diet drinks? To date, to the best of our knowledge, there has been no field study examining this issue, and thus, it is unclear whether public health officials should attempt to target NSS beverages as aggressively as they target SSBs.
Given the need for answers on the impact of NSS drink choices within meals, we use large data sets and new econometric approaches to glean implications about consumer behavior in real-world settings. Our purpose is to inform the public policy debate about the effectiveness of diet drinks as part of a calorie-reduction strategy. Overall, perhaps surprisingly, we do not find support for the argument that consumers use diet drinks as an excuse or license to indulge. Rather, after controlling for drink size and consumer demographic characteristics, we find that the choice of a diet (vs. a regular) drink has a statistically significant negative effect on total calories ordered in a meal (food plus drink) when large-size (for both men and women) or medium-size (for women) CSDs are chosen. Moreover, with regard to food calories within a meal, we find no significant positive effects conditional on the choice of a diet drink.
From the public policy perspective, these results suggest that in the context of calorie consumption within a single meal, the availability of diet CSDs can be part of an effective “calorie-reduction” strategy. From this perspective, diet CSDs can be promoted as second-best alternative to regular CSDs, after water.
Literature Review
Because diet CSDs have fewer calories (in most cases, zero calories) than regular drinks, our literature review focuses on theories and empirical studies examining the impact of having a diet CSD—a meal item with a salient health claim—on calories within that meal.
Drink Choice and Calories Within a Day
We did not find any research that focused on the relationship between drink choice and calories within a meal in a field setting. However, several recent articles (e.g., An 2016; Bleich et al. 2014; Sylvetsky et al. 2019), using the same survey-based panel data (National Health and Nutrition Examination Survey), explore the relationship between low- and zero-calorie NSS-based drinks consumption and daily calorie intake. Bleich et al. (2014) compare adults having an SSB with those having an NSS beverage in a day. They find that, for healthy-weight individuals, average total daily calories are higher for those who have an SSB (2,351 calories) compared with those who have an NSS beverage (2,201 calories), but there is no difference for food calories. With regard to children (age 2–17 years), Sylvetsky et al. (2019) find no significant differences in energy intake for a day in which a low-calorie beverage versus an SSB is consumed. An (2016) examines adult consumers who reported their food and drink consumption over two days and thus controls for unobserved individual differences (i.e., confounds) using the first-difference estimation method, similar to the fixed-effects (FE) methods we use. An concludes that individuals consume more calories within a day when they drink SSBs than when they consume low- or zero-calorie drinks but suggests that future studies should examine within-meal consumption decisions.
Distinct from these three articles, our research compares caloric differences of a fast-food restaurant meal with a diet CSD and one with a regular CSD, enabling us to control for a wide range of confounds such as size of the drink, presence of others, meal occasion, and price difference between drink types. This allows us to better isolate the influence of diet drinks on calorie consumption and to provide better controls in the field setting to test the implications of the behavioral theories such as licensing. The narrower focus on within-meal consumption at a major restaurant chain provides us with a distinct opportunity to address a specific policy issue. Namely, our findings can inform calorie-reduction policies on the use of diet CSDs as an alternative to regular CSDs to decrease total calories within a meal.
Behavioral Theories of Consumption
Two well-known behavioral models aim to explain greater consumption in a meal with multiple items: (1) averaging calories across alternatives and (2) trading off between two conflicting goals such as pleasure and health, either to balance the consumption or to treat one part of the consumption as a license to consume more elsewhere in the meal.
First, with regard to averaging, Chernev and Gal (2010) find that consumers tend to systematically underestimate the combined calorie content when they evaluate a bundle of healthy (virtue; e.g., salad) and indulgent (vice; e.g., double cheeseburger) options in a meal. Consumers end up averaging the items rather than adding the calories, often judging that one healthy item more than offsets one unhealthy item in terms of the healthfulness of the whole meal.
Second, “Big Mac and Diet Coke” behavior is consistent with licensing theory. That is, in consumption situations in which people have conflicting activated goals (such as a goal to live healthy and a goal to indulge), the choice of one healthy product can “license” the consumer to choose an unhealthy product as part of the same meal (Khan and Dhar 2006). Such reasoning is consistent with previous work by Dhar and Simonson (1999) and Fishbach and Dhar (2005), with the latter suggesting that this effect would not hold if consumers were following a single goal such as healthy eating. Dhar and Simonson further show that this effect is robust to the sequence in which items are chosen. Finding support for licensing mentality in the field would be important from a public-policy perspective, as it would call into question a policy of considering diet CSDs (or similar low-calorie food) as part of a calorie-reduction strategy. The theory of licensing in consumer behavior is supported in multiple domains, where it is termed “moral licensing,” as summarized in Blanken, Van de Ven, and Zeelenberg (2015).
These behavioral theories provide justifications for why people may order more calories with diet than with sugar-sweetened CSDs. On the other hand, people may simply be trying to reduce calories within a fast-food restaurant meal and may find replacing a regular CSD with a diet CSD as a way to do so while still enjoying a flavored CSD as part of their meal.
In summary, relative to extant literature, this is the first study to explore the relationships between diet and regular CSD choice on calorie consumption within a meal—a significant research gap as identified by An (2016). In the process, we also take into account interactions between size (i.e., small, medium, and large) and drink type (i.e., diet vs. regular CSD) to control for potential trade-offs in managing calorie consumption. In terms of estimation methods, we believe ours is the study with the most comprehensive control for potential endogeneity of drink choices on calorie consumption using field data. In addition, this study provides a framework to link the extant literature in health sciences to literature in marketing on consumer behavior.
Data
We use data from the NPD Group’s Consumer Reports on Eating Share Trends (CREST) panel for the years 2000–2007 from Canada to estimate our model. NPD collects the data using diary-based surveys from rolling panels of representative samples of consumers. The unit of observation in the present study is the individual’s food-away-from-home (FAFH) meal consumption occasion (i.e., breakfast, lunch, dinner, or snack meals at other times). For each consumption occasion by a panel member, the database provides information on restaurant visited and food and drinks ordered. Consistent with VanEpps, Downs, and Loewenstein (2016), we assume that food ordered is closely related to food consumption. Similarly, in a study of orders and consumption at a university campus fast-food restaurant, Schwartz et al. (2012) found that there was very limited wastage in a meal, even when the amount of food in the order varied (see Web Appendix, Exhibits 3 and 4 of Schwartz et al. [2012]).
The CREST database does not provide calorie or nutritional information for meal items ordered. Thus, to supplement this data set we merged it with data on calorie content from the McDonald’s Nutrition Facts website and U.S. Department of Agriculture databases. 2
The NPD database provides detailed FAFH by panel members for all restaurants. In our analysis, we use data on consumption occasions at McDonald’s for the following reasons. First, standardized product offerings at McDonald’s enable us to measure calorie content of meals with a high degree of accuracy relative to any other restaurant or combination of restaurants. For example, in the case of Subway, we know only whether consumers ordered a sub sandwich and not the size or type of sub sandwich. Second, comparing the patterns of CSDs ordered in McDonald’s with other major fast-food restaurants (Subway, Wendy’s, Burger King, A&W, Arby’s, KFC, and Harvey’s), we find that the McDonald’s descriptive statistics are close to the averages across these restaurants. That is, the average percentage of meals with a CSD and the average percentage of meals with a diet drink conditioned on any CSD order across all major fast-food chains is 38% and 22%, respectively; the corresponding percentages for McDonald’s are 37% and 23%. (For more detailed comparative statistics, see Table A1 in the Web Appendix.) This suggests that behavior with regard to drink choice in McDonald’s is representative of that in other fast-food places. Third, as one of the world’s largest fast-food chains, McDonald’s offers a sizable consumer base that is a demographically representative sample. Our focus on fast-food meals is also driven by the fact that fast-food chains account for approximately 64% of FAFH consumption (NPD Group 2013). According to Okrent, Saksena, and Hamrick (2018), FAFH’s share of total average daily energy intake increased from 17% in 1977–78 to 34% in 2011–12, and consumption at quick-service restaurants (such as McDonald’s) was the largest source of this growth. The investigation of approaches to affect the healthiness of food choices in restaurants is an ongoing concern of public policy research, such as the labeling of calorie content on menus (Berry et al. 2019; Long et al. 2015; VanEpps, Downs, and Loewenstein 2016).
For the purpose of our study, we filter the CREST data set in multiple steps. Our database contains 682,830 observations of individual meal occasions from 13,072 households; 59,730 of those meals were at McDonald’s. On average, these households were in the panel for 625 days. During this period, a household had 50.5 FAFH meals on average. Of these, 4.5 meals were at McDonald’s. Within the McDonald’s data, only observations with a CSD and one other meal item are relevant for the main analysis. Therefore, we retained 22,075 observations of meals with a CSD and at least one other meal item. Of these, we excluded 2,178 cases for which we could not ascertain the calories from the food because of discrepancies between the menu items and the CREST food-item coding. In the database, only household heads can be identified across multiple eating occasions, so we drop the observations for other individuals (e.g., guests, children); this step of the data-selection process drops 8,044 observations. If a household has two heads (e.g., husband and wife), then for our analysis we treat each household head as a unit of analysis in the panel. In our exploratory data analysis, we found minimal ordering of a diet drink by people over the age of 80 years, so we focus on individuals between the ages of 19 years (the minimum age for household heads observed in the sample) and 80 years. After excluding 39 outliers (see Section A2 in the Web Appendix), we had 11,738 observations from 4,572 panelists (i.e., household heads). Of these, 2,121 panelists had more than one meal (i.e., 9,287 meals) at McDonald’s. On average, these more active panelists had 4.4 meals during the period of study. So, in the estimation process, FE parameter estimates are based on 9,287 observations.
Using the panelists’ (4,572 individuals) CSD consumption behavior over all meal occasions (i.e., including meals at McDonald’s and other restaurants), we can identify three types of panelists: those who always had regular CSDs, panelists who always had diet CSDs, and panelists who switched between diet and regular drinks. As described more fully in Table A2 of the Web Appendix, among panelists in the analysis sample with more than one meal, 333 individuals (16%) switched between types of CSD and accounted for 2,037 (22%) of the meals. The rest of the panelists consist of 1,369 (64%) regular-CSD-loyal and 419 (20%) diet-CSD-loyal. In the “Empirical Approach” section, our FEs models rely on the variations in calorie consumption by the consumers who switched between drink types and size.
Variable Description
We next discuss the variables in our analysis. The two dependent variables are (1) the total calories from food and drink and (2) the calories from only the food within a meal. To estimate the relationship of drink choice and calories, we conceptualize a model whereby the choice of caloric intake can be explained by the choice of drink type (i.e., diet and regular) and drink size (small, medium, and large) while controlling for mean-centered covariates. Beyond drink type, drink size is a key factor to fully characterize the choice to change calorie consumption within a meal. In the present setting, consumers can lower the caloric intake by choosing diet CSDs, smaller sizes, or both. This trade-off between drink types and sizes requires us to include the interaction of drink size and drink type (diet vs. regular) in the model.
In terms of covariates, we include gender (operationalized as a dummy variable for male consumers), age (both linear and quadratic terms to capture possible nonlinear pattern; see, e.g., Chesher 1997), income (ordinal variable with ten levels: under $15,000, $15,000–$19,999, $20,000–$24,999, $25,000–$29,999, $30,000–$34,999, $35,000–$44,999, $45,000–$54,999, $55,000–$59,999, $60,000–$69,999, over $70,000), party size (the number of family members and guests present at the eating occasion), meal occasions (operationalized as breakfast, lunch, and dinner dummy variables, with snacks as the base), and their interactions with drink choice.
Gender is a common demographic classification for marketers and policy makers (e.g., Diet Coke initially targeted female consumers), and many studies indicate that women do better than men in terms of keeping their consumption within dietary constraints and paying attention to health (Wardle et al. 2004), using diet/low-fat labels in their decision making (Braun, Gaeth, and Levin 1997), and following recommended dietary guidelines (Kiefer, Rathmanner, and Kunze 2005; Roos et al. 1998).
Age is another key targeting dimension, and therefore, the heterogeneity of response on this dimension has substantial and practical value. Kim, Nayga, and Capps (2000, 2001) found that older consumers follow healthier diets, as gauged by lower intake of calories from total fat and cholesterol and higher score on the Healthy Eating Index. Chesher (1997) suggests a nonlinear relationship between age and calorie consumption. So, to capture nonlinear effects, we include Age and Age2 terms in our models.
Numerous studies (e.g., Chen, Liu, and Binkley 2012) have documented the link between income (or sociodemographic class) and calorie consumption. In general, higher income is associated with a significant decrease in calorie consumption from regular CSDs.
Party size is reported to have a significant effect on calorie consumption, especially when eating at restaurants (Ariely and Levav 2000). For instance, impression-management motives prompt consumers to strategically alter their behaviors to present themselves positively (Ashworth, Darke, and Schaller 2005; White and Dahl 2007). For example, when eating in a group, one might switch to a diet drink and replace the fries with salad to display a healthy image to companions.
The meal-occasion dummy variables mostly control for the systematic differences across eating occasions (e.g., breakfast and snacks typically have fewer calories than other meals).
Descriptive Statistics
Table 1 displays the descriptive statistics of the variables. For the purpose of comparison, we provide descriptive statistics for all FAFH meal occasions (Full Sample), at major fast-food restaurant chains, and at McDonald’s (All McDonald’s), and for the sample we use in our main analysis (Analysis Sample). On most characteristics, the four samples are largely similar. The percentage of breakfast observations is lower in the Analysis Sample because we used only the meals with a CSD, a less popular drink for breakfast. CSDs are ordered more frequently (about 38% of the time) in fast-food restaurants than they are in the Full Sample, with other types of restaurants typically offering a wider range of drink alternatives, including alcoholic beverages.
Descriptive Statistics of Demographic and Meal-Occasion Variables.

Subway, Wendy’s, Burger King, A&W, Arby’s, KFC, and Harvey’s.
Notes: N.A. = not applicable.
Table 2 provides the correlation matrix of the independent variables in our analysis. 3 The negative correlation (r = −.85) between lunch and dinner occurs because these two categories cover most McDonald’s meals that include both a food item and a CSD (see Table 1). If we had chosen Lunch or Dinner (rather than Snacks) as the base case, this correlation would be much smaller. The correlation (r = .55) between Age and Age2 is expected, as we are dealing with linear and quadratic terms of the same variable to capture nonlinear effects, as is common in the literature (e.g., Holbrook and Schindler 1994; Yin, Bong, and Zhang 2017). Because the interpretation of the results depends on the combined effects of the two terms, this collinearity does not affect our conclusions (see Goldberger 1991, Chapter 23). Multicollinearity mainly affects the standard errors of the parameter estimates; the VIF is a frequently used measure of its severity. There is no clear guideline on the acceptable value of the VIF, as it varies by situation; Greene (2003, Chapter 4) suggests that researchers should be concerned if the VIF is greater than 20. In our data, as shown in Table A4 of the Web Appendix, the maximum value of the VIF is 12.73, and only terms involving Age and Age2 have VIFs greater than 10. Our key conclusions depend on a combination of parameter values and not an individual estimate, so they are unlikely to be affected by multicollinearity.
Correlation Matrix.
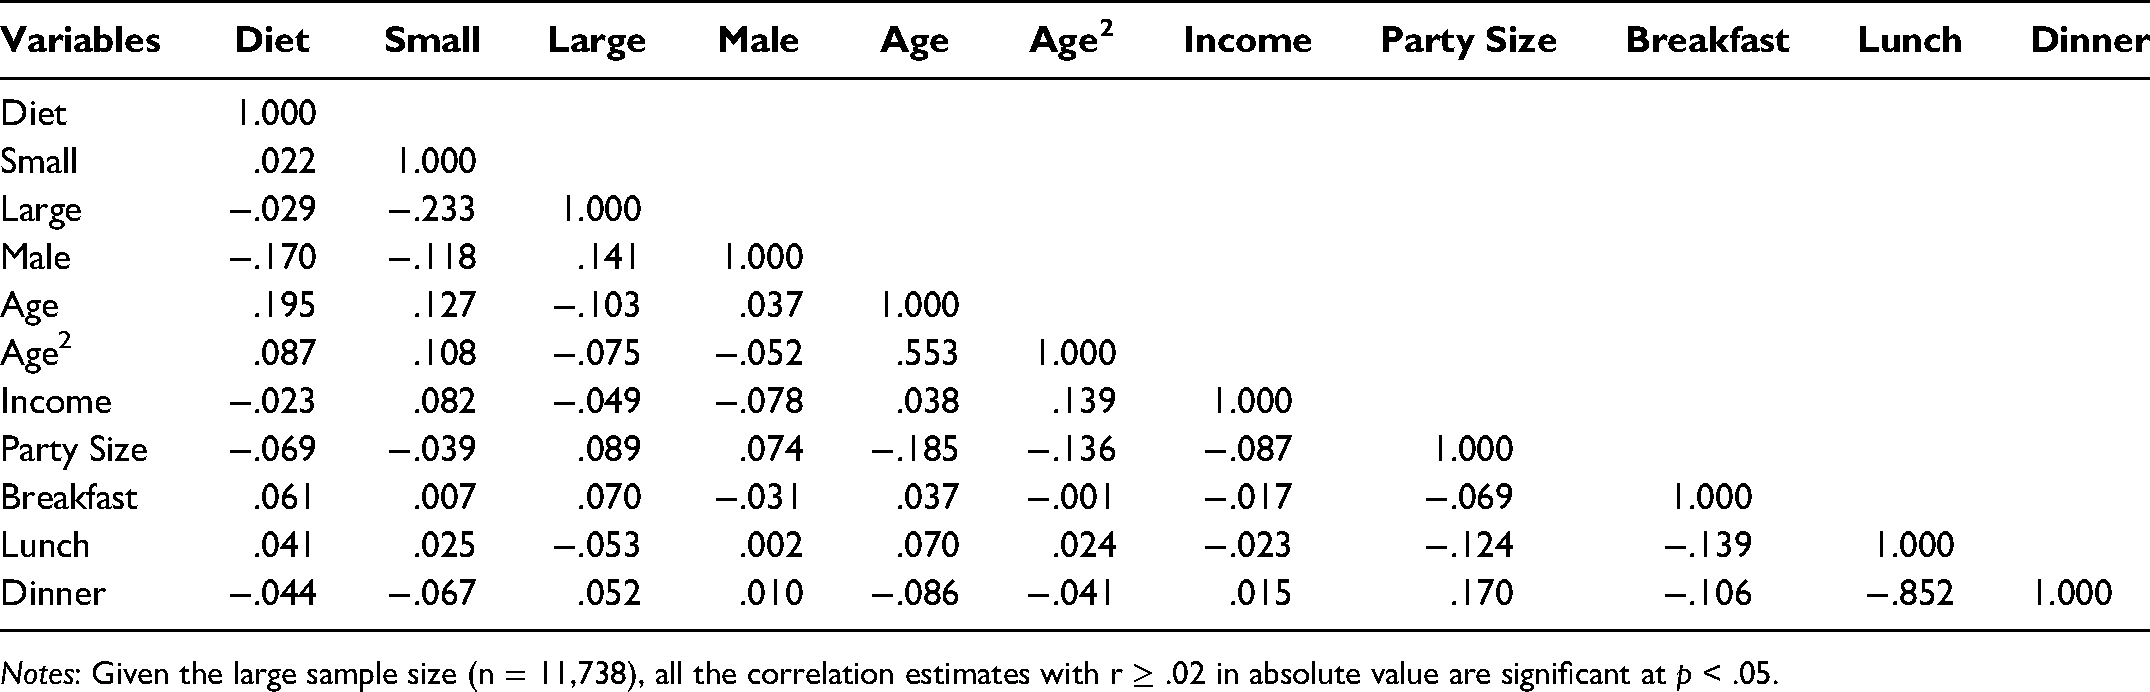
Notes: Given the large sample size (n = 11,738), all the correlation estimates with r ≥ .02 in absolute value are significant at p < .05.
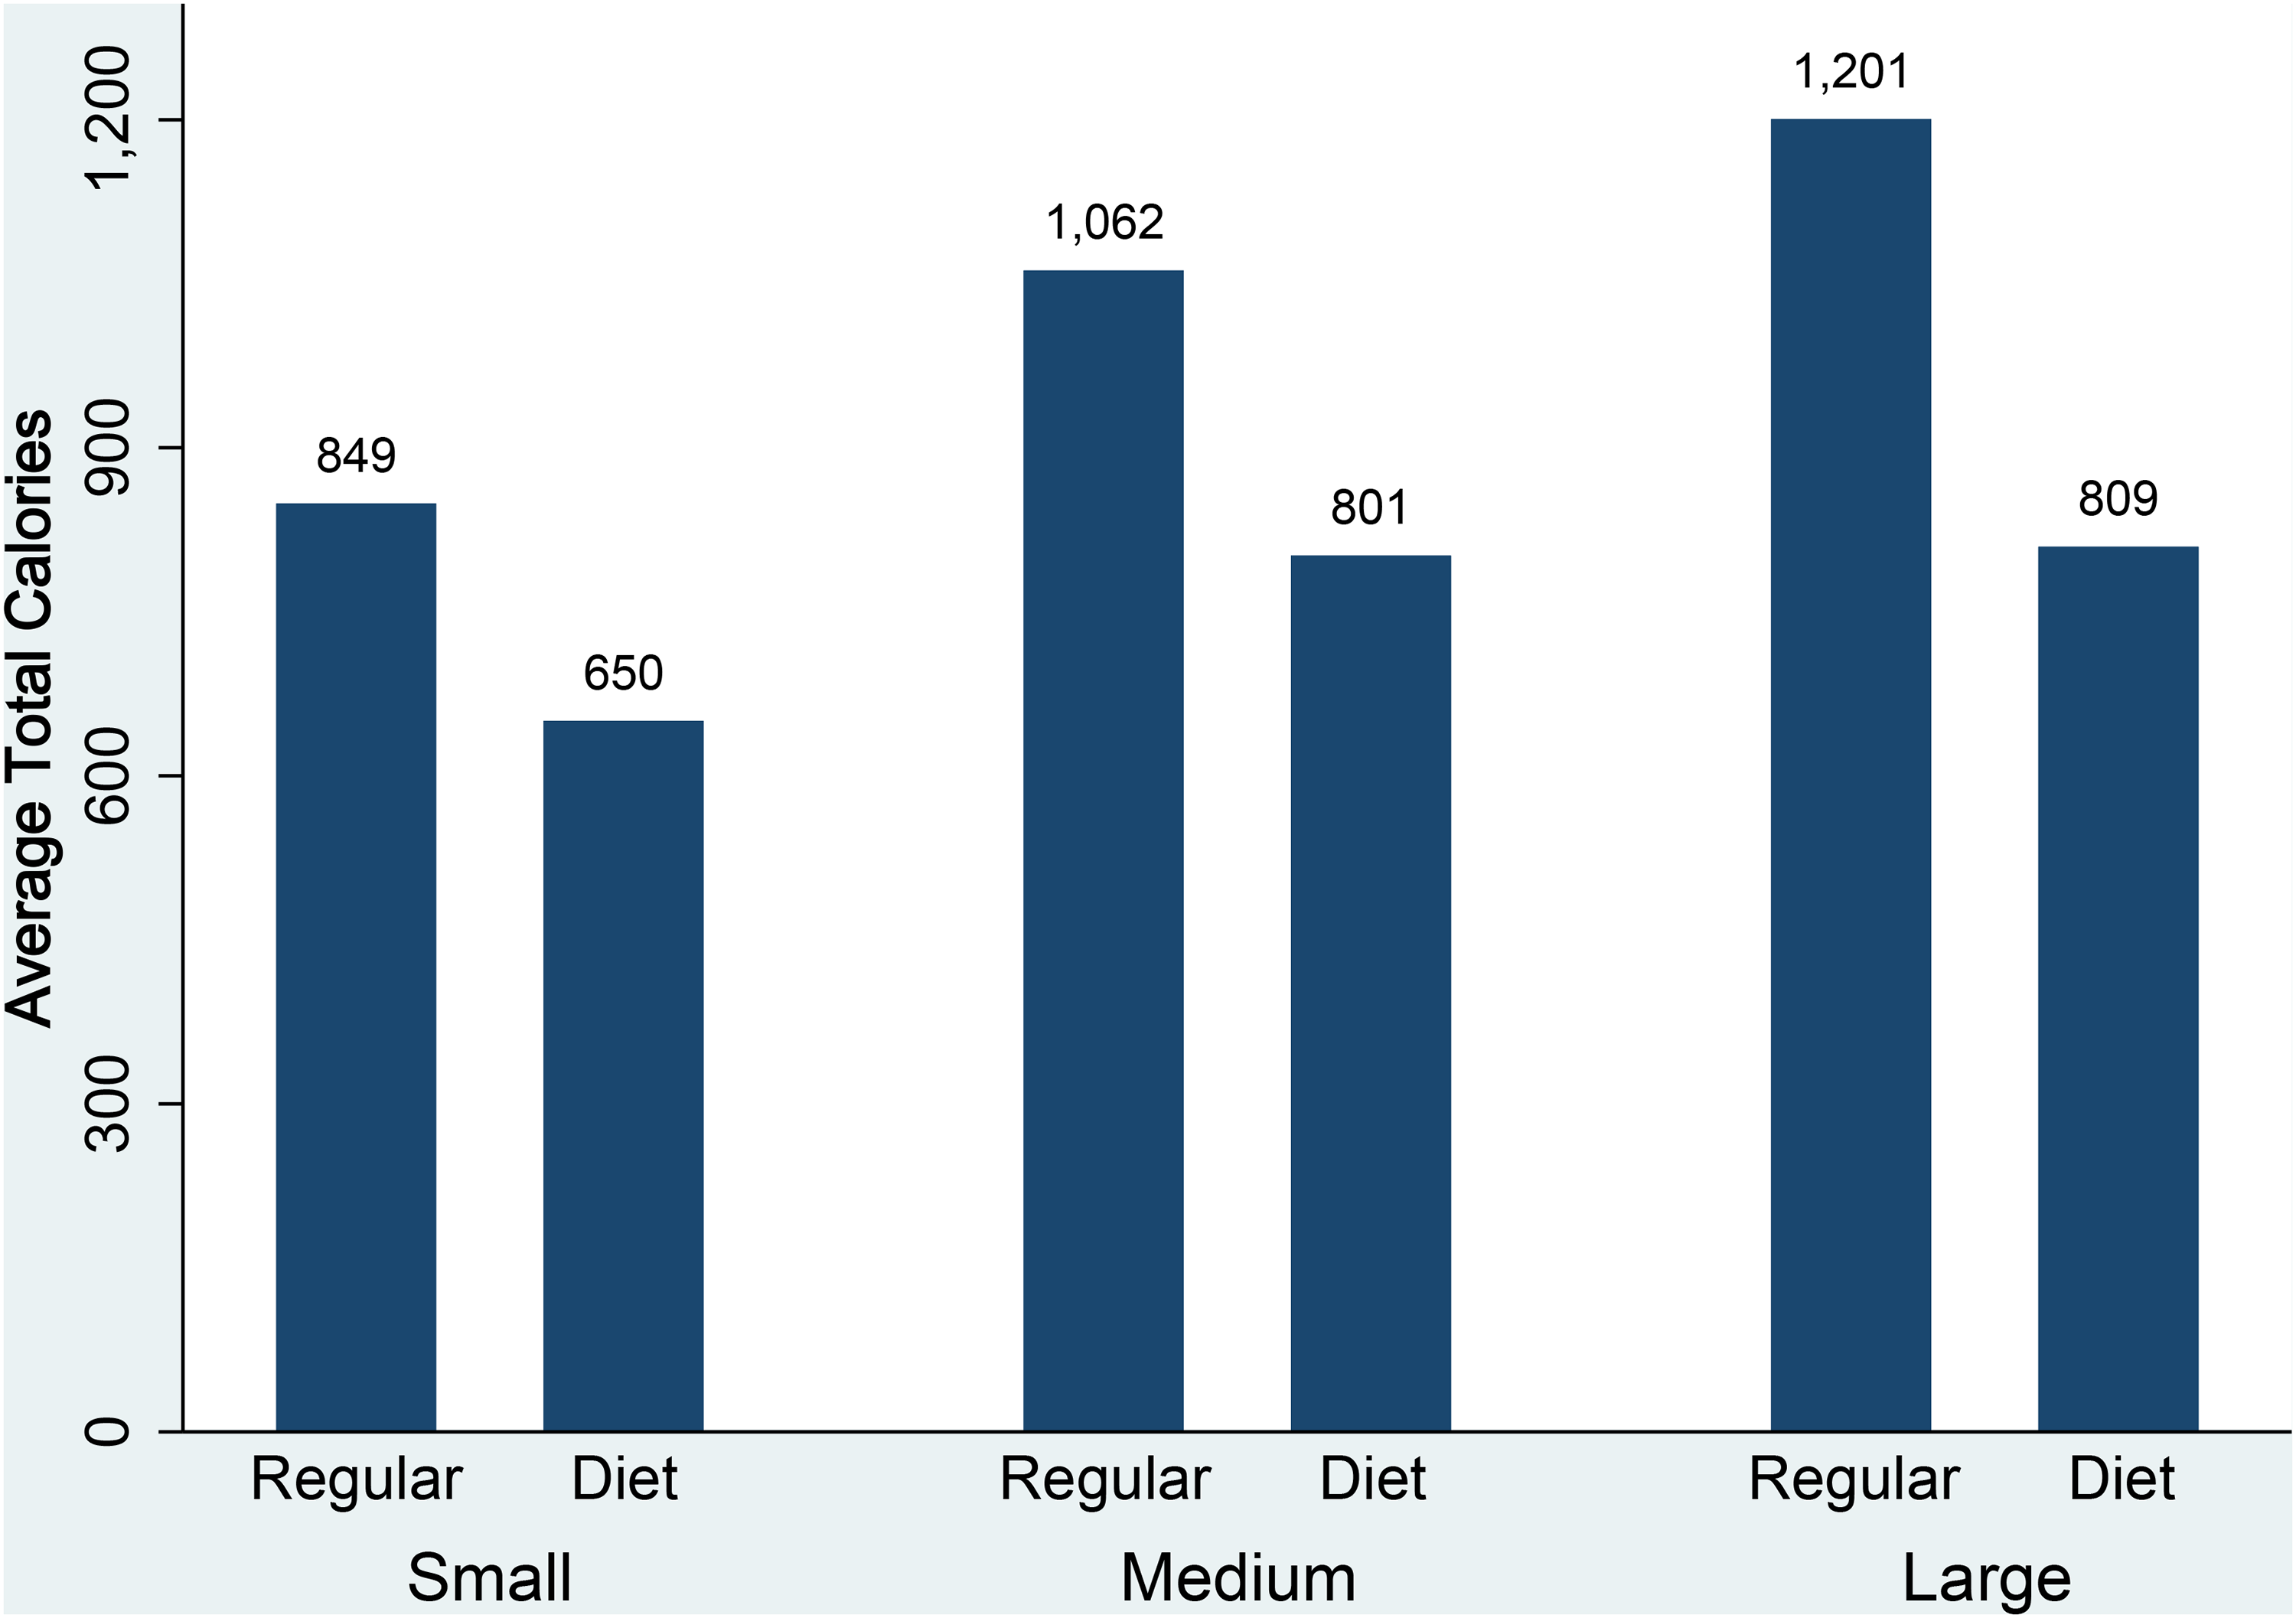
Model-Free Results
Figure 1 displays the relationship between the total calorie consumption in a meal and our key covariates—drink sizes and types using the analysis sample. Overall, meals with a diet drink have lower total calories (i.e., 780 calories) than meals with a regular drink (i.e., 1,070 calories); and in terms of size of drink, small, medium, and large diet-drink choices have, respectively, 199, 261, and 392 fewer total calories than meals with a regular drink. A large portion of the difference is driven by the calorie differences across diet and regular drinks (150, 220, and 320 calories for small, medium, and large drinks, respectively). Figure 2 shows average calories ordered only from food in a meal by drink type and size. Interestingly, under all conditions we observe that customers have fewer food calories with diet than with regular drinks. On average, they order 49, 41, and 72 fewer food calories with small, medium, and large diet CSDs. Overall, panelists have fewer total and food calories with a diet CSD than with a regular CSD.
Total (from food and CSD) calories by drink type and size.

Average food calories by drink type and size.
Empirical Approach
To build our model, we borrow the basic modeling framework from the econometrics of treatment effects literature (Wooldridge 2002, Chapter 18). To develop a formal specification of an estimable model, we use a switching regression approach following Wooldridge (2002, pp. 611–12). We provide a summary of our derivation in the main text; more details can be found in Section A5 of the Web Appendix. In our conceptualization, a consumer can choose both drink and size to manage total calories in a meal. For this reason, we separate total calorie count into three components: average total meal calories linked to drink for a given type and size, individual-specific time-invariant differences, and finally a time-variant drink type, size, individual-specific component. To formalize, let 

In Equation 2,
Other Unobserved Factors
We note that not all unobserved effects can lead to incorrect interpretation of estimations. To illustrate, there could be change driven by motivations or goals—for example, consumers may cyclically decide to go on a diet such that they drink diet CSDs when they want to lower their calorie consumption and regular sodas otherwise. In this case, the key implication for causal inference—that diet-drink choice leads to lower total calorie consumption—is not violated. Thus, proposed estimation methods should be robust to biases due to changes in motivation or goals.
A second potentially relevant external time-variant factor is the use of periodic promotions. If McDonald’s were to run promotions by drink types (for example, to promote only either diet or regular CSDs), then choice of drink type may be driven by promotion and not by concern about calories. If this is the case, it will be difficult to interpret our results causally and to formulate policy recommendations. However, after a detailed discussion with a senior marketing manager, our understanding is that McDonald’s never promotes just one CSD type.
Third, one could also argue that drink choice can be driven by taste. Our database does not provide any information on taste preferences of consumers. So, to test this assumption, we ran a survey using Amazon Mechanical Turk subjects, as described in Section A6 of the Web Appendix. We found that 77% of participants responding to our survey strongly agreed, somewhat agreed, or agreed with the statement “Regular CSDs taste better than Diet CSDs.” Consequently, it is unlikely that taste is the primary force driving the choice of diet CSDs.
Although we can rule out multiple time-variant confounds, there can still be potential change involving health or physiological issues—for example, due to health reasons one is required to change the usual amount of calorie consumption during the sampling period. In such a case, this unobserved change is time-variant. To control for such factors, following Wooldridge (2015), we can use control function methods to replace the εs with generalized residuals from a set of probit probability choice models for size and type of drinks chosen: we first estimate the probit choice models of size and type of drinks to estimate generalized residuals; in the second stage we estimate calorie Equation 2 while incorporating the generalized residuals.
Specifying the Control Function Approach
More specifically, the control functions approach implies a two-step estimation method. In the first step, we estimate probability choice models of size (SMALL and LARGE), drinks (DIET), and their interactions (i.e., DIET × SMALL and DIET × LARGE). We estimate the following five probit models: 
To identify the second stage (Equation 3), we follow the widely used Heckman (1979) approach and apply exclusion restrictions in the first stage of our model. Our exclusion restrictions are based on the following assumption: consumers’ past drink and size choices will be correlated with current drink and size choices, but not with current food choices. The reasons for such a relationship between past and present drink and size choices can be taste preference, consumer inertia (habit formation), and/or variety-seeking behavior, implying that to estimate our probit model of diet CSD choice, we use the proportion of past diet drink choices, excluding the current CSD choice, as one of the explanatory variables. To take into account all the observable choices across eating occasions, we estimate this proportion on the basis of CSD choices across all restaurants including McDonald’s. Similarly, in the case of probit models for sizes, we use proportion of past size choices as explanatory variables, excluding the current choice. Finally, in estimating probit for drink–size combinations (i.e., DIET and SMALL, and DIET and LARGE), we add the interactions between proportion of past drink and size choices as explanatory variables. The generalized errors are generated after controlling for effects of past choices in type and size. Thus, they capture more of the remaining unobserved factors that can potentially impact the drinks and food choices.
Results
As we discuss next, the FE with control function (FE-CF) approach is the most appropriate one for our data, so we present the results of the FE-CF model. Results from models that can partially control for unobserved factors (e.g., RE, FE) are discussed briefly in the “Alternative Models, Methods, and Robustness Checks” subsection.
Table 3 provides estimates of the first-stage probit regression models to create generalized errors for the second-stage estimation. In all five cases, we use the same set of demographic covariates to estimate the model. In the first-stage probit estimation, the percentages of past choices’ propensities are all highly significant (p < .01), a necessary condition for these to be valid exclusion restrictions. In the second step, we plug in the estimated generalized residuals to control for unobserved factors. Table 4 presents estimated parameters of the generalized residuals and their interactions (πs). Of the 10 π parameters we estimated, the following three are significant or marginally significant:
Probit Estimates (First Stage of Control Functions of Approach).

*p < .10.
**p < .05.
***p < .01.
Total and Food Calorie Regression (Second Stage of FE-CF Approach).

*p < .10.
**p < .05.
***p < .01.
Notes: DV = dependent variable.
The fact that these parameters are linked to small-size choices implies that the remaining unobserved factors potentially causing bias in estimates are related to small-size choices. The insignificance of other π parameters suggests that the extent of biases due to time-varying endogeneity may not be related to large and medium-sized drinks.
Estimated Effects
The individual coefficients in Table 4 are difficult to interpret directly due to the presence of numerous interactions. Nevertheless, in terms of total calories ordered, we see that the main effect for diet compared with regular CSDs is negative and significant (p < .01). Similarly, compared with medium drinks, small (large) drinks are associated with significantly fewer (more) total calories in a meal. Whereas the interaction of diet × small size lessens the negative effect of the two main effects, it is strengthened for diet × large size. Regarding food calories only, there is no significant association in terms of main effect for choice of a diet versus regular drink, but the choice of a small drink is significantly associated with fewer food calories in a meal than with a medium drink. However, this does not apply to a large (compared with a medium) drink.
To better understand the heterogeneity of effects across drink and size choices and demographic and situational factors, we use the parameter estimates to calculate counterfactuals under different conditions. Heterogeneity in the effects of diet drink selection across drink size, gender, age, and other covariates can be explained as additive and multiplicative terms of coefficients of the regression parameters in Table 4. For example, the difference in calories between two drink type conditions (i.e., the difference between diet and regular) for a medium-size CSD (base case) can be expressed as
Figure 3, Panel A, presents the estimated effects based on the total-calorie regression models. Overall (at the mean value of all the covariates), total calories ordered is negatively associated with a large diet drink compared with a regular large CSD ([Diet, LG] − [Reg, LG] = −298; p < .01). 5 For medium-sized drinks, the effect is also significant ([Diet, MD] − [Reg, MD] = −156; p < .05). With small drinks, the choice of diet drinks was not significantly related to total calories. In Figure 3, Panel B, we present the results based on food calories. In this case we do not find any significant effects across all comparisons.

Estimated effects (mean and 95% confidence interval) for total and food calories.
Next, we explore the effects of size and drink choices by gender. We find that in the case of large size, both male and female consumers benefit from the choice of diet over regular drinks ([Diet, LG, F] − [Reg, LG, F] = −334; p < .01 and [Diet, LG, M] − [Reg, LG, M] = −262; p < .01). With medium-sized drinks, only female consumers benefit from the choice of diet drink ([Diet, MD, F] − [Reg, MD, F] = −192; p < .05). With small size, neither male nor female consumers show a significant association between drink choice and total calories.
Given that age is a continuous variable, we estimate the effects by age at different standard deviations from the average age in the sample. A similar approach has been used in the consumer behavior literature in the form of a spotlight analysis (Spiller et al. 2013). Here, we present the results at plus or minus one standard deviation (±1 SD) of mean age. For all age groups, total calories are significantly lower for large and medium size and not statistically significant for small size when comparing meals with diet versus regular CSDs.
The savings in total calories are not only statistically significant but also substantial. Cadario and Chandon (2020), drawing on Hollands et al. (2015), report that the mean (± SD) in daily energy intake is 1,727 (±537) calories. From our estimates for adults choosing a large drink at McDonald’s, the total savings in calories from drinking a diet versus a sugary drink is 298 (±69) and for medium drinks 156 calories (±76). As a teaspoon of sugar is equivalent to 16 calories, this is equivalent to saving 18 teaspoons (for large drinks) and 10 teaspoons (for medium drinks) of sugar in a meal (Cadario and Chandon 2020). With 85 million U.S. adults eating at least one meal at a fast-food restaurant per day, the potential calorie savings from choosing diet in place of regular CSDs at fast-food restaurants amounts to more than a billion calories per day (based on projections under reasonable assumptions from the ordering patterns in Table 1 for all fast-food restaurants and our results as shown in Figure 3, Panel A).
Alternative Models, Methods, and Robustness Checks
To check the robustness of our results, we used an array of alternative models and diagnostics tests. In particular, we estimate RE and FE models, which control for individual-specific time-invariant FE (Table A5 of the Web Appendix). Using a test first proposed by Hausman (1978) as shown in Table A6 of the Web Appendix, the FE model is preferred over the RE model (χ2(56) = 101.21; p < .01). 6 Consequently, we further examine the appropriateness of the FE model.
To understand the extent of the bias related to endogeneity of drinks choice in the FE model, we estimate the relative magnitude of the bias that would nullify our estimated effects. Oster (2019), following Altonji, Elder, and Taber (2005), suggests that under a set of reasonable assumptions on the relationship between treatments and observed covariates, it is possible to estimate the magnitudes of the impact of unobserved covariates on treatment effect that will cause the estimated treatment effects to be zero. For the average value of the covariates in our models, the estimated magnitude varies between 2.3 and 21. The estimates imply that the influence of unobserved covariates on treatment effect estimates has to be at least twice as large as the effect of the comprehensive set of included covariates and individual-specific unobserved FE combined for the treatment effects to be zero. Altonji, Elder, and Taber (2005), Bellows and Miguel (2009), and Mian and Sufi (2014) have used similar measures of relative magnitude of unobservable to observable covariates to claim that their estimates are robust. Despite these results suggesting that bias in the FE model is limited, as discussed in the previous section, the FE-CF that controls for endogeneity of drink choice serves to further limit the bias. Compared with the FE-CF approach (see Figure 3), the RE and FE models (see Figure A6 in the Web Appendix) have an upward bias in terms of total calories estimated to be saved when ordering diet compared with regular drinks.
While our statistical tests conclude that the FE-CF model is the most appropriate for our data set, we should emphasize that the RE, FE, and FE-CF models all lead to similar conclusions from a policy perspective: none of the results indicate any positive association between choice of a diet versus regular drink and total calories in a meal; for at least some population segments, there is a negative association between choice of a diet drink and total calories in a meal.
Alternative Drink Choices
Our study is based solely on CSD drink choices for several reasons: CSDs are the predominant type of drink accompanying meals at restaurants, sugary and NSS CSDs are close substitutes for each other, and there are no price differences within the same sizes of NSS and sugary CSDs. To gain a broader perspective on drink consumption in restaurants, however, we provide some descriptive statistics on other drinks (see Tables A8 and A9 of the Web Appendix that supplements the data in Table 1). Water is a healthy drink that is broadly considered the first best substitute for CSDs in a meal. However, our sample indicates that water (both tap and bottle) is present in only 2.6% of all McDonald’s meals and in 3.1% of major fast-food restaurant meals. In comparison, a CSD is present in about 38% of meals at McDonald’s and other fast-food restaurants in our sample. (Water is more frequently chosen in coffee shops and full-service restaurants; overall, water accompanies 8% of meals across all restaurants.) These statistics in the context of fast-food restaurants suggest that despite the benefits, consumers do not commonly choose water as an alternative to a CSD. Nevertheless, McDonald’s restaurant meals with water have 127 fewer total calories (p < .01) than meals with a diet drink when controlling for model covariates’ main effects (Web Appendix Tables A10 and A11).
Iced tea, another alternative to CSD, is also infrequently chosen, constituting 2% of the McDonald’s sample. The average calorie count of food accompanying iced tea is at the same level as that of food chosen with diet CSDs, but orders with iced tea on average have 24 fewer food calories (p < .01) compared with orders with a regular CSD, after controlling for demographic and meal occasion–related covariates (Web Appendix Tables A10 and A11).
Following CSDs, coffee is the second most commonly ordered drink in our McDonald’s sample (8,083 or 13.5% of meals have a coffee order). Coffee orders have a higher share of breakfast (41% with coffee compared with 2% for CSD) and snack (25% with coffee compared with 7% for CSD) drink choices, and the food accompanying coffee orders on average has 255 fewer calories than when a CSD is chosen. These numbers indicate that meals with coffee are systematically different than meals with CSDs, and coffee, a hot drink, likely satisfies a different consumer need than do CSDs. While we do not know whether coffee is consumed with or without sweeteners (either NSS or sugar) and how much sweetener is used, interestingly, meals that include coffee with milk (or coffee creamer) had 34 more (p < .01) food calories than meals with black coffee (Web Appendix Tables A10 and A11).
Discussion and Implications
A significant contributor to the well-recognized “obesity crisis” is the consumption of SSBs. As a result, food guidelines strongly recommend reducing the quantity of SSBs consumed. They advocate replacement of these drinks with water but do not advocate the use or substitution of NSS drinks, which have zero (or low) calories (Health Canada 2019). While few would dispute that water is the best substitute for sugary drinks from a health perspective, the continued high use of sugary drinks is still evident, as illustrated in our data set. For example, in our data set of meals consumed at major fast-food restaurant chains (Column 2 of Table 1), meals with CSDs are 12 (38.27% vs. 3.1%) times more prevalent than those with water. In addition, food orders with CSDs are 3.5 times more likely to contain regular than diet drinks.
Overall, our findings are robust in terms of policy recommendations to different estimation methods and sampling. We control for both time-invariant and -variant unobservable (to the researchers) effects. Our findings suggest that researchers should consider both types of unobserved effects in estimation. Moreover, we demonstrate that the use of recent advances in econometrics and the availability of panel data offer new opportunities to understand the health implications of food choices. Our analysis also establishes the importance of controls for endogeneity of drink choice in analyzing meal consumption behavior with drinks and food. In terms of drink size, diet-drink choice and calorie reduction in a meal are positively correlated.
Public Health and Calorie-Reduction Strategies
Developing alternatives to the continued high use of sugary CSDs is a challenge. For public health officials, making recommendations about the use of NSS drinks as a replacement is complex for several reasons. First, the ideal replacement is water, but many consumers appear to be reluctant to switch to water. Consequently, NSS drinks may be viewed as a second-best choice, and policy makers should consider the appropriateness of advocating such a message.
Second, consumers substituting an NSS drink for an SSB might replace the saved calories with additional calories in other parts of a meal, to the detriment of their health. As discussed previously, studies have shown that within the context of an eating occasion, consumers who knowingly have a diet or low-calorie version of that item often consume more calories elsewhere (e.g., Shide and Rolls 1995). Thus, it is important for policy makers to know, at the level of a meal occasion, whether choosing a diet drink licenses the consumption of more food in the meal. Our study in a field setting, by contrast, shows either no effect or a reduced effect on total calories within that meal in connection with the choice of diet drink, depending on size of drink and demographic characteristics.
Third, the long-term effects on health outcomes of consuming NSS drinks compared with SSBs constitute a continuing area of study. Our article does not shed light on the long-term effects of diet drinks. At present, the consumption of NSS in diet drinks at current levels is considered safe, according to U.S. food guidelines (https://www.cancer.gov/about-cancer/causes-prevention/risk/diet/artificial-sweeteners-fact-sheet) and as supported by studies such as Toews et al. (2019) and Malik (2019).
In the pursuit of the public health goal of reducing consumption of SSBs, health officials need to consider how actively to promote NSS drinks. NSS drinks are a legal product and their ingredients are considered safe at normal levels of consumption, but U.S. food guidelines do not actively promote their use, instead stating, “It should be noted that replacing added sugars with high-intensity sweeteners may reduce calorie intake in the short-term, yet questions remain about their effectiveness as a long-term weight management strategy” (Dietary Guidelines Advisory Committee 2015, p. 31). 7 Such warnings, however, may discourage people from switching from sugary drinks to diet drinks in a meal as part of a calorie-reduction strategy. Given the results of a recent meta-analysis of NSS beverages and our own findings, we suggest that the Dietary Guidelines Advisory Committee consider not emphasizing concerns about the possible long-term effects of diet drinks as part of a weight-reduction strategy. Whether policy makers should actively promote the use of NSS drinks as a replacement for SSBs depends on an assessment of the results of future research. Another critical factor is whether new approaches can be found to persuade consumers to choose water as a substitute for sugary drinks—if not in fast-food restaurants, perhaps in other settings.
Public policy makers are rightly concerned about the active promotion of specific alternatives that may later turn out to have unintended and unhealthy consequences. The case of e-cigarettes in the United States is an apt, current, and highly discussed example. E-cigarettes, which do not include tobacco but typically include nicotine, were initially designed and marketed as a harm-reduction alternative to people who were already smoking cigarettes and had difficulty quitting. Unfortunately, the benefits do not seem to have been realized, as U.S. e-cigarette consumers in general show little reduction in their cigarette-smoking behavior; perhaps more tragically, e-cigarettes have become popular among teenagers. For example, in 2018, 20.8% of U.S. teenagers had smoked an e-cigarette once a month (U.S. Food & Drug Administration 2018). Interestingly, the United Kingdom took a very different approach to e-cigarettes by regulating them as a harm-reduction tool only among smokers, and they never caught on, with a reported 4.9% of teenagers using them occasionally or regularly. 8
If policy makers pursue an active calorie-reduction strategy, one question is whether to target male or female consumers. 9 Our data show that female consumers are more likely to order diet drinks, and when they do, they order fewer total calories than male consumers. Thus, there may be an opportunity to focus more on men, a market segment that may not have been well served. Soft drink companies have recognized this potential; Coke Zero was reportedly introduced primarily to increase consumption of diet drinks among men (Zelonka 2014).
Managerial Implications
From the perspective of a manufacturer, the results support the positioning of diet CSDs as a way to reduce the caloric and sugar intake within a single meal. Manufacturers of CSDs appear to have responded to this need by introducing new versions of diet or low-calorie CSDs such as “Zero Sugar” brands (e.g., Coke, Pepsi, and Dr Pepper), which are advertised as having a taste profile close to regular CSDs. Some brands are targeted at men rather than women.
Both retailers and manufacturers might consider how to increase the consumption of diet drinks among consumers who want regular CSDs and not water. For example, recent studies on the use of “choice architecture”—that is, designing the environment in ways that make it easier to make a healthy choice—suggest that such considerations lend themselves well to the promotion of diet drinks (Thorndike et al. 2012). Moreover, as Scott and Vallen (2019, p. 132) suggest, if “consumers perceive that a company is developing strategies and offers that promote consumers’ well-being, this will likely result in a more loyal customer, creating a mutually beneficial relationship between the consumer and the firm.”
Concluding Remarks
In summary, in the context of a fast-food chain restaurant, we do not find evidence of more calories being ordered within a meal with a diet CSD relative to a meal with a regular CSD; indeed, for some consumer segments, we observe a reduction in calories. In terms of theoretical implications, our analysis does not corroborate the behavioral theories of averaging or licensing—consumers do not seem to order more calories with diet than with regular CSDs. Finally, our findings suggest, from the point of view of policy makers, that the availability of diet drinks in a fast-food setting can be viewed as a potential calorie-reduction strategy that provides a satisfying way for (at least some) consumers to lower total calories consumed within a meal.
Our study is based on data from the FAFH market, an important and increasingly prevalent market sector. If consumers behave differently at home than away from home, in terms of choice of drink and food, then such differences can limit the generalization of our findings to at-home consumption. Even within the context of a meal away from home, our results are based on one fast-food chain, McDonald’s. Given its size and comparability, in terms of demographic characteristics, to other fast-food chains in our sample, we believe our results are generalizable to fast-food restaurant consumption. Further generalizability will rely on the assumption that in non-fast-food restaurants, consumers behave similarly as they do in fast-food restaurants. But to have more confidence, we need similar studies using data from other restaurants, in other settings (particularly the home), and for other consumer segments, particularly children. We recognize that data based on actual observations of food and drink consumption rather than on self-report of an ordered meal would provide more accurate information, but such observational studies would be difficult in a natural field setting.
From a health perspective, water is the best choice, but our data set does not allow for rigorous study of the effect of choosing water on the calories consumed in the rest of the meal. In part, this is because so few people select water while dining at restaurants and also because we need to account for price effects. However, our basic analysis of the data suggests that meals with water have fewer calories than meals with diet CSDs. An important area of future research would be more rigorous testing of whether the choice of water is accompanied by change in other parts of a meal, perhaps involving laboratory experiments to examine whether licensing theory holds when water is the healthy choice.
Our study in a field setting cannot be considered a controlled test of behavioral theories (e.g., licensing or averaging) given that multiple theories can explain higher (or lower) consumption behavior in one part of a meal if another part of it is perceived to be healthy. In this context, we also do not know consumers’ psychological perceptions of the items within a meal, making it difficult to ascertain the underlying assumptions of any theories we might be trying to test. In the case of averaging, the assumption is that consumers use mental calculations of calories to decide on food and drink choices. In the case of licensing, the assumption is that consumers perceive items within a meal as “virtue” or “vice” and pursue at least two goals of healthiness and indulgence. Nevertheless, our findings suggest opportunities for behavioral researchers to conduct further studies to test these competing theories in terms of their appropriateness and boundary conditions. More complete knowledge of the psychological processes underlying consumer decisions in field settings will help guide design and targeting of nutrition policies.
Our study, by design, abstracts from price effects. If consumers switch from CSD to tap water, ceteris paribus, the total cost of the meal is lower. But the key question is how consumers will spend that saved CSD money. Would they use it to buy additional food items? While our preliminary results indicate that meals with water (vs. CSDs) have lower total calories, our data do not allow for full analysis of the price effect. Future research could empirically examine pricing issues and healthy eating choices.
Supplemental Material
Supplemental Material, sj-pdf-1-ppo-10.1177_07439156211014900 - Do Consumers Order More Calories in a Meal with a Diet or Regular Soft Drink? An Empirical Investigation Using Large-Scale Field Data
Supplemental Material, sj-pdf-1-ppo-10.1177_07439156211014900 for Do Consumers Order More Calories in a Meal with a Diet or Regular Soft Drink? An Empirical Investigation Using Large-Scale Field Data by Sina Ghotbi, Tirtha Dhar and Charles B. Weinberg in Journal of Public Policy & Marketing
Footnotes
Acknowledgment
The authors would like to thank the JPP&M review team for their feedback on the previous drafts. They have benefited immensely from the team’s insightful comments and feedback in revising the paper. Professors Dhar and Weinberg also would like to thank the Social Sciences and Humanities Research Council of Canada for its support in conducting this research.
Special Issue Guest Coeditors
Brennan Davis, Dhruv Grewal, and Steve Hamilton
Declaration of Conflicting Interests
The author(s) declared no potential conflicts of interest with respect to the research, authorship, and/or publication of this article.
Funding
The author(s) disclosed receipt of the following financial support for the research, authorship, and/or publication of this article: The authors received research grants from the Social Sciences and Humanities Research Council of Canada that helped to financially support this research.
Notes
References
Supplementary Material
Please find the following supplemental material available below.
For Open Access articles published under a Creative Commons License, all supplemental material carries the same license as the article it is associated with.
For non-Open Access articles published, all supplemental material carries a non-exclusive license, and permission requests for re-use of supplemental material or any part of supplemental material shall be sent directly to the copyright owner as specified in the copyright notice associated with the article.