
Abstract
To reduce traffic congestion and air pollution, public policy makers often try to stimulate the use of public transport, as it is a more sustainable alternative to traveling by car. This study therefore investigates the impact of firm-initiated marketing actions and traveler satisfaction on monthly cumulative traveled distance of a Western European railway firm, as well as possible effects of this cumulative traveled distance on satisfaction. Analysis of time-series data on traveled distance, advertising, promotions, and satisfaction using a vector autoregressive model with exogenous variables that accounts for seasonality, trending behavior, and gasoline prices reveals positive effects of advertising and promotions. Advertising elasticities are considerably smaller than meta-analytic values of brand-advertising elasticities. Similarly, promotion elasticities are lower than those frequently reported in marketing. The authors find no effect of satisfaction on traveled distance; however, they do find a negative effect of traveled distance on satisfaction, which could be explained by capacity constraints. The authors conclude that firm-initiated marketing actions are useful and effective in fostering public transport usage.
Many government policies aim to increase the use of public transport. Increased public transport use can reduce congestion, parking problems, and environmental pollution (e.g., smog, CO2 emissions, noise; Union Internationale des Transports Publics 2013). Public transport can thus be considered a sustainable alternative to car transport. In multiple countries, public transport has been liberalized to some extent, and public transport firms have their own targets that may include the increase in the use of their mode of public transport. For example, railway firms may aim to increase the cumulative number of miles traveled per year. In a more long-term, multiyear perspective, they might therefore invest heavily in new and/or faster connections (i.e., faster trains). However, to achieve more short-term, year-to-year growth objectives, other instruments must be used. Specifically, these firms may use firm-initiated marketing actions—specifically, advertising and promotions—to attract more customers. Furthermore, they might invest in improving the delivered service quality, thus improving customer satisfaction and the attractiveness of the public transport (Gijsenberg, Van Heerde, and Verhoef 2015; Mouwen 2015) and ultimately fostering retention and repeated usage.
Public transport as a research topic has gained attention mainly in the field of transportation science and has been studied only to a much lesser extent in marketing science. In the transportation science literature, a large number of studies focus on modeling transportation choices using logit-type models (e.g., Greene 2003; Hensher 1994; Louviere 1988; Louviere and Hensher 1982) and uncovering the drivers of these choices (e.g., Arbues et al. 2015; Beirão and Cabral 2007; Friman and Gärling 2001; Hensher et al. 2013; Jakobsson Bergstad et al 2011; Mokhtarian and Salomon 2001). Surprisingly, attention to customer satisfaction as a customer feedback metric that may drive repeated public transport usage is relatively scarce, and in the case of firm-initiated marketing actions, attention is almost absent.
In the marketing science literature, Gijsenberg, Van Heerde, and Verhoef (2015) and Verhoef, Heijnsbroek, and Bosma (2017) study satisfaction formation for a railway firm, but neither of these studies considers the choice/sales consequences of customer satisfaction changes. Only Van Doorn and Verhoef (2008) have modeled the effect of customer satisfaction about a railway firm on a customer’s share of wallet in a business-to-business context. Interestingly, although advertising is widely assumed—among both marketing scholars and practitioners—to positively affect public transport usage, knowledge on the actual presence and strength of such effects is absent in the marketing literature. This is all the more remarkable given that marketing science has devoted substantial attention to the effects of advertising, promotions, and customer satisfaction on performance outcomes. Researchers have discussed how advertising works (Vakratsas and Ambler 1999) and have assessed short- and long-term effects of advertising on sales (e.g., Sethuraman, Tellis, and Briesch 2011). Similarly, the effects of promotions have been studied extensively (Neslin and Van Heerde 2009), and generally only short-term effects of promotions on brand sales are found. Most of the studies on the effects of advertising and promotions, however, are executed in a consumer packaged goods setting (e.g., Nijs et al. 2001; Van Heerde et al. 2013). Sethuraman, Tellis, and Briesch (2011) clearly show that, in general, services—and certainly transportation services—are neglected in advertising studies. Consequently, meta-analytic findings are not necessarily representative for or applicable to transportation services. The effect of satisfaction on firm performance, in contrast, has been studied in more sectors. Researchers have considered the effects of customer satisfaction on multiple firm performance metrics, including sales and market share (Fornell et al. 1996; Fornell, Rust, and Dekimpe 2010). The effects of customer satisfaction on these latter metrics are not straightforward, as sales growth may create service delivery problems. Such problems could be due to, for example, capacity problems (e.g., Anderson, Fornell, and Lehmann 1994; Rego, Morgan, and Fornell 2013). Studies specifically considering the effects of satisfaction on public transportation usage, in turn, are particularly limited.
Surprisingly, public policy research within marketing has largely neglected public transport as a research context. A search on public transport in the Journal of Public Policy & Marketing resulted in zero studies. Still, public transport is very relevant from a public policy and marketing perspective because it touches on two topics that are central to public policy. First, it deals with sustainability and sustainable behavior (e.g., Iyer and Reczek 2017; Prothero et al. 2011), as using public transport can be considered a sustainable alternative to driving. Second, it deals with consumer and societal well-being (e.g., Anderson et al. 2013; Davis, Ozanne, and Hill 2016). Recently, governments have begun to demand high-quality public transport and satisfied public transport customers, as this will affect societal well-being in many Western countries with developed public transport systems. Therefore, governments have agreements with public transport companies centered on achieving a certain level of satisfaction (Hensher and Houghton 2004; Verhoef, Heijnsbroek and Bosma 2017), with higher satisfaction presumably leading to higher consumer and societal well-being.
Herein, we address (1) the gaps in both the transportation and marketing literature and (2) the observation that public transport has been largely neglected in the public policy and marketing literature. The main research objective of this study is to assess whether and to what extent investing in firm-initiated marketing actions (i.e., advertising and promotions) and improved customer satisfaction can foster more (i.e., repeated) usage (i.e., increased sales) of a public transport service. Acknowledging that investments can have both short- and long-term effects (e.g., Dekimpe and Hanssens 1995), we pose the following main empirical research questions: What are the short- and long-term effects of advertising and promotions on public transport usage in terms of sales? What are the short- and long-term effects of customer satisfaction on public transport usage in terms of sales? What are the potential effects of advertising and promotion on customer satisfaction?
In addition, public transport is characterized by a rather fixed capacity, such that strong increases in usage (sales) may reduce customer satisfaction due to capacity problems (i.e., limited number of seats on a train). We therefore also explore effects of past usage on customer satisfaction. Finally, because usage in our data can be divided into pass-based travel (PBT; subscription based) and individual-trip ticket-based travel (TBT), we explore whether the marketing effects on usage differ between these two usage types, and whether these two types of usage affect each other (i.e., buying individual-trip tickets could induce future subscriptions).
To provide insights on these issues, we analyze a unique longitudinal data set of a major European railway firm, for which we observe the monthly sales, advertising and promotion efforts, and customer satisfaction scores. Insights on the different short- and long-term elasticities are obtained by means of a vector autoregressive (VAR) model. Our results show positive effects of both advertising and promotions. We found no effects of satisfaction, whereas we do observe negative effects of sales on customer satisfaction.
By executing this study, we contribute to the public policy and marketing literature in multiple ways. First, as noted, public transport is a largely neglected but important study context for society. Second, there remains a strong need to understand how sustainable behavior can be stimulated and, specifically, how marketing efforts (i.e., advertising and promotions) can do this (Iyer and Reczek 2017). Third, we address the need to study long-term effects of measures that stimulate sustainable behavior by studying long-term effects of advertising and promotion. Fourth, we answer the call within sustainability research for more longitudinal data using time-series methods (Iyer and Reczek 2017).
Conceptual Background
Public Transport Market
Different degrees of liberalization
Public transport markets differ strongly from many other markets. In Europe, public transport markets have been liberalized (Pham 2013). However, the liberalization of public transport, and specifically trains, has been implemented to different degrees in the European Union. Whereas in some countries there is still a single state-owned monopolist that operates all railway connections (e.g., Société Nationale des Chemins de fer Français in France), in other countries public transport has been more liberalized.
The latter is the case for the Netherlands, where several firms operate trains on specific connections, but there is still one major railway firm operating on the majority of the railway lines. This firm is private, acting fully independently from the state. However, the state still is the only shareholder, having the same rights and power as other (majority) shareholders in other private firms. Because public transport is an important travel mode in the Netherlands, the Dutch government and the Dutch parliament strongly focus on the performance of the major railway firm. The government also made specific agreements with the railway firm for achieving specific service quality and satisfaction targets (e.g., Verhoef, Heijnsbroek, and Bosma 2017).
The United Kingdom is probably the most liberalized country for public transport, with 28 public transport firms running trains. The U.K. situation, however, is really an exception (Pham 2013), and in general, one could argue that public transport, and specifically railway firms, function in monopolistic (local) markets, where direct competition with other railway operators is lacking (see also Mouwen 2015). For example, in our study context the public transport firm operates on all major train connections as well as on the majority of the other (regional) connections; in both cases, no other competitors operate. The competing firms are mainly active on specific regional connections, where they do not face other competitors.
Competition in transport
The situation described previously contrasts strongly with the majority of markets in which the effects of advertising and promotions are studied, where brands typically compete with other brands. As a consequence, competition does not occur at the brand level but at the category or transport mode level. Railway firms compete with other transport alternatives, such as cars, buses, and, in some cases, even airplanes. The fast train connections between Amsterdam and Paris, for instance, compete with airline connections between these two cities. Studies in public transport have therefore mainly considered consumers’ transport choices in which consumers had to state or reveal their preferences for specific transport alternatives (e.g., Hensher and Greene 2002; Hensher, Rose, and Greene 2005). In these models, marketing variables such as advertising are usually not included as predictors of transport choice. Researchers have mainly used travel and transport mode attributes (e.g., travel time, price) as independent variables explaining these choices.
Demand Effects of Firm-Initiated Marketing Actions and Customer Satisfaction
Brand-level (secondary) demand effects
Advertising can reach masses of geographically dispersed buyers at a low cost per exposure through mass media such as television, radio, and print. Promotions include a wide assortment of temporary tools (i.e., discounts, premiums, and coupons) that offer strong incentives to purchase because they invite and reward a quick response (Kotler and Armstrong 2014). In their meta-analysis on advertising elasticities, Sethuraman, Tellis, and Briesch (2011) report an average short-term advertising elasticity of .12, and a long-term advertising elasticity of .24. The authors could not find significantly different elasticities for services compared with goods, which is an important result in our context, as public transport is a service. Short-term promotion effects on the sales of consumer packaged goods are generally much stronger in an absolute sense, with meta-analyses showing short-term elasticities of −3.63 (Bijmolt, Van Heerde, and Pieters 2005), while long-term promotion elasticities are generally very weak or absent (e.g., Nijs et al. 2001).
However, the insights mentioned here are mainly based on the analysis of consumer packaged goods, with some studies also covering service industries or durables (e.g., Quelch and Jocz 2010), but none including public transport. Moreover, the studies also show a great dispersion of effect strength across industries. Thus, the reported meta-analytic results are not necessarily representative for the situation in public transport.
In addition to these meta-analytic studies that summarize the insights on advertising and promotion effectiveness, many studies consider the impact of satisfaction on firms’ financial performance (see, e.g., Gupta and Zeithaml 2006). In general, the idea is that satisfaction works as a customer feedback metric that increases firm performance (see, e.g., De Haan, Verhoef, and Wiesel 2015; Hogreve et al. 2017), but meta-analytic average satisfaction elasticities and specific effects on sales are lacking.
Category-level (primary) demand effects
The aforementioned meta-analytic results are relevant for the brand level (secondary demand); however, in the public transport context, marketing actions should mainly increase primary (category-level) demand (Schultz and Wittink 1976). By doing so, these actions should attract customers from other product (transport mode) categories functioning as alternatives for the studied public transport. Although advertising is known to have some primary demand effects, the secondary demand effects are generally much stronger (e.g., Bell, Chiang, and Padmanabhan 1999; Leone 1983). Leeflang and Reuijl (1985) report primary demand effects in the cigarette market, which was complemented by a meta-analysis by Andrews and Franke (1991) showing a mean price elasticity for cigarette demand of −.36. Nijs et al. (2001) report that promotions have a short-term effect on primary (category) demand but that long-term effects are generally absent. Thus, promotions may attract consumers to the category and increase the purchase volume of (existing) users, but it is unlikely that the sales boost will be permanent.
To the best of our knowledge, there is no strong evidence for primary demand effects of satisfaction and other attitudes. Prior research has suggested that satisfaction should increase customer retention and service usage (e.g., Bolton 1998; Bolton and Lemon 1999). Although retention will not foster primary demand, service usage increases can lead to primary demand increases because the average usage per customer will increase. Research on satisfaction has shed some light on secondary demand effects by considering the relationship between satisfaction and market share. Empirical results here are mixed and even suggest negative relationships (Anderson, Fornell, and Lehmann 1994; Rego, Morgan, and Fornell 2013)—for instance, capacity constraints that may induce lower satisfaction levels (i.e., longer waiting times for service desk).
We summarize our conceptual reasoning in Figure 1. In this figure, we show that we study both PBT and TBT as sales metrics. We discuss these metrics in more detail in our “Methodology” section (see also Table 1). Overall, existing research in marketing suggests that the effects of advertising and promotions on primary demand (for public transport) should be relatively low compared with most frequently reported secondary (brand) demand effects, and might not even be present at all. Beyond that, the effect of customer satisfaction on primary demand is unclear and could even be negative.

Conceptual framework.
Overview of Included Variables.

Notes: All variables are time varying, allowed to change from period t − 1 to t.
Effects of Firm-Initiated Marketing Actions and Customer Satisfaction in Public Transport
Effects of firm-initiated marketing actions
The previous discussion mainly takes a general demand perspective, but could a case be made that demand effects in public transport are different? Firm-initiated marketing actions can potentially attract more travelers. First, advertising may create more awareness, a stronger attitude, and a resulting stronger preference for public transport. Second, promotions—being mainly temporary price reductions—may create more temporary demand because the price is reduced. However, as we have noted, consumers have to choose between different travel alternatives. Some of these choices can be rather ad hoc (i.e., how to travel to a city for a museum visit), whereas others have long-term consequences, specifically when it involves investments in transport modes. For example, when consumers purchase a car for their daily travels (i.e., commuting), they are less inclined to switch to another alternative. An explanation for this could be that for consumers who already own a car, the relative (generalized) cost of using a car for their next trip to work (or any place) is more likely to be below that of other modes than for those who do not own a car (as the latter would still have to rent a car). Similarly, when customers purchase a subscription for public transport, they will be less likely to switch to nonpublic transport alternatives. In summary, there are strong switching costs for many consumers, which make it unlikely that consumers will easily switch between transport alternatives, at least in the short run (Klemperer 1995). In the longer run, these switches could be more likely, because subscription contracts end, cars can be sold, and so on. Due to these high short-term switching costs, sales effects of firm-initiated marketing efforts could be even lower.
These observations are to some extent confirmed in Holmgren’s (2007) meta-analysis on price elasticities of public transport demand. In this meta-analysis, he finds an average public transport price elasticity of −.38, which is in line with the oft-quoted public transport price elasticity of −.3 (e.g., Bresson et al. 2003; Webster and Bly 1980) and also much lower than the average overall meta-analytic price elasticity found in marketing (−2.65; Bijmolt, Van Heerde, and Pieters 2005). Holmgren does, however, report stronger long-term price elasticities than short-term elasticities, which is in line with our discussion that adjustments of consumer travel behavior take some time. In summary, it is our contention that effects of advertising and promotions on primary demand for public transport alternatives are likely to be lower than in other industries.
Effects of customer satisfaction
In general, one might assume that greater satisfaction increases sales, as consumers become more loyal (more repeat sales) and promote public transport to others (word of mouth) (Gupta and Zeithaml 2006). However, public transport could also suffer from a similar potential negative relationship between satisfaction and sales as we observed for other services (Anderson, Fornell, and Lehmann 1994; Mouwen 2015). Public transport firms will have strong capacity constraints, because the available capacity (i.e., trains) is fixed, and acquiring new capacity takes time (i.e., years).
Firm-Initiated Marketing Actions–Satisfaction Effects
Firm-initiated marketing efforts may also affect attitudes and, in our study, satisfaction. Satisfaction can be considered the outcome of a post hoc comparison between expected and perceived service performance, as it is formed after the actual service experience. Expectations are likely to increase as a consequence of firm-initiated marketing actions such as advertising (e.g., Zeithaml, Berry, and Parasuraman 1993). Similar levels of actual delivered performance will thus likely result in more negative expectancy disconfirmation. This, in turn, implies a negative effect of advertising on satisfaction. However, advertising may also build stronger brands that receive more positive evaluations of similar actual service performance (e.g., Keller 1993), thus having a positive effect on satisfaction through higher perceived service performance.
Similarly, promotional actions may, on the one hand, increase satisfaction through the idea of obtaining a better deal (value for money) and, on the other hand, decrease satisfaction through lowered brand equity with resulting lower evaluation of a similar service performance (Keller 1993). We therefore explore the effects of advertising and promotions on customer satisfaction in our context with no strong prior expectations.
Data and Preliminary Insights
Empirical Context
To provide insights on the questions raised in the previous section, we have access to a unique data set provided by a major European railway firm that wishes to remain anonymous. This railway firm is privatized but the government is the sole shareholder, and they agreed on specific service quality and satisfaction targets to be achieved.
The data set is composed of monthly data on public transport usage, travelers’ satisfaction, and firm-initiated marketing actions and covers nearly three years, from April 2007 through the end of October 2009. 1 Note that the studied firm operates the major train lines within the studied country, as well as the majority of smaller lines. We use the aggregated sales data for all the operated train connections excluding international connections. Thus, we do not study one specific train connection.
The firm changes the price per traveled kilometer once a year (January 1). Consequently, there is very limited price variation in the data. Price variation may occur due to the use of some temporary price discounts, which we capture in our promotion variable. However, the relative price and resulting attractiveness of public transport may change because of changes in gasoline prices (for insights on the gasoline price–public transport usage link, see, e.g., Holmgren [2007]; Lane [2010, 2012]; Pucher [2002]; Wang and Skinner [1984]). We therefore augment this data set with data on the gasoline price evolution in the same period, thus adding information on the most obvious alternative transport mode for the operator under investigation: cars. 2 Table 1 provides an overview of the included variables and operationalizations.
Public Transport Usage and Customer Satisfaction
Public transport usage is defined by two measures. The first measure covers, on a monthly basis, the total cumulative distance traveled by customers using single or round-trip one-time tickets (TBT). It thus mainly covers occasional and irregular ad hoc traveling, and it accounts for 52% of the total distance traveled. The second measure covers, on a monthly basis, the total cumulative distance traveled by customers using multiple-trip monthly or yearly passes (PBT). It can thus be regarded as a measure that covers regular and repeated traveling, and it accounts for 21% of the total distance traveled. As such, these two measures reflect different travel motives. Whereas the second measure will mainly be driven by commuting (fixed-trajectory home-work journeys), the first measure is likely to depend more on leisure and other occasional motives. Such occasional and leisure traveling could, in addition, be hypothesized to be a first step in a stepping-stone sequence of convincing people to also use public transport on a daily basis for commuting. The remaining distance traveled is, for the most part, covered by a special student travel card (25% of the remaining 27%). Given the specific nature of this card and its users, who often have less access to alternative modes of transport such as cars, we do not include this type of traveling in our analyses.
We measured customer satisfaction (CSAT) through the following survey question: “What is your general opinion/judgment about traveling per train?” The respondents answered this question on a ten-point scale (1 = “could not be worse,” 2 = “very bad,” 3 = “bad,” 4 = “very inadequate,” 5 = “inadequate,” 6 = “sufficient/satisfactory,” 7 = “more than sufficient/satisfactory,” 8 = “good,” 9 = “very good,” and 10 = “excellent”). The railway firm has used this survey question for years to measure customer satisfaction (Gijsenberg, Van Heerde, and Verhoef 2015). In the past, customer satisfaction has frequently been measured with multi-item scales (e.g., Tsiros and Mittal 2000). Nevertheless, although this might not be the perfect measure for customer satisfaction, when using available firm data, prior studies have also used single items, a strategy commonly used in practice to reduce survey length (e.g., Bolton 1998; Van Doorn and Verhoef 2008). Satisfaction measurement is based on repeated cross-sections (e.g., Dekimpe et al. 1998; Fornell, Rust, and Dekimpe 2010; Srinivasan, Vanhuele, and Pauwels 2010). On a monthly basis, a representative sample of over 6,000 customers is surveyed while riding on the train, covering the totality of the national network. Interviewers thereby apply quota sampling, thus ensuring that the sample reflects the actual composition of the overall traveler/customer base. Once the target number for a certain segment of travelers is reached, no additional travelers from those segments are surveyed in that month. In addition, interviewers strive for an optimal distribution of surveyed travelers in each customer segment over the month, thus ensuring that ratings are not based on the idiosyncrasies of, for example, one specific week with bad weather. The resulting national average satisfaction rating with the operational service performance across this sample is the satisfaction score for that month.
Figure 2 shows the evolution of both public transport usage measures and customer satisfaction 3 over time. The solid black line depicts the cumulative distance traveled with passes, and the dashed black line represents the cumulative distance traveled with tickets. The solid gray line shows the evolution in customer satisfaction. Correlations between CSAT and PBT and between TBT and PBT are small and insignificant (.005 and −.067, respectively). However, stronger CSAT is associated with more TBT, with the correlation between both series equaling .403.

Public transport usage and customer satisfaction evolution.
Firm-Initiated Marketing Actions
The firm uses two major types of firm-initiated marketing-mix actions to foster public transport usage: advertising and promotional actions. Advertising (Advertising) is defined in monetary terms, the amount of euros spent on advertising campaigns in each month. Promotional actions can be classified into two categories: retailer promotions (RetPromo) and own promotions (OwnPromo). Retailer promotions are mainly targeting leisure travelers, offering them discounts on single- or round-trip tickets or special day-trip packages. As such, these promotions cover only TBT. Own promotions are targeted at pass holders and consist of special deals, discounts or other additional offerings. These promotions thus cover both offerings on TBT and on PBT.
Figure 3 shows the evolution of public transport usage and firm-initiated marketing actions. As in Figure 2, the solid black line depicts the cumulative distance traveled with passes, and the dashed black line represents the cumulative distance traveled with tickets. Light gray bars indicate months with retailer promotions, whereas dark gray bars indicate months with own promotions. The dotted line represents advertising expenditures. Correlations between advertising and both usage measures are small and insignificant (PBT: .136; TBT: .047). 4 A two-way ANOVA with interaction showed significant positive main effects of both retailer (p < .01) and own promotions (p < .01) on TBT, but no significant interaction effect (p = .212). As such, there are indications of a positive relation between the two types of promotions and occasional public transport usage, but effects are independent of each other. However, for PBT, we found no significant relations when not accounting for other influencing factors.
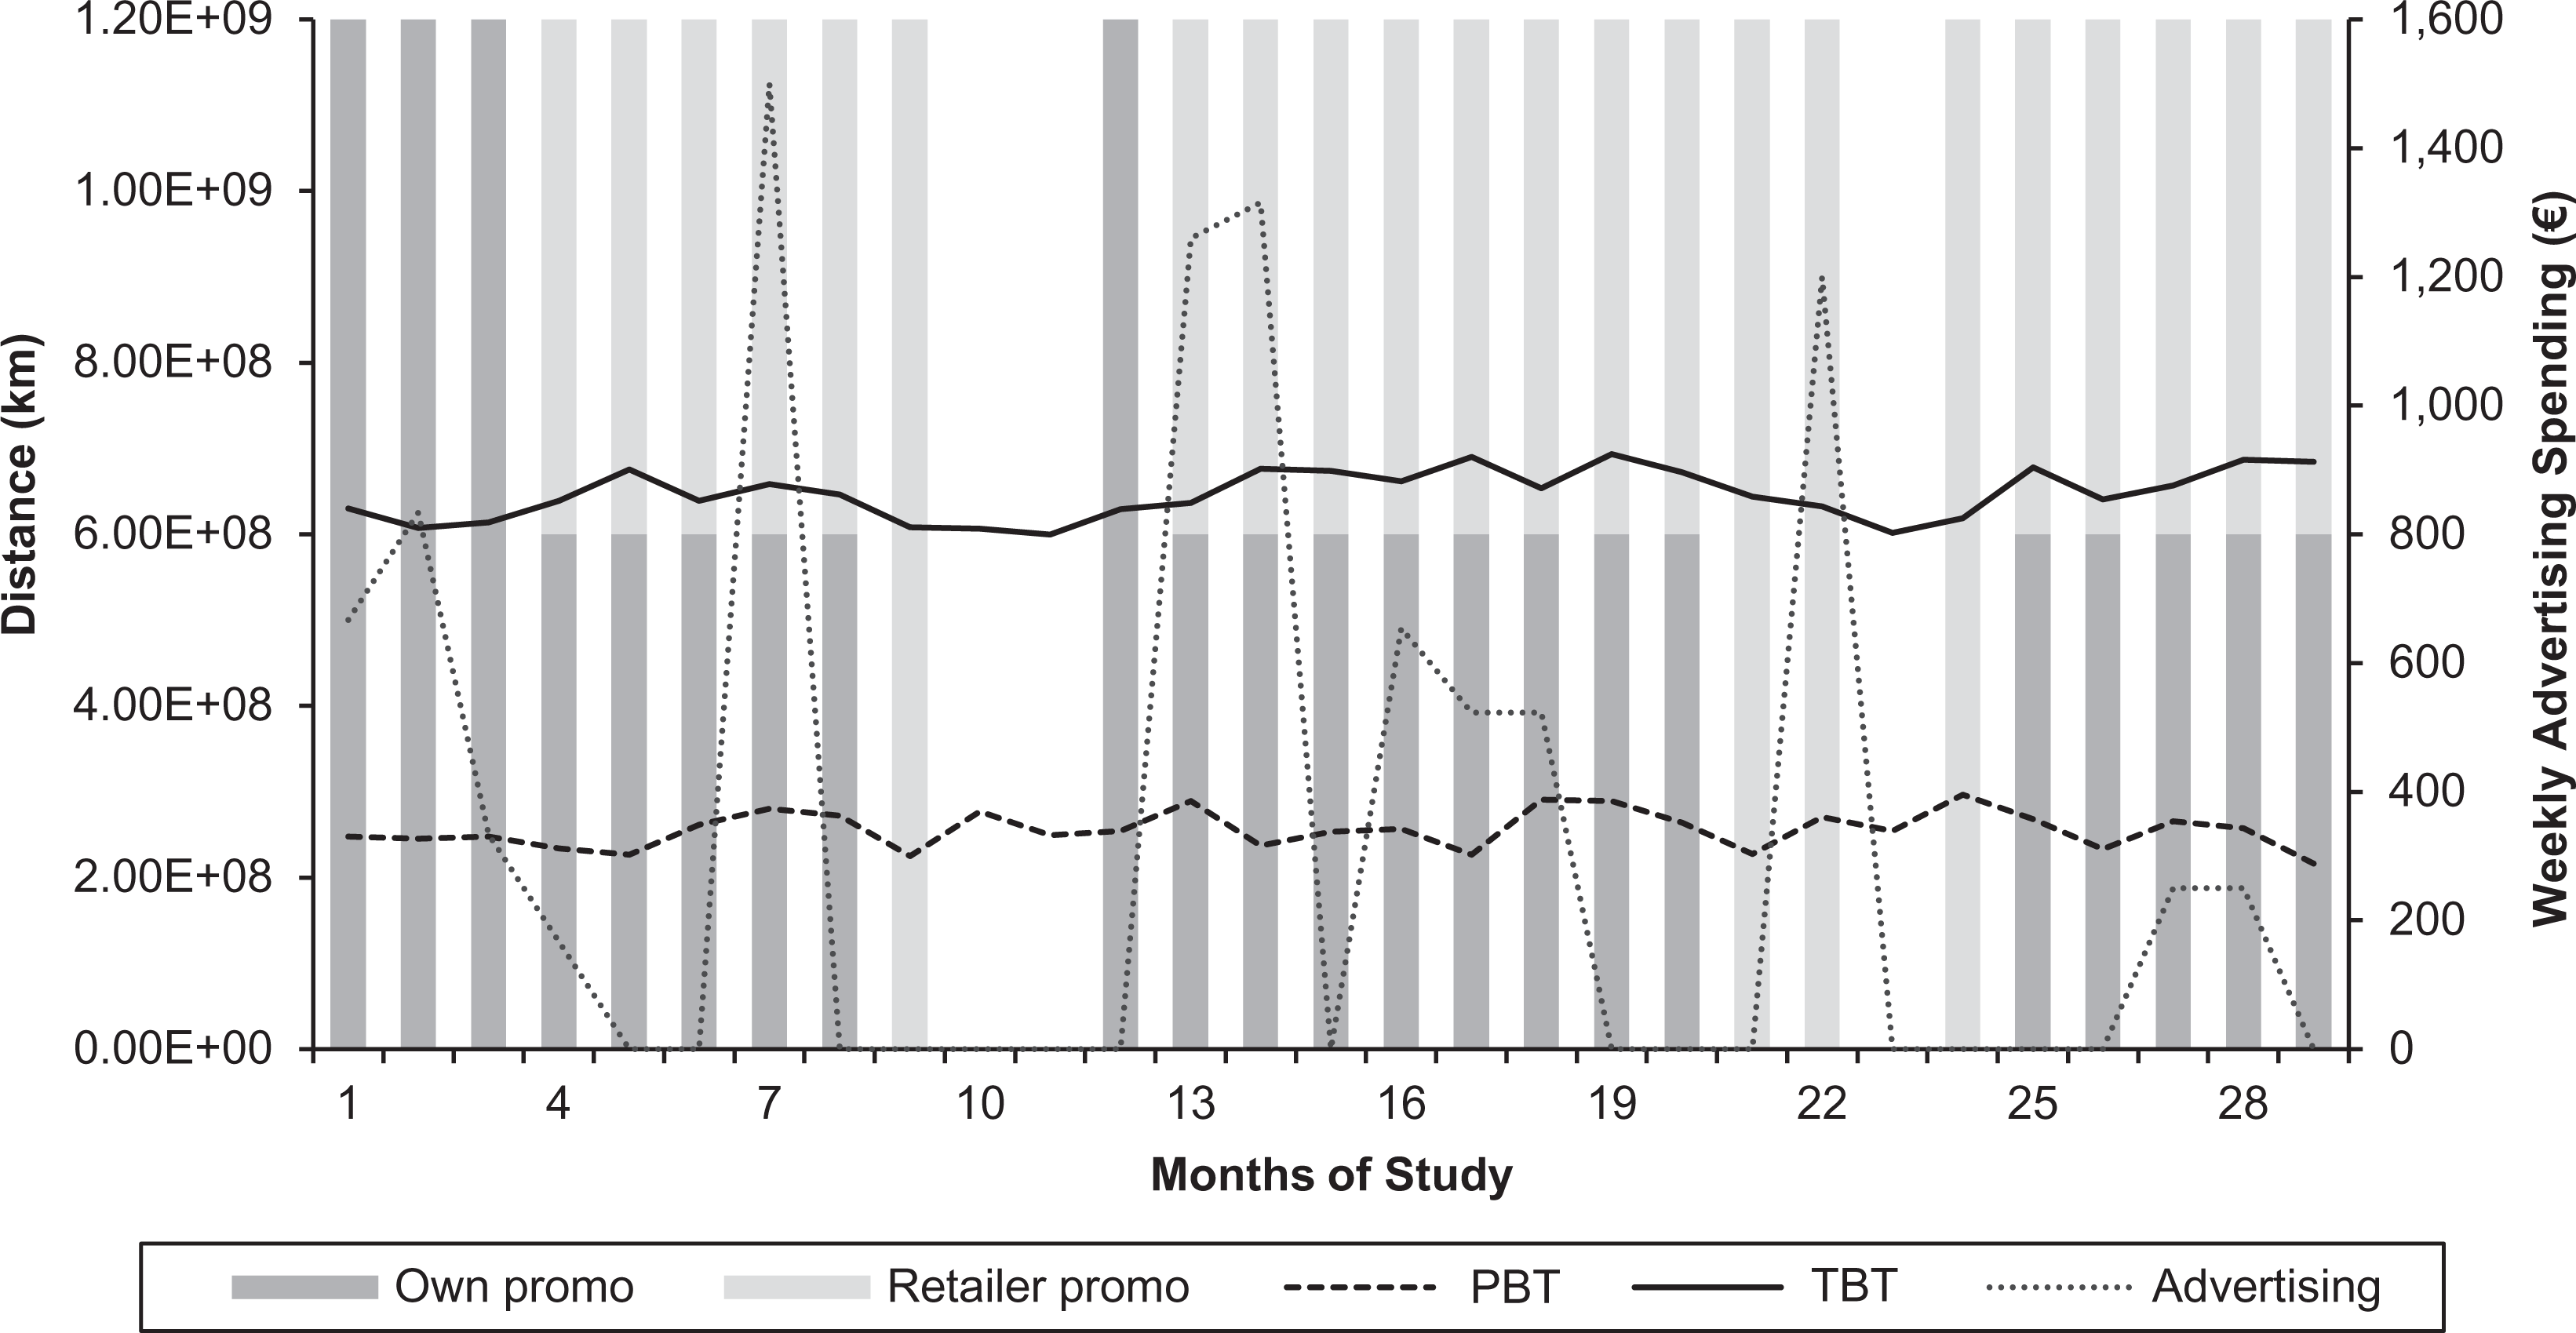
Public transport usage and firm-initiated marketing actions.
Methodology
To analyze the data presented in the previous section, we must take several steps. We first define the adstock variable, which allows us to trace the cumulative effects of advertising actions. We then investigate the stationarity of the different time series and assess which variables could be influencing each other. Subsequently, we formulate a flexible model to capture the marketing-mix action effects and any feedback, carryover, and spillover effects between the different types of traveling. We discuss the estimation procedure and show how we determine both short-term and long-term effects. In our analyses, we log-transform the data series because this allows us to interpret the effects as elasticities. Such log-log functional form models, in addition, have been shown to be very effective in capturing decreasing returns to marketing-mix investments (for a discussion about applications of this functional form in scholarly marketing research, see, e.g., Hanssens, Parssons, and Schultz [2001, p. 102]; Leeflang et al. [2015, p. 41]). Table 2 provides an overview of the different methodological steps.
Overview of Methodological Steps.
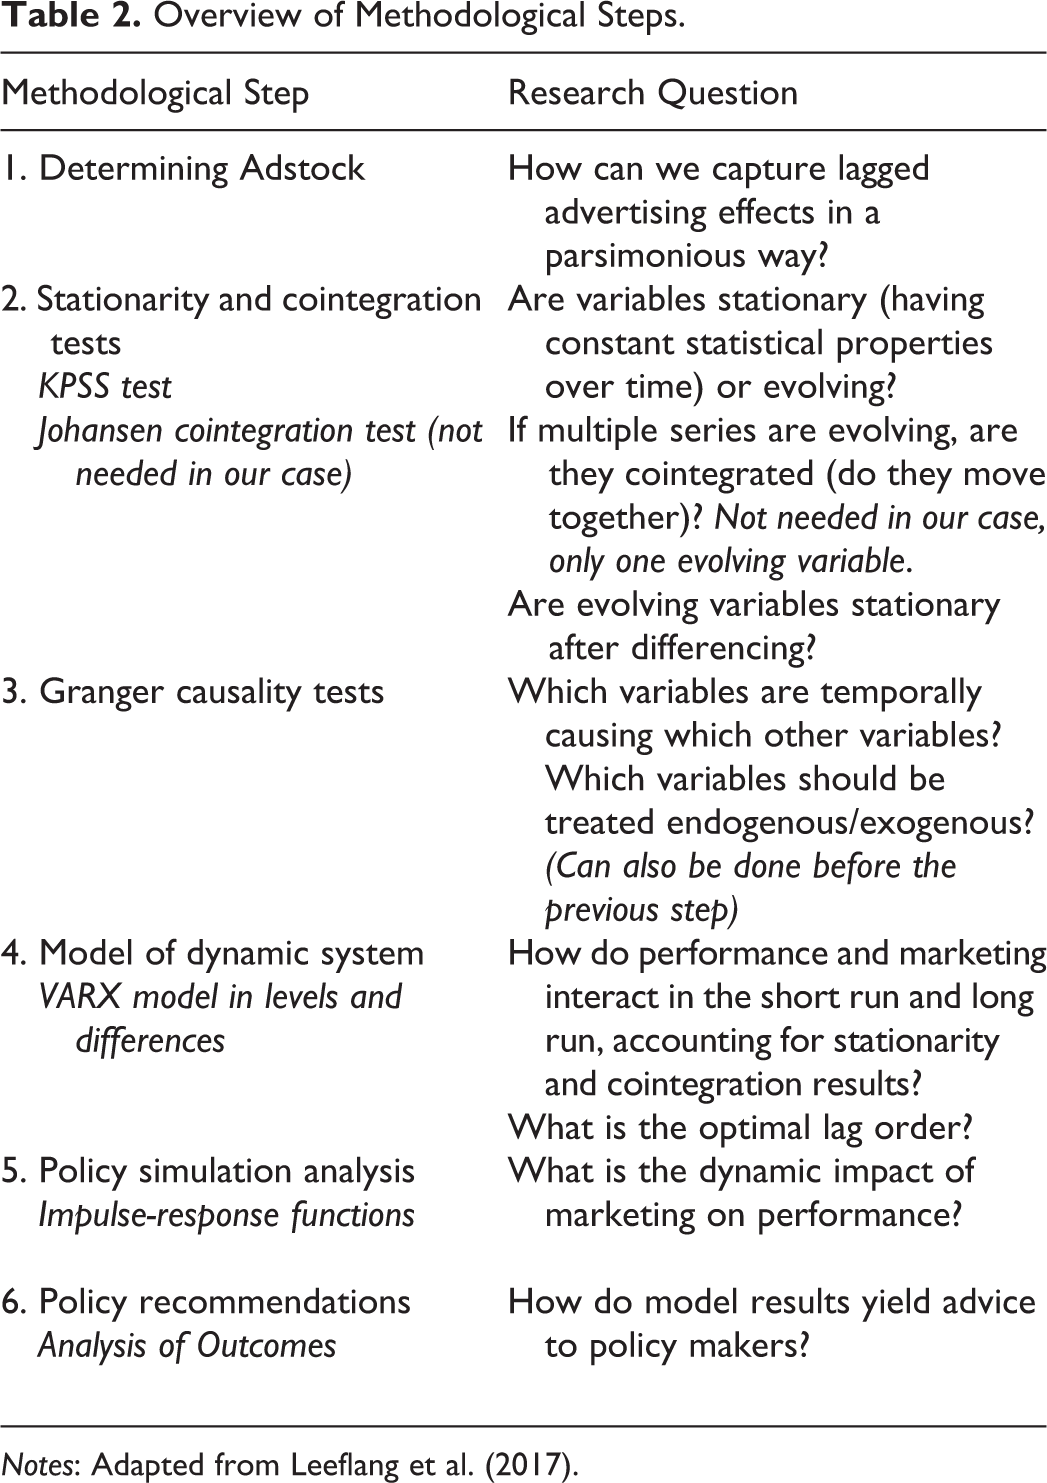
Notes: Adapted from Leeflang et al. (2017).
Defining Adstock
We analyze the effects of advertising through a parsimonious metric called adstock (Adstock), the cumulative discounted advertising expenditures (e.g., Broadbent 1979, 1984; Ephron and McDonald 2002). The basic idea behind this measure is that, by means of advertising, a firm builds up a goodwill stock in customers’ mindset. When no new advertising is added, this stock will gradually deplete over time. When new advertising is added, it will be replenished. We specify adstock in the following way (see, e.g., Hanssens et al. 2001):

where the first part of the right-hand side represents the buildup of adstock, and the second part represents the gradual decay as the carryover parameter λ is smaller than 1. Building on previous research, we set this parameter for our monthly observations equal to the meta-analytic value of .775, as reported by Leone (1995). 5
Determining Stationarity
Before specifying any time series model, a crucial step is determining whether the included time series are stationary or show a unit root (e.g., Dekimpe and Hanssens 1999). To assess the stationarity of the series, we analyzed the series with the Kwiatkowski et al. (1992) test, including an intercept and trend. Results show that we cannot reject the null hypothesis of (trend) stationarity at even the 10% level for both the PBT and TBT series as well as for the adstock and gasoline price series. For the CSAT series, however, we reject the null hypothesis at the 5% level and conclude that this series is evolving. Drawing on these results, we include the PBT, TBT, adstock, and gasoline price series in levels, and the CSAT series in first differences. 6 Retailer promotions and own promotions are specified as dummy variables equaling one when such action was present during that month and zero otherwise.
Model Specification
Vector autoregressive (VAR) models, relating a vector of variables to its own past and possibly other exogenous drivers, provide us with flexible tools to address the following model challenges: the model should accommodate dynamic effects of firm-initiated marketing actions on the two travel variables (PBT and TBT); it should allow for carryover and spillover effects of these two variables and feedback effects through customer satisfaction CSAT; and finally, it should control for seasonal effects and possible trending behavior. We model the carryover, spillover, and feedback effects by treating PBT, TBT, and CSAT as endogenous variables. As such, these variables are explained by their own past and the past of the other endogenous variables. Firm-initiated marketing actions (i.e., adstock, retailer promotions, and own promotions), in turn, are specified as exogenous variables. The transport provider decides on its advertising and promotion agenda before the start of the year. As such, these actions are not affected on a monthly basis by performance in terms of cumulative distance traveled or customer satisfaction in the previous periods and could therefore be considered exogenous. Formal Granger causality tests allowing for up to nine lags confirmed this exogeneity. Thus, although conceptual arguments for the endogeneity of these decisions—setting advertising and promotional budgets with certain demand in mind—could be made, the data refute this. 7 Finally, through the carryover and spillover effects, the full effect of one-time firm-initiated marketing actions on the travel and satisfaction variables will go beyond the immediate effects.
Public transport usage is a typical seasonal product, with different evolutions for commuting and leisure traveling. Whereas commuting will be lower during the summer season, leisure traveling is likely to reach its peak at that time. Seasonality thus follows relatively regular cyclical patterns over the year. We can control for these seasonal influences on the endogenous variables in a parsimonious way by including sine and cosine functions. We thus specify the following variables:


Instead of estimating 11 monthly or 3 quarterly parameters, we estimate only 2 parameters. Finally, we add a deterministic trend to the equations to control for possible upward or downward trends and include the gasoline price to account for the change in costs of the car as a transport alternative. The resulting VAR model with exogenous variables (VARX) is specified as


where
The error terms follow a multivariate normal distribution with variance–covariance matrix
When VAR models are specified properly, they can be estimated using simple ordinary least squares (OLS) per equation (see, e.g., Greene 2003, p. 588). A downside of VAR models is that they easily suffer from overparameterization, with each included lag adding multiple parameters to be estimated, a burden that increases the more endogenous variables are included. Determining the optimal lag order I is consequently an essential step. We therefore allowed for up to three lags (one quarter of a year) of the endogenous variables in our model and determined the lag order on the basis of the Bayes information criterion (BIC) of the full model. The optimal BIC was reached for a model containing one lag of the endogenous variables. 8 Because dynamic effects of advertising are captured by the carryover structure implied in the adstock specification, and because promotions are known to have very limited lagged effects (especially given monthly data), we do not explicitly include any lagged marketing variables in the model. Our final model thus contains 3 endogenous variables and 11 variables (including the intercept) in total for each equation. This parsimonious specification allows us to save degrees of freedom. 9 While the observations-to-parameters ratio is on the small side, real issues should be reflected in the basic OLS estimates. 10 These results, however, already show many significant effects, with effect sizes in line with the outcomes of the simulation presented next.
Model Estimation Procedure
Starting from the basic OLS estimates of the model, we adopt a Monte Carlo simulation approach as introduced by Mark (1990) and used by Dekimpe and Hanssens (1999), among others. In a first step, we carry out the basic estimation and estimate our VARX model using OLS per equation, which provides us with
Short- and Long-Term Effects
We define short-term effects as the immediate effects of changes in one variable on the three dependent variables. Short-term effects of adstock, retailer promotions, and own promotions can be derived directly from the model, as they are the parameter estimates obtained from the model for these variables. Short-term feedback effects, however, are derived from the residual variance–covariance matrix
In addition to offering insights on immediate short-term effects, VARX models also allow for the tracking of the over-time impact of changes (shocks) by means of impulse-response functions (IRFs). Such impulse-response functions consist of two forecasts of the dependent variable (in our case, the focus is on PBT and TBT), the first based on an information set without the shock, and the second based on an information set that includes this shock. The difference between the two forecasts indicates the incremental effect of the shock to the dependent variable. We calculate the shocked series by extending the approach for the short-term effects introduced previously. Instead of only looking at the immediate impact of the shocks, we also track their impact over time. This over-time impact of shocks is based on the dynamics of the model and the lagged effects of the endogenous variables. We apply the same Monte Carlo simulation approach to judge the significance of the effects, using 90% and 95% confidence intervals (see, e.g., Villanueva, Yoo, and Hanssens [2008], who use significance levels of .05 and .10). This approach is considerably stricter than the usual one-standard-deviation confidence interval used in most other studies (e.g., Nijs et al. 2001; Pauwels et al. 2004; Steenkamp et al. 2005). As such, long-term findings can be considered conservative.
Because the PBT and TBT series, the series of focal interest, are both stationary, no persistent effects exist. Consequently, IRFs will ultimately converge to zero. To assess the long-term effects, we therefore examine the cumulative effect of the shocks over the first 12 months after the shock, as expressed by the sum of the individual IRF coefficients during this period (see, e.g., Villanueva, Yoo, and Hanssens 2008). This cumulative interpretation of the long-term effect, in addition, shows strong resemblance to the interpretation of the long-term effects in error-correction models with stationary series (e.g., Gijsenberg 2014; Van Heerde et al. 2013). As with the short-term effects, long-term effects can be interpreted as elasticities (e.g., Nijs et al. 2001; Pauwels et al 2004; Steenkamp et al. 2005).
Results
Model Diagnostics
Before presenting the results of the model, we first provide insights on model fit. We discuss full-sample diagnostics for our focal model and two alternative models. The first alternative model does not allow for lagged effects of advertising through an adstock specification but only focuses on same-period advertising. The second alternative model treats the advertising and promotion actions as endogenous and allows for one lag of these variables. 13 We evaluate these models on the basis of their Akaike information criterion (AIC), BIC, and mean absolute percentage error (MAPE). Diagnostics are based on the median parameter outcomes from the Monte Carlo simulation. In our discussion, we focus on the statistics for the PBT and TBT equations, the focal outcome measures of this study. Table 3 presents the fit statistics.
Full Sample Diagnostics for PBT and TBT Equations.

Not accounting for the lagged effects of advertising clearly hampers the quality of the model, as both AIC and BIC of the first alternative model deteriorate compared with the focal model (first alt. model: AICPBT = −4.988 and AICTBT = −7.144 vs. focal model: AICPBT = −5.175 and AICTBT = −7.186; first alt. model: BICPBT = −4.465 and BICTBT = −6.621 vs. focal model: BICPBT = −4.651 and BICTBT = −6.663). The MAPE deteriorates (increases) as well (first alt. model: MAPEPBT = .234% and MAPETBT = .076% vs. focal model: MAPEPBT = .220% and MAPETBT = .075%). Allowing for endogenous advertising and promotion decisions, in turn, does not add value to the model; indeed, the AIC, BIC, and MAPE deteriorate even further (second alt. model: AICPBT = −4.611 and AICTBT = −6.588 vs. focal model: AICPBT = −5.175 and AICTBT = −7.186; second alt. model: BICPBT = −4.087 and BICTBT = −6.065 vs. focal model: BICPBT = −4.651 and BICTBT = −6.663; second alt. model: MAPEPBT = .285% and MAPETBT = .104% vs. focal model: MAPEPBT = .220% and MAPETBT = .075%).
Figures 4 and 5 show the full sample forecasts of our focal model and the two alternative models for the (log-transformed) PBT and TBT, respectively. These figures confirm that treating the advertising and promotion decisions as exogenous, thereby accounting for lagged effects of advertising through the adstock specification, provides superior model performance.

Full-sample predictive performance for PBT.

Full-sample predictive performance for TBT.
Substantive Insights
Table 4 presents the estimation results of the focal model. For each of the equations, we report the median values for the different parameters, as well as the 95% confidence intervals. Table 5 presents insights on the short- and long-term effects of firm-initiated marketing actions on public transport usage and on possible feedback effects through satisfaction based on the model results in Table 4.
Model Results.

n.s.0 is included in the 90% confidence interval.
*0 is not included in the 90% confidence interval.
**0 is not included in the 95% confidence interval.
Short- and Long-Term Effects.

ns0 is included in the 90% confidence interval.
*0 is not included in the 90% confidence interval.
**0 is not included in the 95% confidence interval.
Firm-initiated marketing effects on transport usage
Advertising has a positive immediate effect on PBT (Mdn = .074). Interestingly, the elasticity value is nearly 40% smaller than the previously reported meta-analytic average advertising elasticity value of .12 (Sethuraman, Tellis, and Briesch 2011) but is considerably stronger than recently reported values of short-term advertising elasticities of fast-moving consumer goods (e.g., Ataman, Van Heerde, and Mela 2010; Gijsenberg 2014; Van Heerde et al. 2013). Although immediate effects are relatively strong, long-term effects are considerably weaker (Mdn = .034) as a consequence of a postadvertising dip. For TBT, we found no significant short-term effects. Long-term cumulative effects, however, are significant with an elasticity of .013. Retailer promotions, aimed at occasional and mostly leisure-oriented traveling, show significant short-term (Mdn = .033) and long-term (Mdn = .028) TBT elasticities, demonstrating these actions’ success in attracting additional occasional travelers. As could be expected, we found no significant effects on PBT. Own promotions, covering both PBT and TBT actions, are successful in increasing both types of travel. Own-promotion effects on PBT are the strongest of all marketing action effects, with elasticities equaling .202 (short run) and .121 (long run), while elasticities for TBT reach values of .062 (short run) and .043 (long run). These results show that firm-initiated marketing actions can indeed be useful in (temporarily) increasing the usage of public transport for both leisure and commuting goals. Both retailer and own-promotion elasticities are, however, much weaker than generally reported.
Feedback effects on public transport usage
Satisfaction with the service does not have immediate effects on either of the two types of travel. However, it does have a marginally significant negative effect on PBT: a positive change in satisfaction decreases PBT. Because the PBT series does not have a unit root, these negative effects are transient and do not persist over time.
Firm-Initiated Marketing Actions and Satisfaction
In the previous section, we reported the negative long-term effect of satisfaction on PBT. Analysis of the drivers of satisfaction sheds light on what may be behind this effect. Whereas own promotions have a positive effect on the number of PBT, they significantly lower satisfaction, with a short-term elasticity of −.013 and a long-term elasticity of −.011 (the 95% confidence interval does not include zero). Similarly, the cosine component, reaching high values during winter months and low values during summer months, has a positive effect on the number of PBT (most commuting occurs during winter, and least occurs during summer months with holidays) but a negative effect on satisfaction. More importantly, as the CSAT series is not stationary, these effects are not transient but persist over time.
The negative effects on satisfaction are likely driven by three factors. First, increased commuter usage of public transport during peaks lowers satisfaction because commuters are, on a daily basis, confronted with more crowded trains. The comfort of traveling may then be reduced, as seating availability diminishes (Verhoef, Heijnsbroek, and Bosma 2017). Because capacity is fixed, the focal firm cannot use more trains to decrease the crowdedness. Second, during peaks, the transport provider is catering to a broader range of customers, with the additional commuters likely showing a lower satisfaction a priori (e.g., Keiningham et al. 2014). Finally, during winter months, the firm suffers regularly from serious drops in its operational service performance level. Such crises have been shown to have strong and enduring negative consequences for customer satisfaction (Gijsenberg, Van Heerde, and Verhoef 2015). This reasoning is also in line with findings by Mouwen (2015) of positive effects of vehicle tidiness, ease of boarding, seating capacity (all under pressure during peaks) and on-time performance and travel speed (both under pressure during winter months) on travelers’ satisfaction. Thus, the negative effect of increases in satisfaction on number of PBT should be interpreted in the opposite direction. Decreases in satisfaction happen during periods in which commuting usage of public transport is at its peak. As such, both the firm and the commuters face an infernal feedback loop, with higher usage associated with lower satisfaction, but because commuters often have no real alternatives (e.g., no cycling during winter, roads not being cleared), still higher usage.
Robustness Checks
We executed multiple robustness checks to assess the stability of our results. We hereby summarize the results of these checks. More detailed results are available in Web Appendix B.
First, following previous literature, we have fixed the carryover parameter to the meta-analytic value of .775 (Leone 1995). We therefore performed a sensitivity analysis by allowing this parameter to vary from .500 to .950 with steps of .050. Although effect sizes of advertising actions somewhat changed (as could be expected), the substantive insights from these models were very similar, and the effect sizes of promotional actions were hardly affected. In addition, the explanatory power of these models was (at best) as good as that of the focal model, which has an average R2 of .686 across the three equations.
Second, in our focal model, we did not account for price effects given limited variation in price. However, because prices can be changed at the beginning of each year, we include year dummies to account for potential price effects. We thus had to exclude the trend variable due to severe multicollinearity with these year dummies. Results indicate that substantive insights are similar here as well. The effect sizes of promotions changed somewhat, but the relative effects—stronger effects for own promotions compared with retailer promotions, and for own promotions on PBT compared with TBT—remain. This model, in addition, shows slightly lower explanatory power than our focal model, with an average R2 across the three equations of .675 compared with .686 for our focal model.
Third, our focal model includes satisfaction as a customer feedback metric, which can be considered a mindset metric. However, one could argue that we should also test for other mindset metrics that could ultimately affect people’s transport choice. We therefore replaced satisfaction with (1) top-of-mind awareness (the extent to which the service offered by this public transport firm was the first option a person would think of with regard to a specific travel goal, averaged over a set of travel goals), (2) aided awareness (the extent to which a person recognizes the public transport firm from a list of transport options), and (3) the extent to which the firm is considered a reliable choice for traveling. In all cases, substantive insights on the effectiveness of advertising and promotional actions as tools to increase the use of public transport were similar. However, both explanatory power and fit were worse for these models with regard to the PBT and TBT equations 14 : average R2with across the two equations of .704, .710, and .703 compared .752 for our focal model, and average MAPE across the two equations of .156%, .155%, and .156% compared with .147% for the focal model. As such, these measures do not reflect the relevant actual experience aspect included in the satisfaction measure that provides valuable information.
Fourth, we estimated our model without the log-transformation of the variables. Effects are therefore no longer interpretable as elasticities, and possible diminishing returns to advertising, for example, are no longer accounted for. Here as well, substantive insights, also with regard to the relative effectiveness patterns, were very similar. However, explanatory power and model fit worsened: the average R2 across the three equations was .543 compared with .686 for our focal model, and the average MAPE across the PBT and TBT equations was 3.296% compared with .147% for the focal model.
Fifth, although our data set is unique (because time-series data are scarce in these industries), it is relatively limited in its number of observations. To evaluate the extent to which our findings could be affected by the time span of our data set, we reestimated the model on a series of reduced data sets. We therefore omitted up to three observations (10% of the data). We applied each of these reductions twice: once by omitting the last observation(s) in the series, and once by omitting the first observation(s). Overall, substantive insights were in line with the focal model, and results deviate more when we leave out more observations. Across the different models, on average, 54% of the estimates have 95% confidence intervals that do not contain zero, which is comparable to the 58% of the focal model.
As a final robustness check, we investigated the extent to which our findings could be affected by using a nonparametric percentile-based approach to judge the significance of the results instead of the more traditional econometric approach using means and standard deviations (e.g., Dekimpe and Hanssens 1999). We therefore calculated the means and standard deviations of the estimated short- and long-term effects and judged their significance by means of a standard t-test, using significance levels of 5% and 10%. Findings of both approaches are in line with each other, with regard to both the effect sizes and the significance of the effects.
From these results, we can conclude that, overall, our substantive model results seem robust to different model specifications and significance testing approaches.
Additional Insights: The Impact of Economic Conditions on Public Transport Usage
In the focal model specification, we account for a time trend and seasonal influences on the usage of public transport. However, it is not unlikely that the overall state of the economy can also have an impact on demand for and usage of public transport. 15 Economic downturns can mitigate job-related commuting because of lower economic activity while also reducing expenditures on leisure travel. At the same time, such downturns may put so much pressure on household budgets that cars become too expensive, thus forcing people into using public transport (substitution effect). The data frame we use, lasting from April 2007 through October 2009, includes the 2008 global financial crisis, the strongest economic decline since the Great Depression of the 1930s. Although the Organisation for Economic Co-operation and Development reports that the public transport provider we study experienced an economic expansion until the first quarter of 2008, the economy soured after this peak to reach its trough in the third quarter of 2009, after which it recovered again.
To obtain insights on the impact of macroeconomic conditions on the usage of public transport, we followed previous research in marketing and derived the business cycle component of the gross domestic product series by means of the Christiano and Fitzgerald (2003) random-walk filter (for a recent application in marketing and a more elaborate discussion on this filtering procedure, see, e.g., Van Heerde et al. [2013]). We then added this component to our model. Severe multicollinearity, however, required the removal of the trend from our model. Overall, our findings are robust to this modified model specification. 16 The business cycle shows a strong negative effect on both PBT and TBT. The substitution effect thus appears smaller than the overall negative demand effect for public transport. However, analyses cover only one specific (strong) economic downturn. Consequently, findings on the impact of the macroeconomic situation on the usage of public transport may not generalize across multiple business cycles but may be idiosyncratic to this downturn.
Discussion and Conclusions
Discussion
All over the world, governments are confronted with negative consequences of car usage for individual transport, such as congestion and environmental pollution. To mitigate these problems, public policy makers have developed policies to foster the usage of public transport, which can be considered a more sustainable transport choice.
The main objective of this study was to show whether and how marketing can help in stimulating public transport usage, and specifically considering firm-initiated marketing actions such as advertising and promotions. We show that firm-initiated marketing actions merit the consideration of policy makers and transport firm managers in their effort to attract additional travelers. Both advertising and promotional actions have a positive immediate impact on public transport usage. In particular, promotions offered by the firm to its traveler base, using a mix of leisure- and work-oriented special offers, appear effective. Purely leisure-oriented promotions, offered in cooperation with retailers, affect only leisure-related ad hoc traveling and have little to no effect on regular and repeated traveling with month/year passes. While effects are not persistent over time, cumulative effects within the first year are significant and considerable, even though the initial increase in transport usage is partly offset by a subsequent fallback.
For PBT, we found the advertising elasticity to be considerably smaller than the previously reported brand-level elasticities of advertising (Sethuraman, Tellis, and Briesch 2011). This is in line with our expectations of a weaker and perhaps even null effect. However, this short-term advertising elasticity is still much stronger than those reported in recent studies on fast-moving consumer goods (e.g., Ataman, Van Heerde, and Mela 2010; Gijsenberg 2014; Van Heerde et al. 2013). It could be that the considered firm has relatively strong persuasive advertising tactics. Another explanation is that advertising can still be used in this market to create awareness for the advantages of train traveling among unserved customer segments, inducing a relatively strong effect of advertising. The effects of promotions are, however, weaker than usually reported in the marketing literature. This is in line with research suggesting that promotions mainly have an effect on brand sales and less on category sales (e.g., Bell, Chiang, and Padmanabhan 1999; Nijs et al. 2001).
The use of advertising and promotions can thus be an effective strategy to foster the usage of public transport. As such, our results suggest that marketing can indeed be useful in stimulating more sustainable consumption, which has also been shown for organic product consumption (e.g., Bezawada and Pauwels 2013). In line with, for example, Quelch and Jocz (2010), we argue that policy makers should definitely consider these instruments to shape consumers’ choices, in this case regarding transport. However, policy makers should not overestimate the sales effects given that they are typically smaller than in other markets.
Our second objective was to understand the effect of satisfaction on sales. Whereas firm-initiated marketing actions have clear positive effects, the relation between travelers’ satisfaction and the usage of public transport is somewhat more difficult. Additional investments to improve the service offering and its quality have been shown to increase travelers’ satisfaction (Gijsenberg, Van Heerde, and Verhoef 2015; Mouwen 2015; Verhoef, Heijnsbroek, and Bosma 2017). This increased satisfaction, however, does not lead to additional usage of public transport for ad hoc traveling. Periods with increased regular PBT, on the other hand, are associated with lower satisfaction. Peak periods of public transport usage are usually concentrated in winter months, when other modes of transport like bicycles or cars are less attractive due to, for example, weather conditions. High demand is then associated with many people sharing too limited space inside the trains, which reduces satisfaction (Mouwen 2015). In addition, during these winter months, public transport often faces difficulties due to the weather as well. Such difficulties will further reduce travelers’ satisfaction (Mouwen 2015; Verhoef, Heijnsbroek and Bosma 2017).
Although, in the longer run, investments in additional infrastructure and train capacity may resolve some of the issues, these results on the satisfaction–sales relationship are difficult to translate into actionable short-term recommendations for public policy makers. Our results, moreover, suggest that public policy makers should abandon the idea that satisfaction is driving sales in public transport markets. As such, a focus on satisfaction will be mainly relevant for the creation of consumer well-being. This is an important objective in itself, but it will not translate into more public transport usage. Furthermore, increased satisfaction can lead to fewer complaints and, thus, reduced costs (e.g., Bhattacharya, Morgan, and Rego 2016). This, in turn, leaves more money on the table to invest in service improvement and, thus, increased satisfaction, implying a positive feedback loop.
A third and final objective is aimed at understanding how marketing affects satisfaction. Our results suggest a negative effect of demand-stimulating promotions on satisfaction. Moreover, we show that increased sales may decrease satisfaction. Thus, policy makers face a clear paradox: more people using public transport means more dissatisfaction. Using marketing will, on the one hand, stimulate sales but, on the other hand, decrease satisfaction both directly and indirectly, mainly because of insufficient capacity (i.e., full trains, which is an important driver of satisfaction). This implies that policy makers should only stimulate demand when there is sufficient excess capacity to absorb the expected growth in public transport demand and thus should invest in capacity before stimulating public transport demand. This, in the end, comes down to finding a balance between fostering sustainable consumption through increasing the demand for public transport and fostering consumer and societal well-being through increasing satisfaction. Policy makers should clearly be aware of this and cannot ask public transport companies to stimulate both the demand for and satisfaction with public transport simultaneously without committing to the necessary investments in infrastructure and capacity, among others.
Future Research
Along the way, this study suggested several pathways for future research. First, we considered only a single European railway firm in a specific geographic market with its specific market characteristics. Future research might replicate our study in other markets and for other public transport modes. Second, our findings call for the study of longer-term indirect effects of service experience through customer satisfaction and referral behavior on service usage (see, e.g., Hogreve et al. 2017), using a longer data span. Third, such longer-term analysis could also include the analysis of the impact of price, capacity, and service-level changes on public transport usage. Such changes typically only occur rather infrequently and, except for price changes, take time to become fully implemented and operational. Capacity and service-level changes, moreover, could also affect travel time, which can also be an important driver in the choice of public transport relative to other transport modes. Finally, future research should consider the impact of other attitudinal measures, covering consideration and liking, and their mediating effect on public transport usage (Hanssens et al. 2014).
Conclusions
Policy makers all over the world develop policies to foster public transport usage. While attention is mainly drawn to major investments in infrastructure and capacity improvements, the role of marketing actions is commonly overlooked by policy makers, practitioners, and scholars alike. This study fills this gap in our knowledge and thus provides useful insights for policy makers when promoting more sustainable consumption in terms of public transport usage.
From the findings presented in this study, public policy makers should conclude that marketing in terms of advertising and promotions can be a valuable way to stimulate public transport demand and thus more sustainable consumption. However, they should also realize that adverse effects on satisfaction can occur simultaneously, thereby reducing consumer and societal well-being. As a consequence, a trade-off will have to be made in the short run. In the longer run, additional investments in infrastructure and capacity may mitigate the negative impact of increased usage (partly through marketing) on satisfaction.
As such, our study contributes to research in public policy and marketing by (1) being one of the first studies on public transport in this literature stream, thereby (2) showing the relevance of marketing in stimulating sustainable consumption by means of (3) analyzing longitudinal data using time-series analysis to study sustainable consumption. The latter two contributions, moreover, directly answer research directions raised by Iyer and Reczek (2017). We hope that our study paves the way for more work in this area and for more studies using longitudinal data to address some of the paths for future research we have identified.
Supplemental Material
Supplemental Material, PublicTransportMarketing_JPPM_18033_Final_WebAppendix - Moving Forward: The Role of Marketing in Fostering Public Transport Usage
Supplemental Material, PublicTransportMarketing_JPPM_18033_Final_WebAppendix for Moving Forward: The Role of Marketing in Fostering Public Transport Usage by Maarten J. Gijsenberg and Peter C. Verhoef in Journal of Public Policy & Marketing
Footnotes
Acknowledgments
The authors thank a major European train service provider for sharing the data. They advised this firm how to increase its customer base using these data. They thank participants at the 2016 EMAC Conference in Oslo and colleagues at the University of Groningen for feedback on previous versions of the paper. They also acknowledge the supportive comments of the JPPM review team.
Associate Editor
Kelly Martin served as associate editor for this article.
Declaration of Conflicting Interests
The author(s) declared no potential conflicts of interest with respect to the research, authorship, and/or publication of this article.
Funding
The author(s) received no financial support for the research, authorship, and/or publication of this article.
Notes
References
Supplementary Material
Please find the following supplemental material available below.
For Open Access articles published under a Creative Commons License, all supplemental material carries the same license as the article it is associated with.
For non-Open Access articles published, all supplemental material carries a non-exclusive license, and permission requests for re-use of supplemental material or any part of supplemental material shall be sent directly to the copyright owner as specified in the copyright notice associated with the article.