
Abstract
This study explores the effects of anti-Hispanic bias on perceptions of Hispanic names. We showed 176 individuals 40 names chosen randomly from a pool of 84 non-Hispanic, Hispanic, and African-American names and then had them answer the Modern Racism Scale for Hispanics. We first determine the characteristics of individuals with bias in our sample. We find the level of bias against Hispanics is highest among individuals who are non-White, lower-income, employed, and have less education. Additionally, individuals with less bias were 10 percentage points more successful in identifying the ethnicity of Hispanic names than individuals with bias. We discuss the results in the context of intergroup contact theory, social justification theory, and group threat theory.
Keywords
Introduction
Hispanics are the largest minority population in the United States with 59 million self-identifying individuals, comprising approximately 20% of the total US population (Alonzo, 2018). By 2060, the Census Bureau estimates Hispanics will comprise approximately 30% of the total US population, growing to about 111 million individuals (Alonzo, 2018). Unfortunately, Hispanic individuals are often discriminated against in the United States. According to the Pew Research Center, four in ten Hispanic individuals experienced some form of discrimination in the past year, such as criticism for speaking Spanish or being called an offensive name (Lopez et al., 2018). In a survey of over 1,700 individuals, Findling et al. (2019) found widespread reported discrimination against Hispanics, with one in five experiencing discrimination in a clinical setting, such as at a doctor’s office.
Discrimination results in negative physical and mental consequences. Among racial and ethnic minorities, perceived discrimination may lower self-esteem, cause depressive symptoms, lower academic performance, decrease prosocial behaviors, lead to physical symptoms, and increase engagement in riskier behaviors (e.g., smoking, alcohol; Benner, 2017; Davis et al., 2016; Lewis et al., 2015; Pascoe & Smart Richman, 2009; Rogers et al., 2020; Ruggs et al., 2011; Torres et al., 2022; Tran et al., 2010; Williams et al., 2003; Williams & Williams-Morris, 2000). Additionally, perceived discrimination has been linked to worse adult outcomes, such as lower income and educational attainment (Araújo & Borrell, 2006). On a more aggregate level, discrimination can lead to lower economic productivity, increase the risk of economic failure, and lead to greater social division (Fibbi et al., 2021; Pager, 2016; Ruggs et al., 2011). Pager (2016) found that firms that discriminate based on race/ethnicity were about twice as likely to go out of business than non-discriminating firms. Additionally, Bon-Maury et al. (2016) suggest that eliminating discrimination in employment would increase the working population by 3% and GDP by roughly 4%.
In contrast to studies of self-reports of discrimination, audit studies, in which fake applications are submitted with names serving as a proxy to indicate group membership (e.g., ethnicity), find mixed evidence of labor market discrimination against Hispanic and Latinx job applicants. Although early audit studies find evidence of labor market discrimination against Hispanic and Latinx job applicants (e.g., Bendick et al., 1991; Cross et al., 1990; James & DelCastillo, 1992), newer studies either find reductions in or a lack of evidence of labor market discrimination against Hispanic/Latinx applicants (e.g., Darolia et al., 2016; Decker et al., 2015; Kleykamp, 2009; Quillian et al., 2017). A recent meta-analysis suggests that overall audit studies find substantial discrimination in hiring (Gaddis et al., 2021).
The present study aims to understand bias against Hispanics and how it affects the perceived ethnicity of Hispanic names. In the first part of our study, we characterize individuals who indicate explicit bias against Hispanics. Correlating characteristics of individuals with displays of explicit bias is important for policy reasons. First, knowing these characteristics can help with more efficient targeting of anti-bias training or implementation of procedures that could prevent discriminatory actions resulting from bias. Second, knowledge of these types of bias may help social scientists to better understand and predict outcomes in which anti-Hispanic and anti-immigrant rhetoric comprise a portion of the social discourse.
Current studies show that, in general, individuals who hold racial and ethnic biases tend to have less education (Manevska & Achterberg, 2013; Wodtke, 2012, 2016) and lower income (Case et al., 1989; Grossarth-Maticek et al., 1989; Manevska & Achterberg, 2013; McConahay & Hough, 1976; Quillian, 1996) and employed (Johnston & Lordan, 2016). Particularly for Hispanics, research finds mixed results on whether people who discriminate are more likely to be White or non-White—including Hispanics—(Awad et al., 2005; Maina et al., 2018; Moore et al., 1984; Nosek et al., 2007; Sabin et al., 2009; Sanchez & Espinosa, 2016). Also, it is not clear if male individuals discriminate more against Hispanics than females (Awad et al., 2005; Hughes & Tuch, 2003; Mata, 2018; Moore et al., 1984; Sabin et al., 2009; Sidanius et al., 2008).
Gaddis (2017a, 2017b) notes that the perception of names used in audit studies could be influenced by the racial and ethnic composition of the first and last name and the socioeconomic status composition of the first name. The heterogeneous ways an individual can perceive a name make names an imperfect proxy of race and ethnicity. Gaddis (2017b) shows that Hispanic first paired with Anglo last names are the least likely to be recognized as Hispanic. Names also signal social class, something that is correlated with how people perceive racial and ethnic names, as well as how people perceive the race of names (Barlow & Lahey, 2018; Crabtree et al., 2022). Indeed, a substantive minority of participants believed low socioeconomic status names given only to White babies to actually be Black names (Barlow & Lahey, 2018). According to Gaddis (2017a), less than one of every five audit studies scientifically examines names to see how individuals perceive them. In the second part of our study, we examine if individuals with bias correctly distinguish between Hispanic and non-Hispanic names.
The second part of the study explores how the amount of bias an individual holds may be correlated with whether or not they perceive a person to be a member of a minority group (Martiniello & Verhaeghe, 2023). The implications of such a correlation affect the study of discrimination; studies using names to signal minority group status may underestimate the amount of discrimination. This correlation could also affect the amount of discrimination that members of a minority group experience. Suppose individuals with more bias are unaware that a person is, for example, Hispanic. In that case, they might be less likely to directly treat that person negatively but also more likely to expose that person to micro-aggressive statements about the minority group. In this sense, the lack of evidence of labor market discrimination against Hispanic applicants in audit studies could be explained if individuals who display bias cannot correctly infer ethnicity from names. To our knowledge, only one previous study has measured the correlation between explicit bias and accuracy of name ethnicity; Martiniello and Verhaeghe (2023) found that in Belgium, people with stronger anti-immigrant beliefs were more likely to be incorrect about the ethnic origin of Polish, Moroccan, Turkish, and Congolese immigrant names.
We used a survey experiment to examine participants’ levels of explicit bias against Hispanics using the Modern Racism Scale for Hispanics (MRSH) (see Appendix Table A1 for text) and collected information on their demographic characteristics (Guimond et al., 2013; Karl, 2011). This allows us to use regression analyses to correlate demographic characteristics of individuals with explicit bias displays. Our results suggest the level of bias against Hispanics is highest among individuals with lower-income and less educated individuals. Also, we find that non-White individuals, which includes individuals who identify as Hispanics, have higher levels of bias in our sample. We find no difference between males and females. We then asked participants to identify the ethnicity of randomly generated names in a survey experiment. Then, using regression analyses, we checked whether individuals with bias identified with the MRSH are more likely to misidentify Hispanic ethnicity from names. We find that individuals with bias were 10 percentage points more likely to misidentify the ethnicity of Hispanic names.
Literature Review and Theory
What Are the Demographic Characteristics of Individuals With Bias?
There is varied evidence on which racial/ethnic demographics display higher rates of bias. Some studies find non-Hispanic White individuals tend to have more bias than their non-White counterparts, such as Black and Hispanic individuals (Awad et al., 2005; Moore et al., 1984; Nosek et al., 2007). However, Sanchez and Espinosa (2016) find that 40% of Latinos in the Latino National Survey report having been discriminated against by minorities, including other Latinos. Similarly, in a study measuring explicit bias among physicians, Asian and Hispanic physicians reported a preference for White Americans over Black Americans, suggesting minorities can espouse explicit bias similar to that of White individuals (Sabin et al., 2009).
Evidence of whether men or women demonstrate more bias is mixed (Awad et al., 2005; Hughes & Tuch, 2003; Mata, 2018; Moore et al., 1984). Multiple studies find little to no difference in rates of bias between men and women (Awad et al., 2005; Hughes & Tuch, 2003; Moore et al., 1984; Sidanius et al., 2008). Some literature suggests that men have more bias against Hispanic individuals than do women (Awad et al., 2005; Mata, 2018; Sabin et al., 2009). In a study of implicit and explicit biases among college students, Mata (2018) found that male participants were more likely to show bias against Latinx individuals than were their female counterparts. Similarly, Hughes and Tuch (2003) find that White women hold slightly more favorable racial attitudes than do White men. Although these findings are statistically significant, the differences are small. Additionally, once controls were added, most differences between men and women disappeared.
Individuals with higher levels of education tend to demonstrate less explicit bias but still espouse implicit and subtle biases (Manevska & Achterberg, 2013; Wodtke, 2012, 2016). For instance, Wodtke (2012) found that White, Hispanic, and Black people with higher levels of education reject negative stereotypes at higher rates but still do not support policies aimed at overcoming racial discrimination (e.g., preferential hiring policies). However, some evidence suggests education does not have the “liberalizing” effect many studies purport. Wodtke (2018) argues that the “enlightenment perspective” of education on reducing prejudice and bias fails to consider unobserved confounding characteristics of individuals (e.g., socioeconomic status and cultural characteristics); after using individual fixed-effects, Wodkte finds little evidence to suggest education affects racial attitudes, providing credence to the idea of confounding characteristics.
Lower-income individuals tend to have more bias than do higher income individuals (Case et al., 1989; Grossarth-Maticek et al., 1989; Manevska & Achterberg, 2013; McConahay & Hough, 1976; Quillian, 1996). Manevska and Achterberg (2013) found that individuals in lower socioeconomic positions demonstrate higher rates of negative behaviors toward cultural differences, which they attribute to perceived competition for economic resources. Quillian (1996), using survey data from the GSS 1972 to 1991, found that changes in per capita income resulted in a reduction of prejudice, suggesting economic conditions contribute to levels of racial bias. Using the British Social Attitudes Survey, Johnston and Lordan (2016) found higher racial prejudice for employed individuals than for not working for both genders and at all education levels, and higher racial prejudice for employed individuals than for not working for both genders and at all education levels, and that prejudice increases during economic downturns were highest among full-time, individuals with high education.
Group Threat Theory (GTT) provides one possible explanation for these differences in bias. GTT suggests opposition to racial equality emerges from competition over resources and privileges; the dominant group tends to promote ideas that maintain and attempt to justify their higher social status relative to other groups (Blinder & Lundgren, 2019; Bobo & Fox, 2003; Tawa, 2022). There are four feelings among members of the dominant group that lead to racial prejudice: Feelings of superiority, subordinate race is intrinsically different and alien, proprietary claim to certain areas of privilege and advantage, and fear and suspicion that the subordinate race harbors designs on the prerogatives of the dominant race (Blumer, 1958). Prejudice is influenced by two main things: the relative size of the subordinate group and economic circumstances (Quillian, 1995; Tawa, 2022). The more threatened the privileges are of an individual’s group, the more likely they are to express prejudice (Quillian, 1995; Tawa, 2022). Thus, we hypothesize White, non-Hispanic males with lower levels of education and income will display higher rates of bias.
Intergroup Contact Theory (ICT), argues that the presence of a large minority will lead to more frequent and potentially favorable interactions, ultimately resulting in more favorable racial attitudes (Aberson et al., 2021; Dixon, 2004). According to Pettigrew (1998), several conditions facilitate intergroup contact: equal group status within the situation, common goals, intergroup cooperation, existing norms to engage in intergroup contact, and the potential for intergroup contact to be amicable. A major tenet of ICT is this quality of the interaction; while positive interactions are theorized to lead to less prejudice, negative contact experiences can reinforce negative outgroup reactions and attitudes (e.g., negative stereotypes; Aberson et al., 2021; Dixon, 2004; Martiniello & Verhaeghe, 2023; Stephan et al., 2000; Van Ryn et al., 2015). Thus, increased contact with Hispanics could either increase or decrease favorable attitudes. In this sense, individuals in states with a sizable Hispanic population have more exposure to Hispanics and could display either behavior.
Can People With Bias Correctly Identify Hispanic Names?
ICT suggests that bias level may be correlated with an individual’s ability to correctly identify a Hispanic name through the channel of exposure to Hispanic people. If individuals have bias because they have lacked exposure to Hispanics throughout their life, then this lack of exposure could also negatively influence an individual’s ability to correctly identify the ethnicity and gender of a name. Martiniello and Verhaeghe (2023) found that individuals in Belgium with higher blatant racial attitudes are less successful in interpreting the ethnicity of immigrant names. They hypothesize this difference stems from intergroup contact avoidance; in other words, individuals with higher blatant racial attitudes avoid interactions with the outgroup, thus inhibiting their ability to correctly identify the ethnicity of names. However, ICT does not require this causal pathway to generate a negative correlation between bias against Hispanics and inability to correctly identify Hispanic names—it is enough for exposure itself to reduce bias.
Increased exposure to diversity may also work through an education channel. Higher education institutions are some of the most diverse settings in the United States (Fischer, 2011). As such, participation in higher education increases the likelihood of exposure to different races/ethnicities, including Hispanic individuals. This increased probability of exposure allows individuals to learn more traditionally Hispanic names, increasing their ability to differentiate names as Hispanic or non-Hispanic correctly. Thus, more individuals with more education may be less biased, and may also be better able to identify Hispanic names.
However, even if a person with bias has been exposed to Hispanic individuals, they might not perceive an individual as Hispanic if the individual’s characteristics do not match the idea and stereotypes of being Hispanic (Van Laer & Janssens, 2011). System Justification Theory (SJT) offers a potential explanation why people with bias exposed to Hispanics might fail to identify ethnicity from a name. SJT proposes that individuals are motivated to justify the status quo, which causes outgroup favoritism and internalization of inferiority among members of disadvantaged groups (Essien et al., 2021; Jost et al., 2004). SJT argues these justifying beliefs serve a placative function, making individuals feel better about their societal position (Essien et al., 2021). For example, if a Hispanic individual participates in higher education, their peers may fail to recognize their Hispanic ethnicity if they hold negative stereotypes surrounding Hispanics and lack of intelligence (Ojeda et al., 2012; Weyant, 2005). Through the SJT lens, because this Hispanic individual does not embody certain stereotypes for Hispanics, they cannot be Hispanic themselves, allowing the observer to maintain the status quo and prevent any cognitive dissonance that might arise. This failure to predict ethnicity accurately would be rooted in the idea that the outgroup is different and alien to the ingroup, unable to espouse similar characteristics to the ingroup (Blumer, 1958). As a result, the failure to meet certain stereotypes can distort an individual’s perceptions of which names are Hispanic or not.
GTT offers another explanation. If a Hispanic individual is not perceived as a threat for economic resources or privilege, others might include them in the in-group, failing to recognize their ethnicity (Quillian, 1995; Tawa, 2022). This failure to perceive the individual’s ethnicity might lead to further inabilities in identifying signals for one’s ethnicity, such as name. Overall, we hypothesize individuals without bias to be able to correctly identify Hispanic and non-Hispanic first and last names at a higher rate than would individuals with bias.
Methods
Design
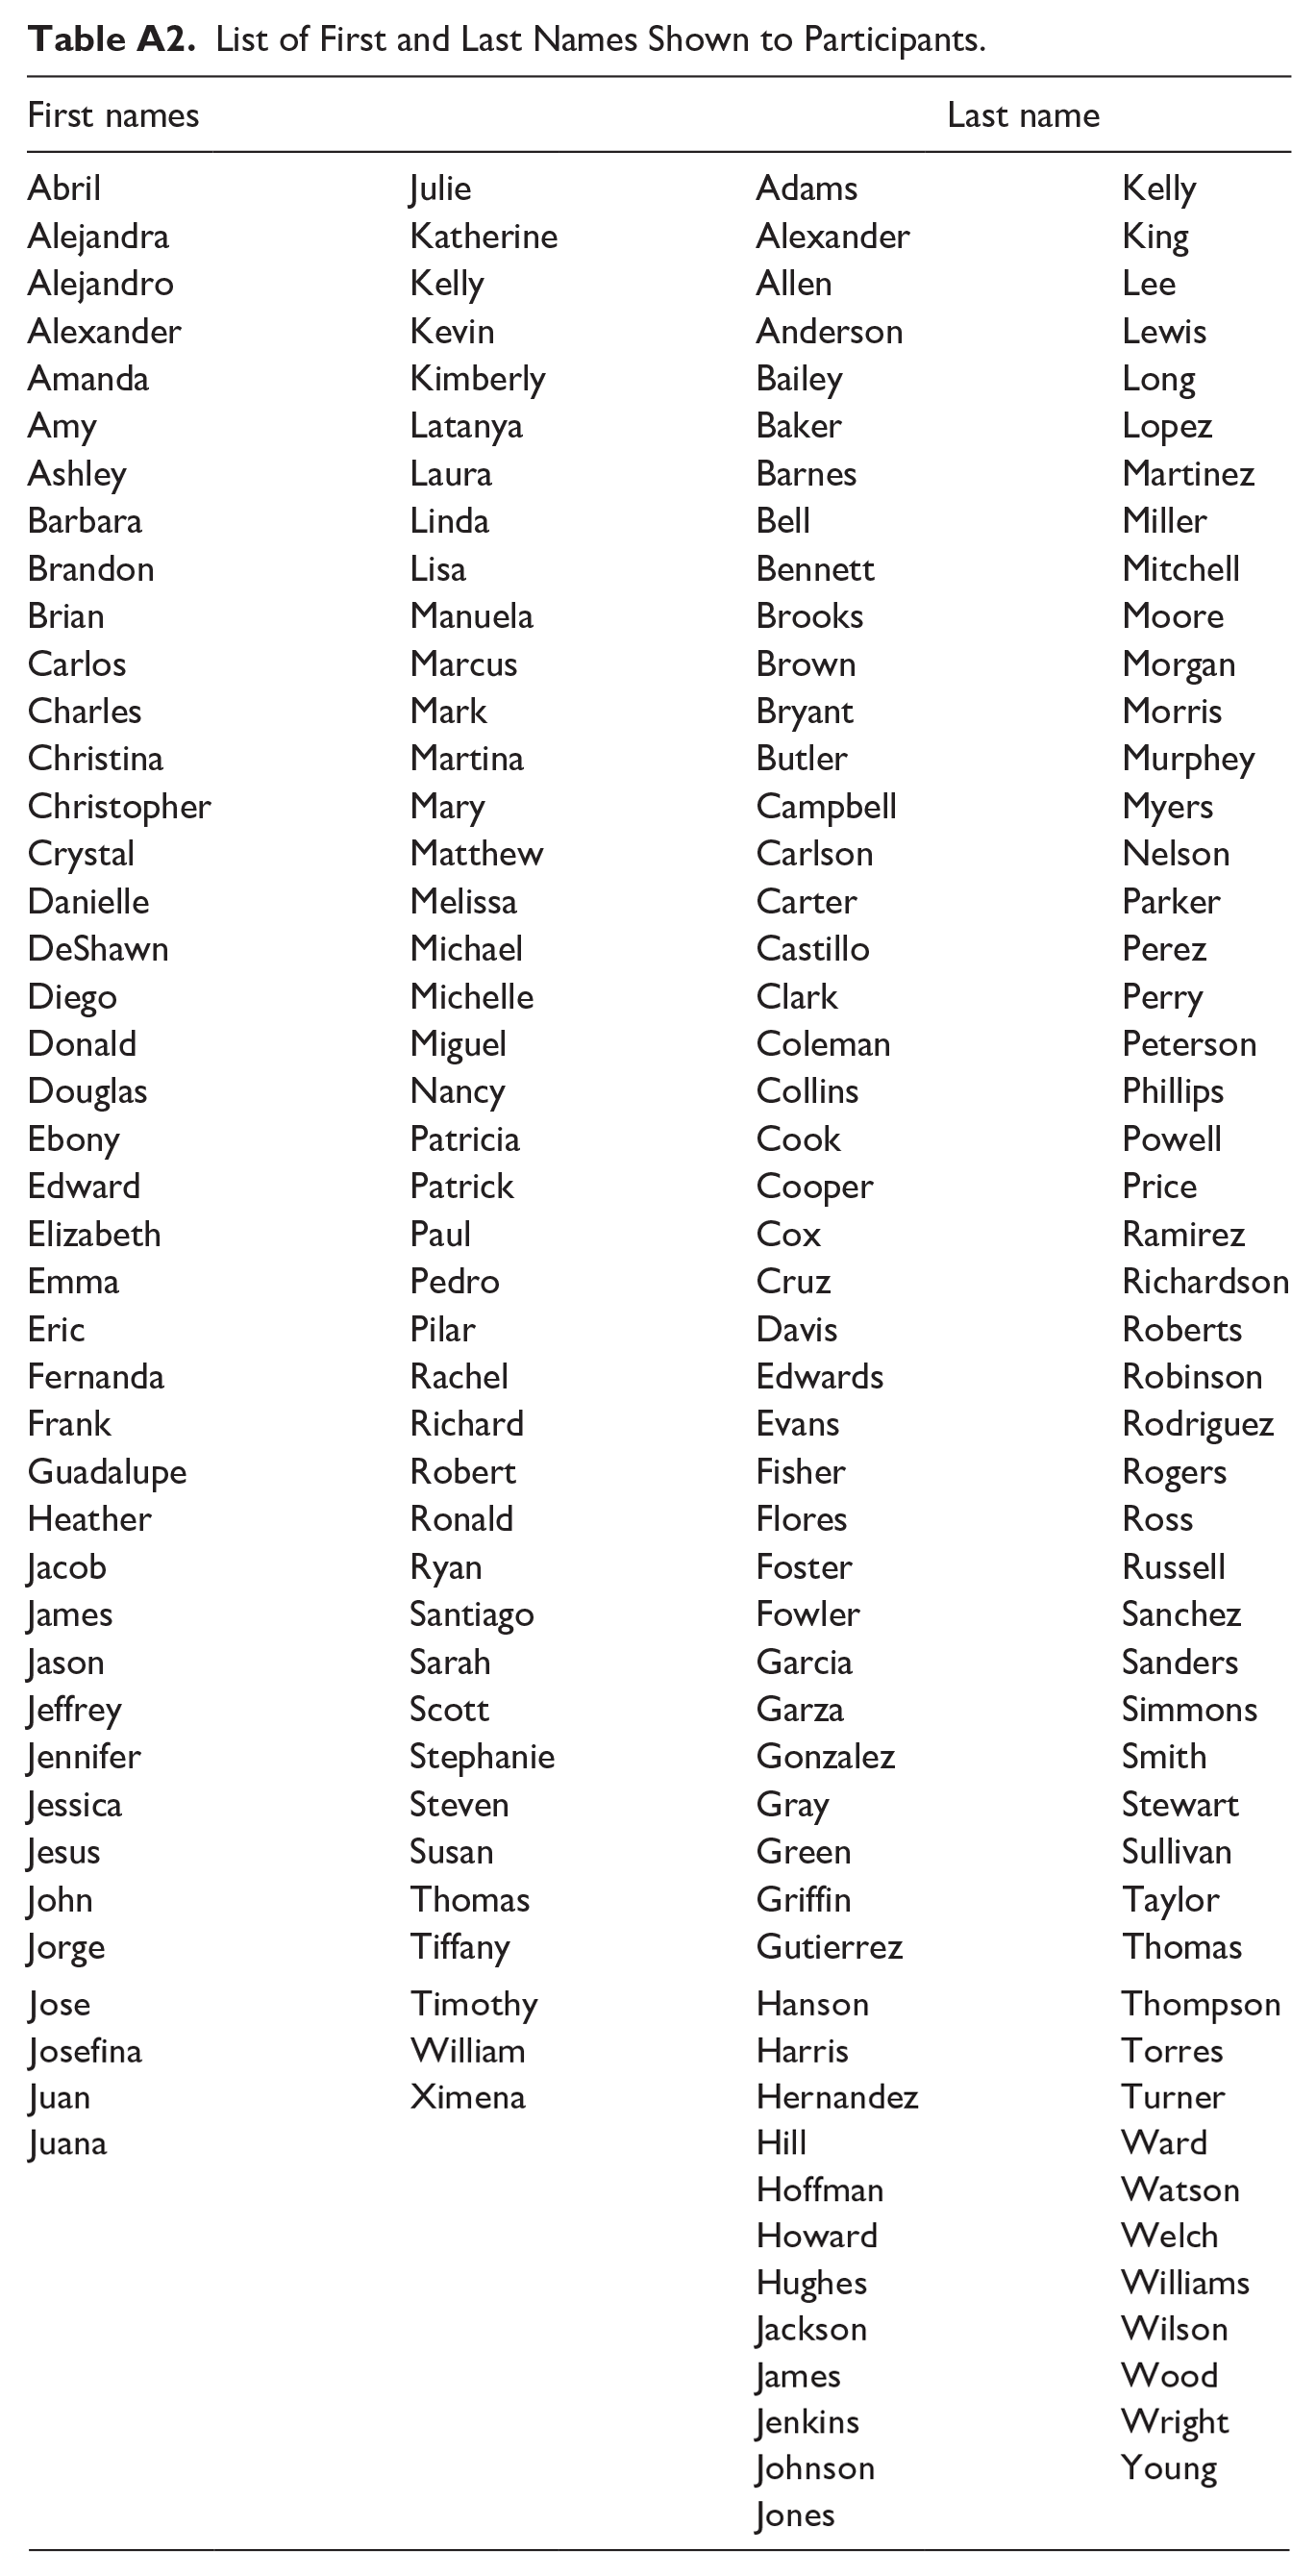
We recruited 200 participants using Amazon’s mTurk in March 2021. mTurk recruits workers from around the world validating their identity and place of residence for tax purposes. We recruited adult individuals living in the United States. Using a survey hosted in Qualtrics, we showed each participant 40 randomly generated names from a list of 83 first names and 99 last names, using White, Hispanic, and Black first and last name components. We used an algorithm that randomly takes a first name and last name from their respective lists and displays it as the participant completes the survey. For each name, we asked participants to identify the name’s gender, race, ethnicity, and mother’s education level (e.g., Hispanic first name paired with a White non-Hispanic last name). 1 Names were identified as Hispanic and non-Hispanic from various online sources for first names and the Census for last names. 2 Hispanic first names were chosen to signal Hispanic status regardless of last name—Maria, for example, was not included, as it is also a common non-Hispanic first name. As a consequence of the randomization algortithm, approximately 60% of the names were White first and last name, 3% were Hispanic first and last name, 11% were non-Hispanic first and Hispanic last name, 20% were a Hispanic first and non-Hispanic last name, and 5% were a Black first and last name. Approximately 49% of the names were female.
We analyze first and last names separately and in combination. We asked participants to identify each name’s gender, race/ethnicity, and mother’s education using fixed choice questions in which choices were forced (“I don’t know” was not an option). Next, participants answered the MRSH, followed by two questions about childbearing stereotypes using a 7-point Likert Scale (Karl, 2011; Mata, 2018). Finally, participants answered several fixed choice demographic questions, including their age, gender identity, level of education, employment status, and income level. Participants were paid $4 after completing the survey. After removing participants who failed quality and attention checks, 176 participants remained. 3 Since each participant reviewed 40 different names randomly chosen from a pool of 84 names; the final sample has 7,040 observations, of which 2,428 correspond to Hispanic names.
Data Analysis
Demographic Variables
Binary variables for White Non-Hispanic and Female were created based on participants’ responses for race, ethnicity, and gender. Age was created based on the date of birth. The “Member of Older Generation” variable identifies participants who were born 1980 or before and are thus either a Baby Boomer or Gen X. 4 Employment Status, Experience in Human Resources, and Experience Hiring are binary variables indicating whether they had such experience. The variable “Low Income” captures participants that have a family income of $60,000 or less ($60,000 is the median in the sample). We created the variable Post High-School Education to include participants who pursued any education beyond high school, including some college and associate’s degrees.We also categorized a participant’s highest level of education into one of three variables: College Graduate, Associate’s Degree/Some College, and High School Graduate or Less. States were determined to have voted Republican in 2016 based on to whom its electoral votes went: Hillary Clinton or Donald Trump. Using data from the 2019 American Community Survey, we created a binary “High Hispanic Population” variable which was one for participants in states with a Hispanic population of 22% or greater. The regional distinctions are made using the Census Bureau’s delineations (i.e., Northeast, Midwest, South, West). 5 Summary statistics for these variables can be found in Table 1.
Summary Statistics.
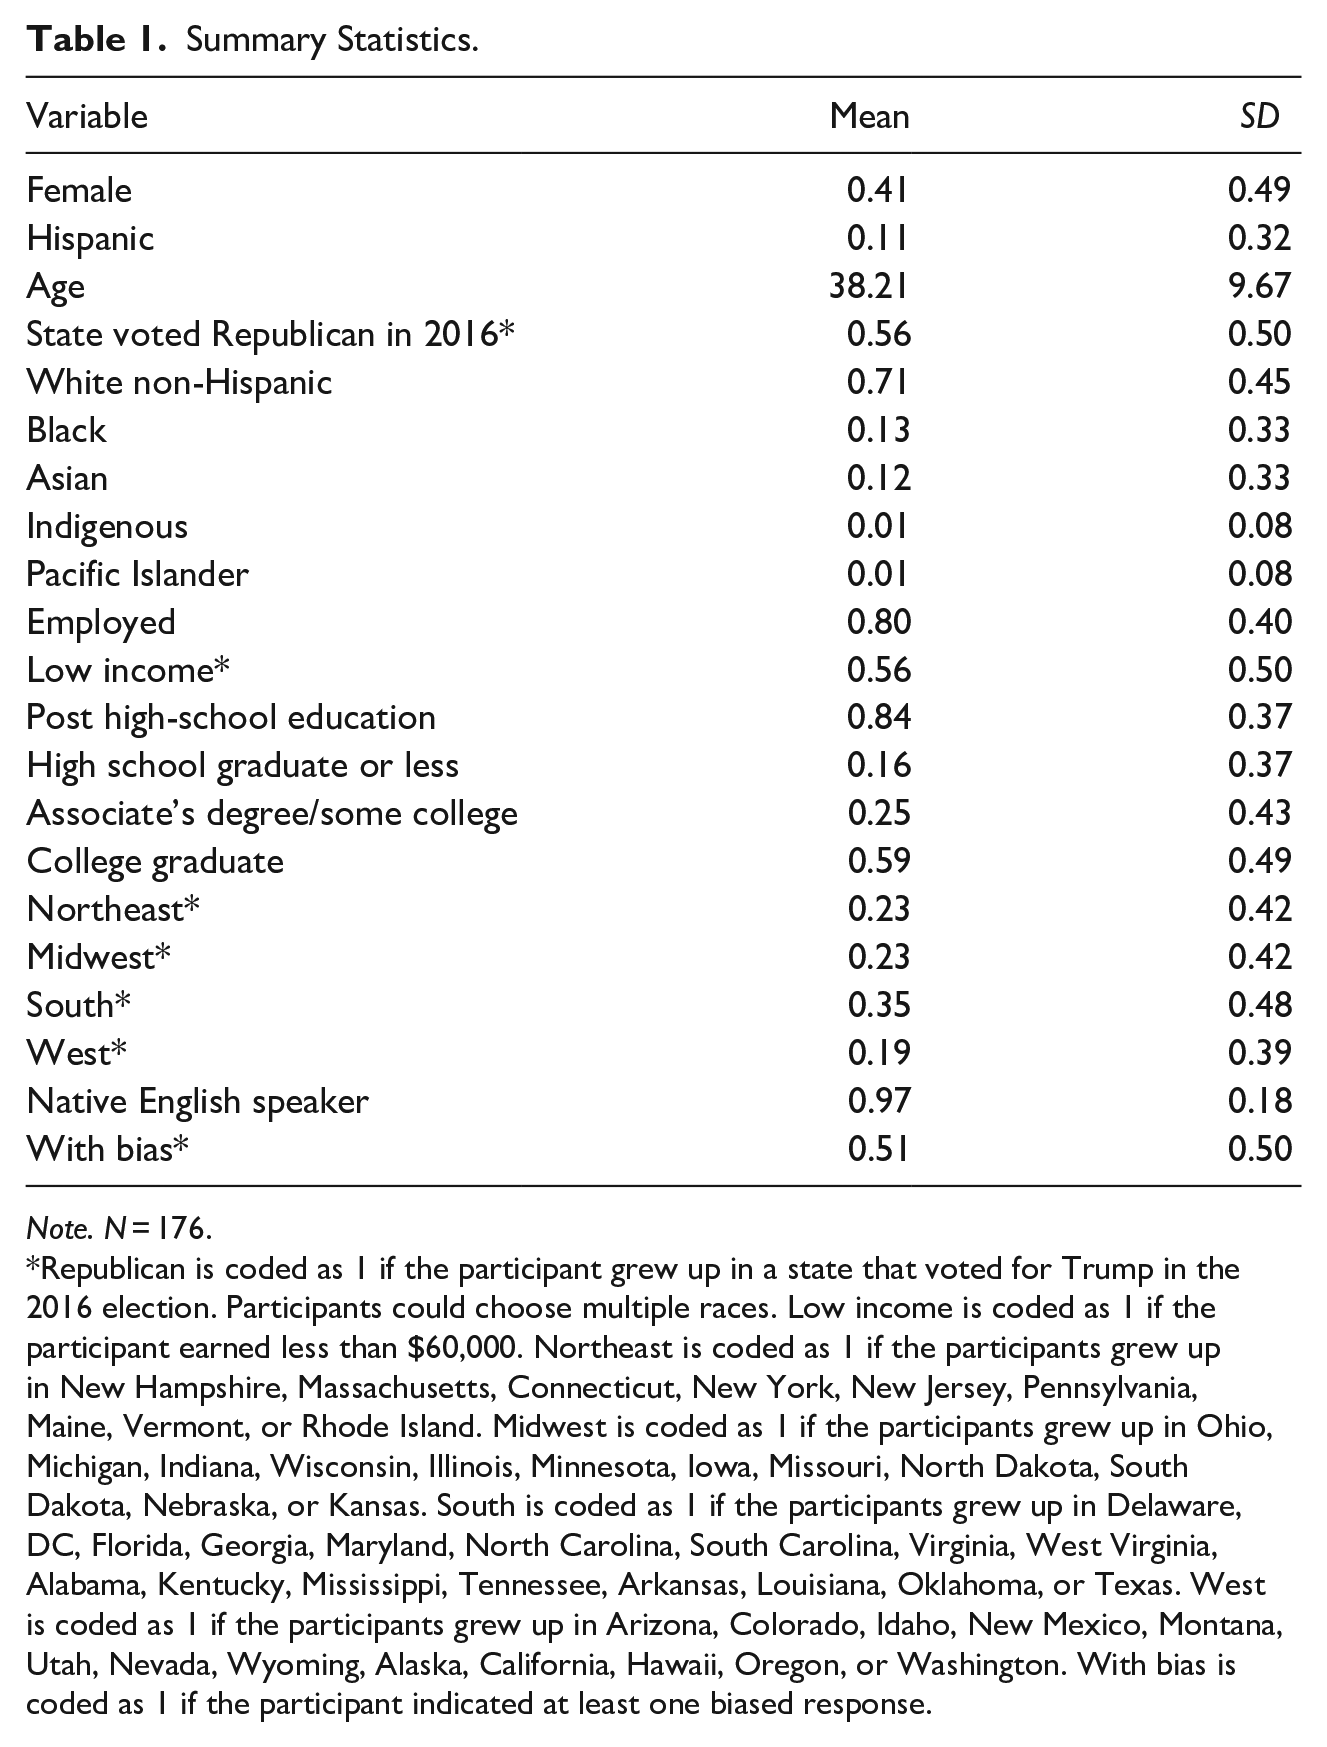
Note. N = 176.
Republican is coded as 1 if the participant grew up in a state that voted for Trump in the 2016 election. Participants could choose multiple races. Low income is coded as 1 if the participant earned less than $60,000. Northeast is coded as 1 if the participants grew up in New Hampshire, Massachusetts, Connecticut, New York, New Jersey, Pennsylvania, Maine, Vermont, or Rhode Island. Midwest is coded as 1 if the participants grew up in Ohio, Michigan, Indiana, Wisconsin, Illinois, Minnesota, Iowa, Missouri, North Dakota, South Dakota, Nebraska, or Kansas. South is coded as 1 if the participants grew up in Delaware, DC, Florida, Georgia, Maryland, North Carolina, South Carolina, Virginia, West Virginia, Alabama, Kentucky, Mississippi, Tennessee, Arkansas, Louisiana, Oklahoma, or Texas. West is coded as 1 if the participants grew up in Arizona, Colorado, Idaho, New Mexico, Montana, Utah, Nevada, Wyoming, Alaska, California, Hawaii, Oregon, or Washington. With bias is coded as 1 if the participant indicated at least one biased response.
Outcome Variables
We identified participants with bias in two ways. First, we created a dummy variable to distinguish between participants with and without bias (Indicated a Biased Response). Participants were determined to have bias if they at least somewhat agreed to one or more of the bias questions from the MRSH (i.e., indicated a response of five or greater to at least one question along a 7-point Likert scale). 6
Second, to define a continuous measure of bias, we conducted an Exploratory Factor Analysis (EFA) with varimax rotation to examine the factor structure of the MRSH. Initially, we made no specifications regarding the number of common factors in order to determine the appropriate number of common factors. Only one common factor had an eigenvalue greater than one, suggesting high correlation between all of the questions (Table 2). Thus, we were able to condense the MRSH to a single scale that explained 94.43% of the total variation in answers. The range of factor loading scores falls between 0.5340 and 0.8883. Eight of eleven variables have factor loading scores above 0.7, indicating this scale is a good model to study the interrelationships between the factor scale and participant demographics (Tavakol & Wetzel, 2020). We used this scale in both t-test and regression analyses. We name this variable Bias Scale. The objective of using two bias measures is to verify that the estimates’ directions are the same between the two outcomes.
Varimax Rotated Factors.
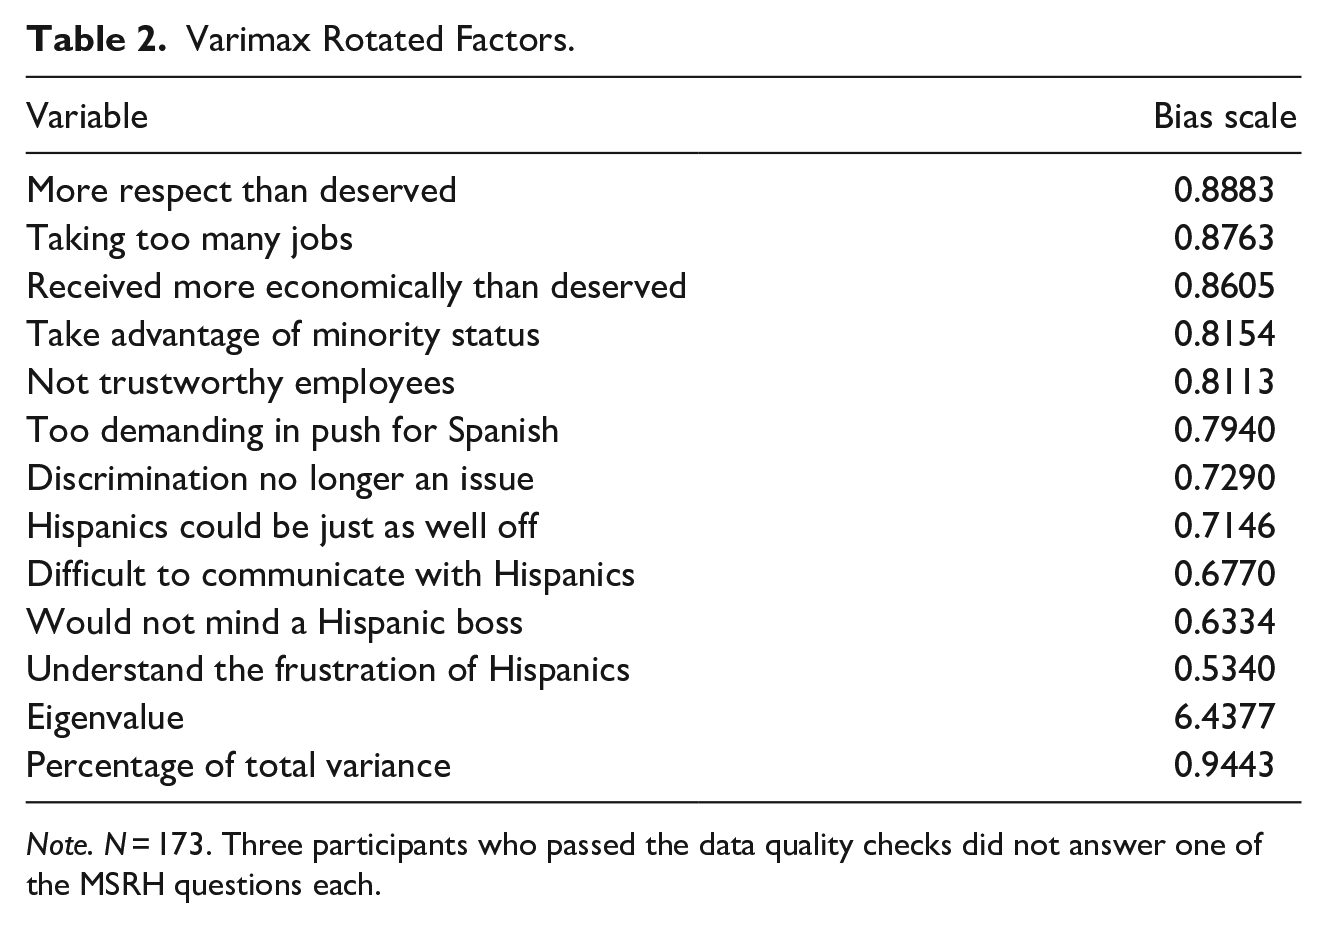
Note. N = 173. Three participants who passed the data quality checks did not answer one of the MSRH questions each.
To study how an individual’s bias is related to their ability to determine the ethnicity of Hispanic names, we create a binary variable Misperceived Hispanic Ethnicity for the universe of Hispanic names only (with all three types of Hispanic names included), and code it 1 if the name is correctly perceived to be Hispanic and 0 if the name is incorrectly perceived to be non-Hispanic.
Analytic Methods
We use Ordinary Least Squares (OLS) on our two dependent variables, “Bias Scale Scores” and “Indicated a Biased Response,” to determine which demographic characteristics are more likely to indicate a biased response. This analysis allows us to provide insights that answer our first research question. 7 We tested the following demographic characteristics: White, Female, Member of Older Generation, Employed, Employed Full-Time Low Income, Post-High School Education, Associate’s Degree/Some College, College Graduate, whether or not a State Voted Republican in 2016, High Hispanic State Population, Age, Age2, and Part-time Employment.
Then, we performed two analyses to test if individuals with bias are less likely to infer ethnicity correctly from names. First, we check if there are statistically significant differences between individuals with and without bias in the proportion of names misidentified using a t-test with Misperceived Hispanic Ethnicity as the dependent variable. The minimum effect size we can detect with 80% power is a difference of 0.1 percentage points (using ex-post power analysis). Second, we check if individuals with bias are more likely to misidentify a name’s ethnicity using OLS regressions. We also check how the difference between individuals with and without bias in name ethnicity identification varies across participant characteristics by interacting the “Indicated a Biased Response” variable with several participant characteristics. Misperceived Hispanic Ethnicity is the dependent variable in these regressions.
Results
Summary Statistics
The mean age of the 176 participants was 38.21 years old (SD = 9.67). The majority of participants were employed, White non-Hispanic, native English speakers, with more than a high school degree (Table 1). About 40% of the participants were women, and there was a relatively even distribution of individuals raised in the different regions of the United States. About 25% of participants were non-White; 20 participants identified as Hispanic, 20 as Black, 20 as Asian, and 2 participants as Indigenous or Pacific Islander. 8
Identifying Demographic Traits of Individuals With Bias
Tables 3 and 4 report the OLS coefficients from regressions of a binary Indicated a Biased Response variable and the Bias Scale variable from Table 2 on participant demographic characteristics, respectively. Models 1 to 8 sequentially add sociodemographic traits, starting with fixed characteristics (e.g., gender identity, age, race) and moving to dynamic characteristics (e.g., income, employment status, educational attainment). Models 9 and 10 introduce statewide characteristics that vary between participants (e.g., percent Republican, high Hispanic population). Model 11 instead includes state fixed-effects. Note that all models control for gender identity, race/ethnicity, and some measure of age. Models 4 to 11 all control for education, while models 7 to 11 control for employment status. Models 9 and 10 also include whether the state voted Republican.
Probability of a Biased Response.
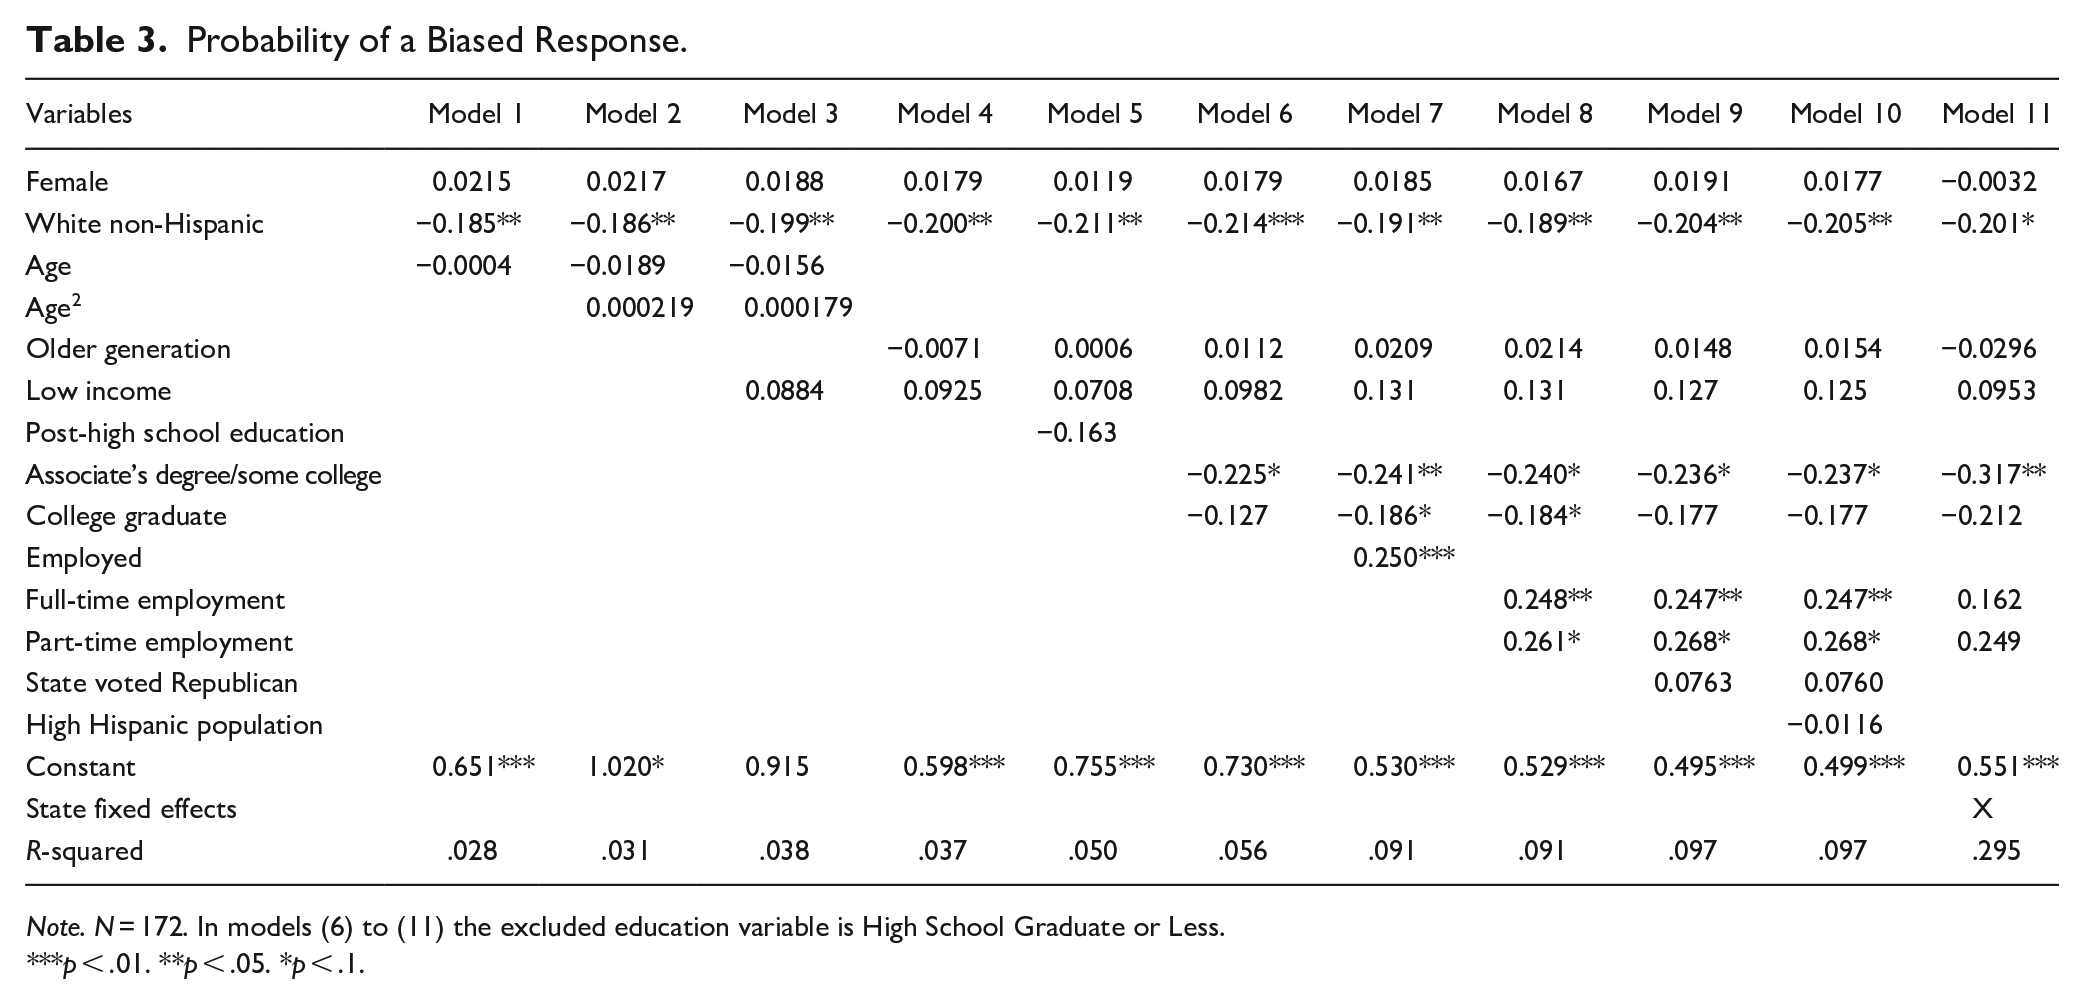
Note. N = 172. In models (6) to (11) the excluded education variable is High School Graduate or Less.
p < .01. **p < .05. *p < .1.
Bias Scale Scores.
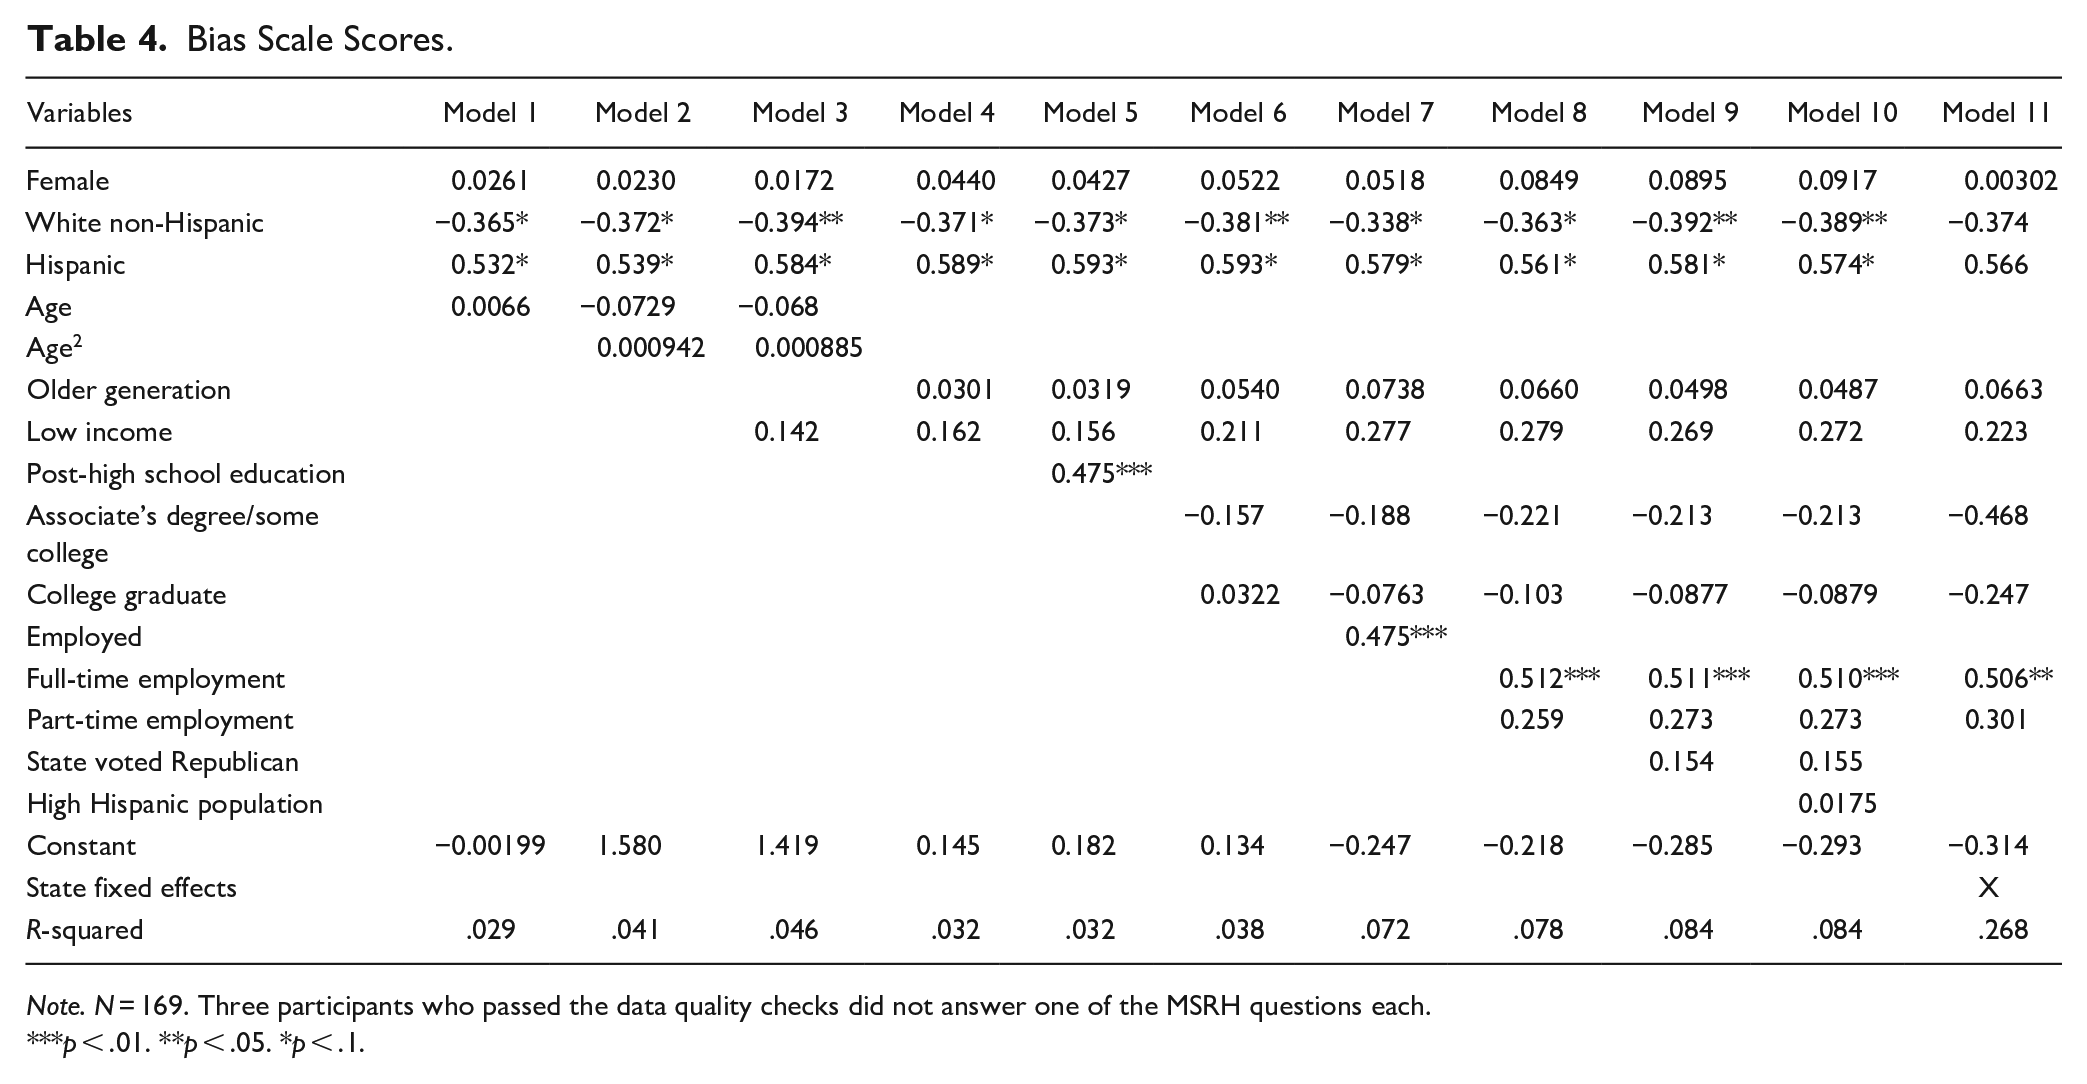
Note. N = 169. Three participants who passed the data quality checks did not answer one of the MSRH questions each.
p < .01. **p < .05. *p < .1.
For regressions that use Indicated a Biased Response as the dependent variable (Table 3), White non-Hispanic participants were 18 to 21 percentage points less likely to indicate a biased response than their non-White counterparts. 9 Having post high school education decreases the probability of a biased response by 16 percentage points, but this effect is insignificant at conventional levels (Column 5). Decomposing this effect, we find that having an associate’s degree or some college reduces the probability of a biased response by 23 to 31 percentage points compared to those with education of high school or less, marginally significant in columns (6), (8), (9), and (10), and significant at the 5% level in columns (7) and (11). Being a college graduate or more decreases the probability of a biased response by 12 to 21 percentage points in most specifications, though this result is only significant at the 10% level in two specifications. Employment, particularly full-time employment, leads to a significant increase of a biased response by ~25 percentage points, although the magnitude drops to 16 percentage points and the significance disappears when state fixed effects are controlled for. Conditioning on employment, columns (7) to (10) suggest that individuals making less than $60,000 per year are ~13 percentage points more likely to indicate a biased response relative to their higher-income counterparts. However, these results are not significant at conventional levels and decrease when state fixed effects are added. Female, Age, Age2, Older Generation, State Voted Republican, and High Hispanic Population were smaller in magnitude and were not statistically significant variables in any of the models.
Instead of using a binary variable for having bias versus not, Table 4 repeats the Table 3 specification using our continuous Bias Scale described in the methods section. 10 Each model suggests being White decreases the scale factor by around 0.4 of a standard deviation. Being employed full time increases the scale factor by around 0.56 standard deviations. With state fixed-effects added, Full-time Employment is the only statistically significant variable in the model, but the signs and magnitudes of the other variables are similar to those in models without state fixed effects. Low Income has a positive association with the Bias Scale in all specifications, but it is not statistically significant. As before, Female, age variables, State Voted Republican, and High Hispanic Population were not statistically significant variables in any of the models, nor was the magnitude of their impact substantial on the scale factor.
These multivariate OLS analyses partially support our initial hypotheses. They align with the expectation of higher rates of bias among individuals with less education (Case et al., 1989; Grossarth-Maticek et al., 1989; Manevska & Achterberg, 2013; McConahay & Hough, 1976; Quillian, 1996; Wodtke, 2012, 2016). We also find that low income individuals are associated with higher levels of bias, but these results are not significant in any specification. We find no evidence to support gender differences in levels of bias, aligning with current literature (Awad et al., 2005; Hughes & Tuch, 2003; Moore et al., 1984). Our results contradict some, but not all, literature on the relationship between White non-Hispanic individuals and bias (Awad et al., 2005; Maina et al., 2018; Moore et al., 1984; Nosek et al., 2007; Sabin et al., 2009; Sanchez & Espinosa, 2016). For both Bias Scale and the Indicated a Biased Response variable in regression analyzes, White was found to have a negative coefficient, suggesting White non-Hispanic individuals displayed lower rates of bias against Hispanics relative to their non-White (including Hispanic) counterparts in our sample.
Do Individuals With Bias Correctly Distinguish Between Hispanic and Non-Hispanic Names?
To test if individuals with bias can correctly distinguish between Hispanic and non-Hispanic names, we reviewed the proportion of correctly identified Hispanic names by participants with and without bias (Table 5). Participants without bias correctly identified as Hispanic 97% of the Hispanic first-last name combinations, 90% of the non-Hispanic first name Hispanic last name combinations, and 75% of the Hispanic first name non-Hispanic last name combinations. Conversely, participants with bias correctly identified as Hispanic: 82% of the Hispanic first-last name combinations, 80% of the non-Hispanic first name Hispanic last name combinations, and 66% of the Hispanic first name non-Hispanic last name combinations. In addition, Table 5 shows that individuals with bias are also more likely to misidentify White and Black names by 4 percentage points and 16 percentage points, respectively. All the differences in the proportion of correctly identified Hispanic names between individuals with and without bias are statistically significant at the 1% level (Figure 1).
Perceived Ethnicity of Various Name Combinations by Participants With and Without Bias.
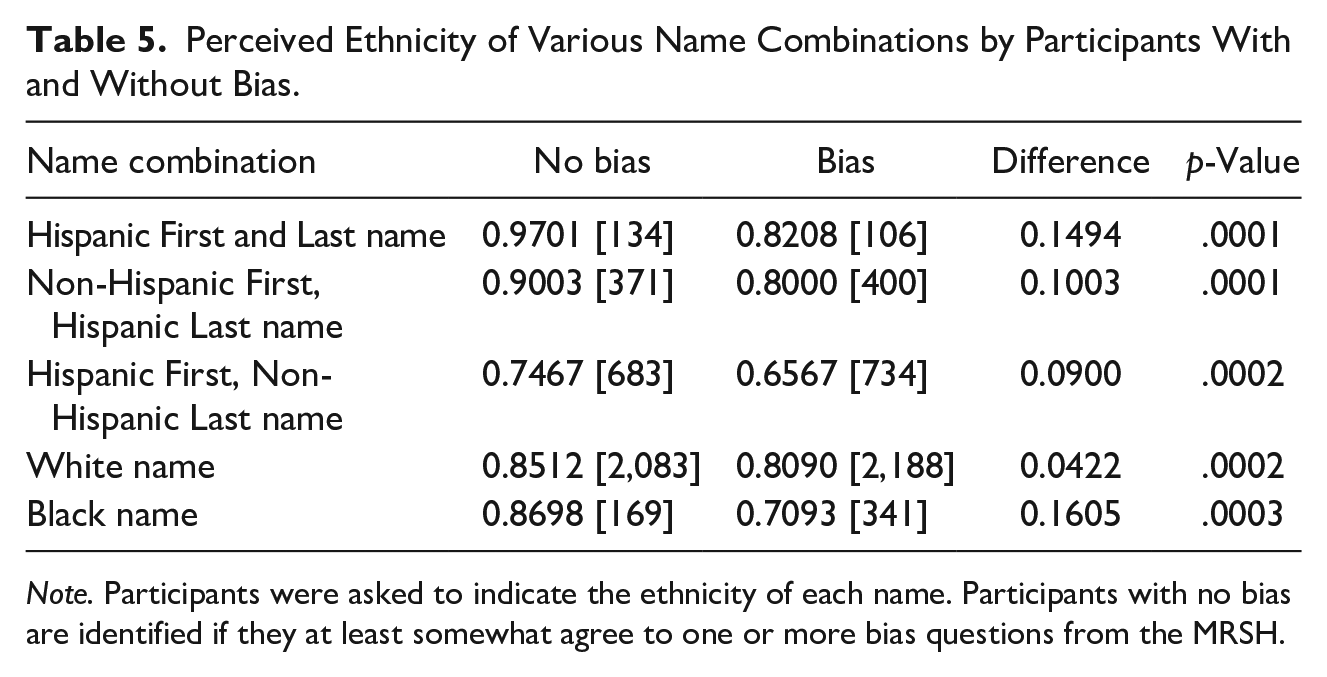
Note. Participants were asked to indicate the ethnicity of each name. Participants with no bias are identified if they at least somewhat agree to one or more bias questions from the MRSH.
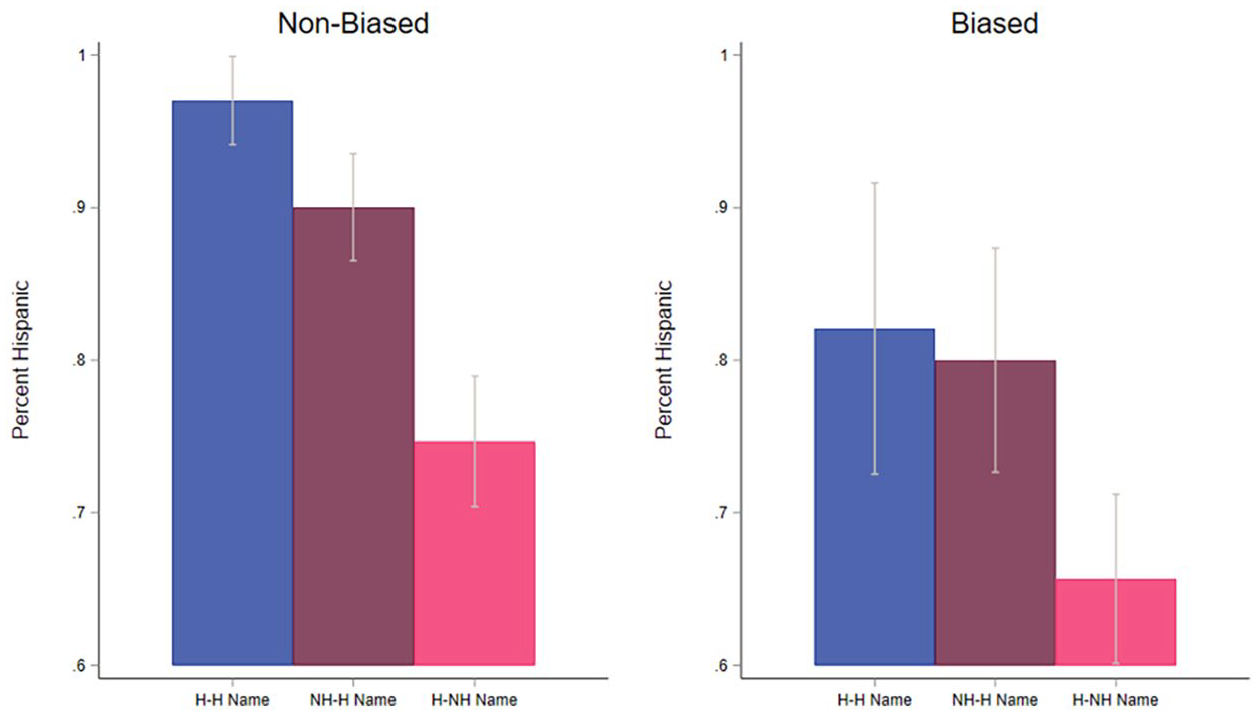
Percent of name combinations perceived to be Hispanic.
We next explore how participants with and without bias misidentify a name’s ethnicity varies across participant characteristics (Table 6). 11 We ran a series of regressions where we interacted the bias indicator with participant characteristics. The dependent variable is an indicator variable that is one if the participant misidentified the ethnicity of the name shown. As a benchmark, we report a regression without the interaction term in column (1). In this case, participants with bias have a 10% higher misidentification rate than participants without bias. This rate is consistent with the average of the differences in the misidentification rates implied in Table 5. When we look for heterogeneous responses, we find no statistically significant difference for participants with bias who live in states with a large Hispanic population, female participants with bias, participants with bias who identify as Republicans, White participants with bias, and participants with bias from older generations shown in columns (2) to (6). In all these cases, the interaction term between the bias indicator and the participant characteristic is insignificant, and the bias coefficient is similar to the one from a regression without interaction terms. The only significant difference comes from participants with bias with more than a high school degree in column (7). In this case, the bias coefficient decreases to 2.2 percentage points and loses statistical significance. In comparison, the interaction term between the bias indicator and a post high-school education indicator is 13.7 percentage points, suggesting that all the difference in how participants with and without bias identify a name’s ethnicity comes from participants with bias with additional education beyond high school.
Misidentified Ethnicity of Hispanic Names by Bias and Participant Characteristics.
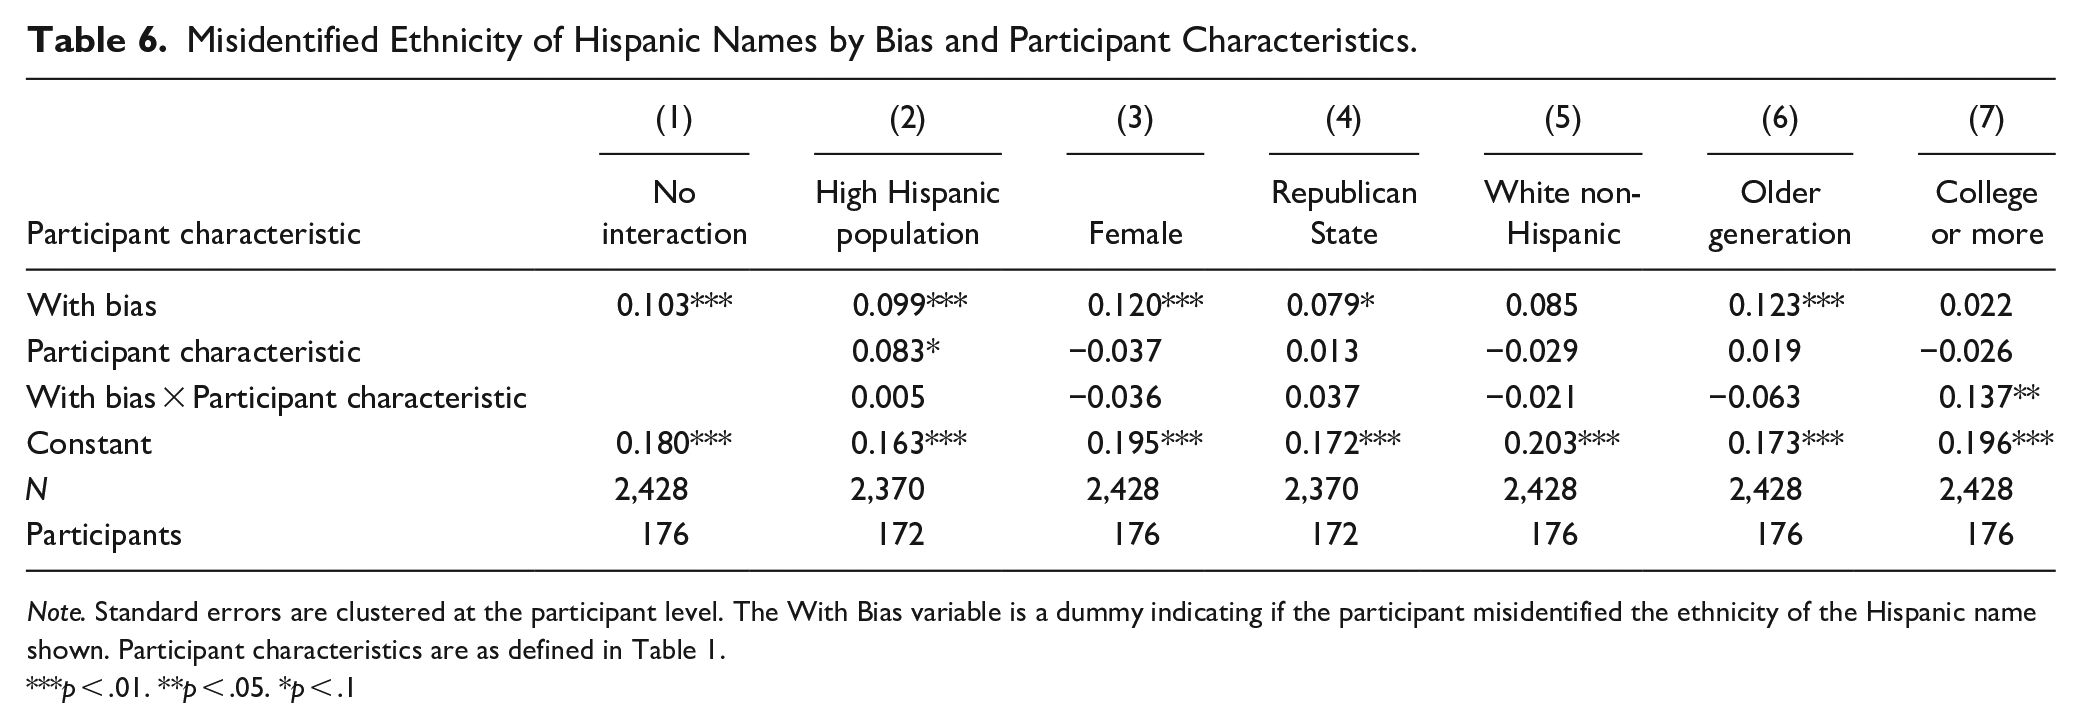
Note. Standard errors are clustered at the participant level. The With Bias variable is a dummy indicating if the participant misidentified the ethnicity of the Hispanic name shown. Participant characteristics are as defined in Table 1.
p < .01. **p < .05. *p < .1
Discussion
We add to the present literature by exploring the influence demographic characteristics can have on bias against Hispanic individuals. We then examine how individuals with bias are more likely to incorrectly perceive the ethnic status of distinctly Hispanic names. In general, our results provide partial support for our hypotheses. In line with our hypotheses, our results suggest the level of bias against Hispanics is highest among individuals with lower-income and less education. 12 Lower-income individuals were found to have an increased likelihood of indicating a biased response, potentially providing credence to GTT, in which lower-income participants view Hispanic individuals as competitors for limited economic resources (e.g., jobs) that they see as rightfully theirs (Quillian, 1995; Tawa, 2022) or SJT in which lower-income participants have internalized negative prejudices against themselves and other marginalized communities (e.g., Hispanic individuals) and perpetuate these very biases in order to maintain the status quo (Essien et al., 2021; Jost et al., 2004).
Similarly, education was negatively correlated with the probability of bias, an effect that diminishes after earning an associate’s degree. One potential explanation from ICT suggests that higher education reduces bias through increased exposure to marginalized populations and not through education itself (Aberson et al., 2021; Dixon, 2004; Maina et al., 2018). This increased exposure leads individuals to question their biases, ultimately reducing their prejudices (Aberson et al., 2021; Dixon, 2004). However, our findings in Tables 3 and 4 showed that growing up in a state with a high Hispanic population does not decrease the probability of having bias, suggesting potentially that exposure to Hispanics is not enough to decrease bias, although this measure is crude and may be subject to measurement error.
Counter to our hypotheses, we find that non-White individuals, which includes individuals who identify as Hispanics, have higher levels of bias in our sample. While some literature suggests White individuals tend to have more bias than their non-White counterparts (Awad et al., 2005; Moore et al., 1984), other studies find some minority groups can hold explicit bias toward other minority groups (Sanchez & Espinosa, 2016). For example, 40% of Latinos in the Latino National Survey report having been discriminated against by minorities, including other Latinos (Sanchez & Espinosa, 2016). Similarly, Maina et al. (2018) cite six studies that find Asian and Hispanic healthcare providers demonstrated similar levels of bias as White respondents, potentially providing support for the SJT and helping rationalize our results. It is possible that our non-White and Hispanic participants have internalized biases about themselves and other marginalized communities, explaining why our White participants demonstrated a lesser probability of indicating a biased response relative to their non-White counterparts.
Individuals without bias were more likely to correctly identify Hispanic names as Hispanic, supporting our second hypothesis. The results in Table 6 suggest that all the difference in how participants with and without bias identify a name’s ethnicity comes from participants with bias who at least attended college. This result is inconsistent with the predictions of ICT. While formal education may be exposing students to more Hispanics, it does not seem to be increasing their ability to identify a name. Participants with bias living in a state with a large Hispanic population have no differential response, which is also inconsistent with the predictions of ICT, although this variable is only a rough measure of contact with Hispanics. On the other hand, this result is consistent with the predictions of SJT. While colleges are very diverse environments that increase exposure to Hispanics, individuals with bias who attend college do not perceive Hispanic individuals as Hispanic because they do not meet certain negative stereotypes like lack of intelligence. Because of this reason, SJT suggests that they did not associate the Hispanic names they encountered in college with Hispanic ethnicity. Consequently, when presented with only Hispanic names in writing in a way that does not explicitly convey stereotypes, they do not recognize them as Hispanic. An alternate explanation for this finding is that participants who are more willing to admit to explicit bias in the MRHS are more likely to “not see race” of names.
As with previous research, participants were most likely to correctly identify Hispanic first/Hispanic last names as Hispanic. This was true for individuals with and without bias. Recent research (Gaddis et al., 2024) suggests that people may correlate Hispanic name types with immigration and assimilation status. That is, someone with a Hispanic first and Hispanic last name is more likely to be an immigrant, while someone with a non-Hispanic first name and a Hispanic last name is more likely to be a citizen. Future research should explore whether the definition of “Hispanic” varies with perceived assimilation status and citizenship, and how that may vary with level and type of bias. It is possible that someone with bias against Hispanics could have bias against recent immigrants while not having bias against second or later generation Hispanics.
While our study does have enough power to detect the estimated effects, there are potential concerns with our sample. It could be difficult to generalize our results to the U.S. population since of the 176 participants, 125 were White, and 103 were men. In our sample, 84% of the participants have at least some post-high school education, 80% are employed, and 56% are low-income, while in the general population, these rates are 62%, 60%, and 41%, respectively. The sample race and ethnicity rates also differ from the general population. In our sample, 71% of participants are White non-Hispanic, and 11% are Hispanic (79% are White without reference to ethnicity). In the general population, these rates are 60% and 18%, respectively (72% are White without reference to ethnicity). 13 This lack of generalizability might explain our finding that non-White participants in our sample are more biased than White participants. Thus, future research should prioritize larger, more representative samples of the general population to generalize the results. Additionally, more research is needed to understand why individuals with bias have higher ethnicity misidentification rates. While our results support SJT as a possible explanation but do not support ICT, more could be done to measure actual interactions between participants and Hispanic groups. In addition, we only measured explicit biases—as Martiniello and Verhaeghe (2023) suggest in their paper, findings may differ for participants with implicit biases.
Footnotes
Appendix
List of First and Last Names Shown to Participants.
| First names | Last name | ||
|---|---|---|---|
| Abril | Julie | Adams | Kelly |
| Alejandra | Katherine | Alexander | King |
| Alejandro | Kelly | Allen | Lee |
| Alexander | Kevin | Anderson | Lewis |
| Amanda | Kimberly | Bailey | Long |
| Amy | Latanya | Baker | Lopez |
| Ashley | Laura | Barnes | Martinez |
| Barbara | Linda | Bell | Miller |
| Brandon | Lisa | Bennett | Mitchell |
| Brian | Manuela | Brooks | Moore |
| Carlos | Marcus | Brown | Morgan |
| Charles | Mark | Bryant | Morris |
| Christina | Martina | Butler | Murphey |
| Christopher | Mary | Campbell | Myers |
| Crystal | Matthew | Carlson | Nelson |
| Danielle | Melissa | Carter | Parker |
| DeShawn | Michael | Castillo | Perez |
| Diego | Michelle | Clark | Perry |
| Donald | Miguel | Coleman | Peterson |
| Douglas | Nancy | Collins | Phillips |
| Ebony | Patricia | Cook | Powell |
| Edward | Patrick | Cooper | Price |
| Elizabeth | Paul | Cox | Ramirez |
| Emma | Pedro | Cruz | Richardson |
| Eric | Pilar | Davis | Roberts |
| Fernanda | Rachel | Edwards | Robinson |
| Frank | Richard | Evans | Rodriguez |
| Guadalupe | Robert | Fisher | Rogers |
| Heather | Ronald | Flores | Ross |
| Jacob | Ryan | Foster | Russell |
| James | Santiago | Fowler | Sanchez |
| Jason | Sarah | Garcia | Sanders |
| Jeffrey | Scott | Garza | Simmons |
| Jennifer | Stephanie | Gonzalez | Smith |
| Jessica | Steven | Gray | Stewart |
| Jesus | Susan | Green | Sullivan |
| John | Thomas | Griffin | Taylor |
| Jorge | Tiffany | Gutierrez | Thomas |
| Jose | Timothy | Hanson | Thompson |
| Josefina | William | Harris | Torres |
| Juan | Ximena | Hernandez | Turner |
| Juana | Hill | Ward | |
| Hoffman | Watson | ||
| Howard | Welch | ||
| Hughes | Williams | ||
| Jackson | Wilson | ||
| James | Wood | ||
| Jenkins | Wright | ||
| Johnson | Young | ||
| Jones | |||
Acknowledgements
The authors gratefully acknowledge the assistance of Karen Gracia, Trinity Gipson, and Ty McClure who provided excellent research assistance.
Declaration of Conflicting Interests
The author(s) declared no potential conflicts of interest with respect to the research, authorship, and/or publication of this article.
Funding
The author(s) disclosed receipt of the following financial support for the research, authorship, and/or publication of this article: This research was supported by the Alfred P. Sloan foundation. The views expressed in this paper do not necessarily represent those of the Sloan foundation.