
Abstract
Cancer screening rates are low among Hispanic individuals. We examined subgroups of Latinos not adherent to cancer screening guidelines, using latent class analyses, to identify how different facets of cultural identity and risk factors might coalesce. Analyses of 2,873 Hispanic/Latino individuals revealed six latent classes: Connected Immigrants, Bridging Locals, Rooted Locals, Bridging Immigrants, Isolated Locals, and Connected Locals. Multinomial regression analysis also was used to examine sociodemographic and health care predictors of belonging to each latent class. Results show that the Connected Immigrants group, who are highly connected with their Latin culture and Spanish language dominant, stood in stark contrast to Rooted Locals, US born and English language dominant with non-Hispanic/Latino friendship groups. Rooted Locals also were more likely to have a usual source of care and less likely to have visited a doctor in the past year. These differences could shape health messaging beyond common variables such as ethnicity and language.
Background
Cancer is the leading cause of death among Hispanic/Latino individuals, yet Hispanic/Latino individuals have lower screening rates compared to non-Hispanic (NH) Whites (American Cancer Society, 2021). Data reported by the American Cancer Society (obtained from the National Health Interview Survey) indicate that 83% of Hispanic women ages 25 to 65 years are up-to-date with cervical cancer screening (vs. 86% of NH Whites); 60% of Hispanic women ages 45+ years are up-to-date with breast cancer screening (vs. 64% of NH White women); and 59% of Hispanic men and women ages 50+ years are up-to-date with colorectal cancer screening (vs. 68% of NH Whites) (American Cancer Society, 2021). Although efforts to increase screening rates often involve developing interventions to address socioeconomic (SES), cultural, or health system barriers to screening (American Cancer Society, 2021), and to ensure interventions are culturally appropriate (such as engaging patient navigators, community health workers, small media with decision aids) (Austin et al., 2002; Mojica et al., 2018), there is the assumption that everyone with the same culture and language has the same SES and access to care. Yet, cultural identity is composed of many factors, including cultural practices, values, and identification (Schwartz et al., 2010). Latinos also are heterogeneous in terms of race, country of origin, immigration status, time since immigration, and generation status. If we were to address the heterogeneity among Latinos, our interventions might be more successful. This is a gap that needs to be addressed.
This study examined cultural identity within a Hispanic/Latino community that was not adherent to cancer screening. We used latent class analysis to identify subgroups of individuals where the associations between cultural practices, values, and identification are more salient. This person-centered approach can uncover how different facets of identity and risk may coalesce together in groups of people who share the same patterns of factors. Health promotion communications and interventions may more finely address barriers and target materials to those audiences with greater precision and effect. Thus, the purpose of this study was to (1) identify distinct subgroups or latent classes and (2) examine sociodemographic and health care utilization predictors of such latent classes.
Methods
Data Source and Study Sample
Data were obtained as part of an evidence-based cancer education-plus-navigation intervention implemented in collaboration with a federally qualified health center and three community organizations in the southwestern United States. Enrolled participants (N = 2,873 Hispanic/Latino men and women) were age-eligible (ages 21–75 years) for breast, cervical, and/or colorectal cancer screening and were not adherent to at least one guideline for cancer screening in that they had (1) never had a mammogram or not had one in the past year, (2) never had a Pap test or not had one in the past 5 years, or (3) never had a stool blood test. Screening eligibility criteria for mammography were based on American Cancer Society guidelines in place from 2003 to 2015 (American Cancer Society, 2019). A detailed description of the study design and participant recruitment can be found elsewhere (Mojica et al., 2021).
Measures
Sociodemographic characteristics were collected during the baseline survey and included age, gender (female, male), marital status (married, not married), education completed (≤high school, >high school), annual household income (≤$30K, >$30K), employment (full-time or part-time), nativity (US born, foreign-born), and self-rated health (healthy, i.e., excellent, very good, good; unhealthy, i.e., fair, poor).
Cultural Identity
Cultural identity was measured at baseline with the General Acculturation Index (Balcazar et al., 1995) that includes spoken and written language (i.e., cultural practice), early cultural life exposure and race/ethnicity of current circle of friends (i.e., cultural values), and Hispanic/Latino ethnic pride (i.e., cultural identification). Cultural identity is often an amalgam of cultural practices, cultural values, and cultural identification (Schwartz et al., 2010). Cultural practices include “language use, media preferences, social affiliations, and cultural customs and traditions.” Cultural values include the “belief systems associated with a specific context or group.” Cultural identification includes “ethnic/national identities” (Schwartz et al., 2010).
Spoken language was assessed with the question, “Would you say you speak only Spanish, Spanish better than English, both Spanish and English equally well, English better than Spanish, or only English?” Responses were categorized as Spanish dominant (i.e., “only Spanish” or “Spanish better than English”) versus English dominant (i.e., “only English” or “English better than Spanish”) versus Both (i.e., “both Spanish and English equally well”). Written language was assessed with a similar question and recategorized similarly as above.
Early cultural life exposure was captured by asking respondents where they spent their early life from childhood to 21 years of age. Two response choices were coded as Mostly Latin America (i.e., “only in Latin America: Mexico, Central America, South America or the Caribbean: Cuba, Puerto Rico, etc.,” and “mostly in Latin America or the Caribbean.”). Two other response choices were coded as Mostly United States (i.e., “mainly in the United States and some time in Latin America/the Caribbean” and “only in the United States.”). The other choice—“equally in Latin America/the Caribbean and in the United States”—was coded as Both equally.
Race/ethnicity of current circle of friends was captured with the question, “How would you describe your current circle of friends?” Two responses were categorized as Mostly Hispanic/Latino persons: “Almost exclusively Hispanics/Latinos (Chicanos/Mexican Americans, Puerto Ricans, Cubans, Colombians, Dominicans, etc.)” and “Mainly Hispanics or Latinos.” Two responses were categorized as Mostly non-Hispanic/Latino persons in the US: “Mainly Americans in the US” and “Almost entirely Americans from the US.” One answer was coded as Both equally: “Equally Hispanics/Latinos and Americans from the United States.”
Hispanic/Latino ethnic pride was measured with the question, “How do you feel about having a Hispanic/Latino background? Would you say. . .” with response options ranging from “Very Proud,” “Proud,” “Somewhat proud,” “Little pride,” “No pride.” Responses were coded as High (i.e., Very proud, Proud, or Somewhat proud) versus Low (i.e., Little pride or No pride).
Health Care Access and Utilization
Healthcare utilization was assessed with the question, “About how long has it been since you last saw a medical doctor about your own health?” Response categories were “Less than 1 year ago,” “1 to 2 years ago,” “More than 2 years ago,” and “Never.” Answers were coded as having at least one visit in the past year (i.e., less than 1 year ago) versus no visit in the past year (i.e., 1 to 2 years ago, More than 2 years ago, or Never).
Usual source of care (yes, no) was assessed by the question, “What kind of place do you go to most often for your medical care?” Responding with doctor’s office, a clinic or hospital clinic, or some other place was coded as having a usual source of care. Emergency room use was coded as not having a usual source of care.
Analysis
Descriptive statistics summarized sociodemographic characteristics, followed by latent class analysis (LCA) to identify distinct patterns of cultural identity, and multinomial regression analyses to estimate factors that differ between classes.
The three cultural identity components and nativity (six indicators total) were used to identify characteristics of mutually exclusive latent classes. The LCA model was first estimated with a one-class model and then increased by one class until the optimum number of classes was identified using fit statistics. In LCA, models are selected using both absolute and relative fit of a model (Lanza & Rhoades, 2013). Absolute fit is measured through the G-squared likelihood-ratio chi-square statistic that tests the null hypothesis of the model, where a significant p-value indicates lack of model fit (Lanza & Rhoades, 2013). Relative fit is measured through Akaike information criterion (AIC) and Bayesian information criterion (BIC) to compare numbers of latent classes. Item-response probabilities—the probability of endorsing a particular item/indicator within each class—were used to interpret the characteristics of each latent class (Collins & Lanza, 2009). All analyses were conducted using SAS 9.3 (SAS Institute INC, 2012) and latent class procedures were downloaded free of charge at https://wayback.archive-it.org/3524/20200430130511/ https://www.methodology.psu.edu/downloads/proclcalta/ (Lanza et al., 2015; University Park: The Methodology Center, 2015).
Multinomial logistic regression was used to estimate the effect of covariates on each latent class compared to the reference latent class. Covariates were added to investigate whether the composition of the latent classes differed by these variables. Covariates added were age (standardized), gender, marital status, education, income, employment, self-rated health, health care access (usual source of care), and utilization (doctor’s visit in the past year).
Results
Descriptive Statistics
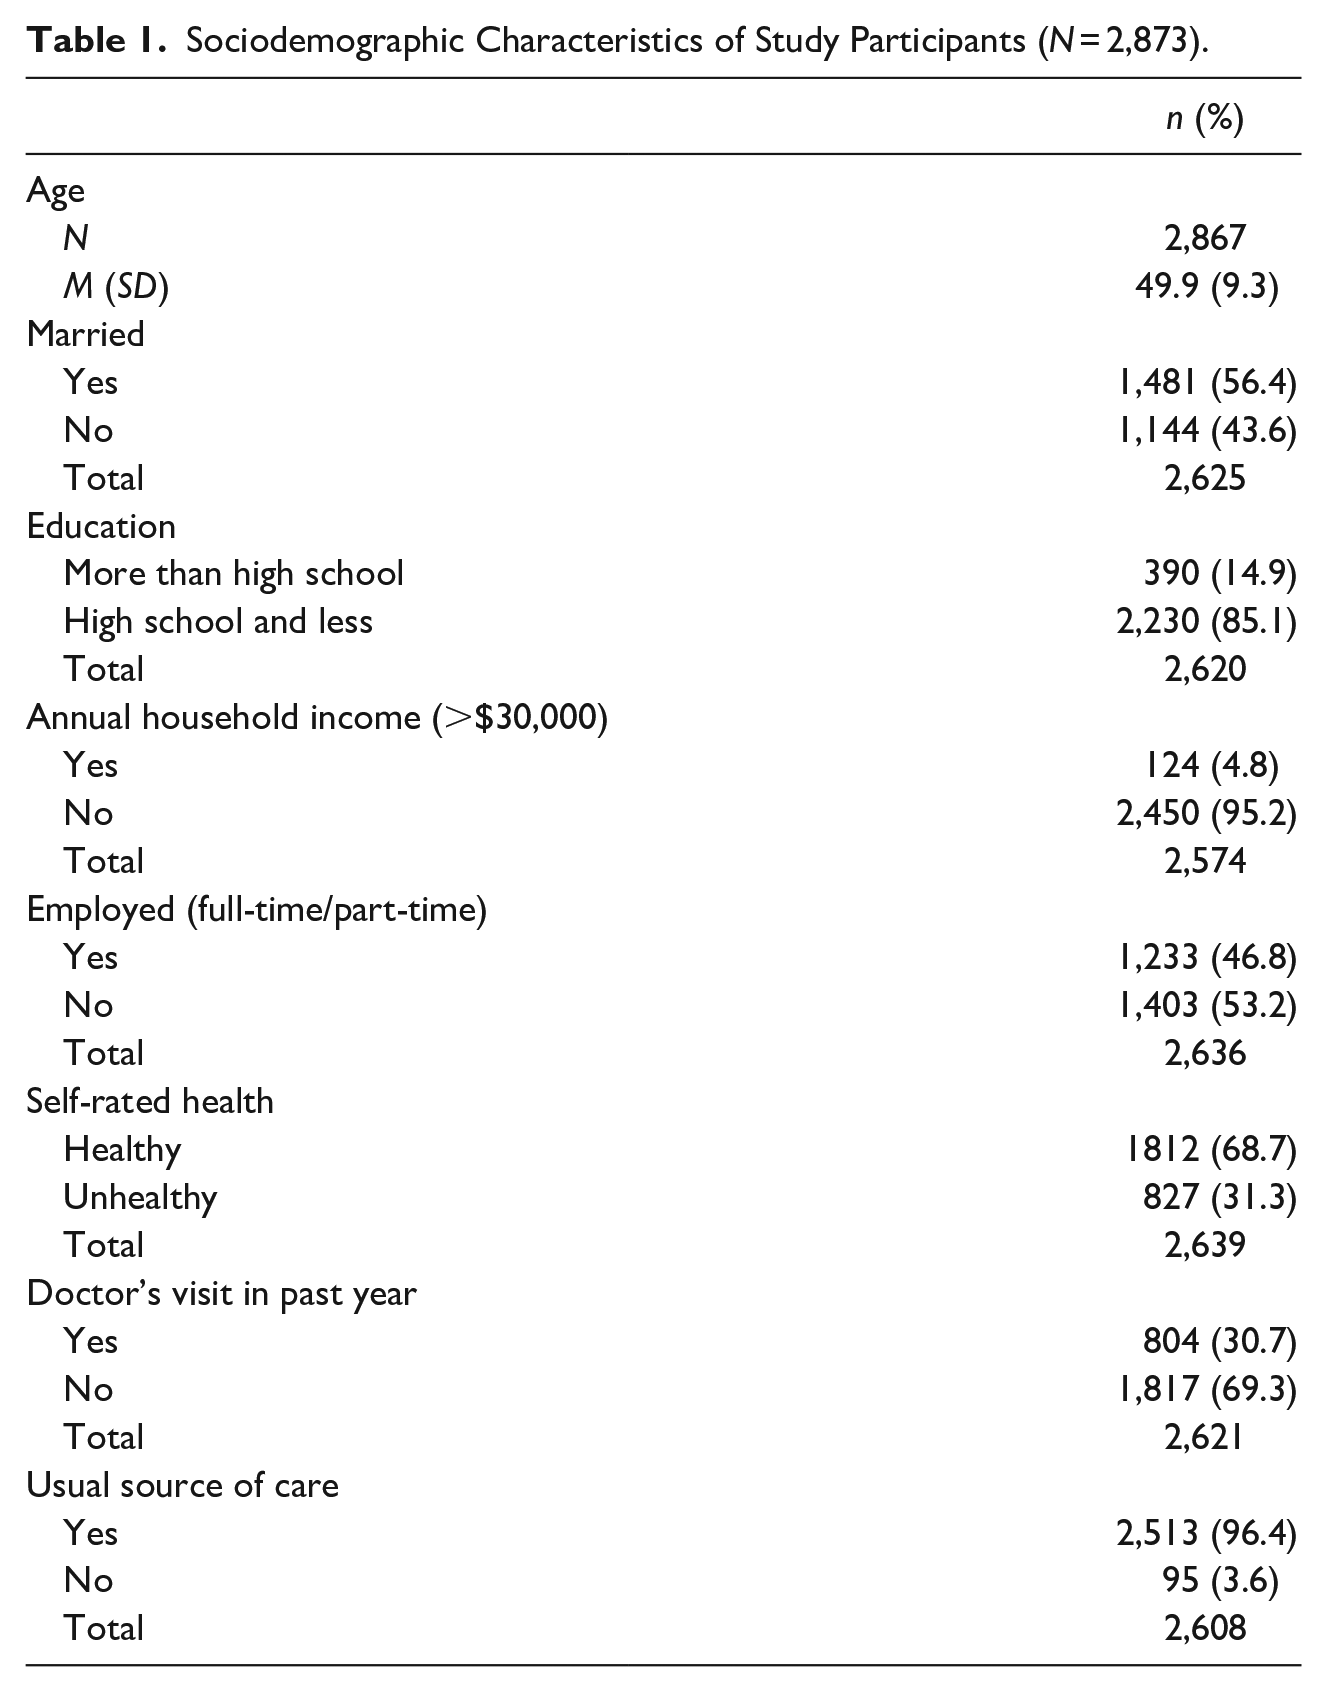
Table 1 provides descriptive statistics for the 2,873 eligible Hispanic/Latino participants. The mean age was 49.9 ± 9.3 years and 56% were married. Most participants (85.1%) had a high school education or less, 5% had an annual household income greater than $30,000, and 53.2% were unemployed. Moreover, 68.7% of participants considered themselves healthy, and 69.3% had not had a doctor’s visit in the past year despite 96.4% having a usual source of care.
Sociodemographic Characteristics of Study Participants (N = 2,873).
Latent Class Analysis
Table 2 presents model fit statistics for each model with increasing number of latent classes. We compared five-, six-, and seven-class models, and chose the six-class model as it provided the optimum number of classes in terms of absolute fit and showed lower AIC and BIC for the relative fit (G-squared = 110.8, df = 258, p-value: 0.99, AIC = 240.8, BIC = 628.4). Also, the interpretation of the class solution held conceptual importance. Table 3 presents the prevalence, probability of membership, and characteristics of each class as manifested through the conditional, item-response probabilities.
Model Fit Statistics and Comparison of Baseline Models.
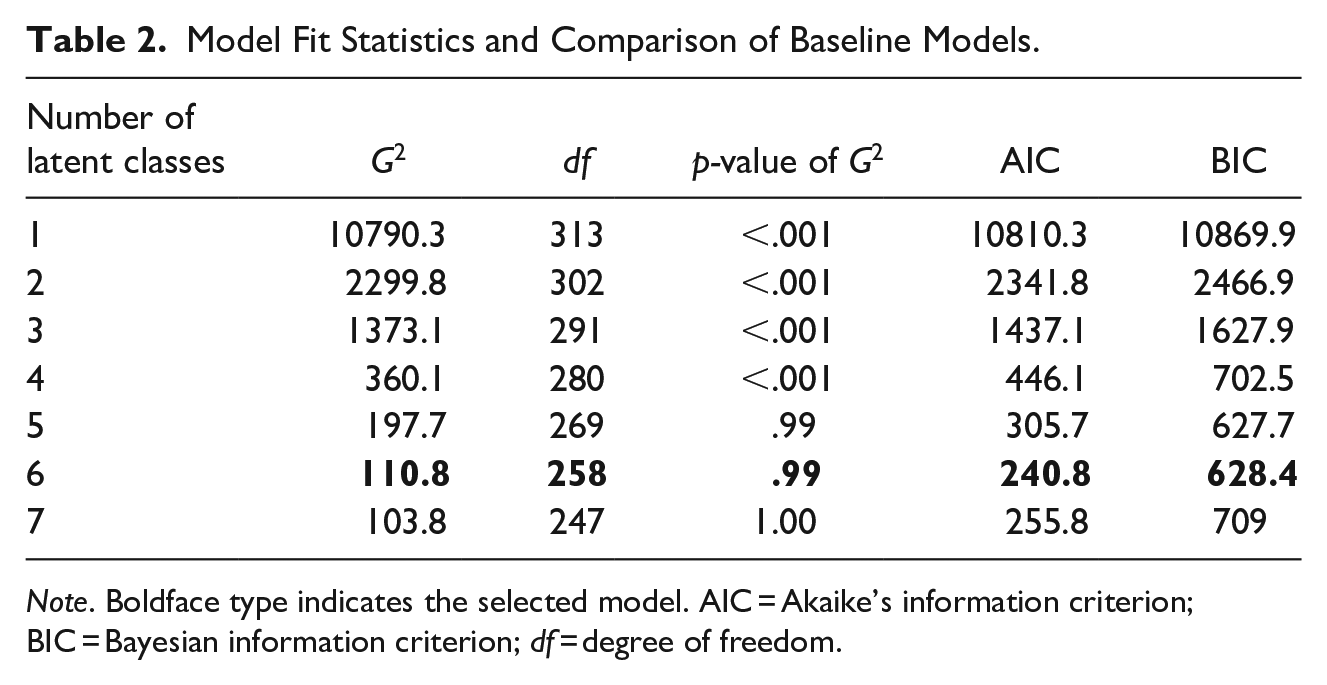
Note. Boldface type indicates the selected model. AIC = Akaike’s information criterion; BIC = Bayesian information criterion; df = degree of freedom.
Item-Response Probabilities for the Six-Class Latent Class Models.
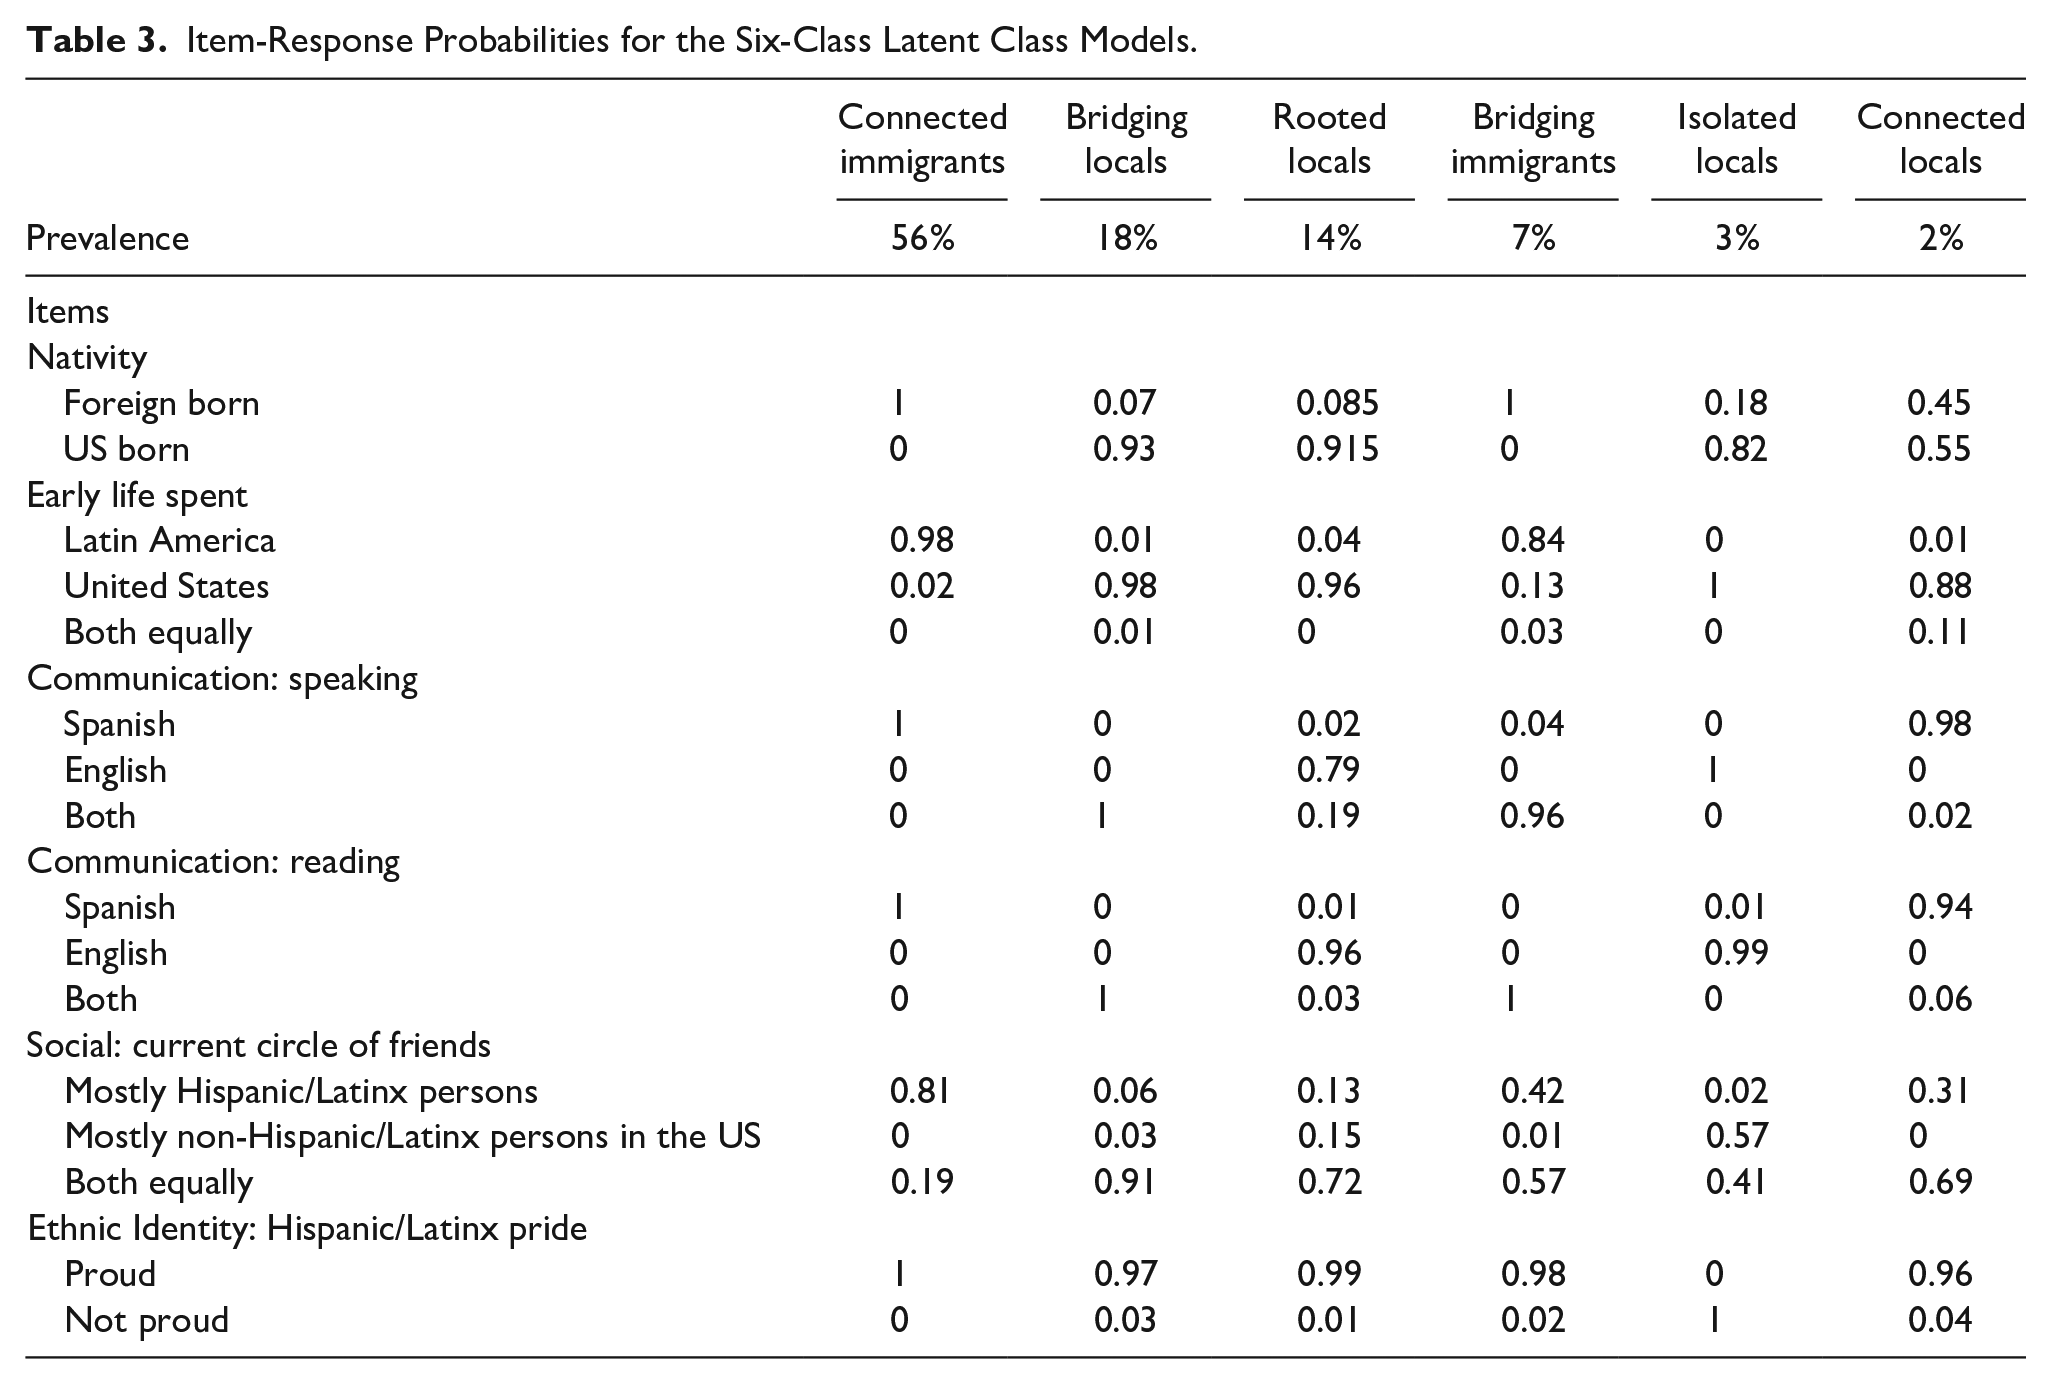
The six latent classes identified were Connected Immigrants, Bridging Locals, Rooted Locals, Bridging Immigrants, Isolated Locals, and Connected Locals. The term “connected” is used to indicate how connected members of a class might be to their Hispanic/Latino heritage. The term “bridging” is used to indicate members bridging between their Hispanic/Latino heritage and US/English communication and culture. The term “rooted” is used to indicate members who have strong connections to US culture and who still identify with their Hispanic/Latino heritage. The term “isolated” is used to indicate members who might be separated or isolated from their Hispanic/Latino heritage. “Immigrant” is used to describe those not born in the US and not having spent their early life from childhood to 21 years of age in the US. “Local” is used to describe individuals who spent their early life from childhood to 21 years of age in the US regardless of where they were born.
Connected immigrants
This class captured 56% of the sample. Members had a probability of 0.81 to 1.0 for selecting “yes” to the following indicators: foreign-born, early cultural life exposure mostly to Latin America, Spanish dominant for both reading and speaking, circle of friends mostly Hispanic/Latino, and having high Hispanic/Latino ethnic pride.
Bridging locals
This was the next largest class and captured 18% of the sample. Members had a high probability of identifying as US born (0.93), early cultural life exposure mostly to the US (0.98), equally fluent in Spanish and English for speaking (1.00) and reading (1.00), having both Hispanic/Latinos and non-Hispanic/Latinos in their current circle of friends (0.91), and having high Hispanic/Latino ethnic pride (0.97).
Rooted locals
This class represented 14% of the sample and members had a high probability of identifying as US born (0.92), early cultural life exposure to the US (0.96), English dominant in speaking (0.79) and reading (0.96), and high Hispanic/Latino ethnic pride (0.99). This class also had a high number of those with both Hispanic/Latino and non-Hispanic/Latino friends in their current circle of friends.
Bridging immigrants
This class represented 7% of the sample and members had a high probability of being foreign-born (1.0), having early cultural life exposure to Latin America (0.84), Spanish dominant for speaking (0.96) and reading (1.00), and having high Hispanic/Latino ethnic pride (0.98). What differentiated this group from connected immigrants is that they had a 0.57 probability of indicating having both Hispanic/Latino and non-Hispanic/Latinos in their current circle of friends.
Isolated locals
This class was the second to smallest class, representing 3% of the sample, and members had high probabilities of being US born (0.82), having early cultural life exposure to the US (1.00), and English dominant in speaking (1.00) and reading (0.99). Further, they had a 0.57 probability of having mostly non-Hispanic/Latinos in their current social circle. What distinguished this class from others was the high probability (1.0) of class members indicating that they were not proud of their Hispanic/Latino ethnic heritage.
Connected locals
This was the smallest class, representing 2% of the sample, and members with high probabilities of being Spanish dominant for speaking (0.98) and reading (0.94), having early cultural life exposure to the US (.88), and having high Hispanic/Latino ethnic pride (0.96). Members also had a 0.55 probability of being born in the US and a 0.69 probability of having both Latino/Hispanic and non-Hispanic/Latinos in their current circle of friends.
Multinomial Regression
Table 4 presents results of the multinomial regression analyses identifying differences in latent class membership by age, sex, marital status, education, income, employment, self-rated health, healthcare utilization, and usual source of care. Connected Immigrants served as the reference latent class due to its large sample size.
Multinomial Regression Model Comparing the Various Latent Classes to the Connected Immigrants Class Across Health Care Determinants.
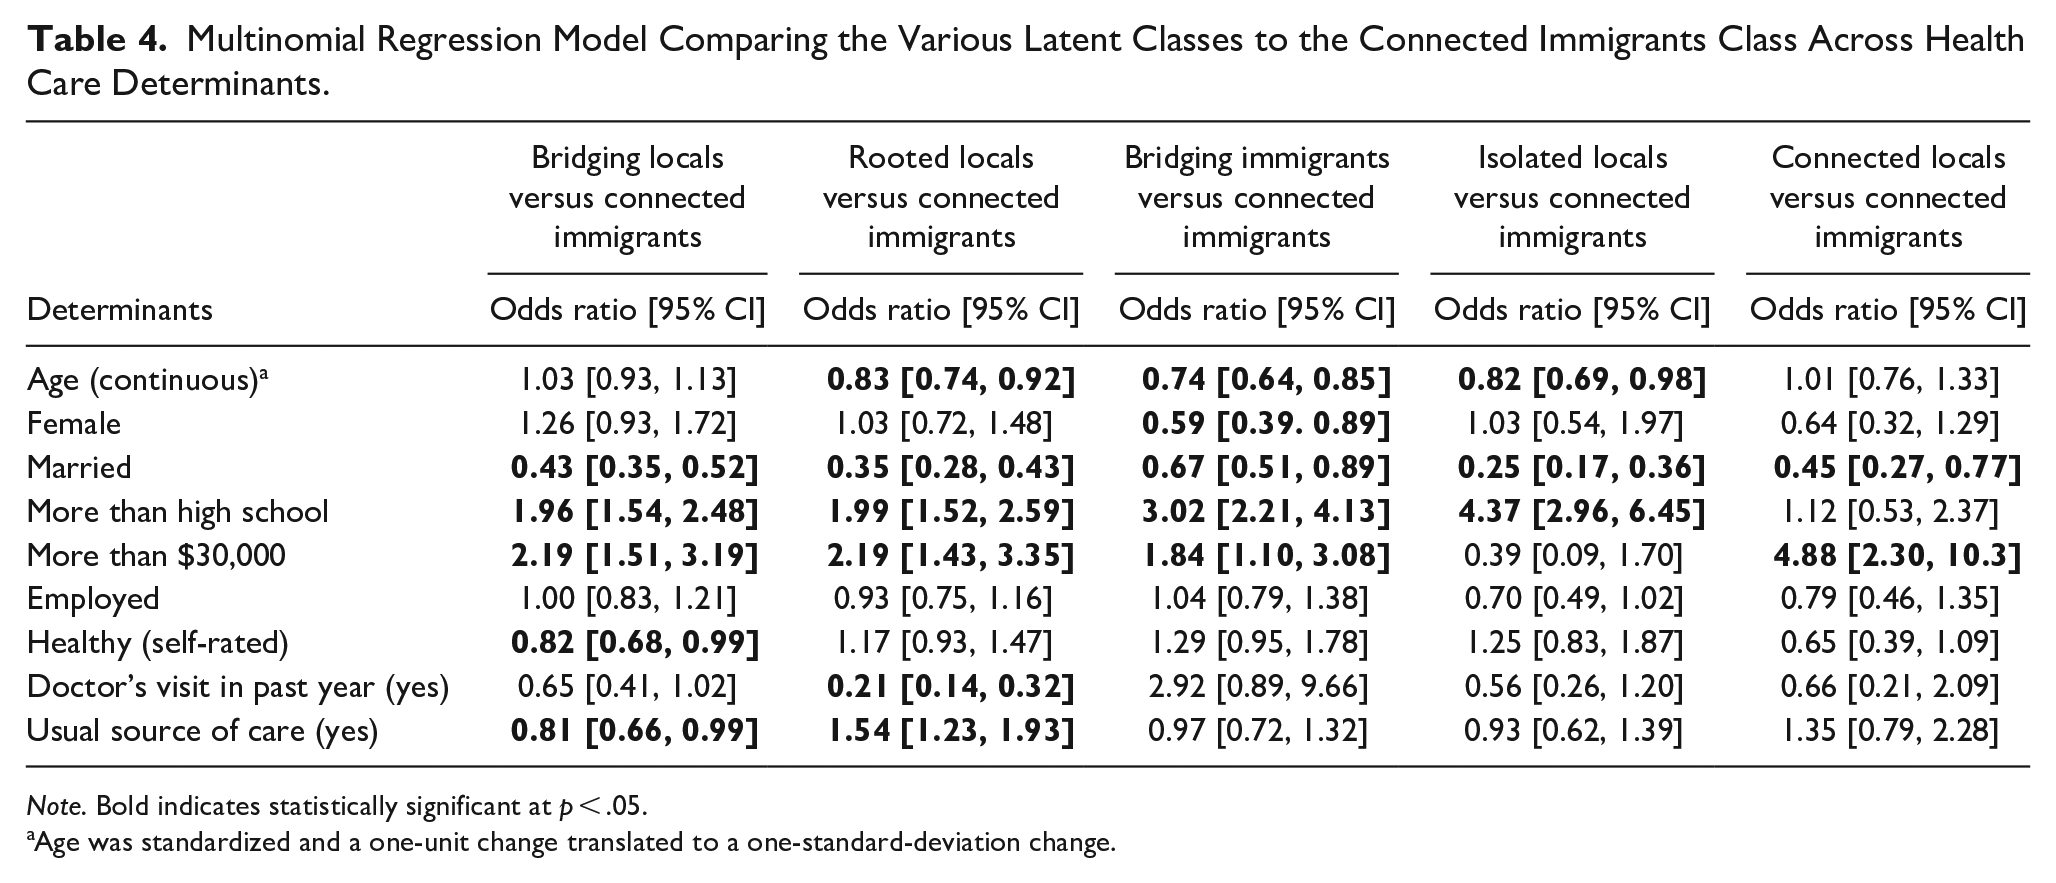
Note. Bold indicates statistically significant at p < .05.
Age was standardized and a one-unit change translated to a one-standard-deviation change.
Individuals with more than a high school education (vs. high school or less) are more likely to be Bridging Immigrants than Connected Immigrants (OR = 3.02, 95% CI: 2.21, 4.13), as are those with an annual income >$30K compared to <$30K (OR = 1.84, 95% CI: 1.10, 3.08). Membership in the Bridging Immigrants class is less likely for married compared to unmarried individuals (OR = 0.67, 95% CI: 0.51, 0.89) and for every standard deviation increase in age (OR = 0.74, 95% CI: 0.64, 0.85). This suggests that, compared to the Connected Immigrants group, members of the Bridging Immigrants group are likely to be younger, unmarried, and have higher socio-economic status (SES) (education and income).
Membership in the Connected Locals group (vs. Connected Immigrants) is more likely for those with an annual income >$30K versus <$30K (OR = 4.88, 95% CI: 2.30, 10.3) and less likely for married versus unmarried (OR = 0.45, 95% CI: 0.27, 0.77) individuals. This suggests that the Connected Locals group are likely to be unmarried and have a higher annual income as those in the Connected Immigrants group.
Membership in the Bridging Locals group (vs. Connected Immigrants) is more likely for individuals with more than a high school education compared to high school or less (OR = 1.96, 95% CI: 1.54, 2.48) and for those with an annual income of >$30K compared to <$30K (OR = 2.19, 95% CI: 1.51, 3.19). Membership is less likely for those who are married versus not married (OR = 0.43, 95% CI: 0.35, 0.52) and those who have a usual source of care versus no usual source of care (OR = 0.81, 95% CI: 0.66, 0.99). This suggests that the Bridging Locals group are likely to be unmarried, not have regular health care, and have higher SES than the reference group.
Membership in the Rooted Locals group (vs. Connected Immigrants) is more likely for those with more than a high school education than those with high school or less (OR = 1.99, 95% CI: 1.52, 2.59), an annual income of >$30K (OR = 2.19, 95% CI: 1.43, 3.35) compared to <$30K, and those with a usual source of care (OR = 1.54, 95% CI: 1.23, 1.93) compared to those with no usual source of care. Membership is less likely for every standard deviation increase in age (OR = 0.83, 95% CI: 0.74, 0.92), for married versus unmarried individuals (OR = 0.35, 95% CI: 0.28, 0.43), and for those with a doctor’s visit in the past year than those with no doctor’s visit (OR = 0.21, 95% CI: 0.14, 0.32). This suggests that members in the Rooted Locals group are likely younger, unmarried, and less likely to have seen a doctor despite higher SES and having a usual source of care.
Membership in the Isolated Locals group (vs. Connected Immigrants) more likely for those with more than a high school education than those with HS or less (OR = 4.37, 95% CI: 2.96, 6.45) and less likely for every standard deviation increase in age (OR = 0.82, 95% CI: 0.69, 0.98) and for married versus unmarried individuals (OR = 0.25, 95% CI: 0.17, 0.36). This smallest group suggests that Isolated Locals are also likely younger, unmarried, and more educated than the Connected Immigrant group.
Discussion
Identifying subgroups of people based on their cultural experiences may lead to more targeted interventions than simply identifying associations between variables. This person-centered approach identified six distinct groups within a population of Hispanic/Latino men and women who had not adhered to cancer screening guidelines. Although the sample represented an immigrant population, the Connected Immigrants group (who remain highly connected to their Latino culture and are Spanish language dominant) stood in stark contrast to Rooted Locals, those who are US born and raised, English language dominant, and have non-Hispanic/Latino friendship groups. These differences should shape health messaging beyond variables such as ethnicity and language.
Hispanic/Latino populations are often assumed to be a monolithic group and interventions rely on single variables, such as nativity or language, to identify study populations or target interventions. Our results show how identifying subgroups can provide a better understanding of the audiences we attempt to reach and how to best serve them. For example, those who belong to the Bridging Immigrants group are generally younger, unmarried, and have higher education and income than those in the Connected Immigrants group. Similarly, Bridging Locals are likely unmarried and more likely to have higher SES than the Connected Immigrants group. Thus, both Bridging groups would likely not benefit from interventions relying on a spouse, whereas partner-based interventions may be effective for the Connected Immigrants group.
A counterintuitive finding of this study was that those who belong to the Bridging Locals group were less likely to report having a usual source of care, despite high SES indicators (education and household income), compared to the Connected Immigrants group. Recent data on Hispanic adults from the Kaiser Family Foundation (KFF) shows that 32% of permanent residents and 30% of potentially undocumented immigrants compared to 19% of US-born Hispanic adults say they have no usual source of care (Artiga, Hamel, Kearney, et al., 2021). Our finding that the Bridging Locals are less likely than Connected Immigrants to have a usual source of care is contrary to the KFF data and may be due to our specific study location. Those in the Connected Immigrants group have greater access to safety net services, including no-cost or reduced-cost health care services, in the San Antonio area. Those in the Bridging Locals group, on the other hand, are less likely to qualify for no-cost or reduced cost services or Medicaid (due to their higher SES indicators and Texas being a state without Medicaid expansion). Thus, the Bridging Locals are less likely to report having a usual source of care. Although the safety net system in San Antonio does offer a financial assistance program for uninsured individuals (City of San Antonio, 2018), and assigns a primary care provider once individuals are approved, the program only establishes a monthly payment plan. The program is not health insurance, and as a result, most individuals carry a balance, making people reluctant to enroll in the program or access health care for fear of incurring debt. Additionally, the finding among the Bridging Locals group illuminates a pattern of cultural variables that are important to understanding health care access and highlights a gap in health care as they may be unable to obtain needed health care in their area.
Similarly, the Rooted Locals group is less likely to have seen a doctor, despite having higher SES and a usual source of care, compared to the Connected Immigrants group. This finding aligns with data in the KFF report (Artiga, Hamel, & Kearney, 2021) that stated that compared to Hispanic adults ages 65 and older, younger Hispanic adults are less likely to report having seen a doctor or other health care provider. The Rooted Locals are overall younger than the Connected Immigrants groups and thus may be healthier and/or not see themselves at risk for negative health outcomes. Our finding also aligns with another report from the Pew Research Center: Hispanic individuals who are English dominant report having a primary care provider compared to bilingual or Spanish dominant (Funk & Hugo Lopez, 2022). Part of the explanation may be communication challenges. Spanish language dominant Hispanics (81%) and bilingual Hispanics (27%) prefer to see Spanish-speaking providers (Funk & Hugo Lopez, 2022). The Rooted Locals group are English language dominant and thus may have more choices for health care providers.
Findings also revealed that, except for Isolated Locals, all groups reported high Hispanic/Latino ethnic pride. Ethnic identification is an indication of how much a group embraces their heritage culture, how they feel about belonging to their ethnic group and their sense of belonging (Phinney, 1990). Ethnic identity also is predictive of general well-being (Phinney, 2001; Wilson & Leaper, 2016). The Isolated Locals, while a small group, are clearly distinct from the others: ethnic identification is not part of their identity. This likely implies that interventions tailored to Latino culture and Spanish language would not suit them.
This study has limitations. First, the overall model may be over-specified. However, when we examined the different classes, one of the smallest classes (i.e., Isolated Locals) was truly unique because of the low ethnic pride indicator. Had we chosen a lower number of classes, this unique group would have been absorbed into one of the other groups and important considerations on how to reach this group would have been lost. Second, we did not include other important socio-cultural variables, such as years spent in the US, as it was highly correlated with nativity, and may also influence latent class modeling. Furthermore, important psychosocial variables, such as cancer knowledge, attitudes, and beliefs, should be explored in relation to latent class membership to better understand differences between classes that may shape stronger tailored cancer prevention messaging.
New Contribution to the Literature
This is the first study using a person-centered approach that better defines specific groups of Hispanic/Latinos who are non-adherent to breast, colorectal, and cervical cancer screening guidelines. The strength of this approach was the ability to identify sociodemographic and health care factors as patterns within individuals that create differentiated groups. Understanding cultural identity may help us develop and target interventions that better reach the diverse Hispanic/Latino population in the US. Assuming that Hispanic/Latino populations are either broadly Spanish-speaking or immigrants from a different country of origin (i.e., not the U.S.) will produce poor intervention recruitment and participation, yet understanding the complexities of their identity will bolster those efforts.
Future research is needed to improve targeted outreach and communication strategies for the diverse group of Hispanic/Latino population in the US. Such research could involve duplicating the process used here to assign individuals to groups and then testing interventions adapted to each group to determine whether those interventions increase cancer screening. Additionally, more research is needed to explore the causes and implications of lack of ethnic pride in healthcare engagement.
Footnotes
Declaration of Conflicting Interests
The author(s) declared no potential conflicts of interest with respect to the research, authorship, and/or publication of this article.
Funding
The author(s) received no financial support for the research, authorship, and/or publication of this article.
Ethical Approval
The Institutional Review Board at Oregon State University approved this study (#8320).