
Abstract
The table accompanying Stephen Lacy and Frederick Fico's article, “Newspaper Quality & Ownership: Rating the Groups,” in the Spring 1990 issue of Newspaper Research Journal contained errors that may have confused some readers.
First, the average quality index scores for the groups were incorrect. The first column in the table was taken from an earlier version of the study that used a 98-newspaper sample instead of the 80-paper sample reported in the article. The correct average scores, equal to the average of the individual scores given in endnote 31, are shown in the corrected table. The ranking of the groups remain the same through the seventh group; some of the groups in the lower eight rankings changed positions, but all scores remain low relative to the top six groups.
The standard deviations in the original table also were based on the earlier 98-paper sample; those have been corrected in the substitute table, as have the average scores controlling for circulation for independent newspapers.
The inaccuracies in the original table did not affect the study's conclusions. These are that: 1.) There is no systematic impact of ownership on newspaper quality; 2.) Limitations of resources must be considered in evaluating quality of a newspaper or group; 3.) Criticism of newspaper ownership should be based on systematic, replicable research.
The authors and NRJ's editors apologize for the errors and thank Keith Sanders for bringing the mistakes to their attention. The new table on the following page should replace Table 1 on page 50 of the Spring issue (11:2). — The Editors
Erratum - to replace Table 1, p. 50, NRJ 11:2 (Spring 1990)
Average news quality index for 15 newspaper groups and Independent newspapers, rated on eight quality factors Groups were evaluated on eight quality factors, yielding a raw score* and a ranking, 1–15 (plus independents) and then ranked again with circulation factors included.** Times Mirror, for instance, ranked first for quality before circulation is considered, drops to third; Stauffer, ranked last before circulation is factored in, leaps to second. Note: The original sample of 114 dailies was reduced to 80 because of statistical limitations in some of the data. The standard deviations for the original quality index were: Times Mirror (3.26): Newhouse (1.72); Hearst (1.39); Scripps Howard (1.15): Capitol Cities (2.62); New York Times Co, (1.23): Gannett (2.61): Donrey (2.72): Harte-Hanks (1.53); Clay (.93); Scripps League (1.17): Thomson (2.75); Lee (.85); Ottaway (.55); Stauffer (.56), All Independents (5.83). These figures are residuals from a regression equation that predicts news quality index scores from circulation. The residual is determined by subtracting the predicted score from the actual score. The closer the residual is to zero, the more the group performs as expected, based on circulation size, A positive residual indicates that the group has a larger index score than expected; a negative residual score Indicates a lower score than expected.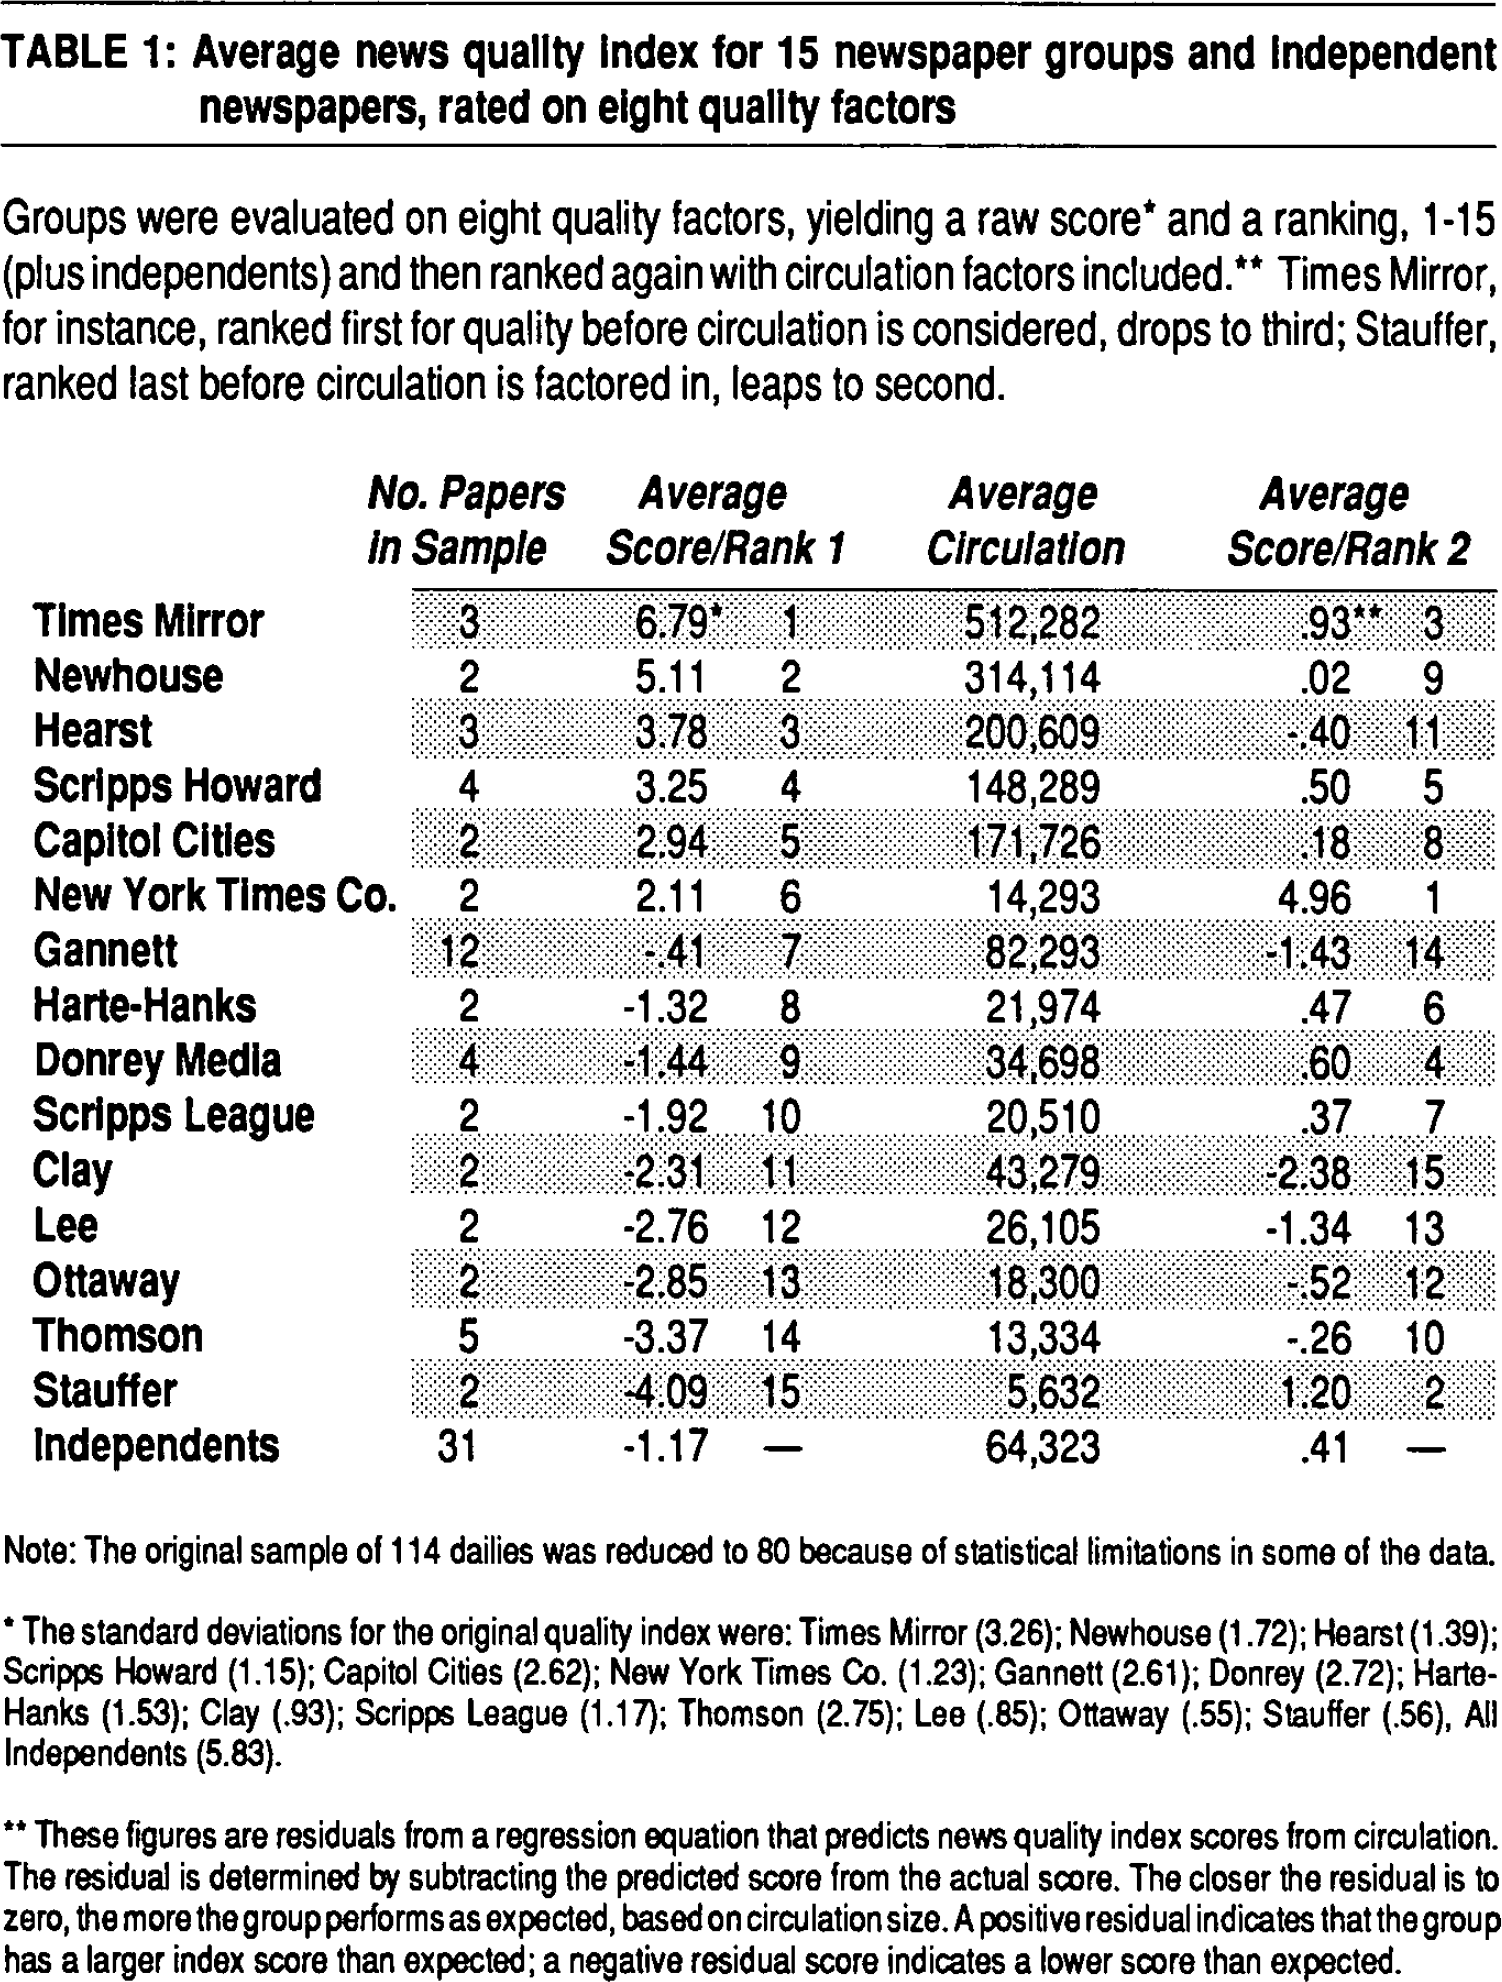
No. Papers in Sample
Average Score/Rank 1
Average Circulation
Average Score/Rank 2
Times Mirror
3
6.79* 1
512,282
.93* 3
Newhouse
2
5.11 2
314,114
.02 9
Hearst
3
3.78 3
200,609
−.40 11
Scripps Howard
4
3.25 4
148,289
.50 5
Capitol Cities
2
2.94 5
171,726
.18 8
New York Times Co.
2
2.11 6
14,293
4.96 1
Gannett
12
−.41 7
82,293
−1.43 14
Harte-Hanks
2
−1.32 8
21,974
.47 6
Donrey Media
4
−1.44 9
34,698
.60 4
Scripps League
2
−1.92 10
20,510
.37 7
Clay
2
−2.31 11
43,279
−2.38 15
Lee
2
−2.76 12
26,105
−1.34 13
Ottaway
2
−2.85 13
18,300
−.52 12
Thomson
5
−3.37 14
13,334
−.26 10
Stauffer
2
4.09 15
5,632
1.20 2
Independents
31
−1.17 –
64,323
.41 –
Get full access to this article
View all access options for this article.