
Abstract
Transit ridership had been decreasing in major cities across the United States prior to the Covid-19 pandemic, with Seattle as a notable exception. I examine the relationship between travel behavior and Seattle’s land use planning program in conjunction with transit improvements. I use econometric methods to analyze multiple waves of the Puget Sound Regional Council (PSRC) Household Travel Survey from 2014 to 2021. Living in one of Seattle’s Urban Villages is significantly associated with a higher likelihood of taking transit. This relationship holds during the pandemic time period and when controlling for self-selection.
Keywords
Introduction
Transit ridership decreased dramatically in cities across the United States during the pandemic, and there are questions about how many riders will return to transit in the pandemic’s recovery period (Brough, Freedman, and Phillips 2020). Transit system ridership is important for reasons of both equity and sustainability. In terms of equity, fares fund a significant portion of public transit operating costs in the United States, so transit ridership is necessary to sustain service levels for populations who rely on transit. In terms of sustainability, transportation is the largest contributor of direct U.S. greenhouse gas emissions, and trips taken on public transit instead of using a private vehicle emit far fewer emissions per passenger mile.
Many U.S. cities had been facing challenges related to transit ridership even prior to the pandemic, and transit ridership had been decreasing in most major U.S. cities in the late 2010s. One of the few exceptions to declining transit ridership in U.S. cities prior to the pandemic was Seattle, where bus ridership had seen consistent increases up to 2020 (Badger and Bui 2020). Seattle has a longstanding land use program, the Urban Villages program, which concentrated residential and employment growth in certain neighborhoods across the city since the 1990s. Transit improvements were also focused on these areas. In this paper, I examine a specific component related to Seattle’s overall transit ridership: the relationship between Seattle’s Urban Villages land use program, with coordinated transit improvements, and the propensity to take transit.
This research analyzes travel behavior in Seattle in relation to its land use program, and in particular bus ridership. I place an emphasis on bus ridership due to the relatively lower cost, wider service areas, and higher flexibility of bus systems compared to light- and heavy-rail systems. I use econometric models to analyze a repeated cross-sectional household travel survey to understand the relationship between Seattle’s coordinated land use planning program and transit improvements in Urban Villages and travel behavior and the choice to take transit. I find that residents in Seattle’s Urban Villages are more likely to be transit riders and bus riders, and that this relationship continues to hold during the pandemic period. Evidence from the case of Seattle offers insight into ways other cities may be able to support transit ridership, through coordinated land use planning and transit improvements.
I first describe the case of Seattle and my research questions. I then provide an overview of the literature on the built environment and travel behavior, with a focus on ways of accounting for the challenge of self-selection and a brief discussion of transit impacts due to the pandemic. I then describe my methods and data and present findings from my analysis.
The Case of Seattle
Starting in the 1990s, the City of Seattle’s comprehensive plans designated Urban Villages, twenty-eight neighborhoods across the city, for development. From 1994 to 2014, 75 percent of Seattle’s residential and employment growth occurred in these areas, and they remain the primary areas of the city for multifamily housing development (Steinbrueck et al. 2015). King County Metro, the region’s transit agency, focused its transit service improvements around these Urban Villages. In 2006, King County voters approved a transit initiative for a Bus Rapid Transit (BRT)-like system, called RapidRide, among other improvements, and this initiative passed along with a property tax levy for transportation funding in the City of Seattle itself. There was also public support for dedicated bus lanes (Ray 2019). King County’s RapidRide service contains many elements similar to BRT, such as real-time arrival information and frequent service. The first RapidRide line was completed in 2010, with the other six lines following in the early 2010s. Seattle’s single light rail line was also developed in this time period, first opening in 2009 with new stations developed through 2021, along the eastern side of the city and through several Urban Villages. Seattle’s Urban Villages and planned transit lines with frequent service are illustrated in Figure 1, from the Seattle Planning Commission (2010).
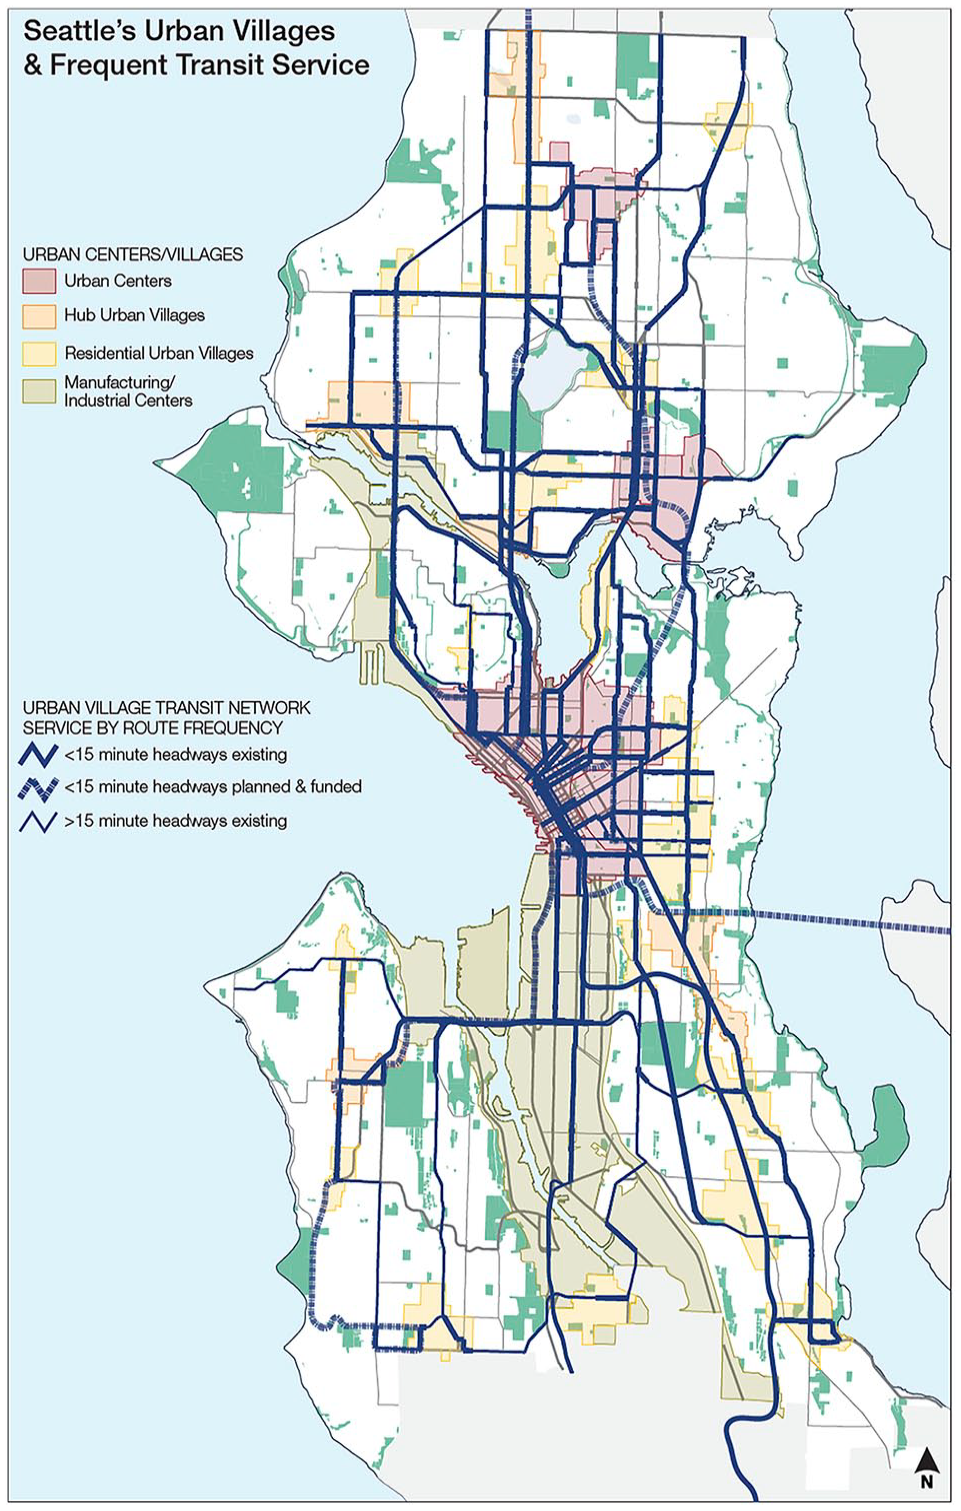
Seattle’s Urban Villages and frequent transit service (Seattle Planning Commission 2010).
Seattle is a unique case for its success in transit ridership, but is representative of other U.S. cities in several ways (Yin 2003). Seattle ranks around 20th among U.S. cities in both population size and population density, and city residents have a higher per-capita car ownership rate than those of Los Angeles. Similar to many other high-cost cities, Seattle has seen recent population growth and sharp increases in inequality, and is geographically constrained by bodies of water. In other ways, however, Seattle may be unique: news outlets like CityLab have attributed some of Seattle’s transit success to a young population that recently moved to the region (Bliss 2018). I examine demographic characteristics in addition to Seattle’s land use planning and transit improvements in my analysis.
Research Gaps and Objectives
I contribute to the literature by providing an update on the relationship between transit and compact development in the Covid-19 era. Previous research has examined the impacts of the built environment on transit use during the pandemic, but most of these studies focused on the immediate aftermath of the pandemic (Ahangari, Chavis, & Jeihani 2020; Xiao, Wei, and Wu 2022). I focus on bus ridership, which has been historically under-studied in the U.S., and respond to calls for more research on specific transportation modes (Aston et al. 2020). I also address questions relating to self-selection by using a direct survey question to understand the influence of the built environment on both those who self-selected into certain types of neighborhoods and those who did not. Following Handy, Cao, and Mokhtarian (2005) I examine trip type (work and nonwork travel) to understand if differences in mode choice are driven primarily by commute trips. I establish a case where transit-oriented development (TOD) is coming closer to meeting expectations (Carlton 2019), and speak more broadly to the relationship between Smart Growth policies and automobile dependence (Jun 2008).
Research Questions
I address the following research questions:
Examining these questions involves analyzing other components related to the travel behavior of Seattle-area residents, including demographic characteristics and recent movers to the area.
Literature Review
I build upon and contribute to three areas of literature: the impacts of the built environment and density on travel behavior, and transit ridership in particular; the interaction of self-selection on built environment effects; and the impacts on transit ridership since the Covid-19 pandemic.
Built Environment Effects on Travel Behavior and Transit Usage
The built environment’s effects on travel behavior have been a central focus of transportation planning literature. A comprehensive meta-analysis of fifty built environment-travel studies found significant impacts on vehicle miles traveled (VMT), walking trips, and transit trips from the built environment (Ewing and Cervero 2010). However, researchers disagree on the relative importance of the built environment: some have found that individual characteristics are as important, if not more important, in explaining behavior (Boarnet 2017), while others find that the built environment plays a bigger role than attitudes and residential preferences do (Ewing et al. 2015).
There are many aspects of the built environment which can influence travel behavior. Specifically, with regard to transit use, factors like intersection design and street connectivity play an important role, and transit trips are strongly associated with transit access, living near bus stops, intersection density, street connectivity, and land use mix (Ewing and Cervero 2010). Other research has found that transit use varies with densities and the degree of land mixing, along with parking availability and socioeconomic characteristics (Ewing et al. 2015).
I specifically examine land use planning related to residential density. The specific impacts of density are hard to tease apart, but the general consensus is that it matters, as a “pivotal characteristic” of areas that support alternative modes of transit, or in conjunction with factors like design and destination accessibility (Ewing and Cervero 2010; Ewing, Pendall, and Chen 2002; Ewing et al. 2015; Rodríguez, Targa, and Aytur 2006). A common refrain from literature on public transit costs and efficiencies, “mass transit needs mass” describes the large role that density plays in the cost-effectiveness of transit (Guerra and Cervero 2012). A review of fifteen regions found that the likelihood of making transit trips depends on the land use diversity and design of the environment around a household and the compactness of their region (Ewing et al. 2015). Research on BRT stops found that stations with TOD-like features generally had higher ridership than those with limited TOD orientations (Rodríguez and Vergel-Tovar 2018). I build on research on how land use connects to automobile dependence (Zhang 2006), neighborhood accessibility and land use-travel behavior (Krizek 2003), and the link between urban form and nonwork travel behavior (Handy 1996).
Research from many decades ago has indicated that transit use could be increased via policies that increase density (Pushkarev and Zupan 1977, in Handy, Cao, and Mokhtarian 2005). More recently, meta-analysis using multi-regression analysis has questioned the benefits of using the built environment to change travel behavior given its low elasticities (Stevens 2017). However, Ewing and Cervero (2017) describe that in sum, small elasticities can be very significant, and a significant portion of phenomena studied by planners is inelastic: for example, fuel prices are often considered an important area for intervention despite having low elasticities (Ewing and Cervero 2017). Following Ewing and Cervero, I maintain the importance of studying the built environment on travel behavior despite low elasticities due to the potential for impact across a population.
Residential Self-Selection Into Transit-Accessible Locations
One complicating factor is that residential self-selection also plays a role in the estimated effect of the built environment on transportation mode choice: people’s attitudes underlie residential choices as well as mode choices. Findings on the built environment’s effect on travel behavior might be due to the self-selection of residents into compact or sprawling areas (Cao, Mokhtarian, and Handy 2009). Research has described that people generally jointly choose housing with travel modes and the trip to work in mind, along with the resale value of a house (Chatman 2009; Fischel 2001; Litman 2005; Tiebout 1956). These preferences are closely tied to housing and neighborhood attributes, travel times and costs, and sociodemographic traits (Cao, Mokhtarian, and Handy 2009).
It is difficult to find experiments regarding residential preferences and the built environment, or to randomize moves to different neighborhood types (Cao, Mokhtarian, and Handy 2009; Handy, Cao, and Mokhtarian 2005). Scholars have therefore tried to account for the preferences and attitudes that influence the choice of a neighborhood in different ways, from direct questioning to instrumental variables or propensity score matching (Cao, Mokhtarian, and Handy 2009). While methods may differ, the consensus of empirical evidence seems to indicate that, even when controlling for self-selection, the built environment has a statistically significant impact on travel behavior (Cao, Mokhtarian, and Handy 2009). However, studies disagree on whether self-selection over- or under-estimates the effect of the built environment (Ewing and Cervero 2010; Stevens 2017). First, the direction of influence depends on the variation in travel preferences, or elasticities of travel: whether or not people’s travel behavior will change depending on options available. Different shares of the population will have different responsiveness to the built environment, based on preferences and other factors being weighed (Cao and Chatman 2016; Chatman 2009). Second, the influence also depends on the supply of different residence types, and whether these options are available or findable within peoples’ willingness to pay. Strict land use regulations mean that it is likely that residents with certain preferences for residential location (e.g. for dense, transit-rich areas) may not be able to live in such areas (Chatman 2009). If people who seek accessible neighborhoods are unable to find them, the correlation between preexisting and built environment characteristics may not be significant enough to bias estimates; if the share of mismatched households is over 50 percent, not accounting for self-selection will under-report the impacts of the built environment (Cao and Chatman 2016; Chatman 2009).
Understanding the importance of self-selection and results from prior research findings showing that there is unmet demand for walkable and transit-oriented neighborhoods (Frank et al. 2019), I study and account for self-selection in this research through the use of an explicit survey question asking about the importance of public transit access in a respondent’s most recent residential location decision.
Recent Changes to Transit Ridership and Travel Behavior, Prior to and During the Pandemic
Previous research has examined the decline in transit ridership since the Covid-19 pandemic, and found the decline in U.S. public transit ridership prior to the pandemic to be due to factors both internal and external to transit agencies (Brough, Freedman, and Phillips 2020; Taylor and Fink 2013). Prior declines in ridership may be partly due to the emergence of new modes such as ridehailing, whose effects have compounded over time (Graehler, Mucci, and Erhardt 2019). Broader increases in car ownership and low operating costs may also play a role in decreasing transit ridership (Blumenberg et al. 2020; Manville, Taylor, and Blumenberg 2018). During the pandemic, ridership declines may have been attributable to employment location shifts, concerns of infection risk, as well as being affected by transit service changes (Parker et al. 2021; Ahangari, Chavis, and Jeihani 2020). Other challenges now faced by transit agencies include people experiencing homelessness using transit facilities for shelter (Wasserman et al. 2022). My research builds on these insights by examining the impact of the built environment through the pandemic period.
Methods
Data Sources and Cleaning
I employ multiple waves of the Puget Sound Regional Council’s (PSRC) large-scale household travel and activity survey, conducted every one to two years. While not a panel, and therefore not following specific households over time, the survey nevertheless offers a detailed view of households and their travel across the region, with a 7-day trip diary including modes and trip purposes, and the successive waves show how travel has changed over time. Some respondents fill out online surveys at the end of each travel day, while others make use of a smartphone application to record trips. The data consists of individual, household, and trip-level information, including information on: sociodemographic characteristics; car ownership; home and work locations; trip distance, purpose, and mode; and residential location history and reasons for the most recent move.
I employ data from 2014, 2017, 2019, and 2021 for my analyses. While the majority of survey questions remain the same, race/ethnicity information is missing from the 2014 wave. I restrict my results to King County, the area for the King County Metro transit system, and to adults who had taken at least one trip in their trip diary week. The total sample size is 14,715 respondents: 5,777 in 2014, 4,228 in 2017, 3,207 in 2019, and 1,434 in 2021. The travel survey oversampled Urban Village residents, 1 which assists me in my examination of the association that living in these Urban Villages has on travel behavior.
In addition to the PSRC household travel survey, I use data on features of the built environment from the Smart Location Database (SLD) 2020 for background on characteristics of the built environment for Urban Village and non-Urban Village residents. The Smart Location Database, by the EPA, summarizes location attributes at the census block group level for characteristics including transit service and diversity of land use. 2
The PSRC household travel survey contains two forms of geographic information I analyze: the census tract and the Urban Village in which a household’s primary residence is located (or information that the residence is not in an Urban Village). The Urban Village location is useful as most Urban Village boundaries are not contiguous with census tract boundaries, so this information is more precise than the census tract when it comes to determining inclusion in Urban Villages.
I join information from the household, individual, and trip files and append them across years. I summarize information from the SLD to the census tract level (from the block group), and join this to the census tracts survey respondents live in to gather background information about Urban Village characteristics. I examine the relationship between travel behavior and the Urban Village program, including both the built environment and transit service frequency components of the Urban Villages program. The Appendix contains information specifically on some of the service frequency characteristics and built environment characteristics that differ between respondents in Urban Villages and non-Urban Villages. The Urban Villages are an amalgamation of these built environment characteristics and transit service increases: survey respondents living in Urban Villages have different built environment characteristics from those not living in Urban Villages, living in neighborhoods with three times the population density, 1.5 times the pedestrian infrastructure density, three times the transit frequency, twice as many jobs accessible within forty-five minutes by transit, and higher walk scores on average. These neighborhood characteristics establish one of the mechanisms through which living in an Urban Village may impact travel behavior.
Models
I use several methods to investigate the link between travel behavior and land use planning in Seattle over time. I use binomial logit models to examine the relationship between travel behavior and the built environment, as well as other components including demographics in relation to bus ridership and the choice to take transit. I run separate models estimating the likelihood of taking transit overall, and the bus in particular, in the travel diary week. My primary dependent variable is whether or not a respondent is a transit rider, defined as whether they took any mode of public transit in the week of the survey. I further examine specifically being a bus rider, defined as whether they took the bus in the week of the survey.
One important component of my models is understanding and controlling for residential self-selection. I employ a question from the household portion of the PSRC survey to measure self-selection. The question is as follows: “How important were each of these factors when choosing to move to where you live now? . . . Being close to public transit.” The answer options are a scale, “Very Unimportant,” “Somewhat Unimportant,” “Neither or N/A,” “Somewhat Important,” and “Very Important.” I consider those who selected “Somewhat Important” or “Very Important” in response to this question as having self-selected into an area with transit service; and those who answered, “Very Unimportant,” “Somewhat Unimportant,” or “Neither or N/A” to have not self-selected due to transit service. I control for responses to this question in my model, and interact it with my Urban Village term to understand the effect of living in an Urban Village for those who did and did not self-select into areas with high levels of transit access. Using a direct question has benefits in allowing a simpler modeling approach, but it is still vulnerable to biases, including those related to memory and strategic responses for social desirability reasons (Cao, Mokhtarian, and Handy 2009; Mokhtarian and Cao 2008). Respondents may also have confirmation bias, answering in the affirmative to having self-selected if they live in an area with high levels of transit service.
While there are many significant differences across residents who live and do not live in Urban Villages, my sample is large enough to be able to control for these characteristics in each area type (Urban Village and non-Urban Village). Overall, Urban Village residents are more likely to be transit riders and bus riders. They are also much less likely to own vehicles, and are more likely to be recent movers and to have prioritized transit in their most recent move, though close to 30 percent of respondents in non-Urban Villages also prioritized transit access in their most recent move. Urban Villages have a higher percentage of lower-income households with household incomes under $25,000, and a slightly lower percentage of households with household incomes over $100,000. Table 1 demonstrates the differences overall between residents in Urban Villages compared to those not in Urban Villages. I control for these demographic characteristics in my models to see if the differences in the likelihood to take transit and the bus persist across Urban Villages and non-Urban Villages when controlling for demographic characteristics.
Urban Village and Non-Urban Village Demographic and Travel Behavior Characteristics.
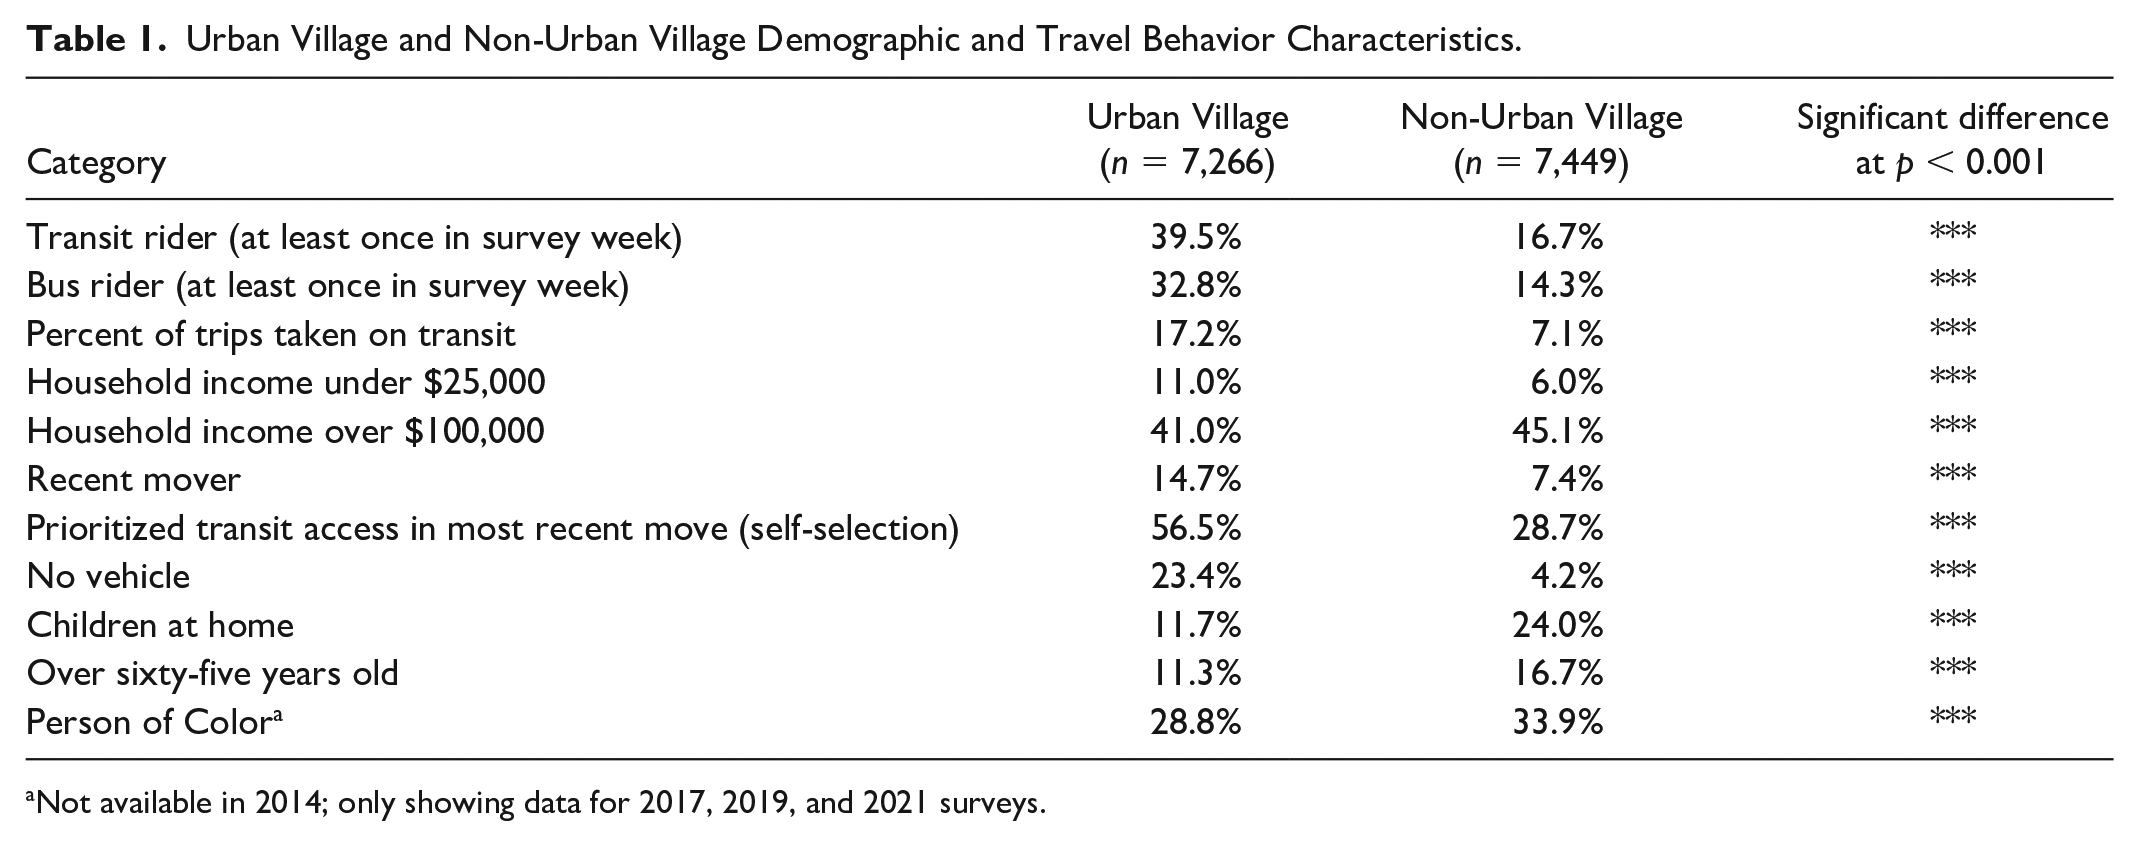
Not available in 2014; only showing data for 2017, 2019, and 2021 surveys.
Results
Controlling for a range of demographic and socioeconomic characteristics, I find that living in an Urban Village is associated with a higher likelihood of being a transit rider or a bus rider.
Examining the results by year, residential self-selection, and Urban Village status, as seen in Figure 2, reveals how the predicted probabilities of taking transit are greater for those living in Urban Villages compared to those living outside of them.
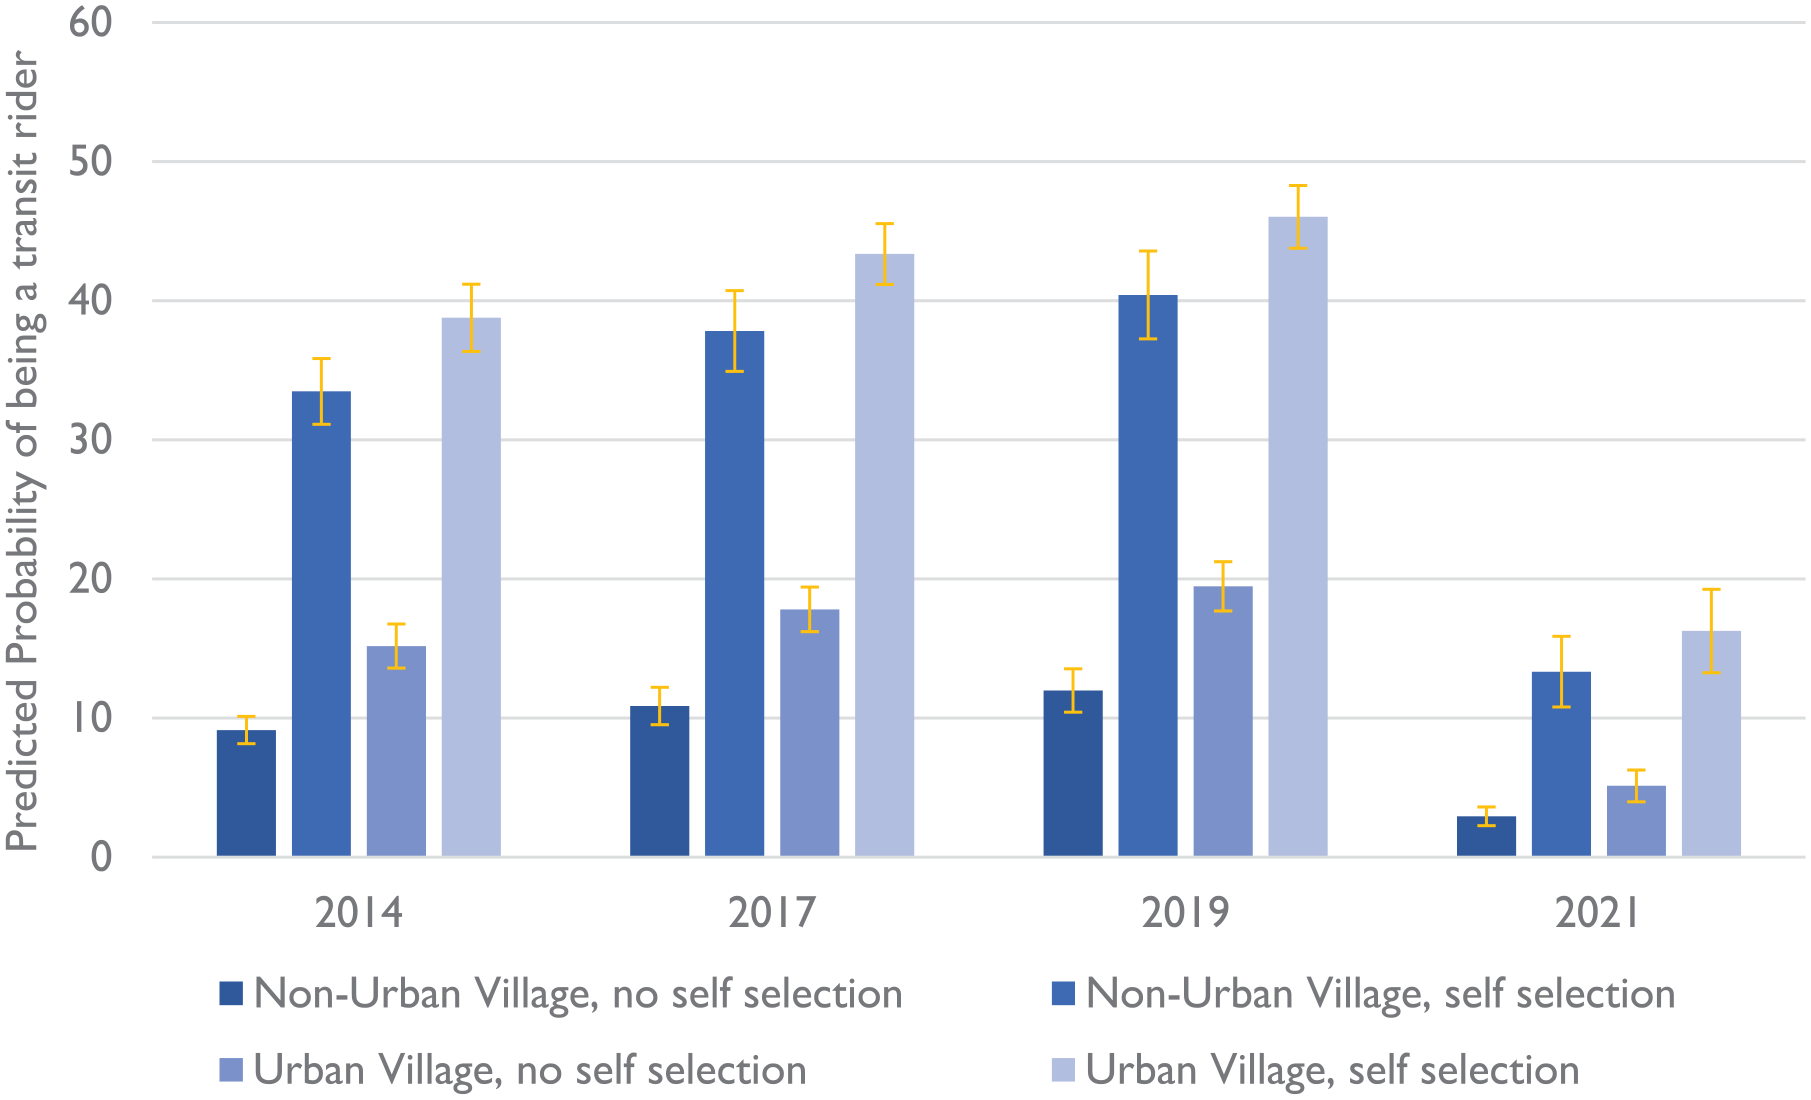
Predicted probability of being a transit rider by year, Urban Village status, and self-selection.
This positive association holds both for residents who had self-selected (purposefully chosen to live near transit) and those who had not, and held for both the pre-pandemic and during-pandemic time periods. The association with Urban Villages is significant even in the pandemic year (2021) for those who had not self-selected into areas with high levels of public transit access. However, overall, residential self-selection plays a larger role in explaining differences in the probability of being a transit rider than living in an Urban Village did.
The binary logit models controlling for self-selection show that several demographic factors, including not having children in the household, being a recent mover to Seattle, and having a lower household income are also associated with a higher likelihood of being a transit rider and a bus rider. Full results are shown in Table 2, Model 3.
Six Models on the Likelihood of Being a Bus or Transit Rider by Urban Village and Self-Selection Status.
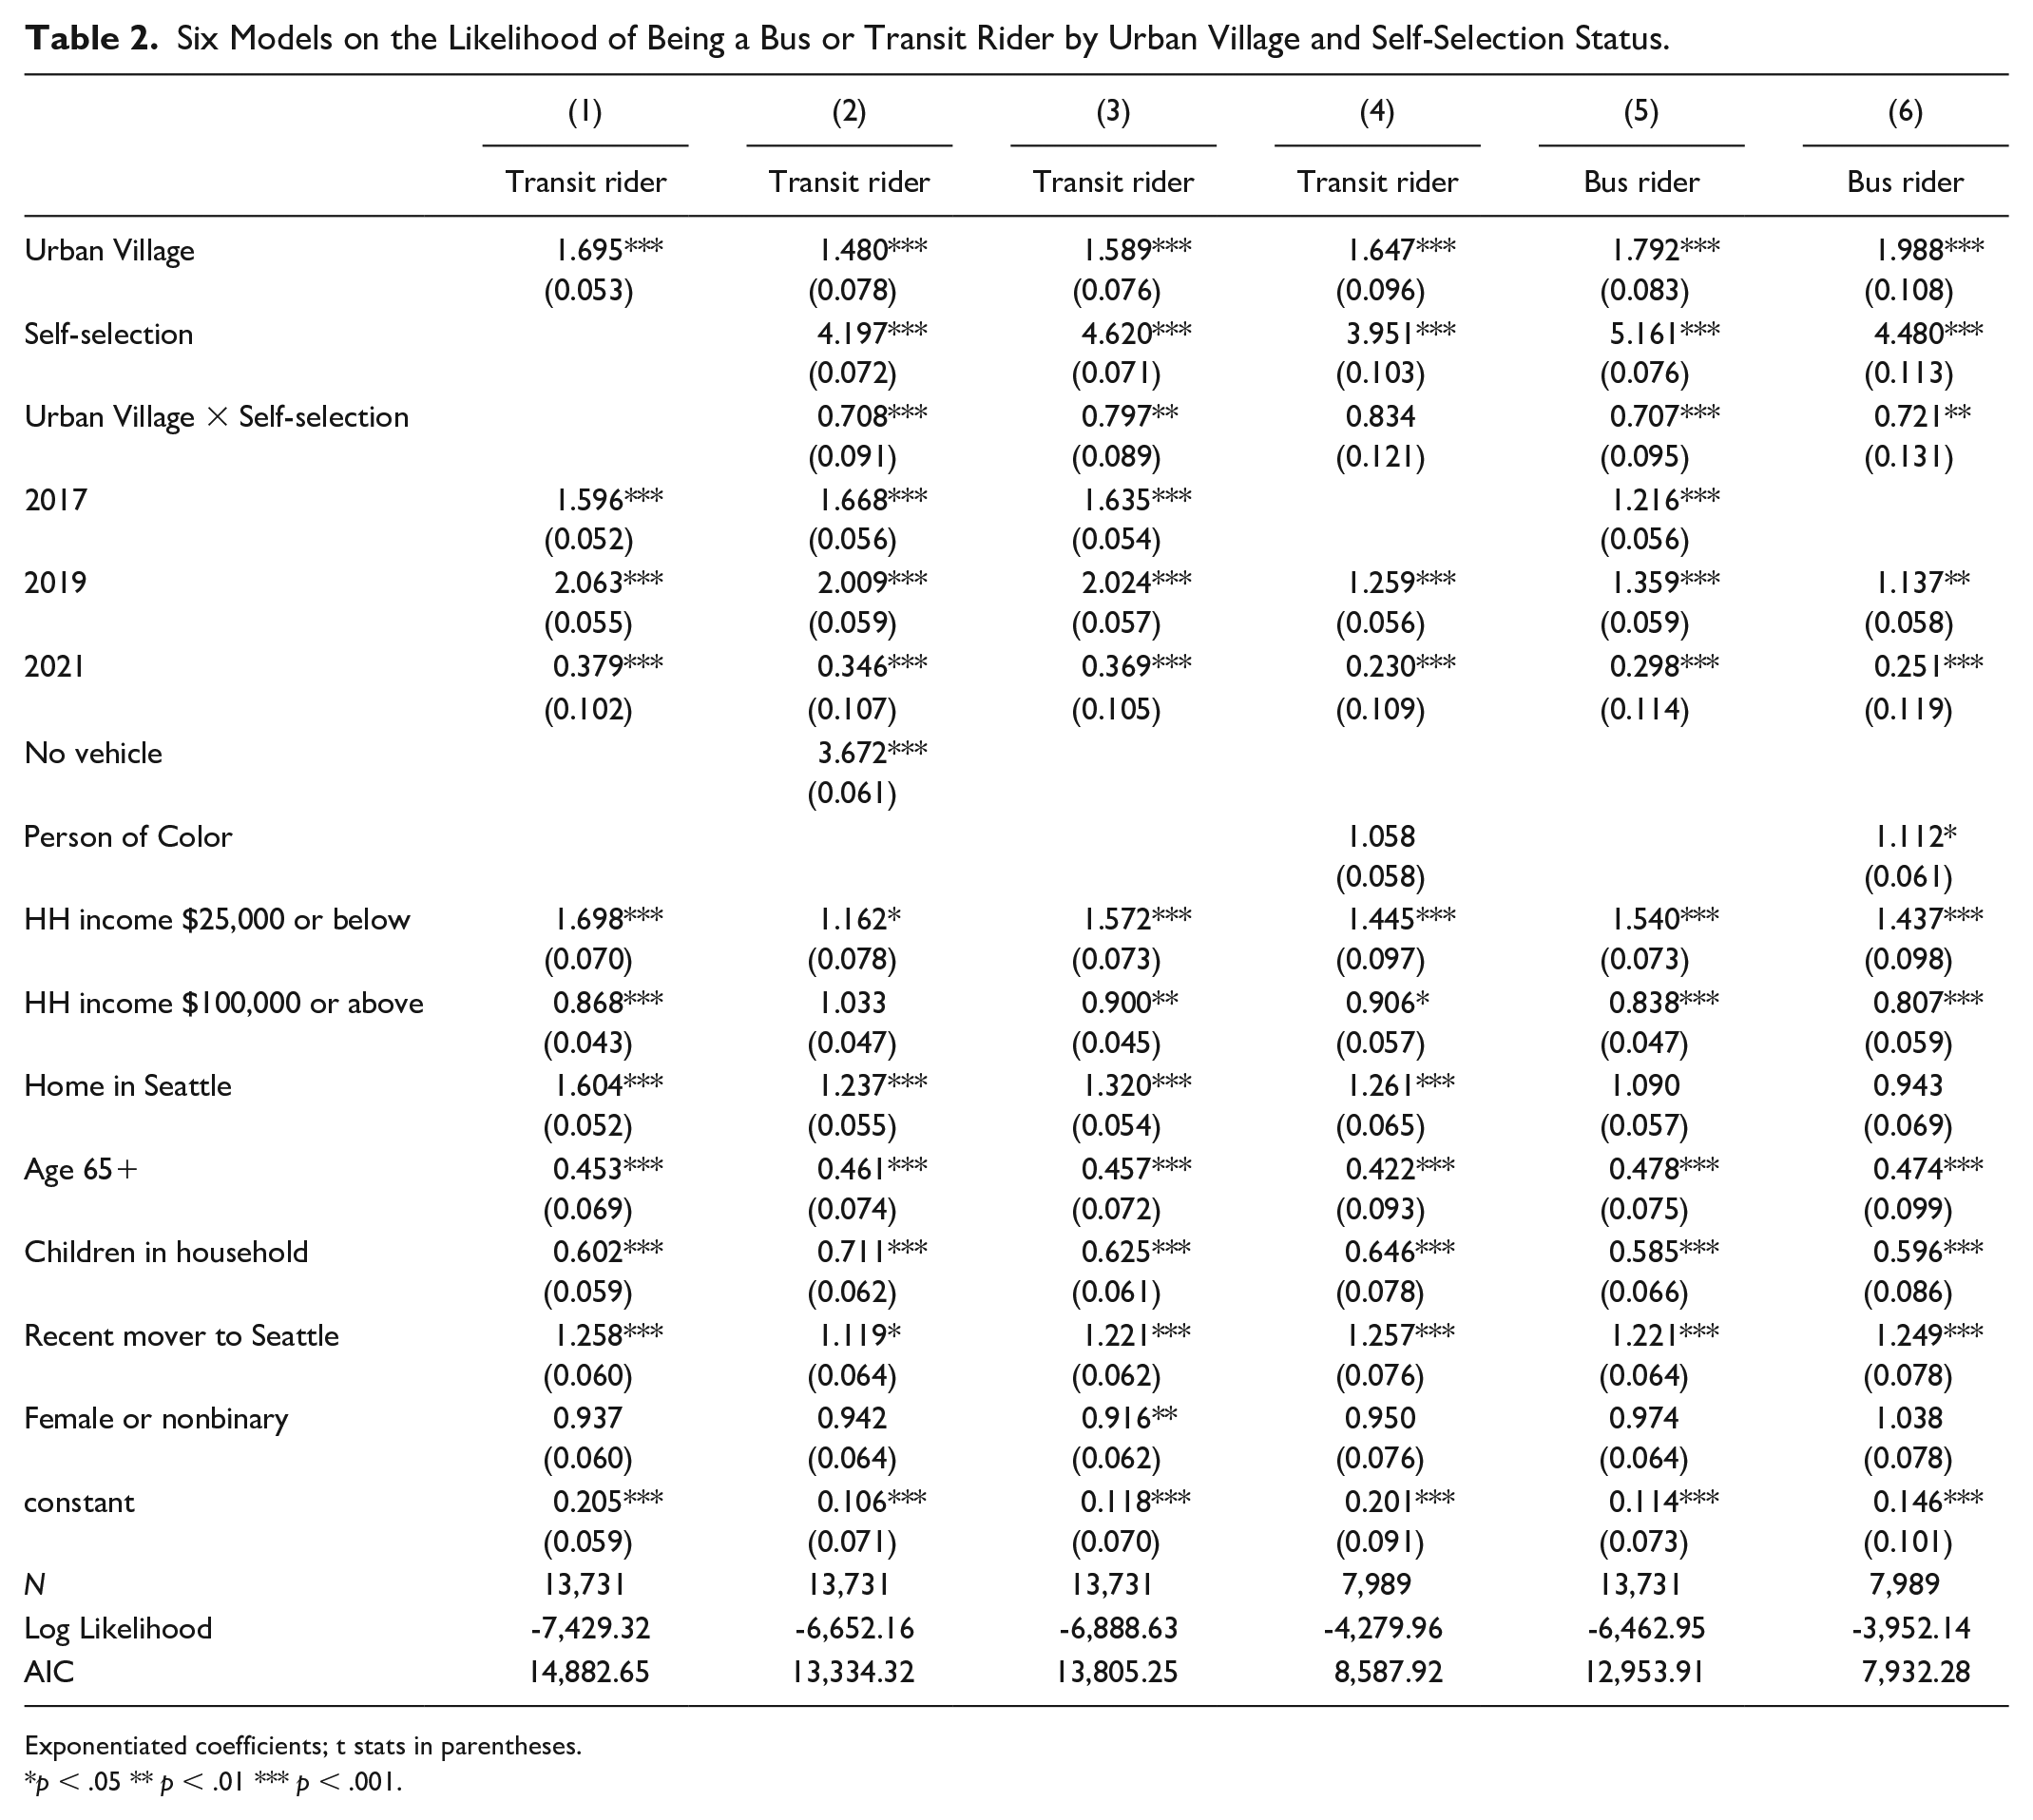
Exponentiated coefficients; t stats in parentheses.
p < .05 ** p < .01 *** p < .001.
Table 2 contains the exponentiated coefficients from logit models, therefore displaying odds ratios. A significant odds ratio of over one means that a variable is positively associated with the outcome of being a transit rider or bus rider: for example, Model 1 finds that the odds of being a transit rider are 1.695 times higher for people living in an Urban Village than those not living in an Urban Village. All models are binary logit models controlling for a range of personal and household characteristics, with outcomes of either the likelihood of being a transit rider or specifically a bus rider. All models contain time (survey year) fixed effects.
The results for the likelihood of being a bus rider are very similar to those showing the likelihood of being a transit rider overall. Results are robust to controlling for vehicle ownership, which I exclude from predicted probability models due to endogeneity concerns. Many variables, including living in an Urban Village, having a lower household income, and being a recent mover to Seattle, are closely associated with not owning a vehicle. Overall, while Urban Villages do have a significant impact on the likelihood of being a transit rider and on owning a vehicle, self-selection—having prioritized transit in the most recent move, indicating preferences around transit access and use—had a much greater magnitude. As seen in Table 2, the Urban Village and self-selection estimates are highly significant, and have similar (and relatively small) margins of error.
The inclusion of race/ethnicity, shown in Models 4 and 6, does not change the primary findings relating to Urban Villages and self-selection. These variables are included in separate models as the 2014 household travel survey did not include race and ethnicity variables. These results show that being a Person of Color is significantly and positively related with being a bus rider, but not an overall transit rider.
Time
The positive association between living in an Urban Village and being a transit or a bus rider holds during both the pre-pandemic and during-pandemic time periods. Unsurprisingly, the results show that overall, respondents in the 2021 survey have a much lower likelihood of being a transit or a bus rider compared to 2014. Respondents in both the 2017 and 2019 surveys are more likely to be a transit or a bus rider than those in 2014: prior to the pandemic, the likelihood of a respondent being a transit or a bus rider was increasing over time.
Trip Purposes
Next is an examination of the relationship between being a transit rider and living in an Urban Village for different types of trips, as shown in Table 3. The relationship between Urban Villages and transit ridership holds across work, errand, and social trips: living in an Urban Village is associated with a greater likelihood of taking transit for each type of trip, even when accounting for self-selection.
Likelihood of Taking Transit for Different Trip Types.
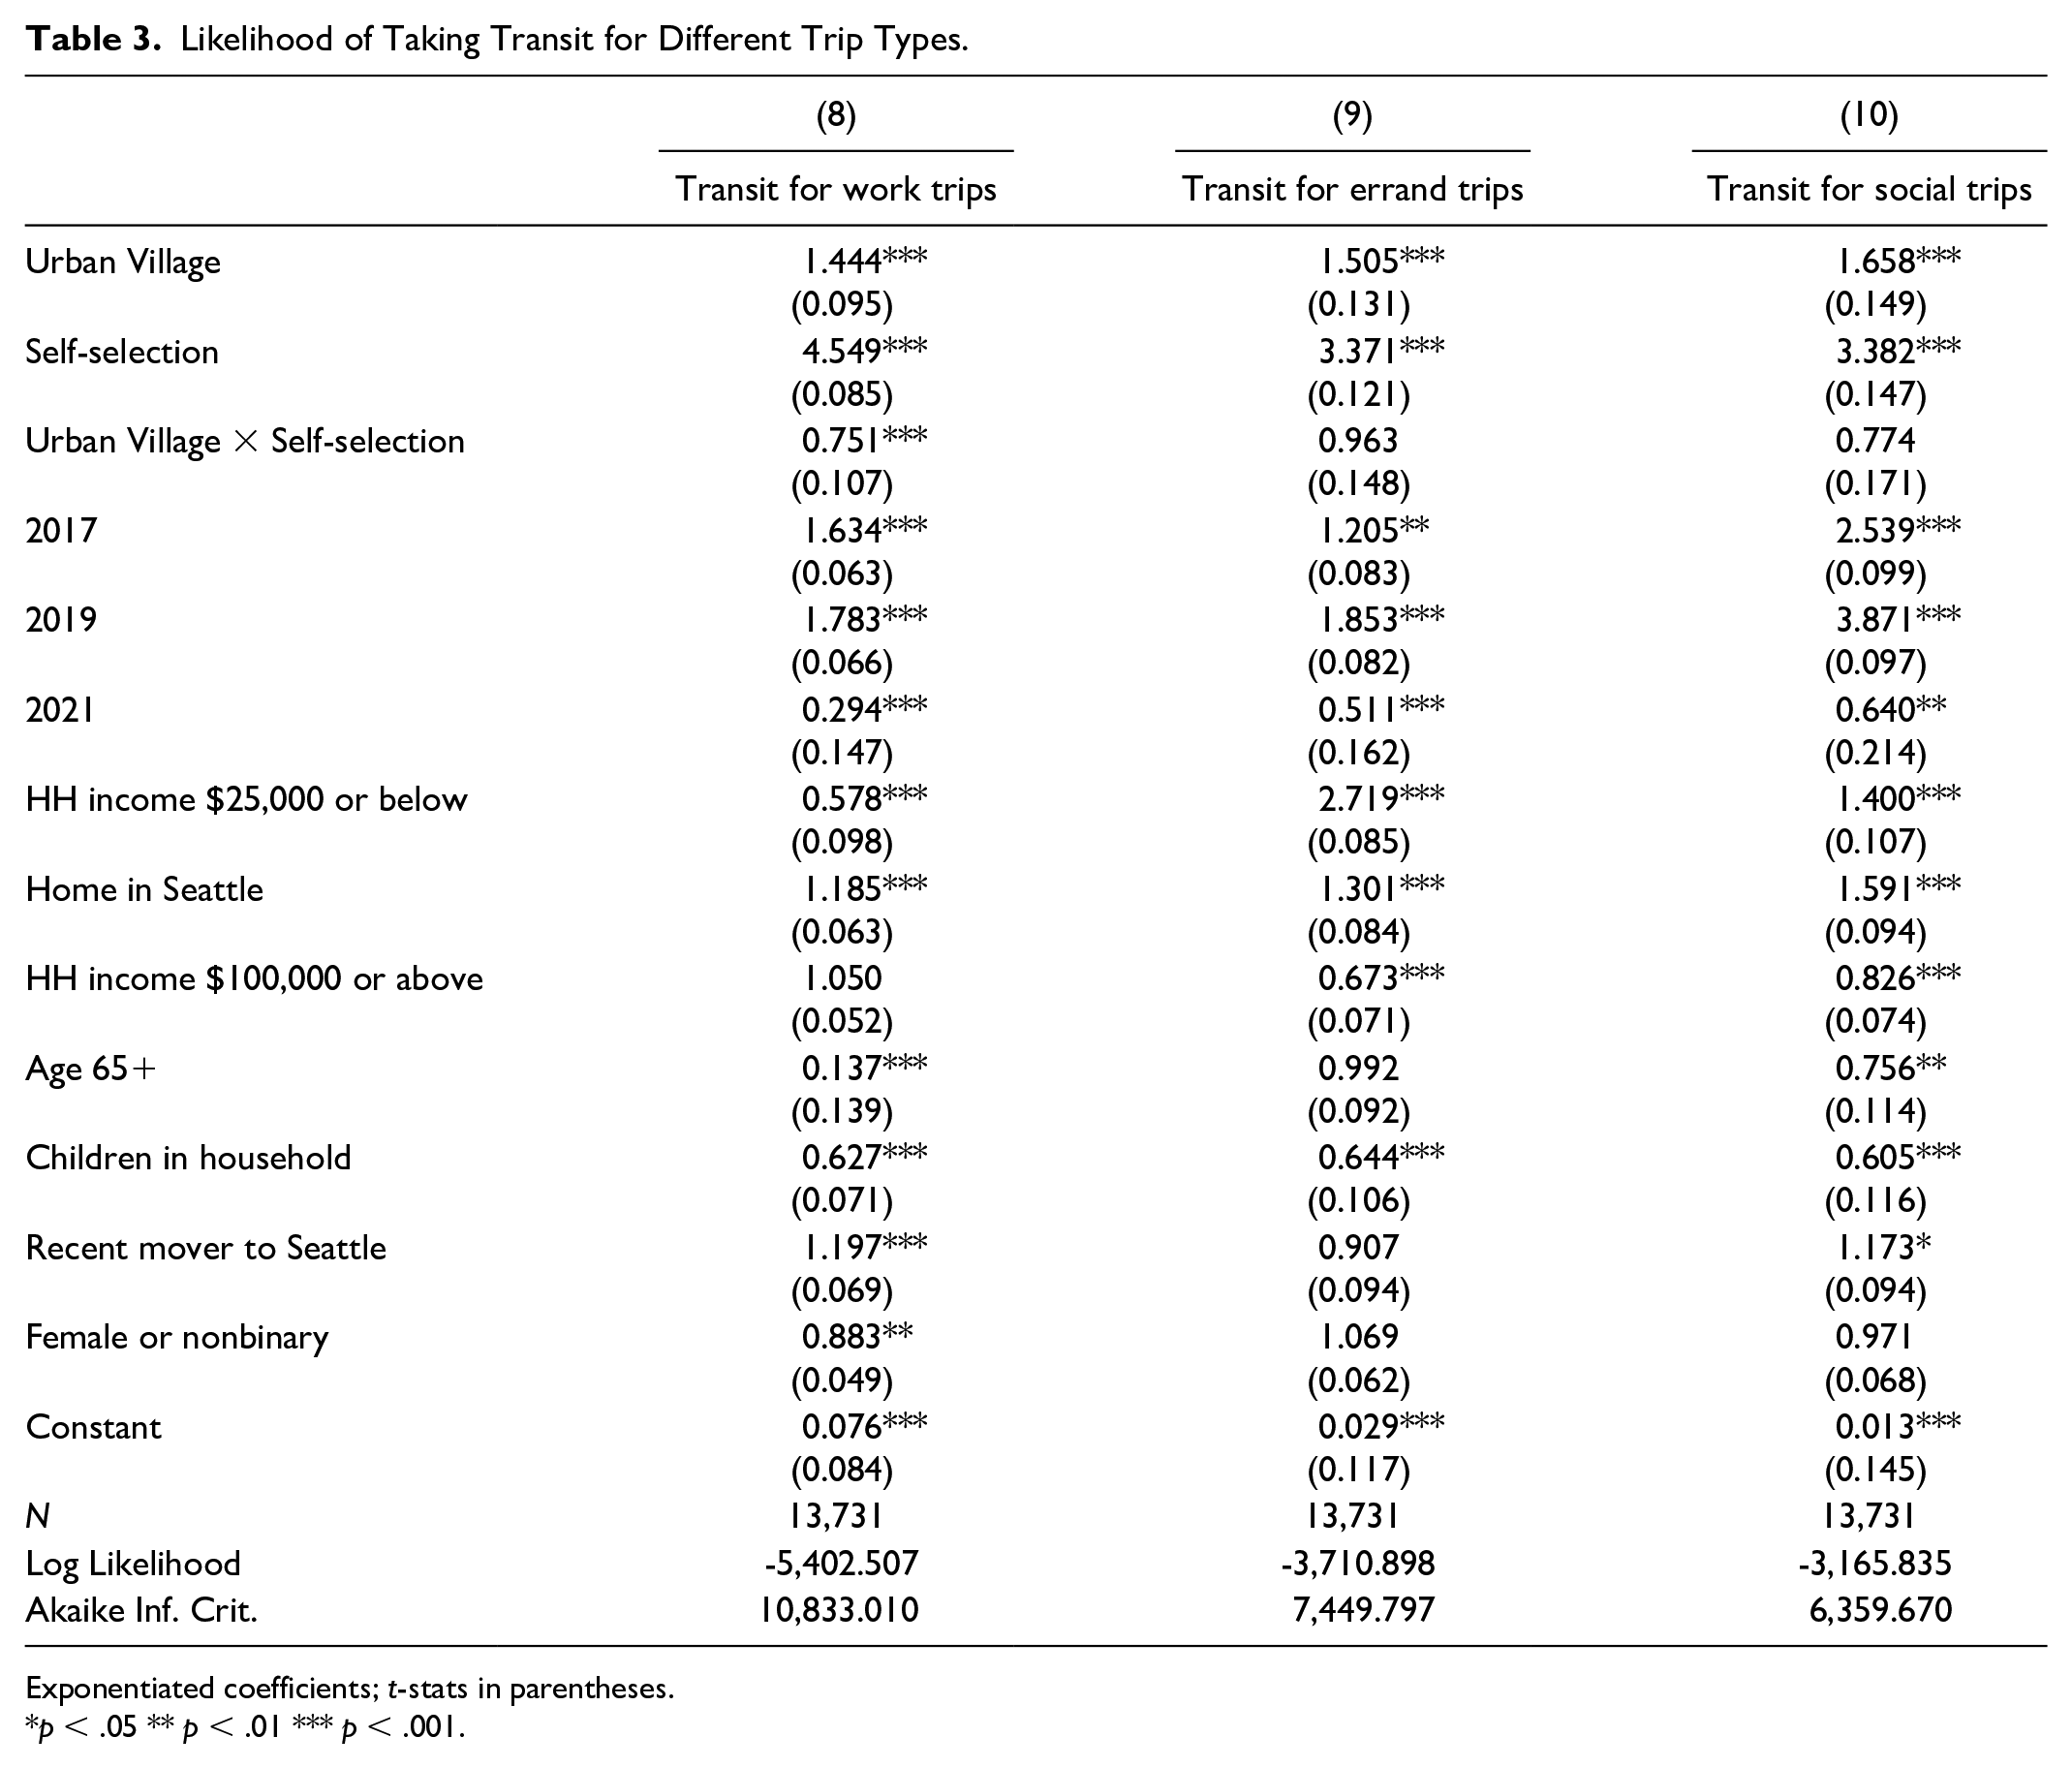
Exponentiated coefficients; t-stats in parentheses.
p < .05 ** p < .01 *** p < .001.
There are some notable demographic differences when it comes to trip type: lower-income households are comparatively less likely to use transit for work trips, while higher-income households are less likely to use transit for errands or social trips. Women or nonbinary people are less likely to take transit for work trips, while recent movers and those who had prioritized transit in their choice of location are more likely to use transit for work trips. These results for the most part affirm results from prior literature on the choice of location based on commute characteristics as well as other factors (Chatman 2009; Litman 2005). 3 The results highlight that residents of Urban Villages are more likely to use transit for errands and social trips than their counterparts in non-Urban Villages, and show that the relationship between Urban Villages and taking transit is not solely for taking transit to work. This is particularly important due to the long-term reduction in work commute trips since the pandemic (Javadinasr et al. 2022).
Conclusion
The results show that living in one of Seattle’s Urban Villages, areas that had combined land use and transit service improvements, is associated with a greater likelihood of being a transit rider, and a bus rider specifically. These results hold for residents who did not take transit access into account in their most recent choice of where to live (controlling for self-selection). The positive association between living in an Urban Village and being a transit and a bus rider continues during the pandemic, in 2021. The association also applies for taking transit for errands and social trips as well as for work trips.
These results support the case that Urban Villages are bolstering transit ridership to a measurable degree. The specific findings of a positive relationship between living in an Urban Village and the likelihood of taking transit for social and errand trips is of increasing importance due to the continued reduction of commute trips and increase in working from home in the Covid-19 pandemic recovery period. Specific findings, including measures of the extent to which Urban Villages are associated with an increased likelihood of being a transit rider, can be used to refine predictions of how combined land use and transit planning may influence travel behavior in other cities.
The results also highlight the land use relationship for bus ridership in particular. In spite of stigmas about the bus in the United States, areas in Seattle with land use planning and service level improvements are associated with increased bus ridership. This is important because of the many ways bus systems are much more affordable and flexible than rail. In addition, research shows that in comparison to light rail, BRT is less likely to have negative impacts such as gentrification (Qi 2023). The findings also underscore prior research on the importance of transit service levels and proximity: when transit is efficient, residents who live nearby, even those with access to personal vehicles and higher incomes, do take the bus.
Similar to prior research on transportation mode substitution, the magnitude of the effects is small, particularly during the pandemic period. The effects of self-selection are much greater in magnitude than the effects of Urban Villages. The continued importance of self-selection shows the importance of coordinated transport and land use planning to create sufficient transit-accessible housing to meet demand from households prioritizing transit access in their residential location decisions. There is significant unmet demand for transit-accessible and walkable neighborhoods in North America (Frank et al. 2019), and Seattle’s Urban Villages are significantly more transit-accessible and walkable than other parts of Seattle.
There are several limitations of this analysis which speak to future research opportunities to build upon this work. In particular, it would be interesting to more closely examine which components of Seattle’s Urban Villages land use planning and transit improvements are most important for differences in travel behavior: for example, whether it is the residential density, land use diversity, or transit accessibility, or a combination of these characteristics, that is most impactful. Findings from such research would be able to further assist other cities with their plans to support transit ridership. One specific limitation in relation to the measure of self-selection is that of confirmation bias: people who take transit more may be more likely to report that their choice of location involved self-selection for transit access. Other future research could also involve a more detailed examination of work and home locations in relation to mode choice, and specific findings on VMT reduction given the increased likelihood of taking transit in Urban Villages, as well as how self-selection may change over time. Additional research could also complement this analysis with an examination of how Seattle was able to gain public support for improving its transit network, to serve as lessons for other U.S. cities trying to strengthen their transit networks.
Footnotes
Appendix
Acknowledgements
I am grateful to Karen Chapple, Elizabeth Deakin, Chester Harvey, Carolina Reid, and Daniel Rodríguez for their feedback on drafts of this analysis and paper. I am also grateful for those who made comments on versions of this research presented at the 2022 TRB Annual Meeting in Washington, D.C. and the 2023 JPER writing workshop.
Declaration of Conflicting Interests
The author(s) declared no potential conflicts of interest with respect to the research, authorship, and/or publication of this article.
Funding
The author(s) received no financial support for the research, authorship, and/or publication of this article.