
Abstract
We examine the barrier effects of freeways in California. We analyze the association between freeways and nearby street network connectivity and quantify the frequency and quality of crossings—underpasses or bridges that enable pedestrians and cyclists to cross the freeway. We find that barrier effects are most pronounced in communities of color. We also find that even where crossings exist, they are unpleasant or even hazardous for pedestrians and cyclists because of high-speed traffic on on- and off-ramps, and because large volumes of traffic are funneled through a small number of crossings rather than being distributed over a wider network.
Introduction
Limited-access freeways (highways or motorways) 1 have far-reaching environmental and social consequences. At the regional scale, they induce travel by private car (Duranton and Turner 2011) and exacerbate urban sprawl (Baum-Snow 2007; Garcia-López 2019). At the local scale, they contribute to air and noise pollution, destroy habitat, and physically divide urban neighborhoods. The latter effect is typically referred to as “severance” or “barrier effects”: streets that would otherwise be continuous might dead end at a freeway, forcing a lengthy detour for pedestrians and cyclists (Figure 1). These negative consequences of freeways often fall disproportionately on people of color.
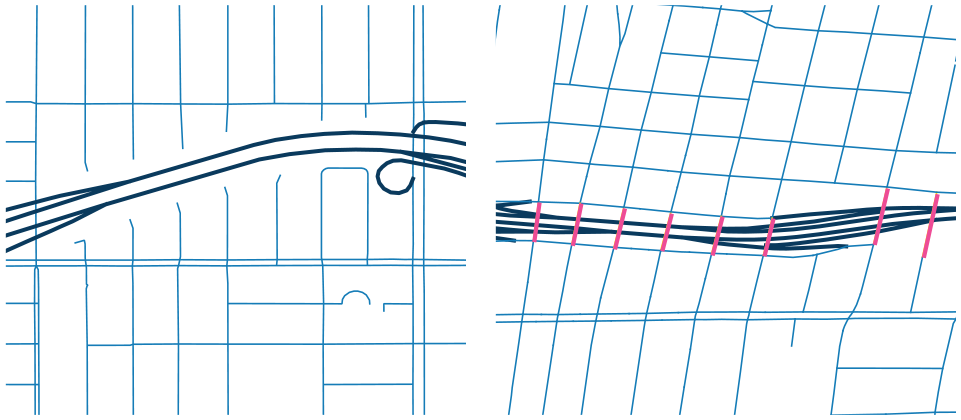
Freeways (darker color) create severance or barrier effects through creating dead-end streets and lengthy detours (left), unless the local street network is continued across freeways via over- or underpasses (right).
In this paper, we quantify the impact of freeways on severance in California, with a particular focus on Los Angeles County. We analyze the association between freeways and the connectivity of local street networks, quantify the distance between crossings—underpasses or bridges that enable people to cross the freeway—and assess crossing quality for pedestrians and cyclists. And we examine how severance creates or perpetuates environmental injustices, through analyzing how connectivity, crossing distances, and crossing quality vary with the racial demographics of a neighborhood.
While the severance impacts of freeways have been analyzed extensively in specific case studies (e.g., the southside of Glasgow in Nimegeer et al. 2018, and northern Gothenburg in van Eldijk 2019), ours is the largest-scale study to date. Moreover, our methods can be replicated at scale outside of California. Our study is also one of the few to examine the relationship between severance and environmental justice.
We find that the causal effects of severance are difficult to identify without access to digitized historical maps because freeways are often routed through neighborhoods with the most connected streets—for example, because of flat topography. However, we do find that severance is most pronounced in communities of color. We also find that even where crossings exist, they are unpleasant or even hazardous for pedestrians and cyclists because of high-speed traffic on on- and off-ramps, limited bicycle and pedestrian infrastructure, and because large volumes of traffic are funneled through a small number of crossings rather than being distributed over a wider network. Thus, quantitative connectivity metrics such as circuity underestimate the severance impacts of freeways.
Freeways, Severance, and Justice
Freeways and Severance
Surface roads of all types that carry high traffic volumes impede pedestrian and bicycle travel. This impedance is typically referred to as “severance” or the “barrier effect,” and we use the two terms interchangeably in this paper. Physical barriers are the most obvious mechanism through which roads hamper non-motorized travel across them, especially on limited-access freeways. However, even where physical barriers do not exist, high traffic volumes can make it hard to cross a street, and noise and dust impose psychological barriers and represent significant environmental hazards. (For reviews, see Anciaes, Jones, and Mindell 2016; Mindell and Anciaes 2020; van Eldijk, Gil, and Marcus 2022.)
Severance is not inherently a problem. In some instances, there may be no reason for pedestrians or bicyclists to travel to a destination on the other side of the road. For example, communities might have grown up independently on each side of the road after it was built (Handy 2003). More commonly, however, severance reduces accessibility to destinations such as stores, parks, and schools, and in some cases, it also reduces social capital. One of the earliest studies found that residents of a low-traffic street in San Francisco had three times as many friends and twice as many acquaintances as residents of a comparable high-traffic street (Appleyard, Gerson, and Lintell 1981). Subsequent studies have shown similar effects on social capital (e.g., Bosselmann, Macdonald, and Kronemeyer 1999).
Limited-access freeways, the focus of this paper, provide the most tangible manifestation of barrier effects through physically severing the local street network. Unless the freeway is elevated or in a tunnel, crossings are limited to purpose-built bridges or underpasses, whether at interchanges (on- and off-ramps) or on local streets or pedestrian crossings that do not provide access to the freeway.
For these reasons, freeways typically reduce network connectivity and accessibility, and other contributors to walkability and bikeability as well. For example, high-school students in Davis, California, are less likely to bicycle if they have to cross the freeway, in part because of the indirectness of the available routes (Emond and Handy 2012). In turn, freeways are likely to reduce non-motorized travel and increase car travel—an effect that comes on top of the induced travel that results from higher car travel speeds and regional land use changes (Cervero 2002; Duranton and Turner 2011). Freeway-induced severance can affect social exclusion and health outcomes as well, although the latter are hard to separate from the impacts of freeways on noise and air quality. On the contrary, new freeways may encourage walking if they divert traffic away from local streets and build social capital through increasing accessibility by private car (Nimegeer et al. 2018).
Empirical studies of severance are relatively limited, especially in comparison with the much broader literature on the air quality and noise impacts of roads (Anciaes et al. 2016; van Eldijk, Gil, and Marcus 2022). In some cases, qualitative analysis examines the impact of new roads on social networks and perceptions of a neighborhood (e.g., Nimegeer et al. 2018). Some studies use connectivity or accessibility measures, quantifying the impacts of a road on circuity or the decrease in accessibility to destinations such as schools and parks (e.g., Handy 2003; van Eldijk 2019). Others seek to assess severance in monetary terms, through estimating residents’ willingness to pay to bury a freeway or to avoid a detour to cross a busy street (e.g., Anciaes and Jones 2020; Grisolía, López and, de Dios Ortúzar 2015). Normally, these analyses are small-scale case studies of a new freeway or a project to place part of an existing road in a tunnel (e.g., van Eldijk 2019).
Severance and Justice
The racist legacy of freeway building has recently been spotlighted at the highest levels of government. In 2020, the California State Transportation Agency Secretary stated: “Far too often, past transportation decisions quite literally put up barriers, divided communities, and amplified racial inequalities, particularly in our Black and Brown neighborhoods” (Kim 2020). The following year, U.S. transportation secretary Pete Buttigieg called out the “racism” inherent in freeway design choices (White House 2021). These comments have been reflected in the popular media as well, with the Los Angeles Times running an opinion piece labeling freeways as “insidious monuments to racism and segregation” (Fleischer 2020).
These statements are grounded in a wealth of historical evidence that documents how freeway routing decisions in the United States were, in part, motivated by racial prejudice. In cities from Santa Monica, California, to Richmond, Virginia, routes were chosen because they would raze Black and/or lower income neighborhoods, as part of a broader strategy of urban renewal and removal of “blight” (Bullard and Johnson 1997; Dottle, Bliss and Robles 2021; Gordon 2021; Rothstein 2018). In some places, freeway planners appear to have been motivated by the lower costs of right-of-way acquisition in neighborhoods of color, or as in Beverly Hills and the French Quarter of New Orleans, the more effective political opposition by affluent and white residents (Dottle, Bliss, and Robles 2021; Haddad 2021), but the end result was the same even in the absence of explicit racial animus.
In other cases, freeways were constructed as barriers between predominantly white and predominantly Black neighborhoods—severance was the feature, not the bug. In Atlanta, for example, I-20 West was designed as a dividing line that would perpetuate existing patterns of segregation, and other highways were intended to prevent Black “encroachment” or avoid white flight (Bayor 1988). The city even went so far as to close off sections of road and create dead ends to avoid connections between Black and white neighborhoods (Bayor 1988).
In contemporary studies, “inequitable exposure to localized environmental burdens” is one of three dimensions of environmental justice, along with procedural injustices related to decision-making and inequitable distribution of the benefits of (say) a new freeway or rail line (Karner et al. 2018). Within this first dimension, the air and noise pollution impacts of freeways have received most attention, typically finding that people of color are more likely to live close to a freeway and thus be impacted by its pollution (Chakraborty 2006; Forkenbrock and Schweitzer 1999; Rowangould 2013; Schweitzer and Valenzuela 2004). The negative health outcomes observed include low birth weights, asthma, respiratory disease, and in some cases cancer.
There is less evidence, however, regarding the relationship between severance and environmental justice. Even if people of color are more likely to live close to a freeway, that does not automatically translate into disparities in severance, partly because severance impacts might be felt over a wider area, and partly because severance can be mitigated through frequent over- and underpasses for local traffic and/or pedestrians. On the contrary, it is plausible that discretion in the planning process over the provision of pedestrian bridges and local street crossings might exacerbate injustices, for example, if wealthy and/or white residents have better success in lobbying for these improvements. For example, in Pasadena, city officials threatened to refuse to sign street closure agreements as part of their efforts to reroute freeways away from wealthier neighborhoods (Loukaitou-Sideris et al. 2023).
Methods
Empirical Setting
Our empirical setting is the state of California. California is home to one of the world’s earliest freeways, the Arroyo Seco Parkway which opened in 1940 (Haddad 2021), and it continues to build and expand freeways in the 21st century. Thus, our data set spans many eras of freeway design standards, as well as a range of urban forms from streetcar suburbs to car-oriented sprawl. In practical terms, we study a single state because some of our data (specifically freeway opening dates) is California-specific.
For the audit of crossing quality, we limit our sample to Los Angeles County, in order to reduce variation on other dimensions. Many of our graphical illustrations are also drawn from the Los Angeles region.
Research Approach
We test the hypotheses that freeways reduce street connectivity through barrier effects, and that these effects are more severe in neighborhoods with more people of color. We analyze four different measures of severance: (1) the Street Network Disconnectedness index (SNDi), (2) one of SNDi’s component measures, circuity, (3) the distance along a freeway to the nearest crossing (over- or underpass), and (4) the quality of crossings. Each of these measures is discussed in more detail below.
We then analyze the association between SNDi and circuity and proximity to a freeway, through comparing polygons that are within 400 m (about a quarter mile) of a freeway to those that are more distant (400–800 m, although we also analyze other distance bands). To construct the polygons, we begin with a 1-km2 grid and subdivide these grid cells into the 0 to 400, 400 to 800, 800 to 1,600, and 1,600 to 5,000 m distance bands (Figure A-1 in the Supplementary Information).
Our other two measures—distance between crossings and crossing quality—do not lend themselves to a comparison between different freeways’ proximity bands, because by definition, these measures only exist at a freeway. Instead, we consider the distribution of these measures, and how they vary with racial demographics.
Data Sources
Our data sources on the local street and freeway network come from OpenStreetMap (OSM, downloaded September 29, 2021). The opening dates of each freeway segment, which we use to identify any trends in severance impacts, were provided by the California Department of Transportation (Caltrans), and we matched the Caltrans freeway segments to the OSM network. Data on population counts and race are from the US Census 2020 block-level files, which we aggregate to 1-km2 grid cells and polygons to match our SNDi calculations (see below), using an area-weighted interpolation. We control for topography in our regression models, since this is an important determinant of street connectivity (Barrington-Leigh and Millard-Ball 2017), using elevation data from the USGS Global Multi-resolution Terrain Elevation Data model (GMTED2010) which we convert to slope using PostGIS.
Measuring Severance
Connectivity
SNDi is a composite measure of street connectivity. If freeways increase severance, we would expect SNDi to decline (connectivity to increase) with distance from a freeway. The components of SNDi are circuity (the ratio between Euclidean and network distance for nodes within six distance bands, as illustrated in Figure A-1), the proportion of dead ends, the curviness of streets, nodal degree (the average number of edges at each node), and three graph-theoretic measures: the proportion of edges that are network bridges, and the proportion of edges and length of edges that are not on the cycle basis. 2 These components are combined using principal component analysis. Full details of the measures, the calculation and graph simplification methods, and details of validation are provided in Barrington-Leigh and Millard-Ball (2019). We calculate SNDi for each polygon created as described above.
We also analyze one of the components of SNDi: circuity with a 500 m radius. While SNDi also considers circuity for other distance bands from 0 to 500 m through 2.5 to 3.0 km, severance impacts are likely to be most acute close to a freeway, as any detour will be proportionately longer. For each street intersection, we calculate the Euclidean and network distances to all other intersections within 500 m (Figure A-2). We then aggregate to the same polygons as used to calculate SNDi based on the log of the ratio of Euclidean to network distances. Note that bicycle and pedestrian paths are considered in this analysis when they provide the shortest route, but their nodes (e.g., the intersection between two pedestrian paths) are not counted as origins. For further details, see Figure A-2 and Barrington-Leigh and Millard-Ball (2019).
Distance between crossings
We identify freeway crossings as those edges (i.e., street segments) that intersect with a freeway. We classify each crossing as (1) a freeway entrance or exit (i.e., a ramp or interchange); (2) an intersecting street that does not give freeway access; or (3) a bicycle- or pedestrian-only path. The first category is defined as edges that directly give access to freeway ramps. 3 The third category is defined based on attributes tagged in OSM (e.g., bicycle path). Figure 2 shows an example of each type of crossing.
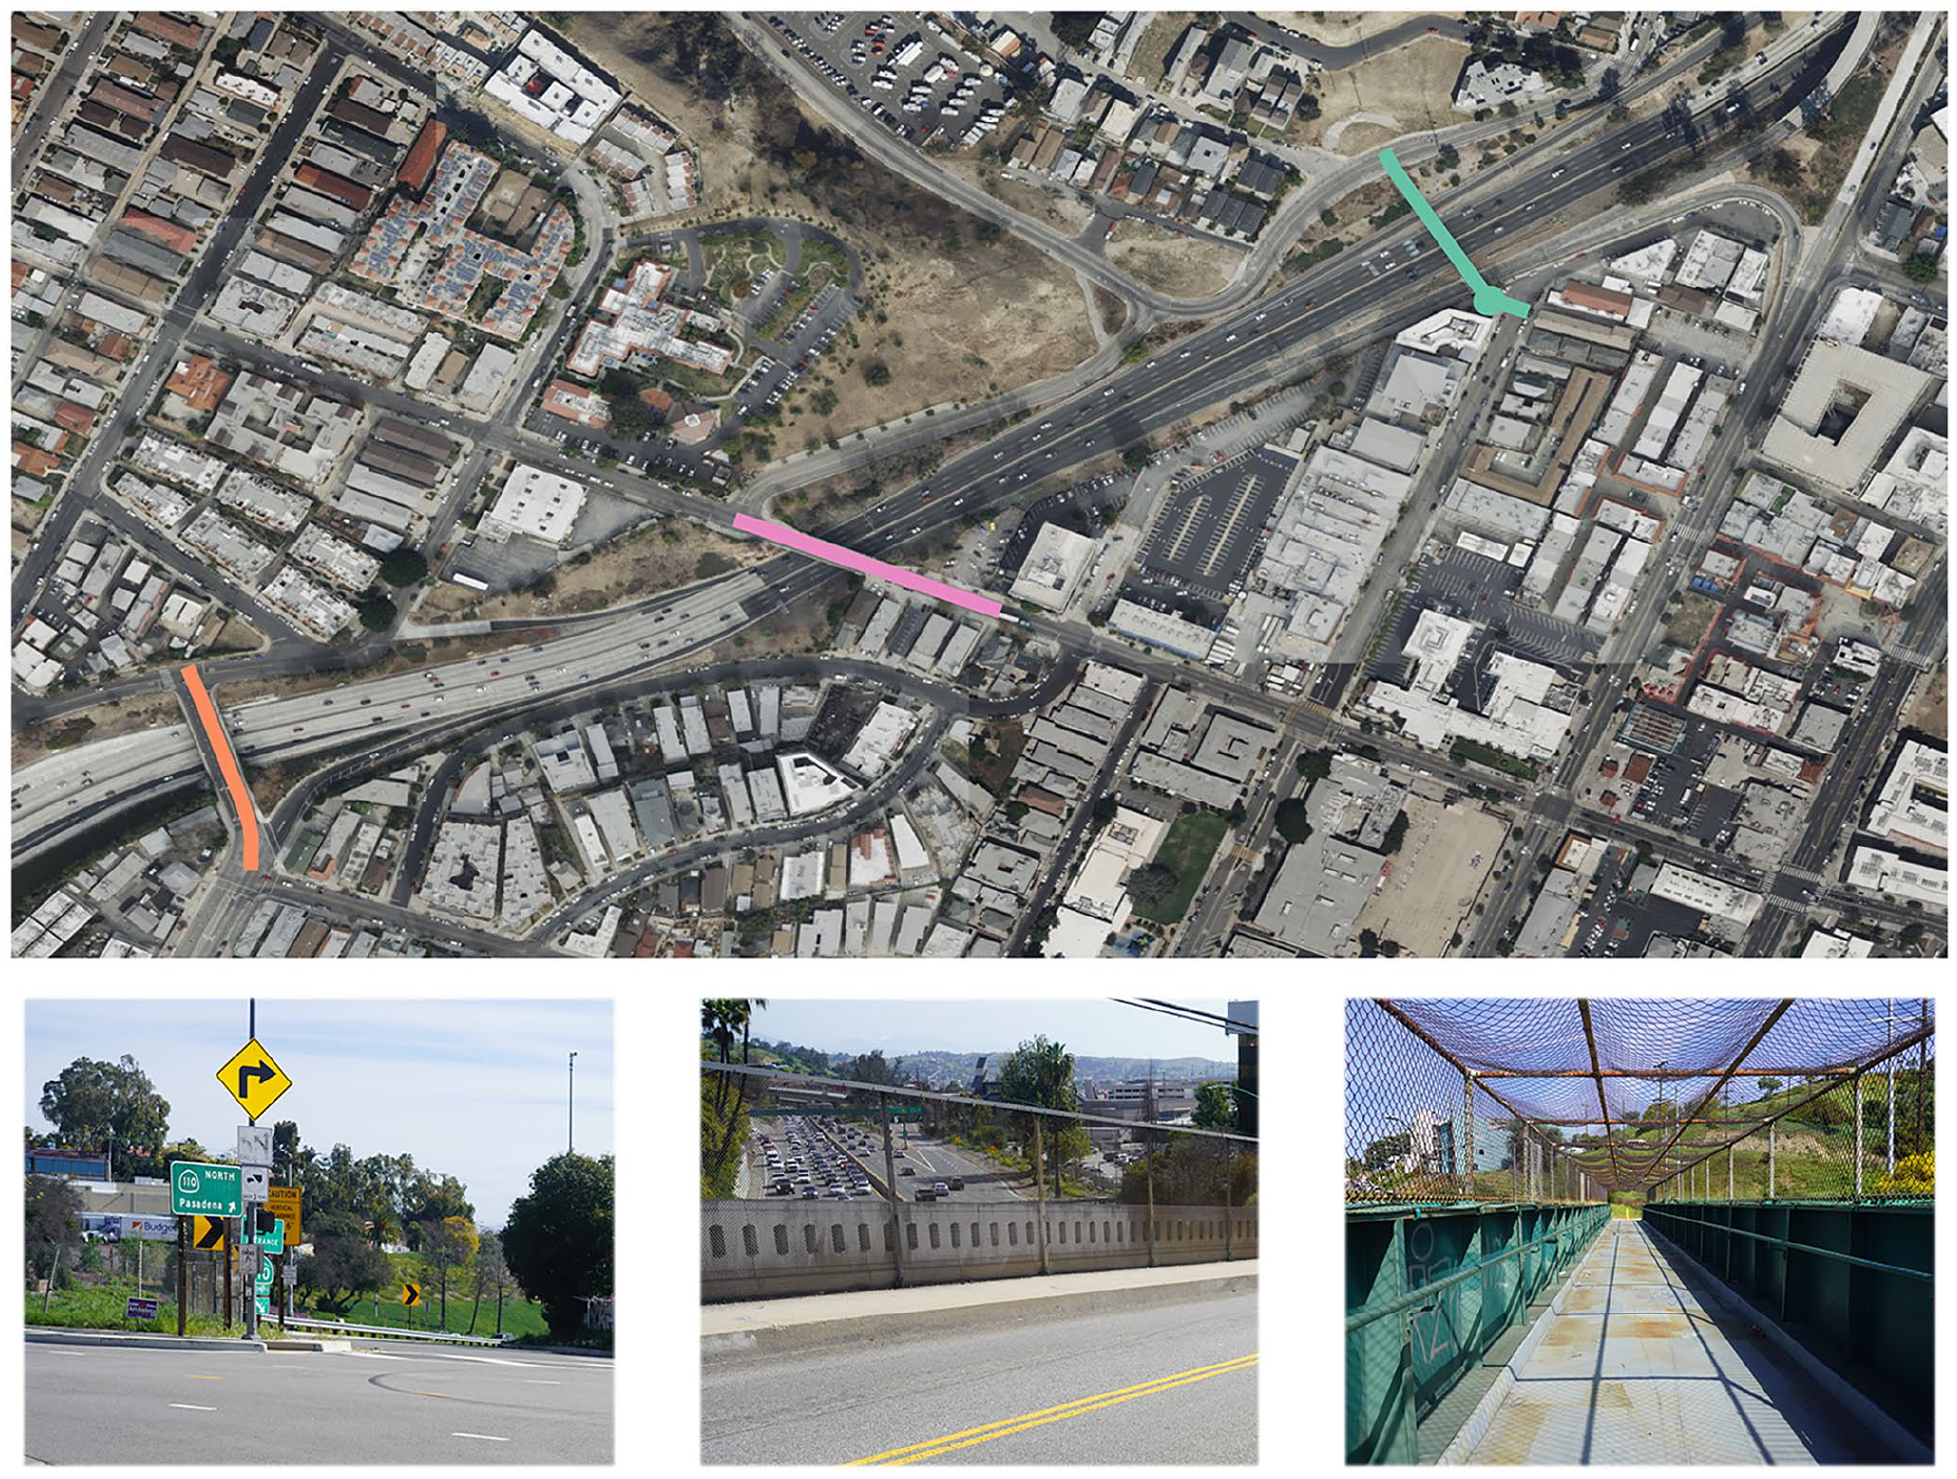
Examples of crossing types.
After identifying all crossings, we compute the average distance between crossings for each 1 km2 grid cell. Section A.3 in the Supplementary Information derives and explains the algorithm. Note that this metric (average distance between crossings) is linearly related to the expected distance to the closest crossing for any random point on the freeway, as explained in the SI.
Crossing quality
We evaluate the quality of a random sample of 100 crossings in Los Angeles County, analyzing Google Street View imagery. The locations of each sampled site are shown in Figure A-3. (See Biljecki and Ito 2021 for a review and discussion of the advantages of street view tools.) We adapt existing audit frameworks for qualitatively evaluating pedestrian and bicycle conditions (Boarnet et al. 2006; Furth, Mekuria, and Nixon 2016; Kurka et al. 2016; Steinmetz-Wood et al. 2019), along with the planning methods in First/Last Mile Plans from the Los Angeles County Metropolitan Transportation Authority, to develop our Freeway Crossing Quality Audit framework. Our framework contains three categories: the pedestrian walkway, crosswalks across any entrance and exit ramps, and bicycle facilities. Within each of these categories, we assess crossing quality based on the criteria in Section A.4 in the SI (speed limit, signage present, shade cover, etc.). A score of “4” indicates the highest quality crossings, and “1” denotes the lowest quality. We also calculate a composite score as the average of the scores in the three categories. Tables A-1 and A-2 provide the detailed criteria and examples of crossings that fall into each category.
Limitations
A major strength of our approach is that it is scalable, allowing the severance impacts of freeways to be quantified at a much larger scale than in previous, largely qualitative research. However, the tradeoff is that our approach does not capture more qualitative aspects of people’s travel experiences. We chose our metrics based on a hypothesis about what is likely to impact residents, but we have not directly measured subjective experiences or perceptions or preferences—for example, the value that individuals attach to direct routes and crossing quality, and the impacts that severance has on their lives. Data constraints also mean that we do not consider the impact of factors such as waiting time for pedestrians at signalized crossings. Furthermore, in order to retain its simplicity and transparency, our “distance between crossings” measure does not take into account the number of destinations that might need to be reached on the other side of the freeway—for example, distinguishing between farmland and a retail center or school.
Another limitation is that our distance categories are necessarily arbitrary; we expect severance to be most acute within 400 m of a freeway, but we do not quantify how severance effects continuously decay with increasing distance. Finally, as discussed in the “Conclusion” section, we do not have a representation of the road network before freeways were built, limiting our ability to make causal inferences.
Results
Freeways and Connectivity
We begin by presenting graphical evidence about the relationship between freeways and street connectivity. In general, the presence of a freeway is associated with reduced street connectivity. Figure 3 shows an example from Interstate 10 in West Adams, Los Angeles, where many of the previously continuous streets (lower image) now dead end into the freeway. SNDi increases from 1.0 in the polygon just north of the freeway to 1.7 in the polygon through which the freeway runs. Two of the component measures of SNDi, circuity and the fraction of dead ends, increase as well.
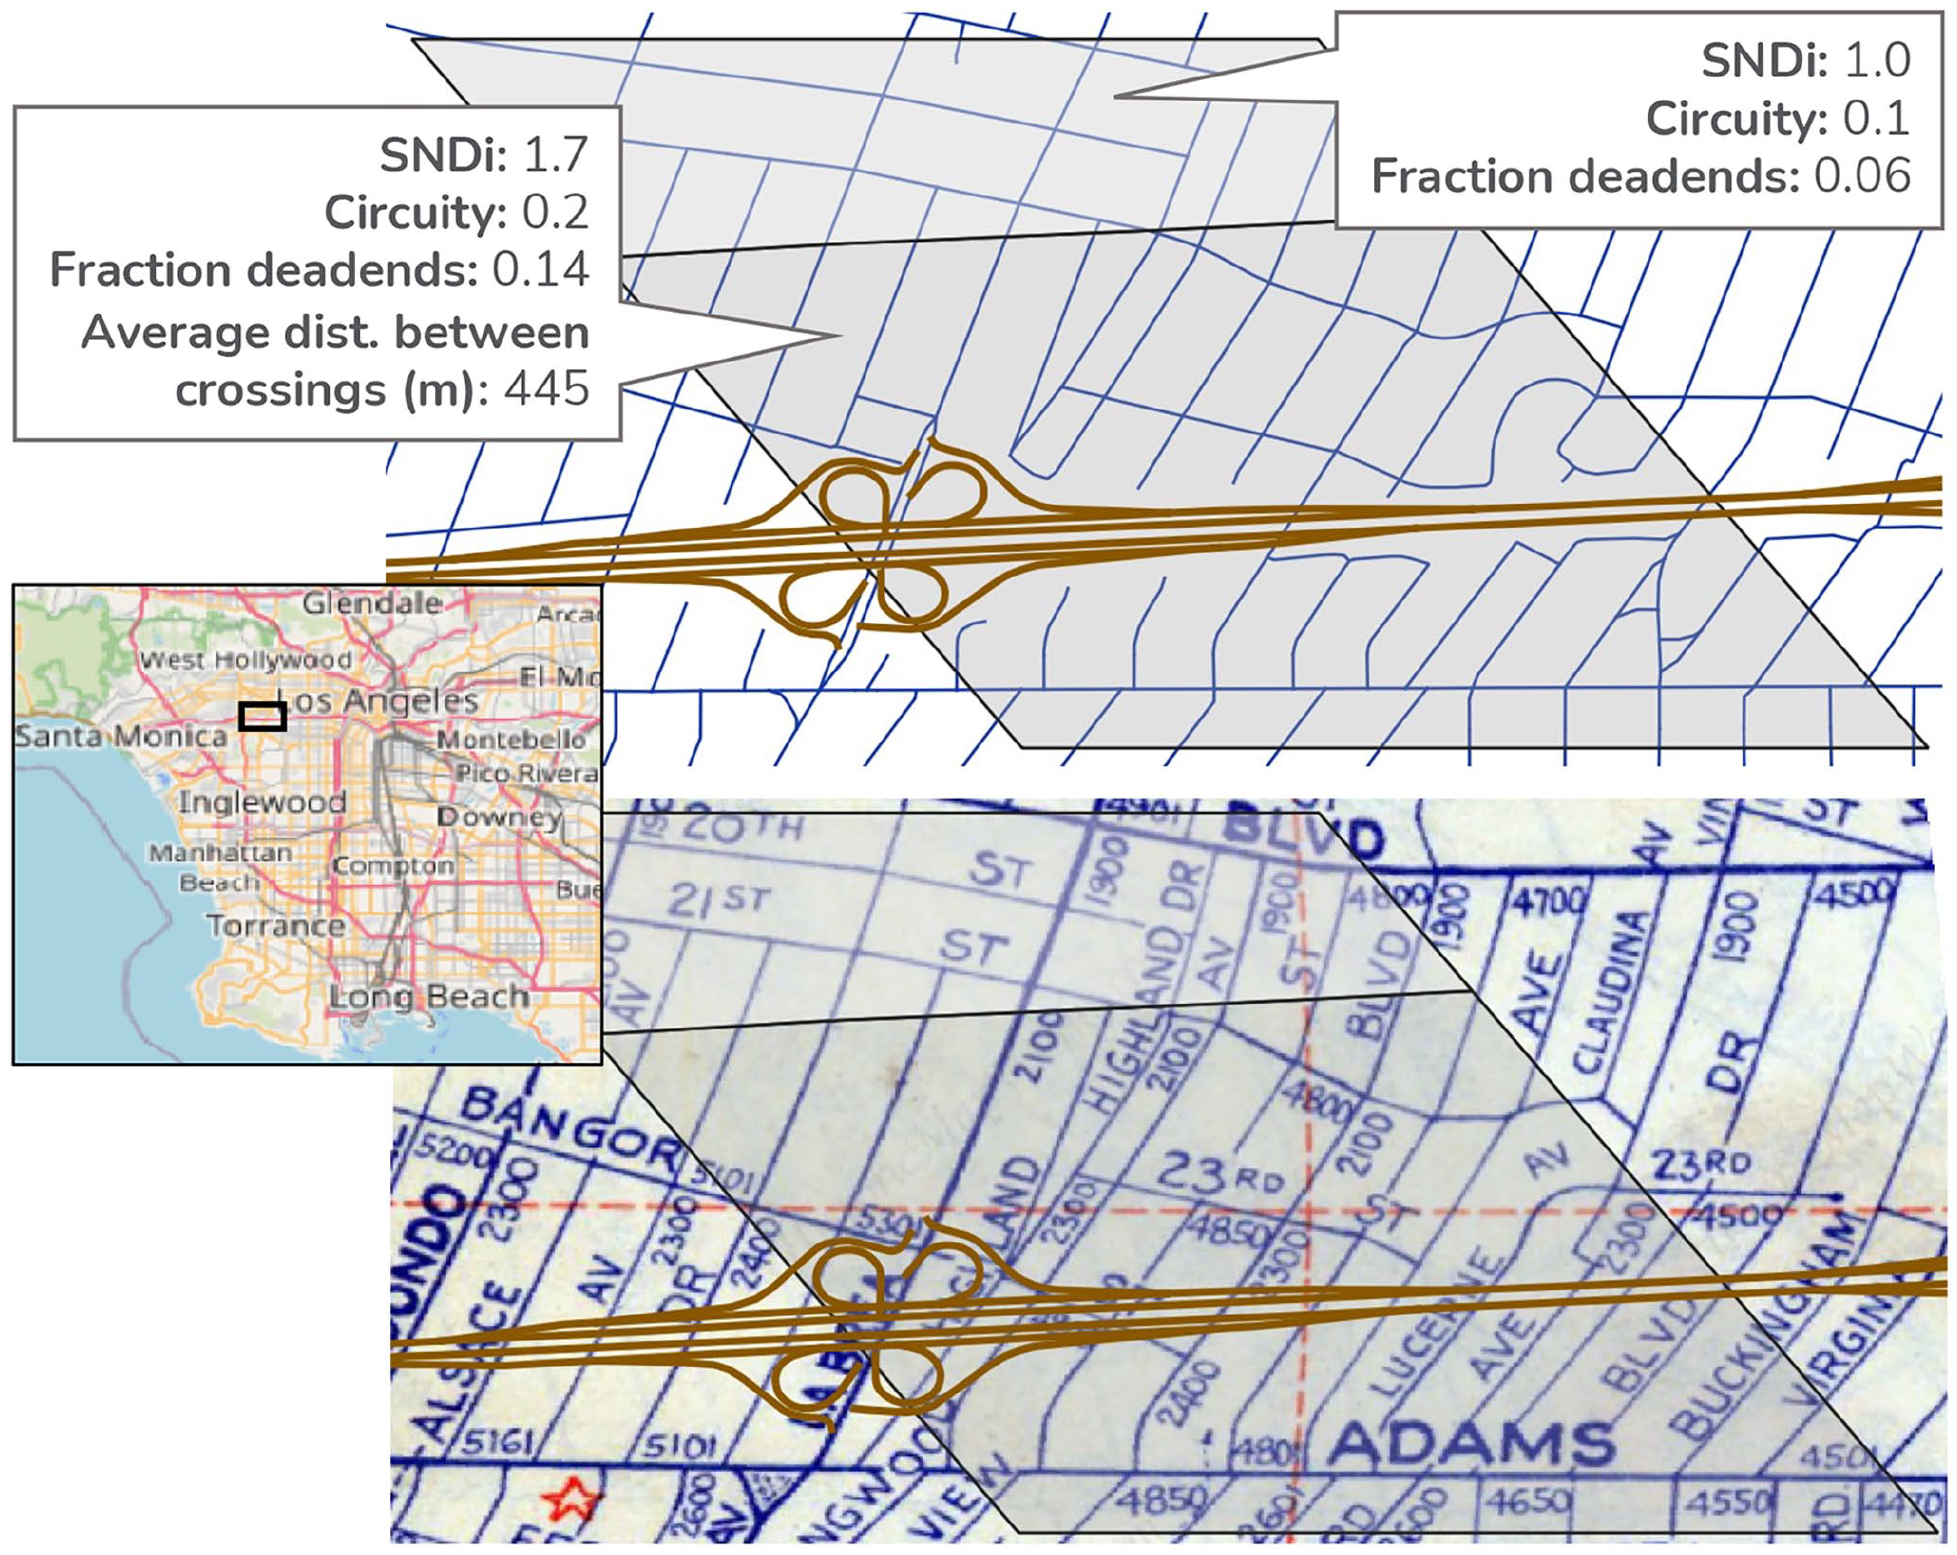
Example of connectivity differences near freeways and the original street network prior to freeway construction.
The distributions of two measures of street network connectivity, at different distances from freeways, and for all urban counties in California (upper panels) and for Los Angeles County specifically (lower panels) are shown in Figure 4. Each line gives the frequency distribution for a different distance band. Polygons within 400 m of a freeway (green lines) have less connected streets and more circuitous street networks compared with those 400 to 800 m (turquoise lines) and 800 to 1,600 m (yellow lines). At even greater distances from the freeway (1,600 m or more), there is more variation in SNDi, perhaps indicating the greater heterogeneity of built forms and topography in this larger area.
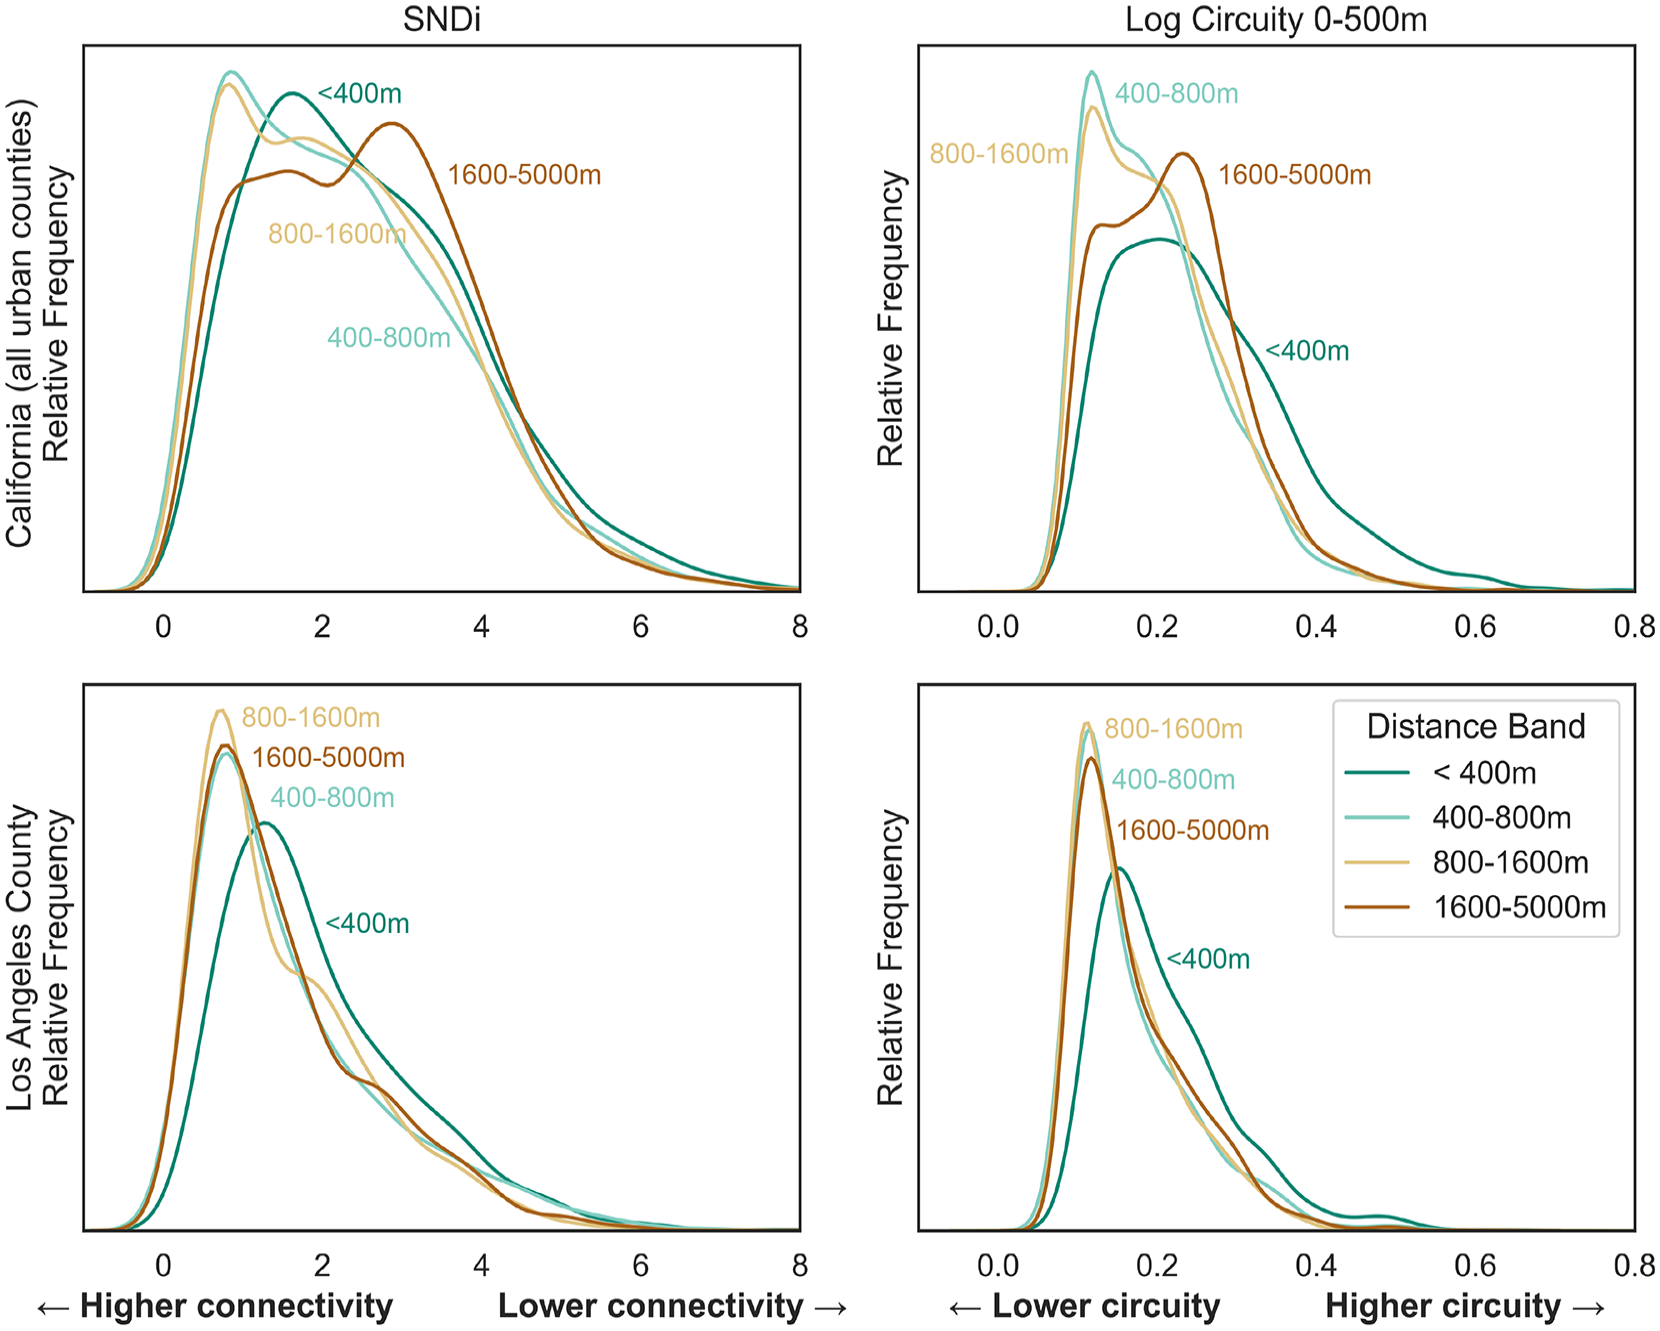
Frequency distributions of street connectivity by distance band.
The relationship between street connectivity and freeways, however, is not straightforward, as can be seen visually in the example of Los Angeles in Figure 5. The left panel shows the strong influence of topography—mountainous areas have lower connectivity as it is harder to avoid dead ends and dendritic, circuitous networks where slopes are steep. But it also shows the contrast between the older, gridded neighborhoods of south and west Los Angeles, compared with post-World War II suburbs typified by cul-de-sacs. The right panel, however, shows that even the immediate area around freeways can have more or less connected streets than more distant (400–800 m) polygons. In some cases—for example, where a freeway runs through a mountain pass—the freeway-adjacent streets are more connected than those further away (blue polygons in Figure 5, right panel). However, even where the influence of topography is less dominant, some freeways have a scarcely detectable impact on connectivity (yellow polygons) while in others, the negative impact is readily apparent (red polygons).
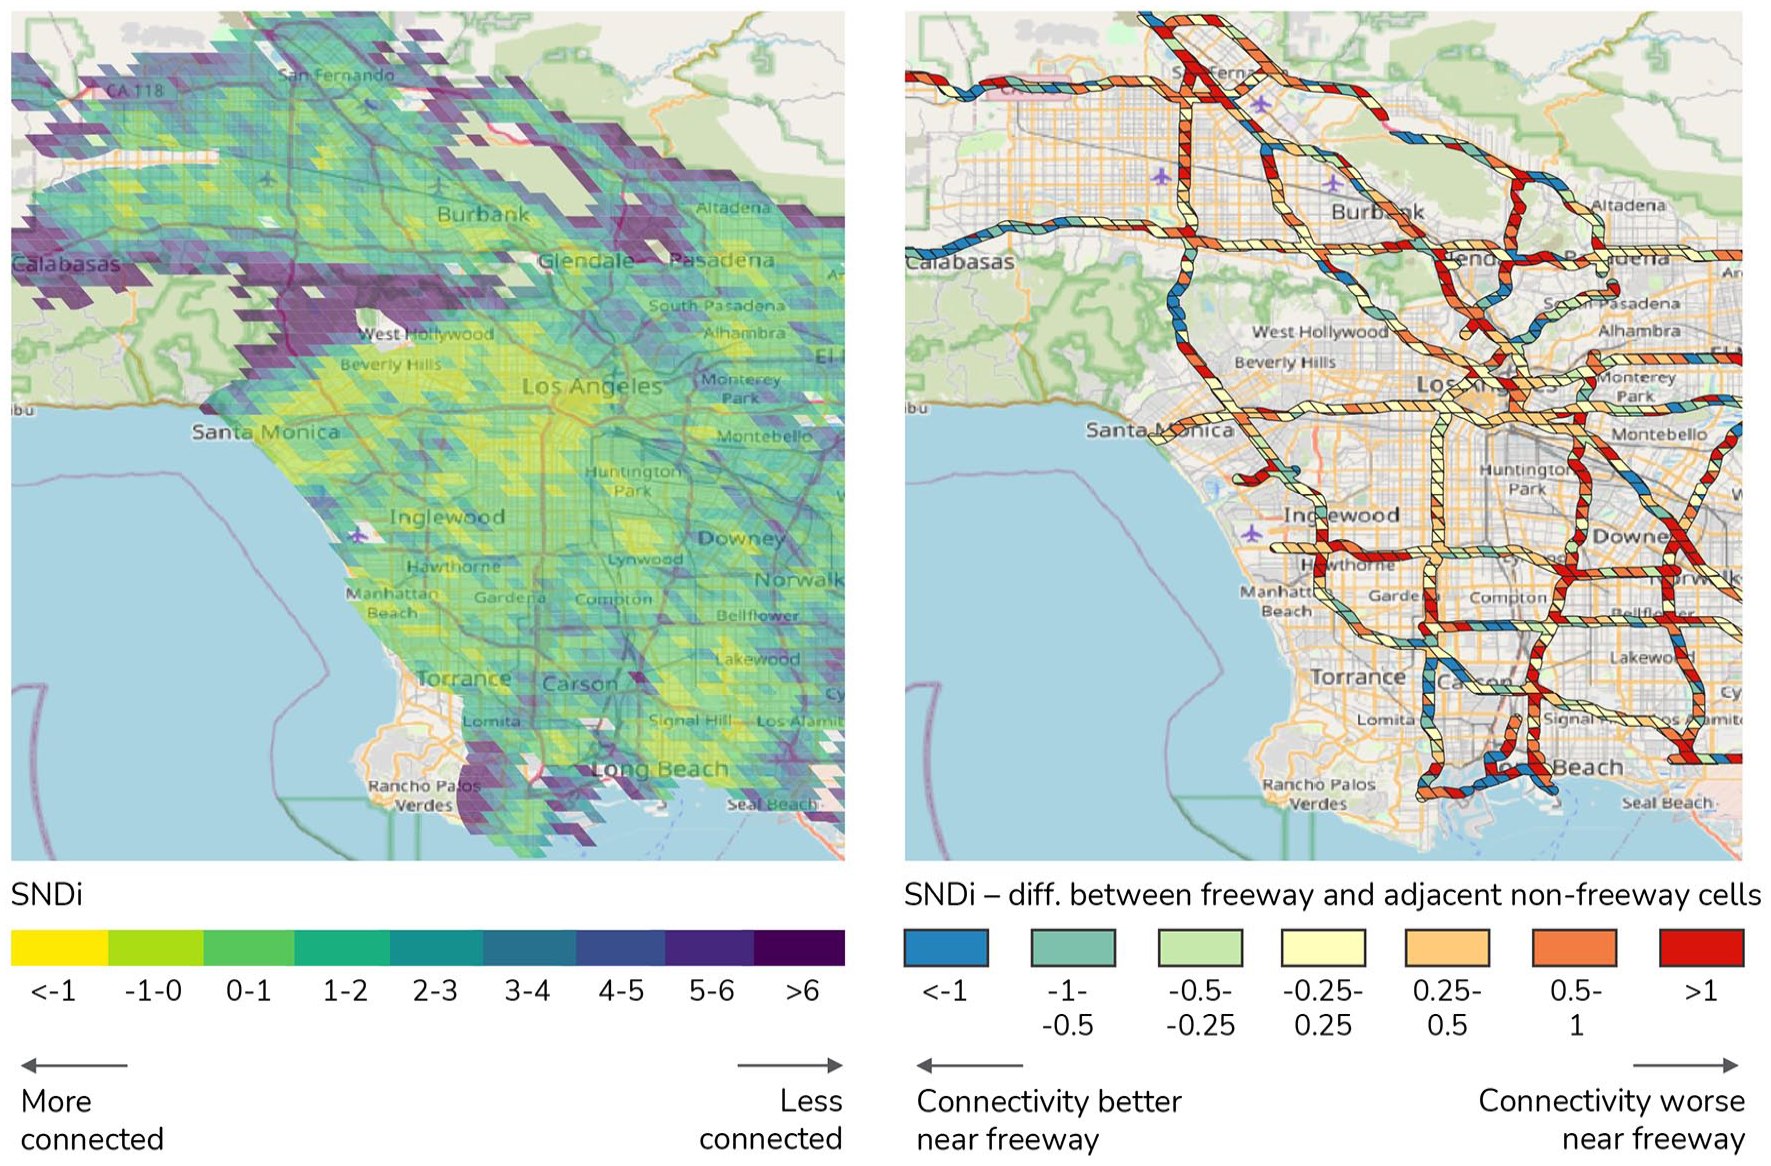
Connectivity patterns in Los Angeles county.
One might hypothesize that growing awareness of severance effects over time might mean that more recently constructed freeways were designed to have less impact on street connectivity than those built in earlier periods. However, no such relationship is apparent—the relationship between freeways and severance is uniform across freeway opening dates, according to Figure A-5.
Freeway Crossings
Distance between crossings
While the SNDi and circuity measures discussed above measure the connectivity of a street network as a whole, the distance between crossings (shown for Los Angeles County in Figure 6) is a direct indication of the extent to which a freeway imposes a barrier. The less frequent the crossings, the greater the barrier effect. In some cases, crossings are few and far between because there is no reason to cross—for example, where a freeway runs through or alongside an uninhabited area. However, even where development occurs on both sides of the freeway, there is considerable variation in the distance between crossings. In downtown Los Angeles, many if not most of the local streets bridge the freeway. However, this is not the case elsewhere in the county or state where streets (often with the same name) dead end either side of the freeway. [These patterns are similar when excluding freeway on- and off-ramps.]
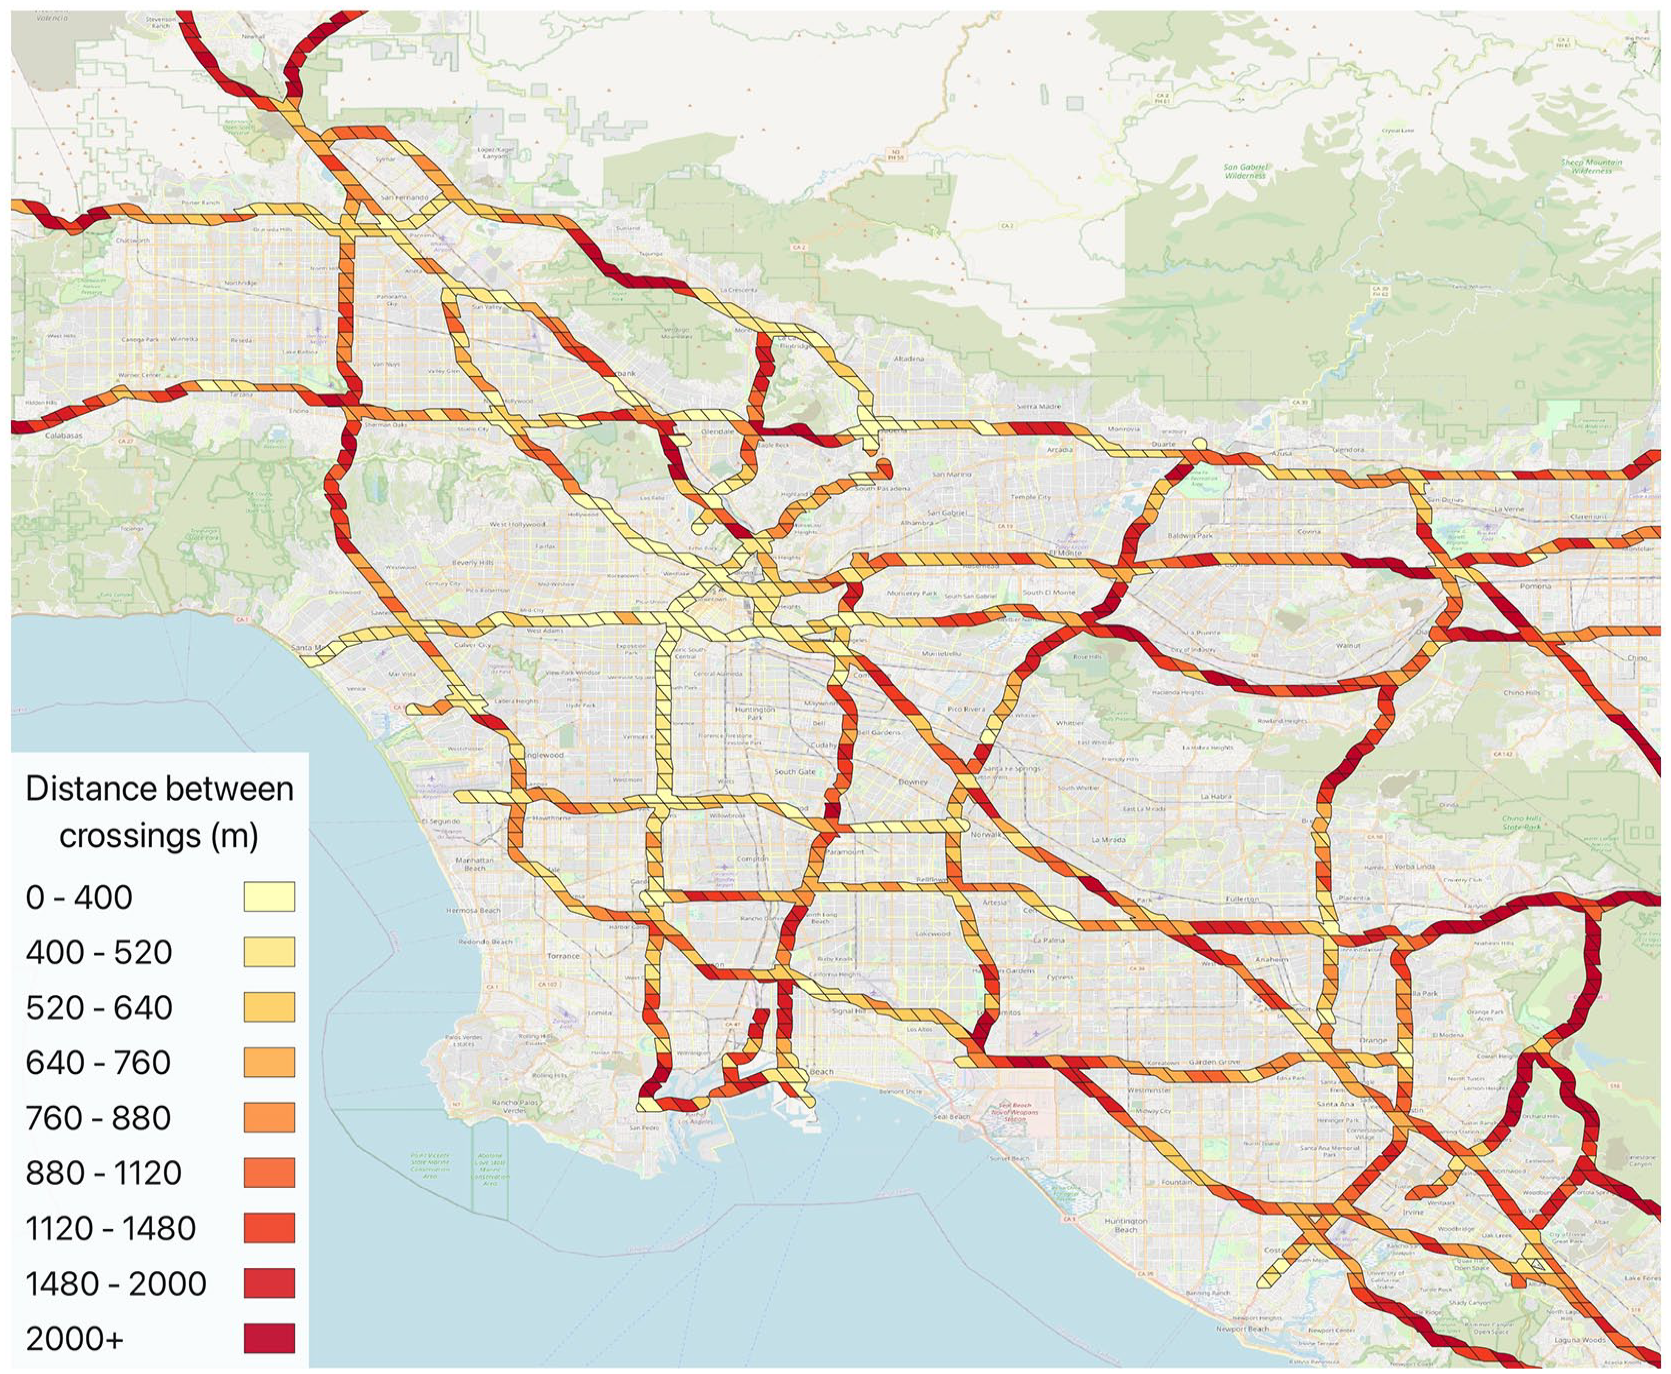
Distance between crossings, Los Angeles.
Crossing quality
The analysis above treats all crossings equally, whether as part of our broader measures of street connectivity or through our more focused analysis of the distance between crossings. Here, we explore the variation in the quality of these crossings for pedestrians and cyclists, using the audit methodology described in the “Methods” section. Given the small size of the sample, our results here focus on the descriptive statistics and the impact of removing poor crossings, rather than analyzing the associations between the quality of crossings and demographic variables.
Our average score for walkways is 2.5, that is, at the midpoint of our 1 (worst) to 4 (best) rating scale. (See Figure A-6 for the full distribution.) Entrance and exit ramps have a mean score of 2.7, and bicycle facilities 2.0. Given that the quantitative scale is arbitrary, these findings are most useful in two ways. First, there is a wide distribution, meaning that some crossings are functionally unusable or pose hazards. While most (55%) crosswalks across entrance and exit ramps had pedestrian signals, others lacked even painted crossing markings. While sidewalks were almost always present, many walkways lacked a buffer or guardrail between pedestrians and high-volume, high-speed motor traffic, and only 13 percent of crossings featured dedicated bicycle lanes. In short, not all of the crossings that physically exist are appealing or even usable by pedestrians and cyclists, meaning that our measures of connectivity presented above can be interpreted as an upper bound or best-case scenario.
Significance of crossings
The importance of crossing quality is amplified because of their sparseness; if there are long distances between crossings (as discussed above), there may not be a less-trafficked alternative nearby. We examine this formally through removing the forty-one crossings that receive the lowest rating (a “1”) in any category from the road network, and recomputing our SNDi and circuity measures (see Figure A-7 for an example). In other words, we compare the original street network data set with a modified data set with certain edges removed.
In the polygons where crossings are removed, mean SNDi increases from 2.6 to 4.2, while mean circuity doubles from 0.22 to 0.44. Thus, the effect of removing crossings is larger than the barrier impact of the freeway itself (compare with Figure 5). Because the freeway severs some streets, those that remain become disproportionately important for connectivity. Compounding the problem, motor vehicles are funneled onto a smaller number of streets that cross the freeway, which tends to further diminish the quality of those crossings for pedestrians, exposes pedestrians and bicyclists to higher levels of air pollution, and increases their risk of death or injury from a collision. A corollary is that adding or improving even a small number of crossings can make a large difference in connectivity and accessibility.
Moreover, these results represent a lower bound estimate of the impact of crossing quality, because only one crossing is removed in each polygon. In the example in Figure A-7, the crossing 800 m to the west of the one removed is of similarly poor quality (no bicycle lane and a narrow, unbuffered sidewalk next to six traffic lanes), while the one 350 m to the east has walkways blocked by homeless encampments.
Environmental Justice and Connectivity
We now consider the links between street connectivity and environmental justice. People of color are more likely to live closer to a freeway, although the differences are modest. In urban counties in California, 12 percent of non-Hispanic white people live within 400 m of a freeway, compared with 15 to 16 percent of Black, Asian, and Latino people (Figure A-8). This has implications for exposure to noise and air pollution, but does it also translate into reduced street connectivity? That is, do our measures of connectivity—SNDi, circuity, distance between crossings, and crossing quality—vary with the racial demographics of a neighborhood?
We use regression analysis to examine these linkages. Specifically, we estimate Bayesian hierarchical models using the Stan open-source software (Carpenter et al. 2017), in order to allow the effects of freeways and race to vary across counties. The modeling framework allows for partial pooling; the estimated coefficients for each county draw on information from other counties, allowing for more precise estimates particularly in the case of smaller counties with fewer observations (Gelman et al. 2012). For example, in larger counties with a dense freeway network, such as Los Angeles, we have more observations and the model heavily weights the county-specific data. In counties with fewer observations, the model gives similar results to those that would be obtained from a statewide model. In other words, the partial pooling model treads a middle ground between separate regressions for each county, and a single (pooled) regression that assumes the effects of freeways are identical in each county.
We analyze the differences between polygons within 400 m of a freeway (our treatment group) and those that lie between 400 and 800 m of a freeway (the control group). Our assumption is that these two groups are similar except for proximity to the freeway, and therefore we do not include more distant polygons that are more than 800 m from a freeway. We also control for population density (linear and squared), slope (linear and squared), and year of freeway opening and have separate intercepts to control for unobserved county-specific characteristics.
Our coefficients of interest for the largest twenty counties are shown in Figure 7. In order to facilitate comparisons, the coefficients are standardized, and so represent the effect of a one standard deviation change in each predictor variable (e.g., percent non-white) in terms of a standard deviation change in the outcome variable. The coefficients by county are provided in Table A-3.
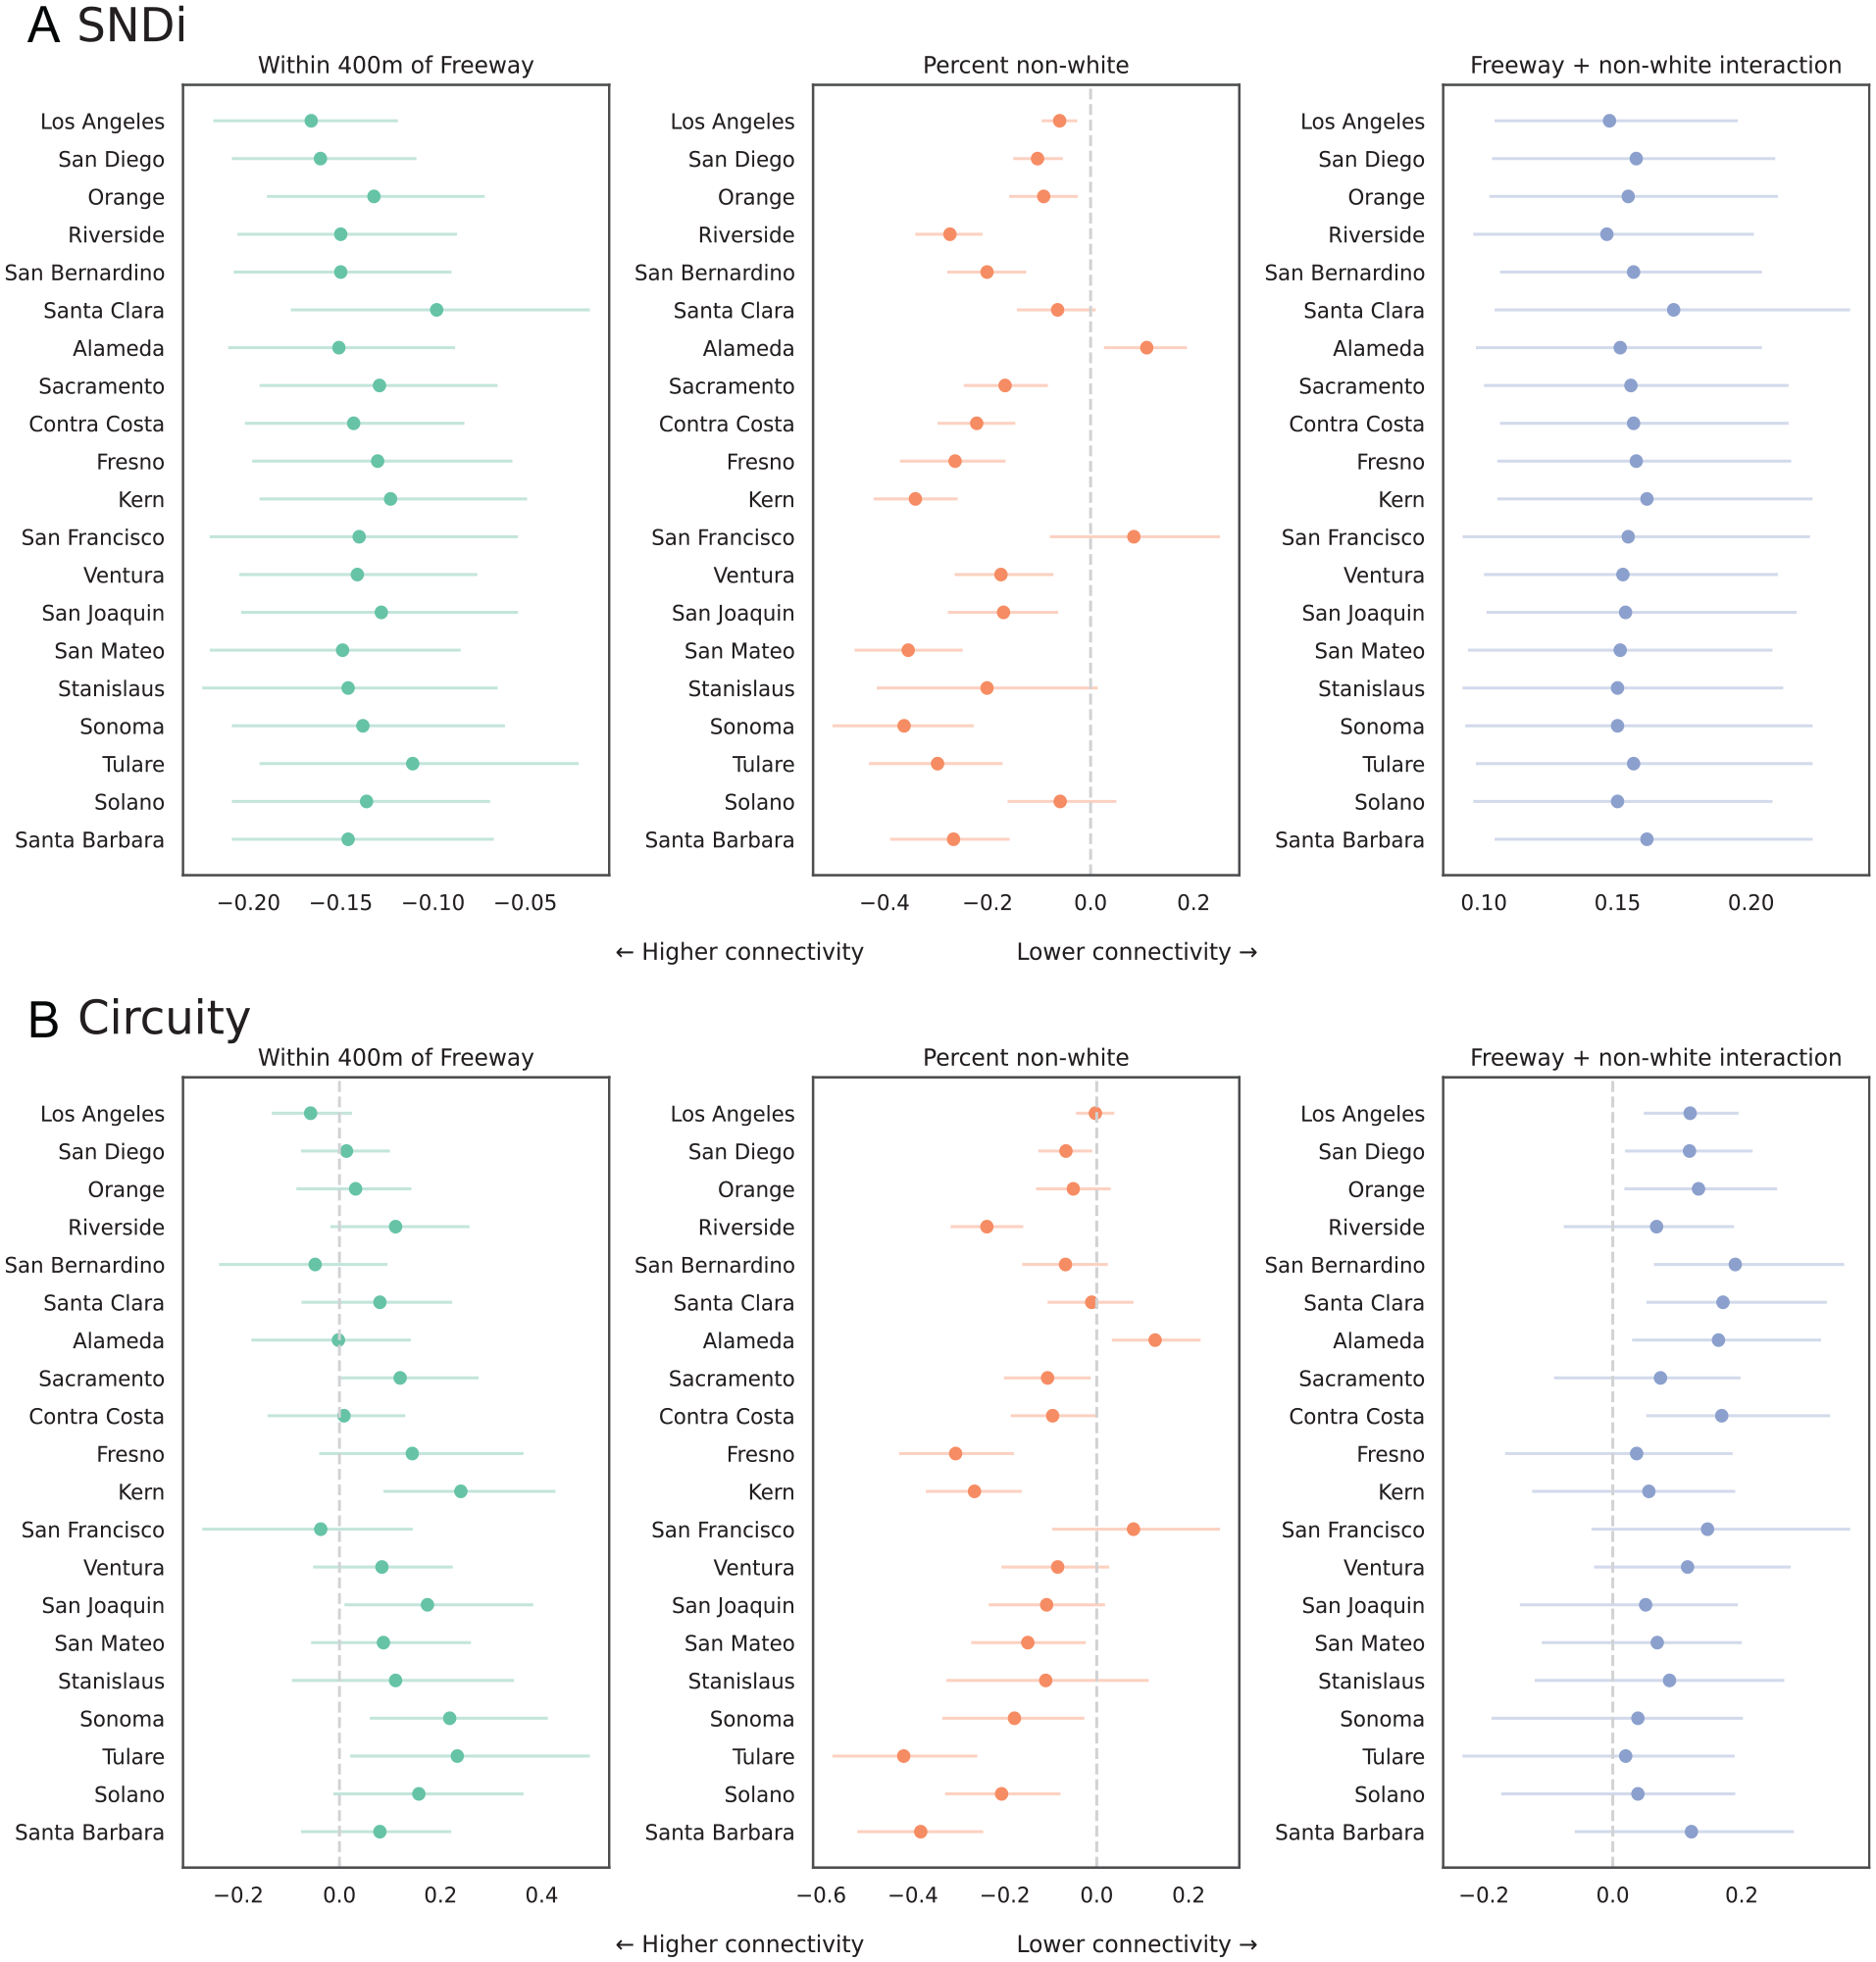
Regression coefficients.
The left columns show how SNDi (panel A) and circuity (panel B) vary between polygons that are within 400 m of a freeway and our control group of polygons in the 400 to 800 m distance band. Proximity to freeways has no consistent effect on connectivity, after controlling for slope, population density, and other factors. The effect on SNDi is in fact negative in all counties. The effect on circuity varies—in counties such as Kern and San Joaquin, proximity to freeways is associated with greater circuity, but in others, there is no statistically detectable effect, as the uncertainty range shown by the horizontal lines overlaps zero. The center panels, meanwhile, show that connectivity is typically greater in polygons with more people of color. Both of these results are somewhat counterintuitive but may reflect the locations chosen for freeway routing as much as the effects of the freeways themselves.
The right panels show how these two variables interact. In largely white neighborhoods, freeways are associated with little change or even increased street connectivity. In neighborhoods of color, in contrast, freeway proximity is associated with reduced connectivity (circuity and SNDi), particularly in the largest counties. Thus, environmental injustices manifest themselves in the differential impacts of freeways in neighborhoods of different racial demographics.
One possible explanation for these injustices could be differences in the provision of crossings. However, Figure 8 shows little variation between the distance between freeway crossings and race. Here, however, we lack a comparison group of polygons that are 400 to 800 m from a freeway (by definition, these polygons have no crossings). Instead, we are comparing across freeway-adjacent polygons with different racial demographics, and so our ability to implicitly control for other neighborhood factors and identify the impacts of race is more limited. The same is true for the association between race and crossing quality; the results (not shown) also indicate little relationship, but our analysis here is further limited by the small sample size of 100 crossings, most of which are in communities of color (Figure A-3). Similarly, the smaller sample size limits our ability to investigate whether crossing quality has improved in more recently constructed freeways.
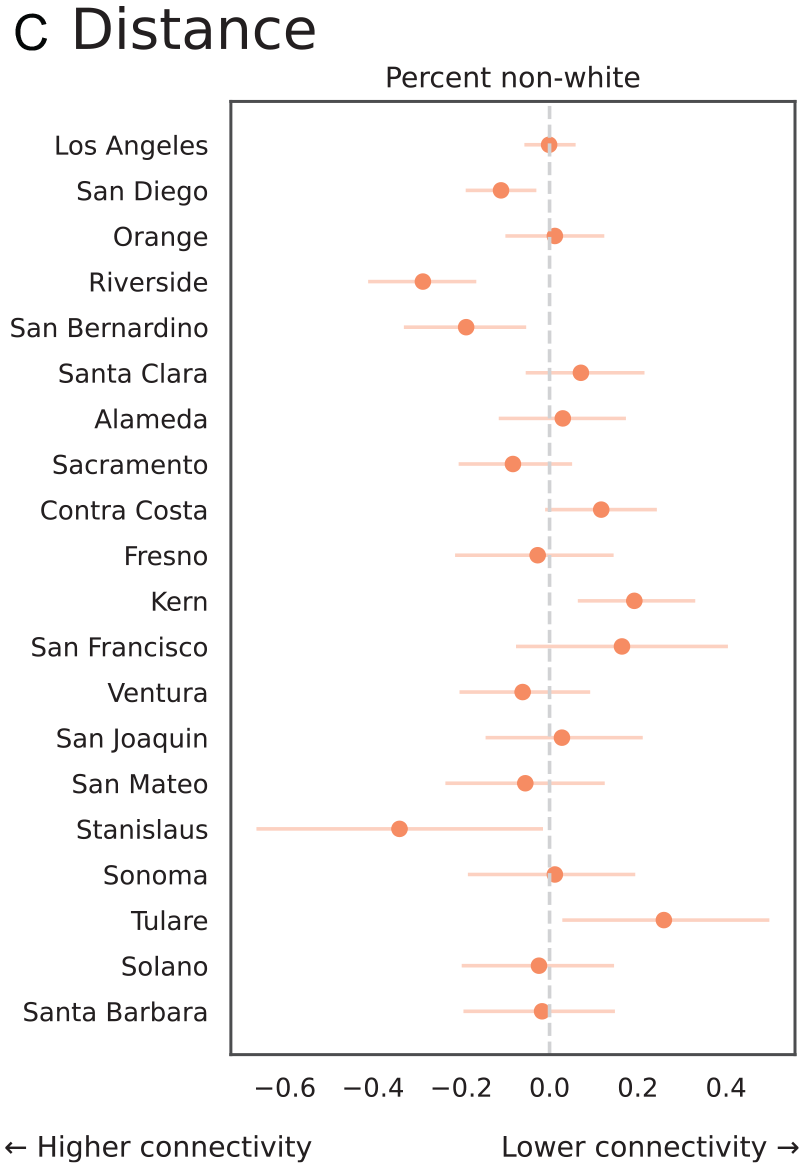
Regression coefficients for distance between crossings.
Conclusions
The impacts of freeways on street connectivity have long been recognized. These severance and barrier effects are particularly important for pedestrians and cyclists, who are more sensitive to the increased travel distances as well as non-physical deterrents to crossing freeways such as noise and air pollution. However, most studies to date have been limited to specific neighborhoods. Here, we provide the first large-scale analysis of severance using algorithms to quantify street connectivity for California. Statewide, we analyze three measures of connectivity—a composite index (SNDi), one of its component measures (circuity), and, along freeways, the distance between crossings (under- and overpasses). In Los Angeles County, we also analyze the quality of a sample of 100 crossings for pedestrians and cyclists. Our first major contribution, then, is to quantify the scale of severance effects that have previously been documented in smaller-scale case studies.
In many places, freeways measurably reduce connectivity, particularly where they run through previously established urban areas. Many otherwise-continuous local streets dead end either side of the freeway. However, the effects are surprisingly heterogeneous, and hard to isolate because freeways are often built though the parts of cities with the most connected streets. For example, planners might have chosen routes that follow flatter terrain, or even targeted older neighborhoods with connected street networks in their pursuit of urban renewal and “slum” removal. To isolate causal effects, future analysis would ideally digitize the historical street network prior to freeway construction, in order to enable a before-after comparison of connectivity (see Figure 3 for a small-scale example).
In some places (such as downtown Los Angeles), there are frequent crossings via local streets and dedicated bicycle/pedestrian bridges. In other places, there is little reason to cross the freeway, as one or perhaps both sides are uninhabited. But in a third category of places, crossings are limited to streets with on- and off-ramps, which means both that the distances between crossings (and thus the detours) are greater, and that walkers and cyclists must contend with high-volume, high-speed traffic that is funneled on to a small number of streets. These crossings are typically built with freeway access as the main consideration, not safety and connectivity for pedestrians and cyclists.
In places where crossings are sparse, connectivity is thus even poorer than SNDi or circuity would suggest. Our audit in Los Angeles County finds that many crossings offer a poor experience for pedestrians and cyclists and in some cases may be functionally unusable for non-motorized road users. The combination of fast-moving traffic at on- and off-ramps, high traffic volumes, and minimal infrastructure such as wide sidewalks or bicycle lanes makes for an uncomfortable or even hazardous experience. Moreover, the sparsity of crossings means that there is little reasonable alternative in some neighborhoods; removing the “poor” crossings more than doubles the circuity in our analysis. The existing literature has noted how freeways create severance as otherwise-connected streets dead end, but this is just the tip of the iceberg if the remaining streets do not allow pedestrians and cyclists to cross in safety, let alone comfort. Thus, our second main contribution is to highlight and quantify the impact of poor crossing quality on severance.
The impacts of freeways on severance are most pronounced in communities of color. While street connectivity tends to be better in neighborhoods with more non-white residents, freeways have a greater impact on severance in these neighborhoods. It is hard to isolate any specific causal mechanism, and as with many manifestations of environmental injustices, several mechanisms may be at play (Banzhaf, Ma, and Timmins 2019). We might speculate whether racial bias in freeway siting (e.g., Loukaitou-Sideris et al. 2023) permeates design decisions, or whether structural racism is key: less walkable neighborhoods reduce housing prices that in turn lead to lower income people of color seeking out more affordable housing. Environmental injustices, though, are fundamentally about disparate impacts regardless of whether those are brought about by intentionally discriminatory practices, and we find that those disparities exist in the case of severance.
What do our findings imply for planning and policy? For newly constructed freeways, severance can be reduced by maintaining the continuity of at least some local street connections, especially where no on- or off-ramp is provided. When crossings would otherwise be few, each additional crossing may have a large effect on connectivity. While this approach to mitigating severance may seem obvious, it has not been implemented in California, where severance effects are similar regardless of a freeway’s construction date. Newly built freeways are no better at maintaining pedestrian connectivity than their older counterparts.
For existing freeways, building new crossings (e.g., pedestrian or bicycle bridges) can be valuable, although it can be challenging to design them in a way that provides direct routes and real and perceived safety. For example, pedestrian tunnels often feel cramped and unsafe, while typical pedestrian bridge designs involve detours via switchback ramps. But the poor quality of many existing crossings points the way to a lower cost, more quickly implemented approach: upgrading existing crossings. Our analysis highlights the connectivity benefits of widening sidewalks, adding a buffer between pedestrians and moving traffic, and installing lighting on streets that cross over or under a freeway. At on- and off-ramps, cities can install pedestrian signals and tighten turn radii to slow traffic exiting or entering a freeway, and eschew curved ramps that allow for higher speeds in favor of 90-degree intersections with local streets.
These intersection design strategies to prioritize safe pedestrian movement are well established in recent manuals on urban street design (e.g., National Association of City Transportation Officials [NACTO] 2013), and our results suggest that freeway ramps may be priority locations where crossings are sparse. What is more, our analysis indicates a data-driven way to prioritize among possible options, whether adding pedestrian bridges and tunnels or upgrading crossings which are of such poor quality for pedestrians and cyclists that they can be considered not to exist. That is, planners can quantify the contribution of each new or upgraded crossing to street connectivity and the circuity of pedestrian routes. They can also weight these results to prioritize improvements by access to public transit and by neighborhood demographics, recognizing that freeways have—often by design—wrought a disproportionate toll on communities of color.
Efforts to address severance should be seen in the context of the full set of impacts of freeways, such as air and noise pollution, which are also concentrated in communities of color. Rather than addressing the negative consequences of freeways in a piecemeal fashion through (say) pedestrian bridges, sound barriers, and supplying air filters to nearby households, planners and policymakers might look for policies that can address the root causes of severance, pollution, visual blight, and ecological connectivity. They might look to cities such as Boston and Oslo that are undergrounding road infrastructure, or to Seoul and San Francisco that have started to remove some freeways altogether. Pedestrian bridges and other new and upgraded crossings might alleviate some of the scars of freeways on urban neighborhoods, but freeway removals and undergrounding are perhaps the only way to address severance, pollution, and environmental justice in a comprehensive fashion.
Supplemental Material
sj-pdf-1-jpe-10.1177_0739456X241247330 – Supplemental material for Dividing Highways: Barrier Effects and Environmental Justice in California
Supplemental material, sj-pdf-1-jpe-10.1177_0739456X241247330 for Dividing Highways: Barrier Effects and Environmental Justice in California by Adam Millard-Ball, Ben Silverstein, Purva Kapshikar, Sierra Stevenson and Chris Barrington-Leigh in Journal of Planning Education and Research
Footnotes
Acknowledgements
We appreciate helpful comments from staff at Los Angeles Metro, particularly Chris Moorman, Khristian Decastro, Isabelle Garvanne, and Jacob Lieb, and from the editor and two anonymous reviewers. Thank you to Claudia Bustamante for the photography.
Declaration of Conflicting Interests
The author(s) declared no potential conflicts of interest with respect to the research, authorship, and/or publication of this article.
Funding
The author(s) disclosed receipt of the following financial support for the research, authorship, and/or publication of this article: This study was made possible through project funding (2022-16) received by the University of California Institute of Transportation Studies from the State of California through the Public Transportation Account and the Road Repair and Accountability Act of 2017 (Senate Bill 1). The contents of this report reflect the views of the authors, who are responsible for the facts and the accuracy of the information presented. This document is disseminated under the sponsorship of the State of California in the interest of information exchange and does not necessarily reflect the official views or policies of the State of California.
Supplemental Material
Supplemental material for this article is available online.
Notes
Author Biographies
References
Supplementary Material
Please find the following supplemental material available below.
For Open Access articles published under a Creative Commons License, all supplemental material carries the same license as the article it is associated with.
For non-Open Access articles published, all supplemental material carries a non-exclusive license, and permission requests for re-use of supplemental material or any part of supplemental material shall be sent directly to the copyright owner as specified in the copyright notice associated with the article.