
Abstract
The rapid growth of U.S. Sunbelt cities has intensified urban development pressures. Low-income housing demolitions are a result of such pressures as they are “low hanging fruit” for urban renewal, which can be further intensified by housing quality perceptions. By combining deep learning on Street View images (STV) with machine learning, we provide a model that accurately predicts demolition orders and allows assessing the heterogeneity of these predictions depending on the evaluator’s perceptions. Based on fast-growing San Antonio (TX) data, our results show that automated models can be useful to assess human perception biases of code enforcers.
Introduction
Sunbelt cities across the United States are experiencing an unprecedented level of population growth, which has contributed to the rise in housing demand and urban development. Motivated by the pandemic and rising housing prices in larger metro areas, sunbelt cities have grown mostly from internal migration gains that accounted for more than half a million people moving to only four states (Florida, Texas, Arizona, and North Carolina) between July 2021 and July 2022 (Joint Center for Housing Studies 2022, 15). As population growth continues, the demand for increased housing supply becomes more pressing. While it may be possible to address this demand by constructing housing in suburban areas where land costs are lower, recent research on urban preferences among affluent newcomers, particularly in downtown areas (Hyra 2015), reveals a significant impact on low-income neighborhoods. For years, housing demolitions have been the favored policy when facing investment potential and urban renewal (Hackworth 2016). Although several articles have studied neighborhood and housing characteristics as the contributing factors explaining demolitions (Bender 1979; Brueckner 1980; Helms 2003; Weber et al. 2006), new methods and data from the city sensing literature (Dubey et al. 2016) have opened a new way to explore the role that perceptions about housing and neighborhood quality have in the likelihood of demolitions.
This paper contributes to the literature by developing a new method for accurately predicting demolition orders and assessing code enforcement. Our method first creates a housing quality perception score using Deep Learning on Google Street View images (STV). Then, this score is combined with past city-records on demolition orders to train a machine learning model. This machine learning model is later used to do out-of-sample predictions for a large area that would not be possible to accomplish using traditional in-person housing quality assessment methods. Finally, we compare the prediction outcomes from city-records, with two external evaluators that rated blindly the same images using the same city rubric. We believe this method is complementary to previous studies that study housing demolitions focusing on the housing stock’s de-facto characteristics (year built, number of code violations, house price, mortgage/tax delinquency, etc.), because it provides three main advantages: (1) it allows to create a variable to proxy housing quality that is often not available/used in this type of studies, (2) it only requires street view imagery and city-records on demolition orders, and (3) it provides a way to assess potential bias in code enforcement as it allows to compare inter-rater demolition prediction outcomes.
Finally, and perhaps more importantly, we contribute to the literature by showing how new technology-based data and methods can be powerful allies toward addressing biases and reaching higher levels of social fairness. We use San Antonio (TX) as a case study as it is one of many cities currently enduring both high housing demand pressures from fast population growth (U.S. Census Bureau 2023), and a city with a high demolition rate on low-income households (Way, Judd, and Willis 2021). In specific, using our model’s prediction outcomes as a baseline for ground-truth cooperative data collection with community organizations, we demonstrate that this method can be useful to practitioners and community organizations concerned with assessing demolition orders as well as potential code-enforcement biases. As the model prediction outcomes can be a useful source of information to identify early signs of housing decay, this work would encourage city officials to use new technologies to aid in the prevention of unnecessary demolitions while also enabling the targeted allocation of resources to households in need, rather than waiting for them to actively seek housing rehabilitation assistance.
Regarding demolition order predictions, our results show that, besides the initial eighty-two houses (out of 934) that received a demolition order from the city, an average of an additional 559 (out of 10,697—5.23%) properties are predicted to get a demolition order when using the official city records to train the machine learning model. In contrast, the first external evaluator marked forty-nine houses (out of 934) for demolition, and the model based on her ratings predicts an additional 282 (out of 10,697—2.64%). Finally, the second external evaluator marked 138 houses (out of 934) for demolition, and the model based on her ratings predicts an additional 4,675 (out of 10,697—43.7%). These results show (1) that deep learning and machine learning models can be powerful tools that can help to quickly narrow down the search of houses that need housing rehabilitation assistance, hence helping to prevent potential decay and demolition, and (2) that housing quality perceptions can greatly influence demolition outcomes.
The rest of the article is organized as follows. Section “Literature Review” situates this paper in the literature of housing demolitions and code enforcement as an urban renewal policy in the United States. Section “The Case of San Antonio, Texas” provides an overview of the case of San Antonio in the United States that would help to provide context into the area of study and the current pressures of neighborhood change. Section “Methods and Data” details the methods used and describes how it was implemented. The results section provides the main results, while Section 6 discusses their implications. Section “Discussion” concludes by summarizing the main goals and findings of this article, as well as providing guidance on the limitations and necessary future research in this topic.
Literature Review
Much of the previous literature has been focused on understanding the drivers of demolitions as a first step toward predicting future cases. However, no drivers have been widely agreed upon because there are two distinct research streams that have studied demolition drivers attending to different contexts: gentrification and shrinking cities. Therefore, this section first reviews how past research exploring demoliti-on drivers has used contextual variables (i.e., property or neighborhood-level variables capturing the status of measurable dimensions correlated to demolitions such as gentrification, vacancy, and abandonment). In contrast, it examines the exclusion of variables based on actual or perceived housing quality or physical conditions, which are often left out of quantitative studies due to lack of data. In addition, this review will touch on additional dimensions related to the study of housing demolitions, such as policy and regulatory frameworks, as well as equity and social justice considerations. By incorporating these dimensions, the aim is to provide a comprehensive context for understanding and predicting housing demolitions.
On one hand, and as a sign of high demand for land, the area of demolition research concerned with the aspects of gentrification and redevelopment has focused on understanding how housing demand pressure manifests in specific areas and the distinct characteristics of properties that become targets for demolition. Weber et al. (2006) is a good example of this stream of the literature, which builds on previous research investigating the economic contexts that contribute to the pressure for demolitions (Rosenthal and Helsley 1994; Wyly and Hammel 1999). These previous articles have motivated more current research that examines the influence of other sectors (e.g., tourism, cultural heritage, and luxury construction) in fueling the drive for demolitions (Charles 2013, 2018; Cheung and Yiu 2023; Dye and McMillen 2007). Most of these studies have used specific variables regarding housing and neighborhood characteristics that have two main aspects. First, these variables are mere proxies of housing quality, as the actual measurement of housing quality may not be directly observed (e.g., building age, lot size, building size, and building materials). Second, these variables are not often readily available for planners to assess demolition drivers due to their nature (e.g., housing sale prices and transactions, vacancy status, and nearby built environment and housing investment), or their scale at which they are collected (property level records with sociodemographic profiles).
On the other hand, the research stream focused on sh-rinking cities, indicative of low land demand, has focused on understanding the drivers of housing demolitions as a solution that is “needed” to address the surplus of decaying housing stock, which gives rise to negative spillover effects. As such, several articles have been dedicated to exploring the drivers for vacant housing and land (Accordino and Johnson 2000; Gedal and Ellen 2018; Newman et al. 2019), or exploring how neighborhood action plans are adjusted for shrinking objectives (Gao and Ryan 2020), and even understanding the impacts on crime reduction from housing demolition (Draus et al. 2019; Kagawa et al. 2022; Wheeler, Kim, and Phillips 2018). Hillier et al. (2003) and Morckel (2013) are two important articles focused particularly on predicting housing abandonment in this stream of the literature. However, similar to the studies focused on gentrification, these articles encounter similar challenges as they (1) rely on contextual variables that serve as proxies of housing physical conditions and (2) require important data compilation efforts for having a sound statistical model.
As such, both gentrification and shrinking cities streams of the literature regarding housing demolitions have requi-re important efforts to assemble data sets for quantitative research. For example, the logistic regression estimated in Hillier et al. (2003) used twenty property-level variables such as vacancy status, code violation records, water and gas billing status, market value, liens, forced sale status, concentration of tax delinquent properties in 500 meters, and more. As the authors detail, the creation of this database, known as the Neighborhood Information System (NIS), comprising over 100 variables, required substantial effort. This endeavor involved the amalgamation of various funding sources, a collaborative data sharing agreement between the city and university, designing protocols for data integration practices that would reconcile the different spatial and temporal relationships across data sets, as well as several data quality controls from experienced city staff to avoid reliability and validity issues. All this effort was highly justified as prediction models that feed into early warning systems are useful tools for practitioners who aim to proactively address problems (such as housing demolition and abandonment) before they manifest. However, not all cities have the similar social and financial capital resources to create a NIS, nor have the same willingness to create early warning systems as they may have incentives to let abandonment and demolition take place.
In addition to understanding the different streams of the literature that elucidate and predict demolitions, it is important to understand the additional dimensions that shape the dynamics of demolitions, including actors involved, regulatory frameworks, and equity implications. First, demolition has long been a subject of contention in urban policy given the opposing views from those involved in the process: residents, real estate developers, and government officials. Both real estate developers and government officials generally have compatible incentives to demolition. As described in Hackworth (2016), the common view is that demolition has regenerative effects as it will incentivize new development, hence bringing construction jobs, new and higher-income homeowners and businesses that would want to serve them. Despite four decades of what Hackworth (2016) refers to as “ad hoc demolition” policies, which resulted in the removal of over 50% of the housing stock in 269 neighborhood across forty-nine cities, the regenerative effects in U.S. rustbelt cities are yet to come. In contrast to the low-demand-for-land context from the rustbelt area, in high-demand-for-land contexts, such as the U.S. east and west coast cities in the mid-20th century or sunbelt cities today, a similar pattern of demolitions has emerged. These demolitions are fueled by similar motivations from real estate developers and government officials to increase profits and property-tax base from new construction, respectively. For example, Talen (2014) is a key article that documents how government-backed demolitions from different agencies and policies (e.g., Federal Highway administration and Housing Acts, New York City Director of Demolitions, to name a few) took place across the United States during the mid-20th century without any national accounting of what was demolished. In sum, in line with Hackworth’s (2016) findings, Talen (2014) also shows that demolitions created dramatic loss of housing stock between 1940 and 1970 without any significant improvement in density or socioeconomic conditions by the 2000s.
Demolitions have also shown different outcomes due to the specific scope of the regulatory frameworks where they are embedded. There are several articles that have documented the various ways in which code enforcing can be used to accomplish demolitions across different cities in the United States (Cummings and Snider 1984; Elliott and Quinn 1983; Evans-Cowley 2006; Grigsby 1971; Meier 1983). For example, taking St. Louis as a case study, Elliott and Quinn (1983) showed that in response to local and federal pressures, the city adopted a concentrated code enforcement strategy. While initially intended as a rehabilitation tool, the city’s approach created serious issues in neighborhoods with severe decline such as increased crime and vandalism, prompting a shift in focus to neighborhoods with “sound housing” only. As code enforcement has continued to be part of urban renewal policies, Martin (2019) and Way, Judd, and Willis (2021) provide two recent examples of how code enforcement has been purposely used to clear targeted areas for urban redevelopment in Texas cities.
In addition to the importance of regulatory frameworks for understanding the determinants of housing demolition, understanding the impacts that demolitions have on vulnerable population is of paramount significance. This equity dimension is highlighted here because demolitions are often justified as a way of addressing urban blight and improving overall conditions. As pointed by Suglia et al. (2014), poor housing quality conditions are an important determinant of poor physical and mental health that needs to be addressed in depth if those suffering from it are expected to successfully reintegrate into the labor market. However, it is also important to highlight that cities have often used urban and public health concerns as an opportunity to open new spaces for residential development. For example, Lopez (2009) has shown the role of the American Public Health Association on declaring low-income areas as “blighted” providing a strong justification for pursuing housing demolitions in the name of public health improvement. At the end, while demolishing old and affordable housing stock may seem as a quick fix to address public health concerns, it is likely to create other more complex and enduring problems in the long run such as homelessness, overcrowding, domestic violence, increased rates of education dropouts, just to name a few.
In addition to providing valuable evidence on the detrimental consequences of demolitions in eradicating affordable housing stock, the significance of the previous articles lies in their relevance to the present-day urban landscape. It is essential to note this because demolition remains a prevailing urban policy that continues to shape cities significantly. In this context, cities need an alternative approach to assess the potential of demolition of old and affordable stock that does not solely rely on traditional and expensive data building efforts. We believe our paper contributes to the literature by providing a novel method that now is more accessible due to the advancements in computing power and data science, and that also provides a way to assess housing quality perceptions that could be useful to assess potential code enforcement bias.
The Case of San Antonio, Texas
San Antonio is an interesting case of study for predicting housing demolitions for several reasons. First, San Antonio was ranked as one of the fastest growing cities, adding almost 14,000 new residents between 2021 and 2022 (U.S. Census Bureau 2023). This is not a new trend since the San Antonio metro area added 300,000 new residents between 2015 and 2020, reaching a total of 2.6 million, and it is expected to gain and additional one million inhabitants by 2035 (Texas Demographic Center 2022). Accordingly with its fast population growth, San Antonio has also experienced fast homeownership and rent appreciation. According to Multiple Listing Services data from the San Antonio Board of Realtors, 1 the median sale price for single-family homes grew from US$241,000 in June 2019 to US$348,200 in June 2022, representing a 44% increase within a relatively short timeframe. Although the market has cooldown due to the increasing mortgage interest rates, median sale prices have remained at US$324,750 by May 2023.
Second, housing has been a highly contentious issue in San Antonio, particularly affecting the low-income population, not only because of the impacts that early redlining practices had on low urban investment and job accessibility that are still visible in today’s housing conditions (Mendoza 2022), but also the reported high rate of housing demolitions that have affected particularly the Latinx population on the Westside of the city. According to Way, Judd, and Willis (2021), the City of San Antonio (CoSA) issued 442 orders to demolish single-family residences (138 of which affected occupied homes) between 2015 and 2020, with a large number concentrated in San Antonio’s Westside, while other mid-sized and large cities in Texas averaged less than twenty demolition orders over the same period. Having well defined hot spots of single-family demolitions in low-income neighborhoods is a clear reflection of deep social inequalities. Demolitions further impoverish households and neighborhoods as their history and value gets lost and opens the door for other city afflictions such as crime, displacement, predatory lending, land speculation, and squatting.
Although CoSA officials have rejected the findings presented by Way, Judd, and Willis (2021), arguing that the report was based on flawed data and that the city has followed due process, 2 the practice of using code enforcement as an urban renewal strategy has been commonly implemented in other U.S. cities (Hackworth 2016). As such, it is important to have unbiased and readily available means to assess housing quality, since this new wave of population growth may accelerate, thereby making code-enforcement-for-urban-renewal practices more frequent in mid-size cities across the United States. As shown by the recent federal effort to address appraisal bias with the creation of the Interagency Task Force on Property Appraisal and Valuation Equity, housing biases are deeply rooted in our society, and have tremendous consequences in the creation of social injustices and limiting inter-generational wealth creation for low-income families. Bias-induced housing demolitions are no different. In consequence, combining direct community engagement with the use of new data-driven solutions that can both prevent unnecessary housing demolitions and assess code enforcement bias, is an imperative if San Antonio city officials want to demonstrate genuine commitment their stated goal of “Preserve Existing Older Housing Stock for Affordable Housing and Anti-displacement” (CoSA 2021, 16).
Third, and in addition to the larger social justice and policy problem described above, cities need to have up-to-date information about their neighborhood housing conditions if they would like to prepare their cities to withstand both the pressures of population and climate change. San Antonio has been highlighted as an example of a city that has a complicated past regarding environmental injustices (Miller and Castro 2021), but that is currently concerned with both equity and climate change issues and is investing in developing strategies to cope with the future threats of climate change (Gardner 2022). In 2019, the city adopted the Climate Action Plan “Climate Ready,” and in May 2022, San Antonio voters approved a US$1.2 billion-dollar bond proposition, which included a substantial allocation of US$150 million specifically designated for affordable housing initiatives, from which US$45 million are aimed at assisting homeowners in repairing dilapidated housing. However, in mid-size cities with smaller governments, data availability and scarcity of resources are a great challenge because they strive to maximize efficiency in allocating resources, yet often lack the detailed data necessary for well-informed decision-making. Hence, the decision-making of home demolition tends to be a black box.
Methods and Data
Our goal is to predict the potential of future demolition orders in the entire area of study near Westside neighborhood. First, we established an experimental design data collection process. Treated observations are those that have already received a demolition order, while Control observations are those that are within a fifty-meter 3 radius from each treated house. Second, we collected STV images for both treated and control houses and used them along with a crowdsourcing database to train a deep learning model that would provide a score for each treated and control images describing them in six dimensions of human perception or urban quality (safe, lively, wealthy, boring, active, and beautiful). These perceptions can capture emotional and psychological aspects that may influence the quality and condition of housing. Third, we train different machine learning models looking for the best model to predict demolition orders based on the previously collected treated and control data set and the deep learning scores. Fourth, using the best machine learning model, we collected STV images for the entire study area (that involves 11,000 observations approximately), and predicted which housing units were likely to receive a demolition order in the future. Fifth, we bootstrapped the machine learning method to assure that the results were not sensitive to the method. Finally, to provide a way to assess potential code enforcement bias, we invited two evaluators external to the City of San Antonio to rate the images based on the same criteria that city code officials used when issued previous demolition orders. The machine learning models described above were retrained based on the code enforcement perceptions from these two external evaluators, which provides a sense of how much the demolition prediction will change when different perceptions are used. In the following sections, we provide the details of these steps.
Data
As mentioned before, we purposely chose not to use traditional variables shown to predict demolition and abandonment as they may be hard to obtain. Hence our method only relies on STV images and records of demolition orders. As such, to address our research questions, we gathered data from multiple sources. Firstly, we obtained the location and dates from previous residential demolition orders from the Ousted report (Way, Judd, and Willis 2021). As mentioned previously, the authors of this report analyzed information on demolition orders between 2015 and 2020, which was collected via freedom of information request to the Department of Development Services of the City of San Antonio (CoSA). It is important to note that the information presented by the Ousted report was in part collected and validated by community and nonprofit organizations such as The Esperanza Peace and Justice Center, and Texas Housers, who have been experiencing the issue throughout the years.
We focused our study on eight census tracts in the Westside community of San Antonio (Figure 1), as these census tracts composed one of the identified clusters of demolition orders in the Ousted report (Way, Judd, and Willis 2021, 23). Although another demolition cluster was identified on the Eastside, we focus on the Westside cluster as it has been shown to be at a lower gentrification stage compared with the highly gentrified Eastside of the city (National Association of Latino Community Asset Builders 2018). We included in our analysis only cases that had or could lead to a demolition of structures, hence discarding case outcomes such as “Repaired by Owner” or “Referred to the office of Historic Preservation.” Within the study area, eighty-two homes received a demolition order (DO) that resulted or was in the process of demolition. Figure 1 presents the study area with selected census tracts and reference map of Bexar County (TX).
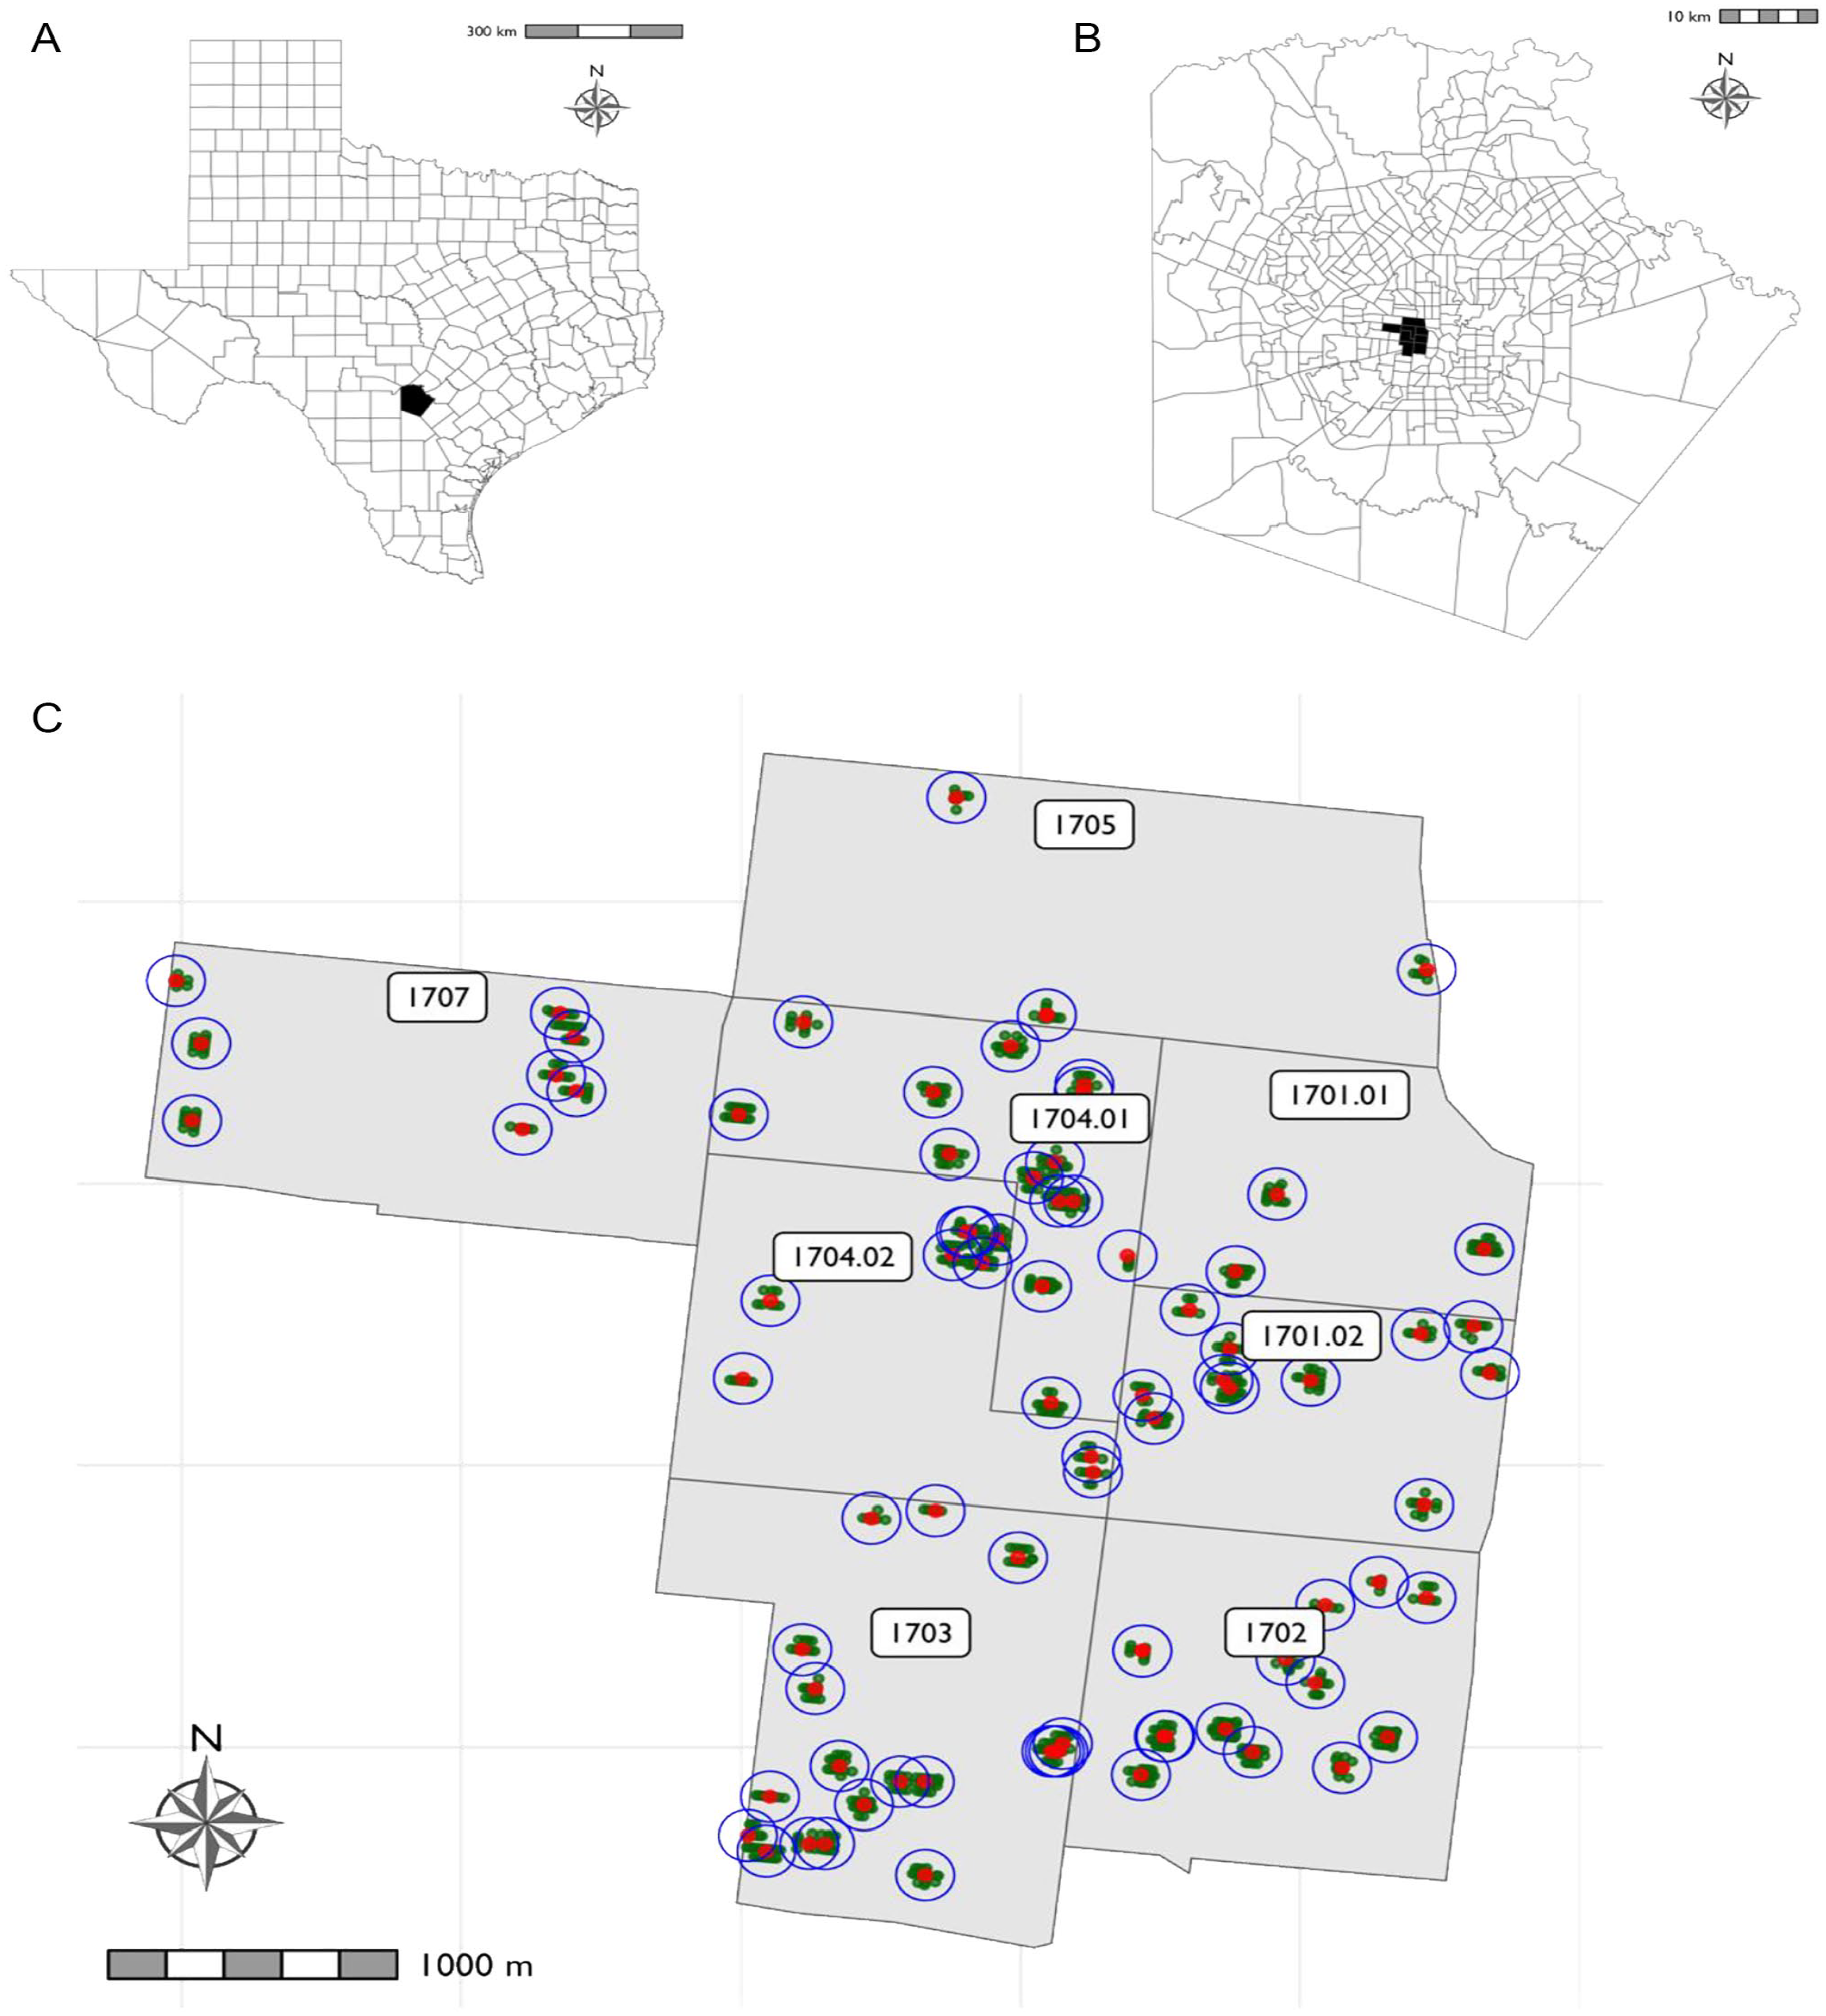
Study area: (A) State of Texas, United States, (B) Bexar county, (TX), and (C) Study area.
Secondly, we used the Google Street View Application Programming Interface 4 (API) to collect STV images of each home before its demolition date by providing the address. To use neighboring homes as a control group in our analysis, we established a buffer of fifty meters for the demolished homes, yielding 860 homes that fall within the buffer, which were labeled as “Not Demolition Order” (Not DO). Our approach differed from previous studies that collected Street View images surrounding a location with only four or six compass headings of the camera (Li, Zhang, and Li 2015; Zhang et al. 2018). Instead, we collected Street View images directly targeting the home from three angles (front, left, and right) to avoid any bias during the collection process. Furthermore, we collected the most recent Street View images of the entire universe of existing homes in the selected area of study (about 11,000 homes) to predict their chances of being demolished.
In addition, we collected the Place Pulse 2.0 Dataset 5 to evaluate the physical perception characteristics of each home. Place Pulse is a crowd sourcing effort that maps human perception of cities into six dimensions: safe, lively, wealthy, boring, active, and beautiful, through asking people to click on an image from a pair in response to an evaluative question, such as “which place looks safer?” or “livelier?” (Dubey et al. 2016). The updated data set contains more than 1.5 million perception reports by asking users to select images from a pair, evaluating more than 100,000 images from fifty-six cities.
Machine Evaluation
Given the crowdsourcing street view data for six dimensions of human perceptions, we developed a deep learning model to automate the process of labeling STV images in our study area. The deep learning model architecture and details can be found in Dubey et al. (2016), while the implementation of our model is slightly different, which can be found in Appendix A. The final outcome of this deep learning process is six variables of housing perception scores (one for each dimension) for the treated and control observations of the data. Again, the main objective of this study is to predict the probability of housing decay for existing undemolished homes with readily available data. To achieve this, we used the estimated six dimensions of housing perceptions within the study area as predictors and applied various machine learning models as suggested in the literature (Kumari and Srivastava 2017), including Random Forest, Support Vector Machine, K-Nearest Neighbors, Generalized Linear Model, Logit, and Naïve Bayes. Figure A1 in Appendix B portrays the general machine learning training workflow. Regarding that the number of observations for “Demolition Order” (DO) is much less than the number of observations labeled as “No Demolition Order” (No DO), we used data augmentation, a common machine learning technique that consists in randomly add copies of the subset with less observations, to balance the number of both type of observations (DO and No DO) in the training data set.
We used the receiver operating characteristic (ROC) curve to evaluate the performance of each model. The ROC curve is commonly used to evaluate and compare the predictive capabilities of binary classifiers and the curve plots the true-positive rate against the false-positive rate at various threshold settings (Mandrekar 2010). Based on our evaluation, we found that Random Forest significantly outperforms other models for this classification task (Figure 2). Appendix B describes all methodological details behind the choice of Random Forest as our final model. Hence, we used Random Forest to predict the demolition probability of the 10,697 existing homes whose STVs are available in the study area. However, machine learning models are sensitive to the initial randomized parameters, which may result in minor differences in each prediction result. To address this issue, we bootstrapped the prediction 100 times for all existing homes as used previously in (Baker, Lopez, and Greenlee 2021; Lopez and Greenlee 2016). This allows us to have a distribution of prediction results rather than a single prediction point.
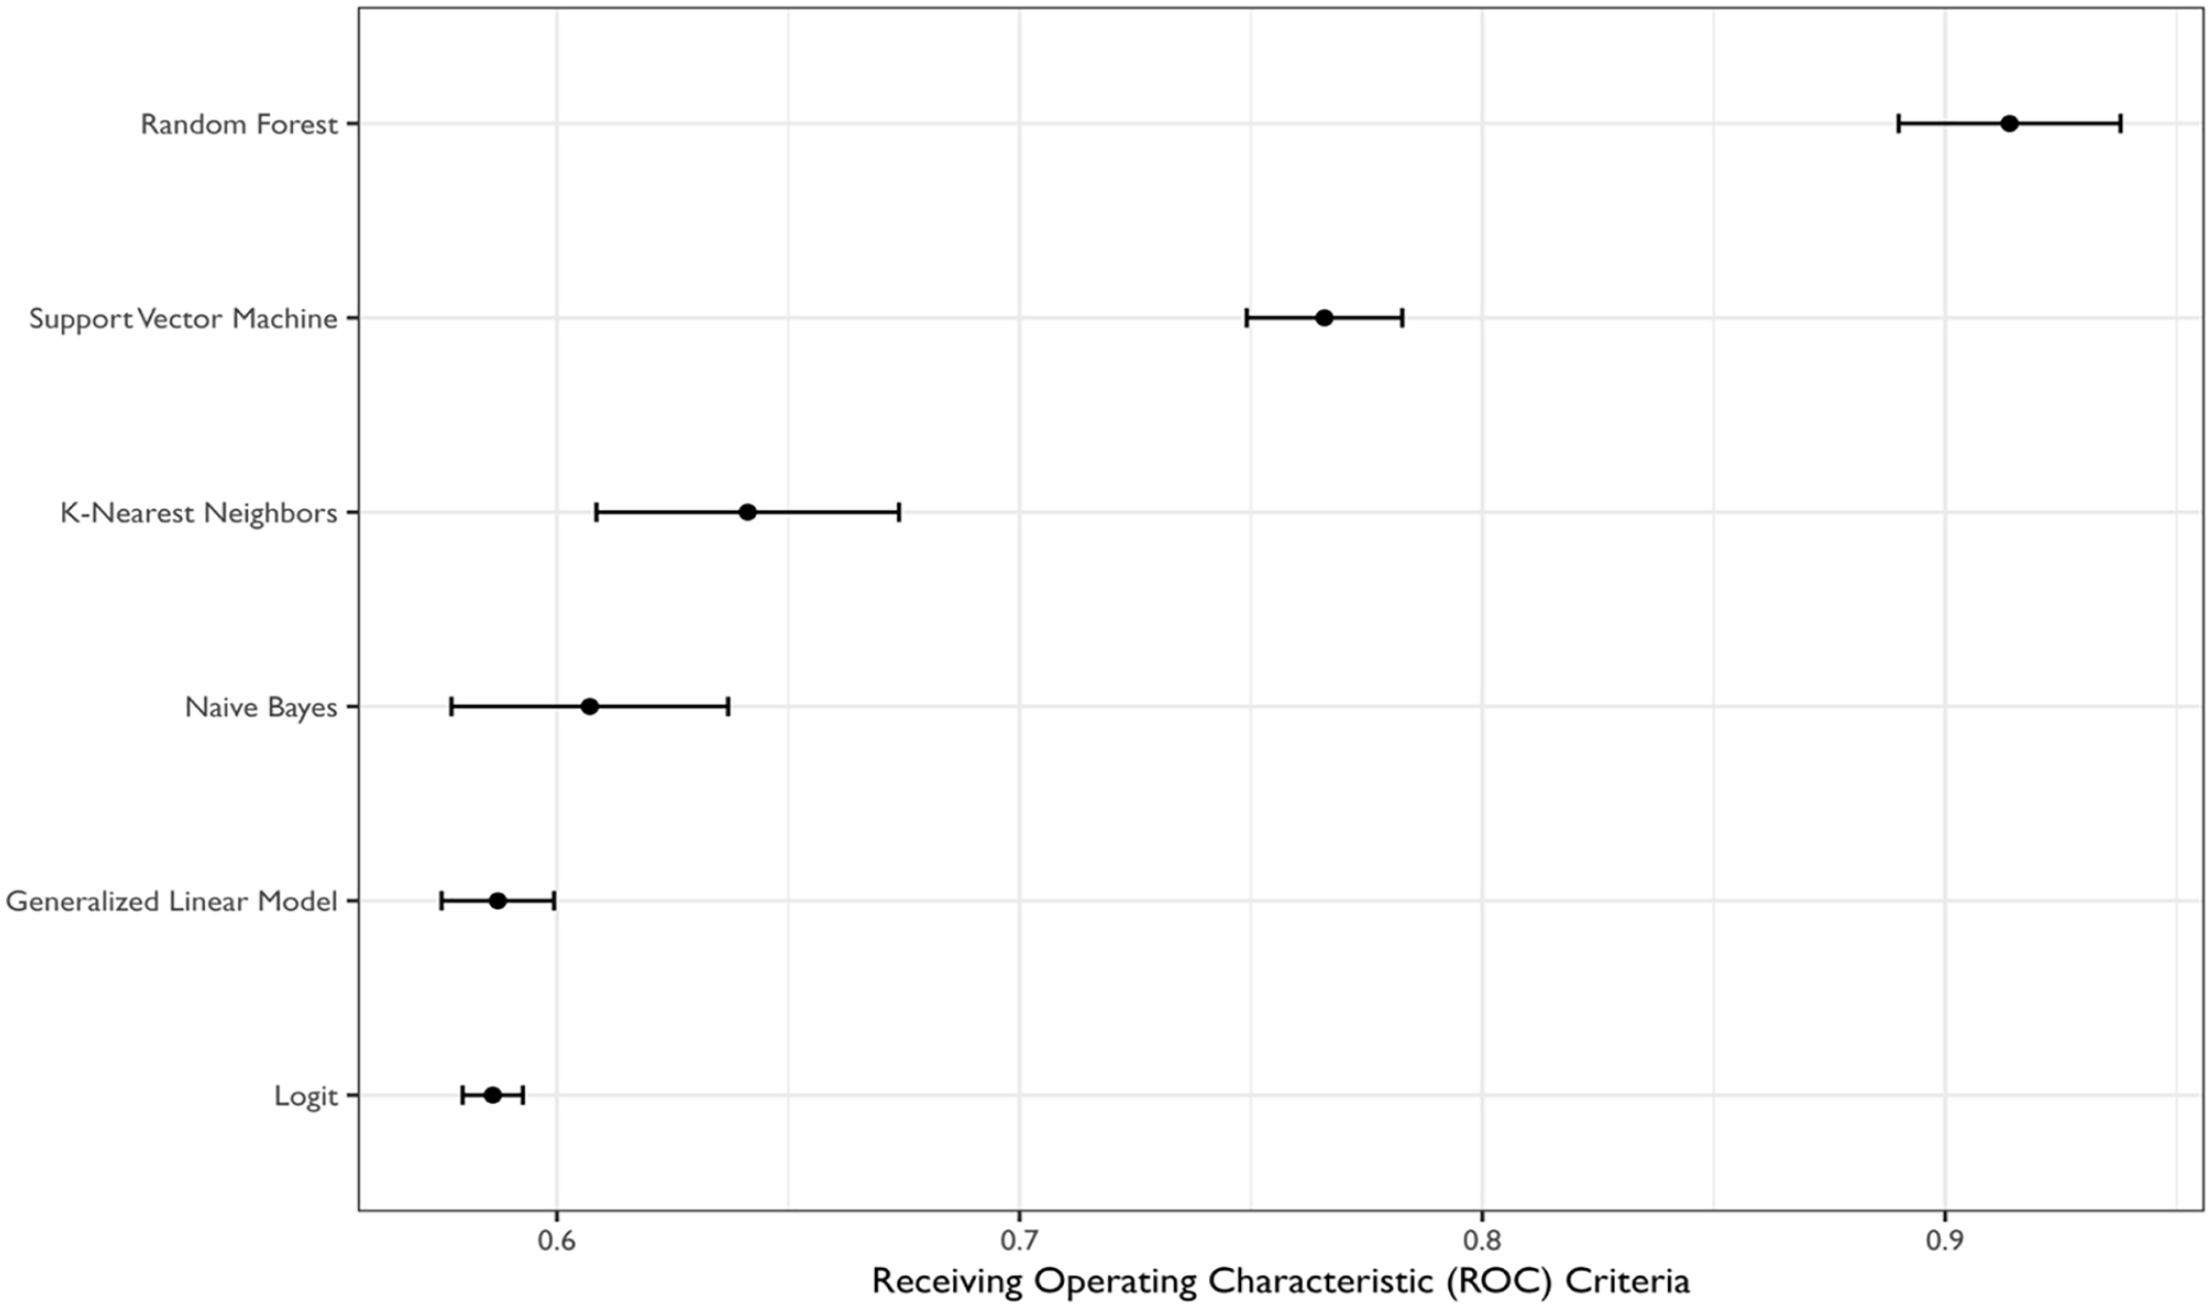
Machine learning model performance.
Human Evaluation
We hired two graduate research assistants as evaluators to manually evaluate all the 934 STV images (treated and control) of the collected properties. Both evaluators were blind to the treated-control distinction; hence, they evaluated the properties without knowing if the house is demolished or not. The two evaluators have distinct educational backgrounds. Evaluator A has a background in Architecture and Historical Preservation, while Evaluator B has a background in Urban Planning and Real Estate Development. The evaluators were asked to first answer if the house showed clear signs of housing decay (yes or no), and to grade their perceptions on the images being associated to the same dimensions of the Place Pulse 2.0 data set (i.e., safe, lively, wealthy, boring, depressing, and beautiful) with four options: “Agree,” “Neutral,” “Disagree,” and “Cannot Tell.”
It is important to note that our research did not aim to establish the ground truth of demolition based solely on human evaluations. The decision-making process related to demolition is heavily influenced by code enforcement, which is ultimately determined by human judgment. Our primary objective was not to determine the absolute truth of demolition, but rather to highlight potential biases in this decision-making process. We sought to demonstrate that human perceptions derived from STV data can serve as a viable approximation of city officials’ decision-making. Hence, both evaluators conducted their grading based on a rubric constructed based on the criteria outlined in the 2018 San Antonio Property Maintenance Code, which is the same code ordinance that code enforcement officials from the Development Services Department of the City of San Antonio are expected to use when they do their evaluations. Figure 3 shows the web application we constructed using the Shiny web application framework within the R Statistical software (Chang et al. 2024), and external evaluators used to grade the treated and control data set. Shiny applications can be easily constructed using R and RStudio code providing users a friendly web interface (also called a user interface, see Figure 3) but that runs more complex R code tasks in the background also called a server). In a nutshell, our Shiny Application was designed for collecting the responses of evaluators in an organized fashion as we wanted to provide evaluators with a random order of images and avoid having evaluators rating images more than once. As such, evaluators will rate the images collected from street view answering the Shiny survey-style application. After answering all questions for a particular home, evaluators will click on the “Next house” button and the Shiny Application will randomly assign another house for their rating from the remaining homes.
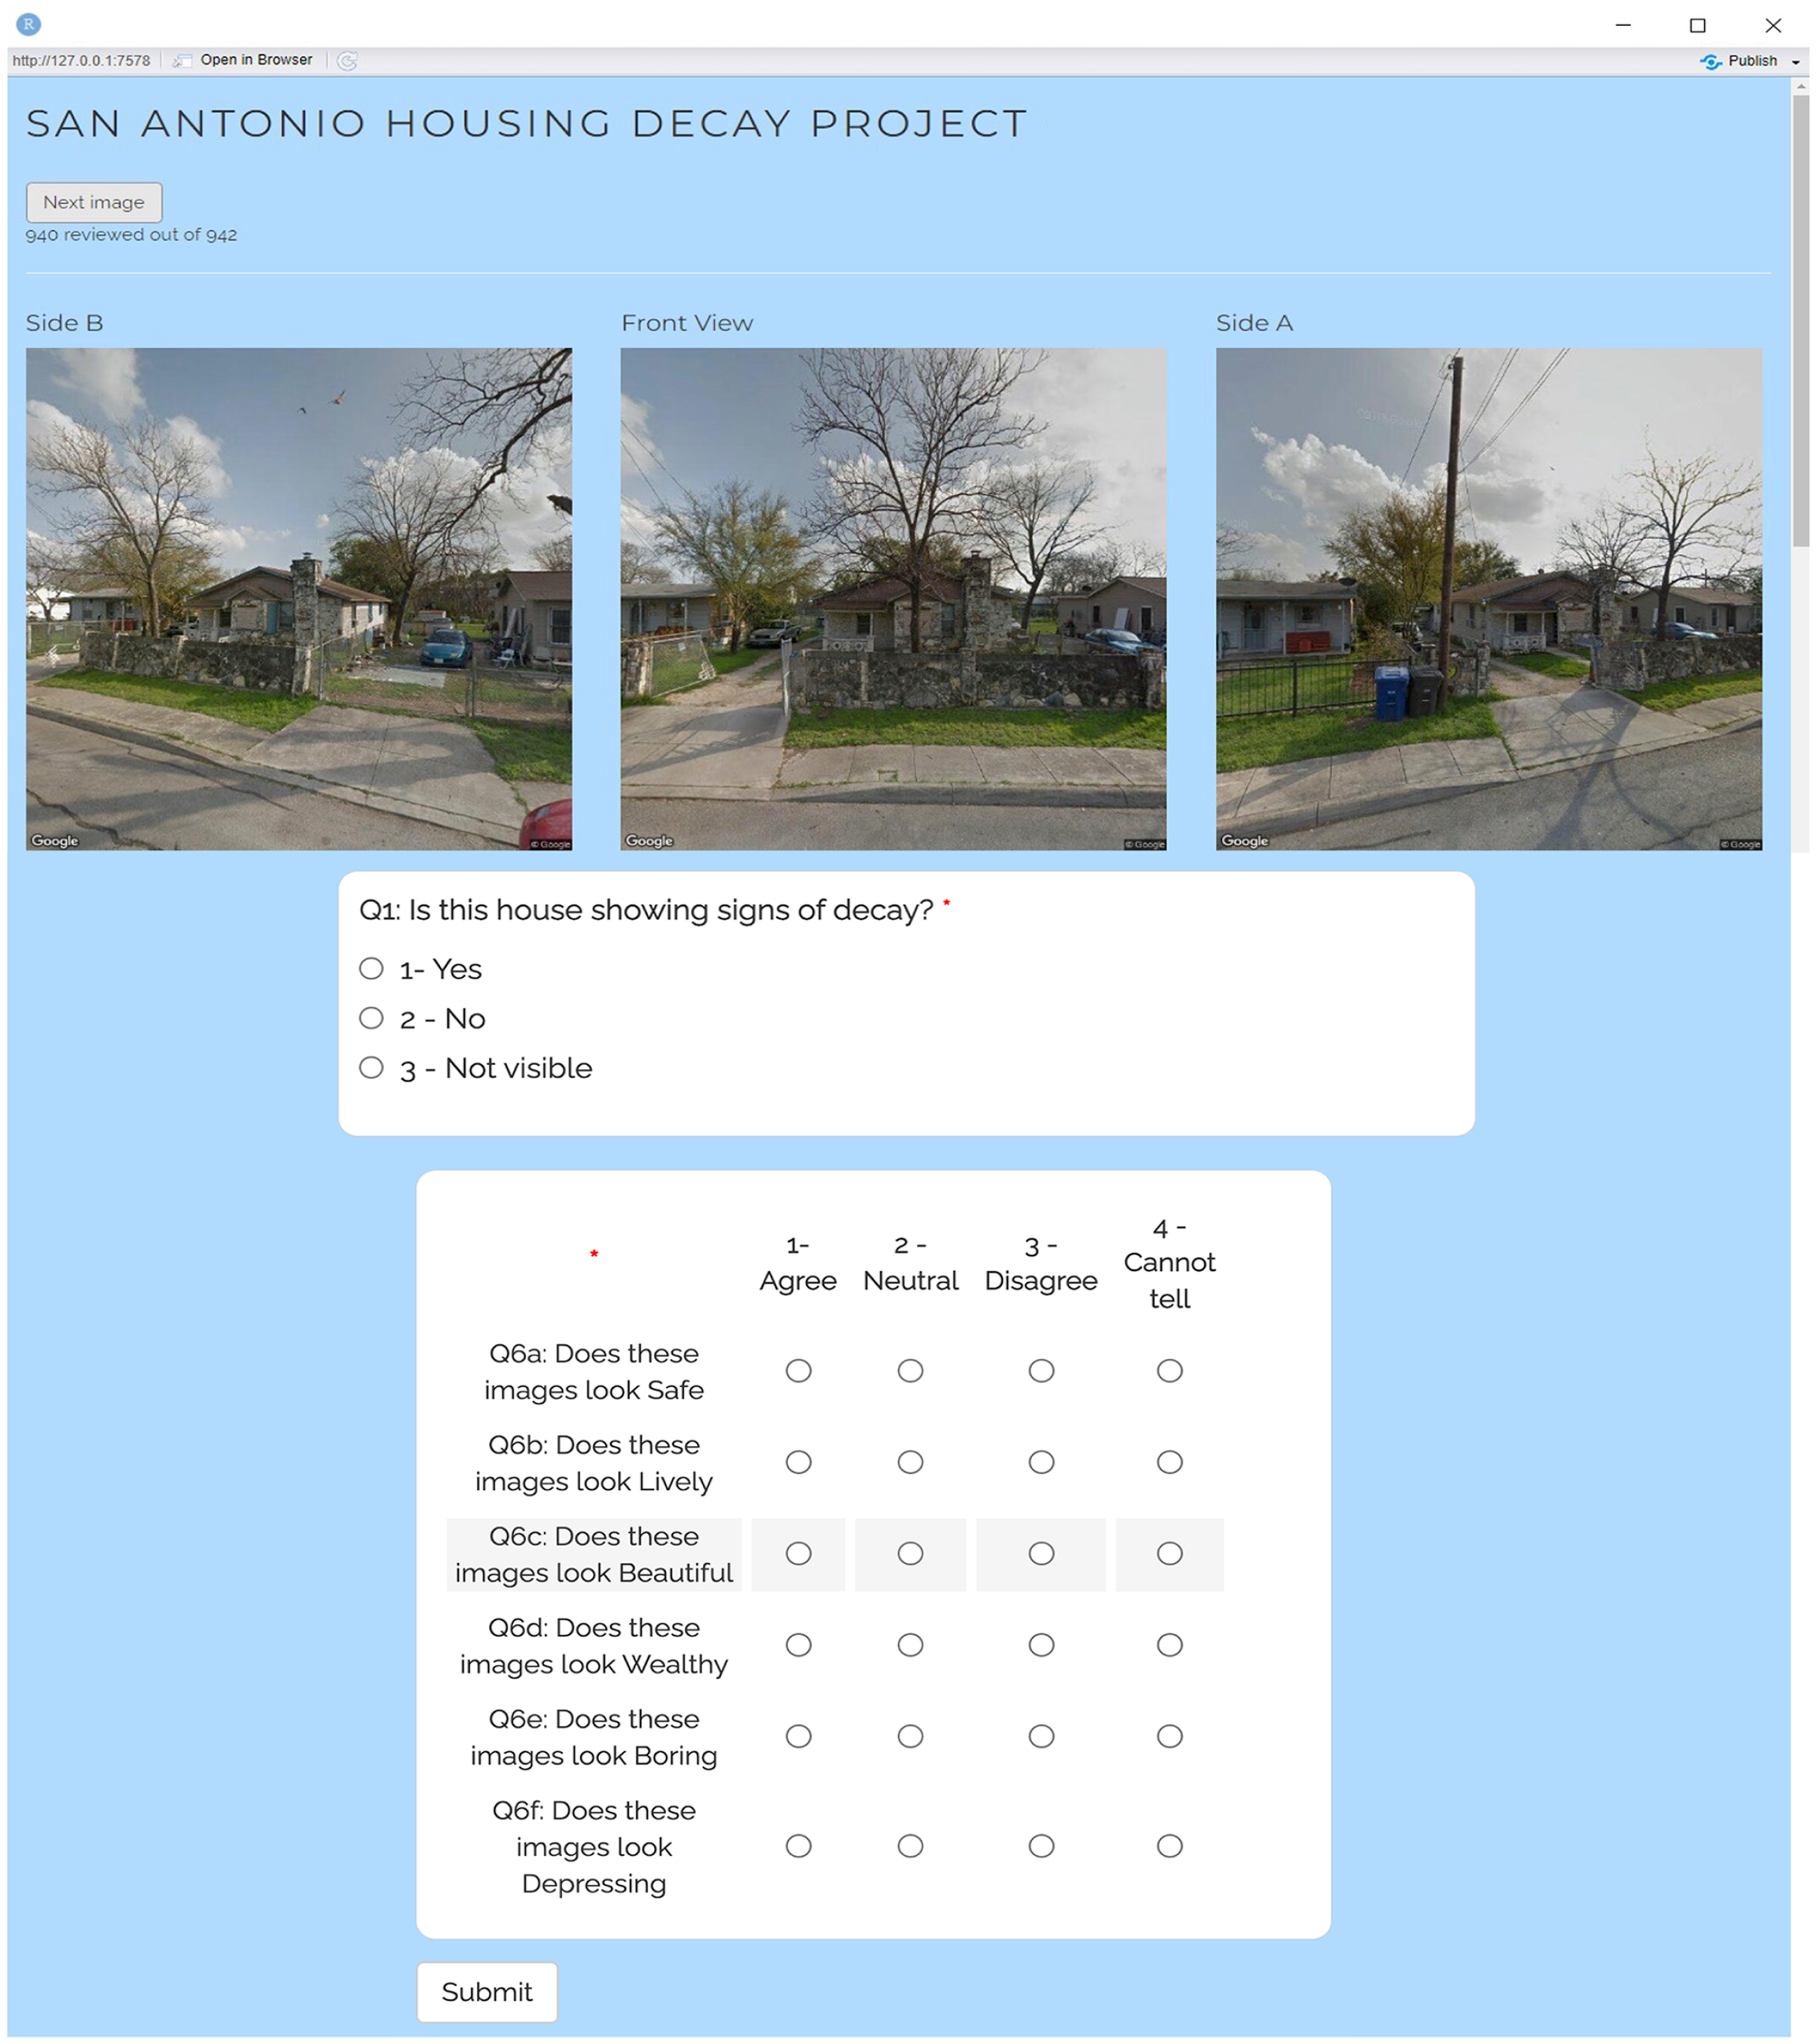
R Shiny app for human evaluation.
Results
Human Perception of Homes
As discussed before, the main goal of using deep learning was to estimate a score for each of the six dimensions in the Place Pulse 2.0 data set (Dubey et al. 2016). Our results indicated an accuracy level that is similar to that shown in previous papers. Figure 4 shows an example of the images collected (left) and their estimated scores (right). The top row images correspond to a treated house, the middle and lower images are control houses. As can be seen, Street Scores for the six dimensions for each image are consistent with human perceptions.
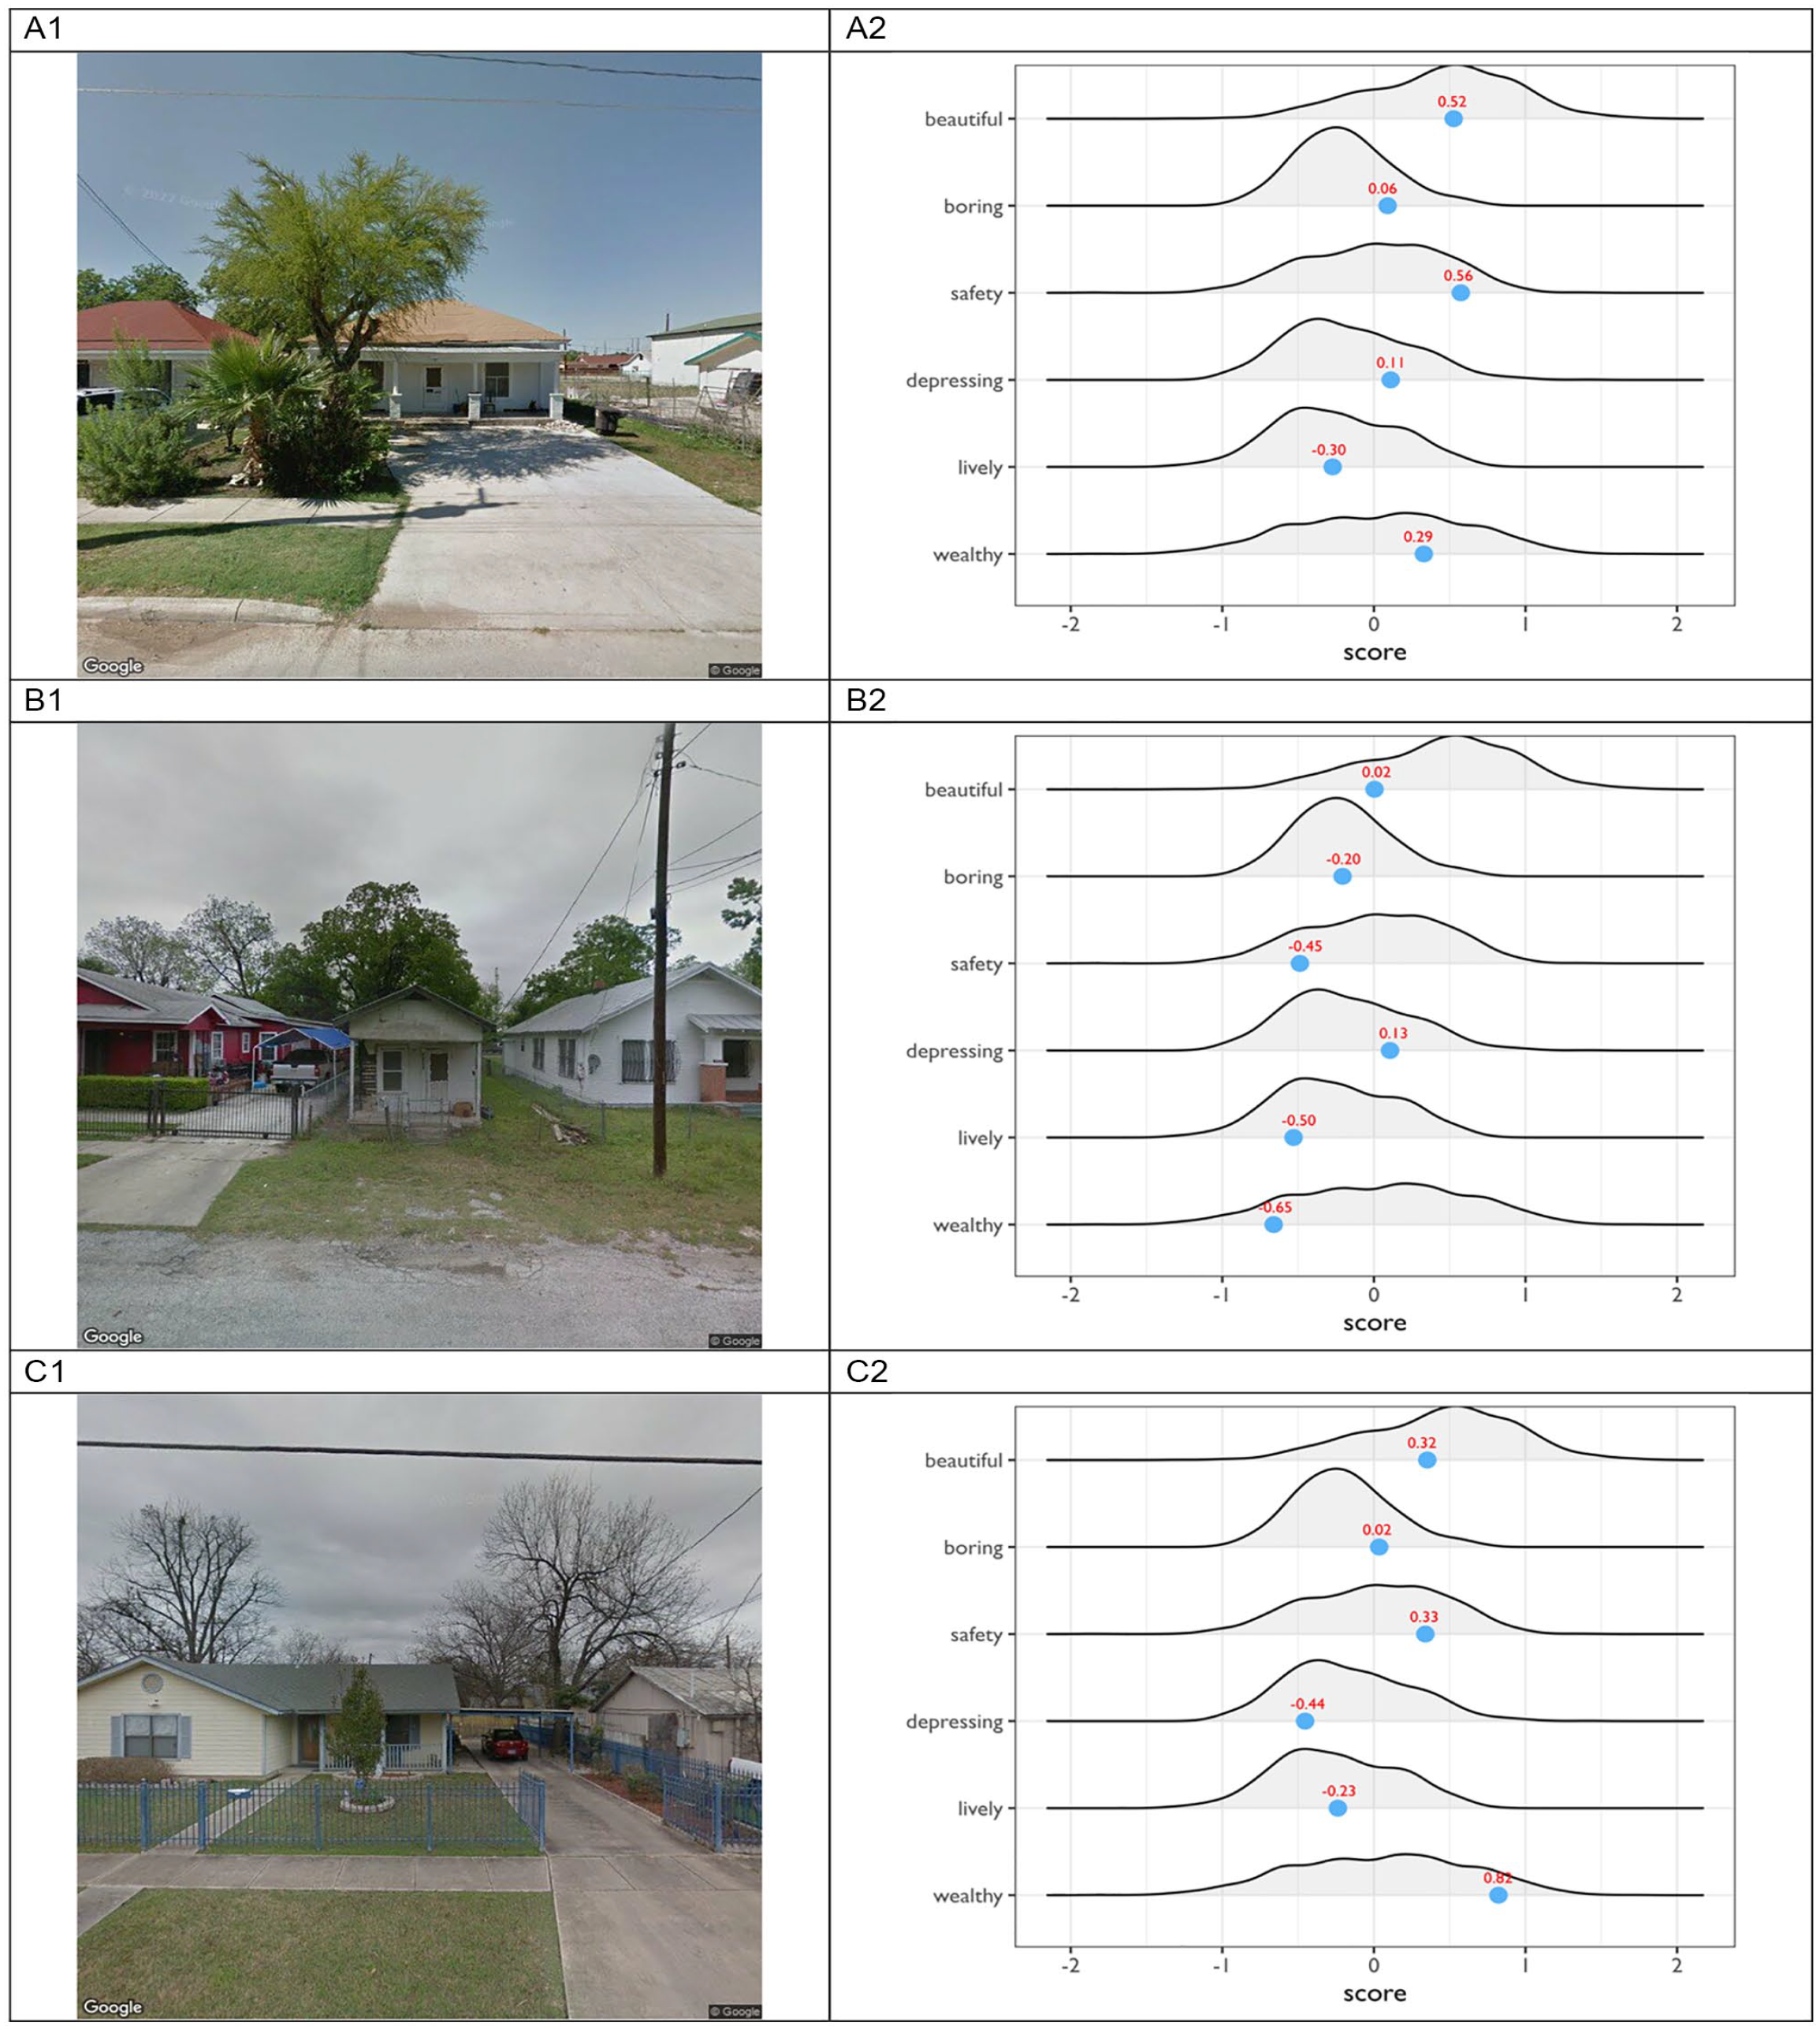
Examples of STV images and their street scores: (A1) Treated house STV, (A2) Treated house street score, (B1) control house STV, (B2) Control house street score, (C1) Control house STV, (C2) Control street score.
When presenting these images to various human audiences including community residents, there is a consistent tendency to perceive that the house depicted in the middle row image (panel b) should have been the one designated for a demolition order. Some more experienced in housing decay evaluation correctly guessed the top image was the treated house. None suggested the lower row image could be treated. The perception gathered in the in-person presentation of this research is not presented here as a validation strategy, but as anecdotal evidence of the impact of these estimations on community and academic participants.
Baseline Results: CoSA as a Reference
Our first set of predictive results are based on the City of San Antonio (CoSA) evaluation of residences as presented by the Ousted report (Way, Judd, and Willis 2021). As discussed before, there are eighty-two residences that received a demolition order by the city between 2015 and 2020. Our single prediction based on CoSA’s evaluation shows that another 136 units are at risk of receiving a demolition order whereas 10,561 other units are not predicted to receive a demolition order. Figure 5A presents the spatial distribution of this prediction. As can be seen, there is no apparent clustering of prediction in one single area of census tracts. However, it is interesting to note that some of these predicted demolition orders are taking place along main streets in the neighborhoods.
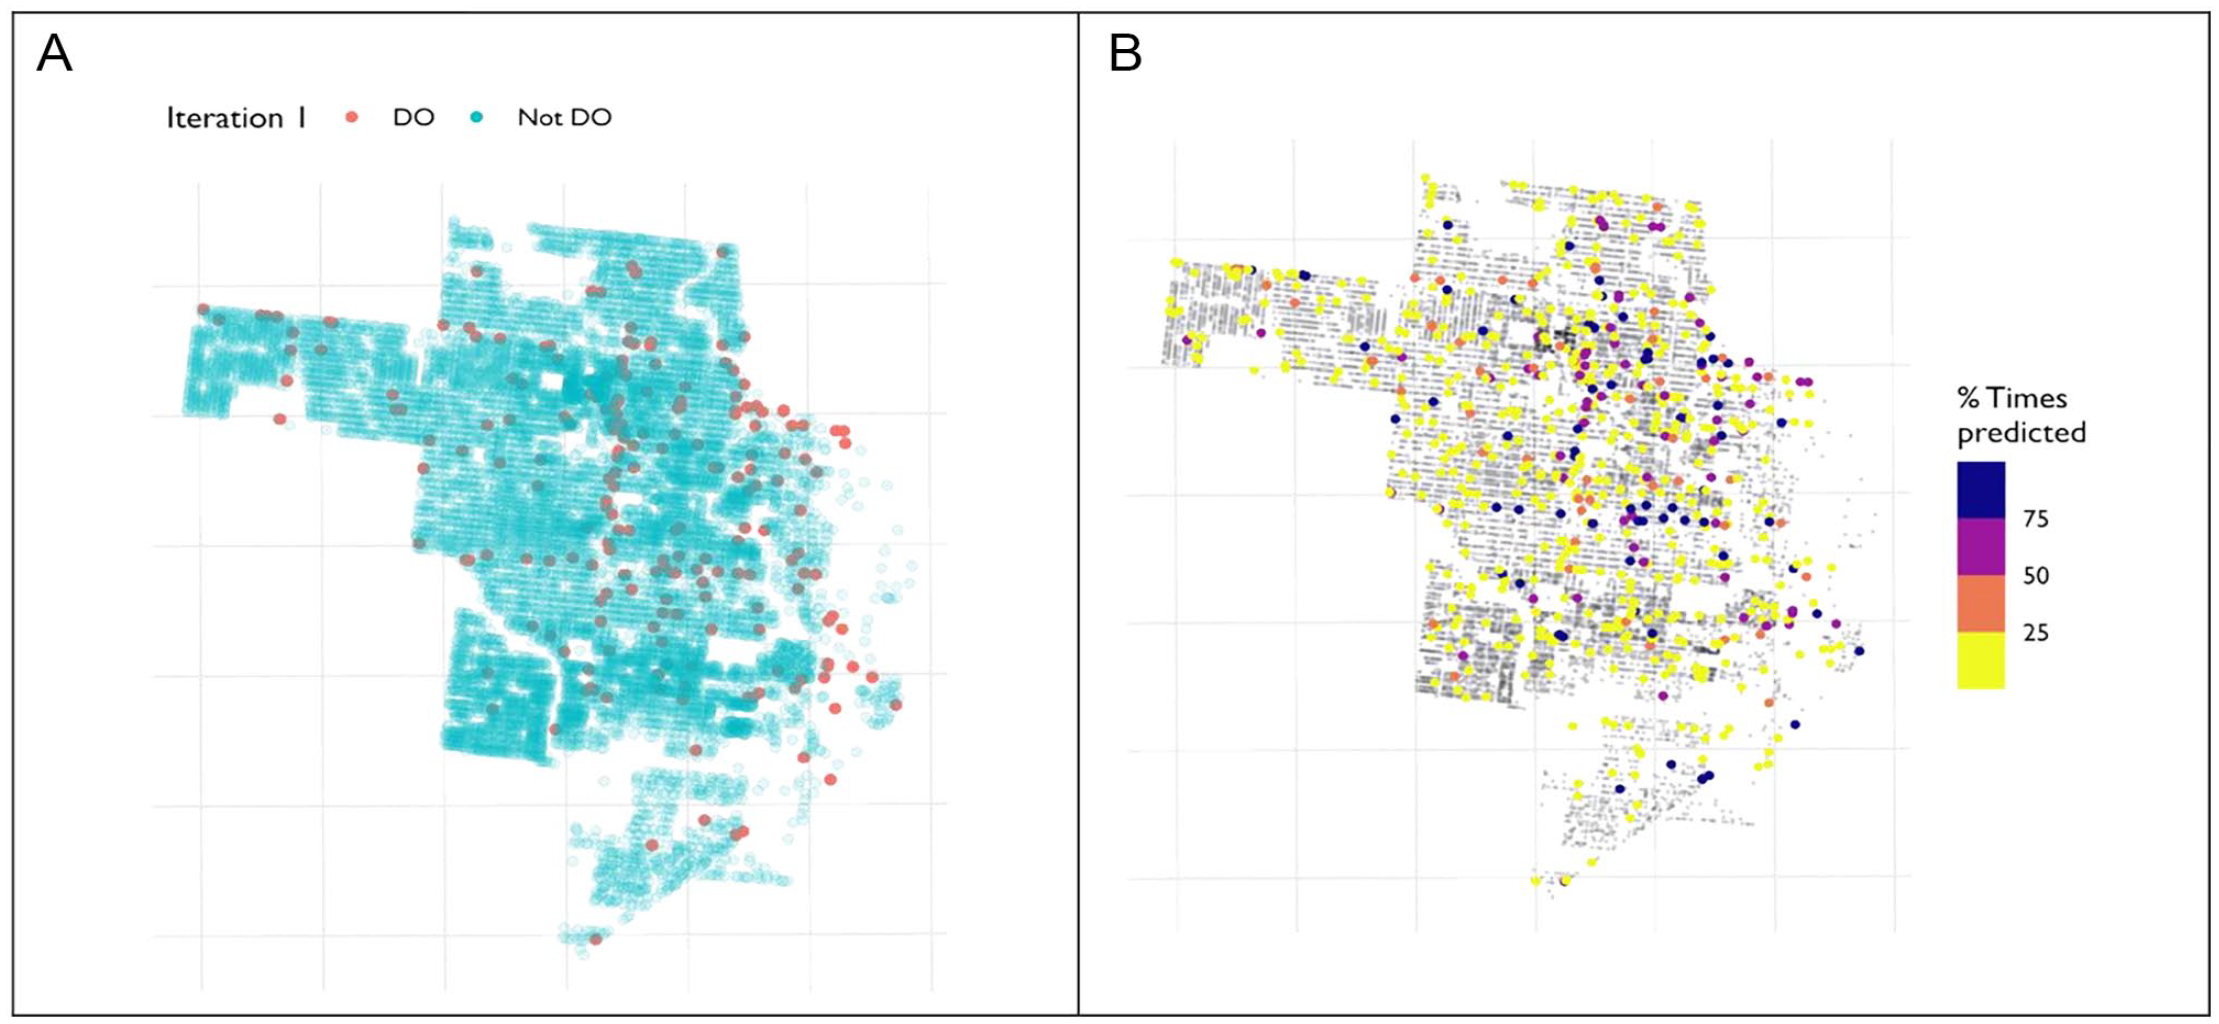
Prediction using the City of San Antonio as a reference: (A) Single iteration and (B) With Bootstrapping.
Bootstrap Results with CoSA as a Reference
As mentioned in the methods section, given that the machine learning set up involved random sampling when constructing the train and test sub samples, we bootstrapped the method to provide results that would not depend on the random sampling. Hence, the machine learning prediction was run 100 times, and in each iteration, the prediction of a housing unit is recorded. Figure 5B shows the spatial distribution of prediction when using the CoSA evaluation as reference. Different colors indicate the number of times a housing unit is predicted as having the potential for a demolition order from the 100 bootstrap times. As such, these results could be interpreted as a percentage. For example, the largest points in the map are housing units that are predicted at least seventy-five out of 100 times to have a demolition order in the future, that is, 75%.
As it can be seen, both the spatial distribution and prediction frequency are different from that obtained in the single prediction method. This result validates the value of incorporating bootstrapping methods in this type of research as machine learning prediction can be sensitive at particular random sampling realizations. Hence, bootstrapping allows for higher confidence in the demolition order forecasting as repeated realizations of the predictions can safely rule out any suspicion of the results being a particular (or even “unlucky”) realization of a single random sampling process.
Bootstrap Results with Human Evaluators as a Reference
Figure 6 presents the bootstrap machine learning prediction results when using the external evaluators’ assessment of the images. As is clear, there are marked differences in the frequency of the predictions by each evaluator. It is not surprising that Evaluator A, who has a historic preservation background, will show a lower rate of demolition order predictions. In fact, an analysis of Evaluator A’s responses showed that only forty-nine houses (out of 934) were marked as showing signs of housing decay and were likely to receive a demolition order, which contrasts to the 138 houses marked by Evaluator B. Furthermore, out of the eighty-two houses that CoSA decided should receive a demolition order, Evaluator A marked only twenty as showing signs of housing decay, while Evaluator B marked 40. Therefore, the prediction results discussed earlier reflect the difference in evaluation’s perception.
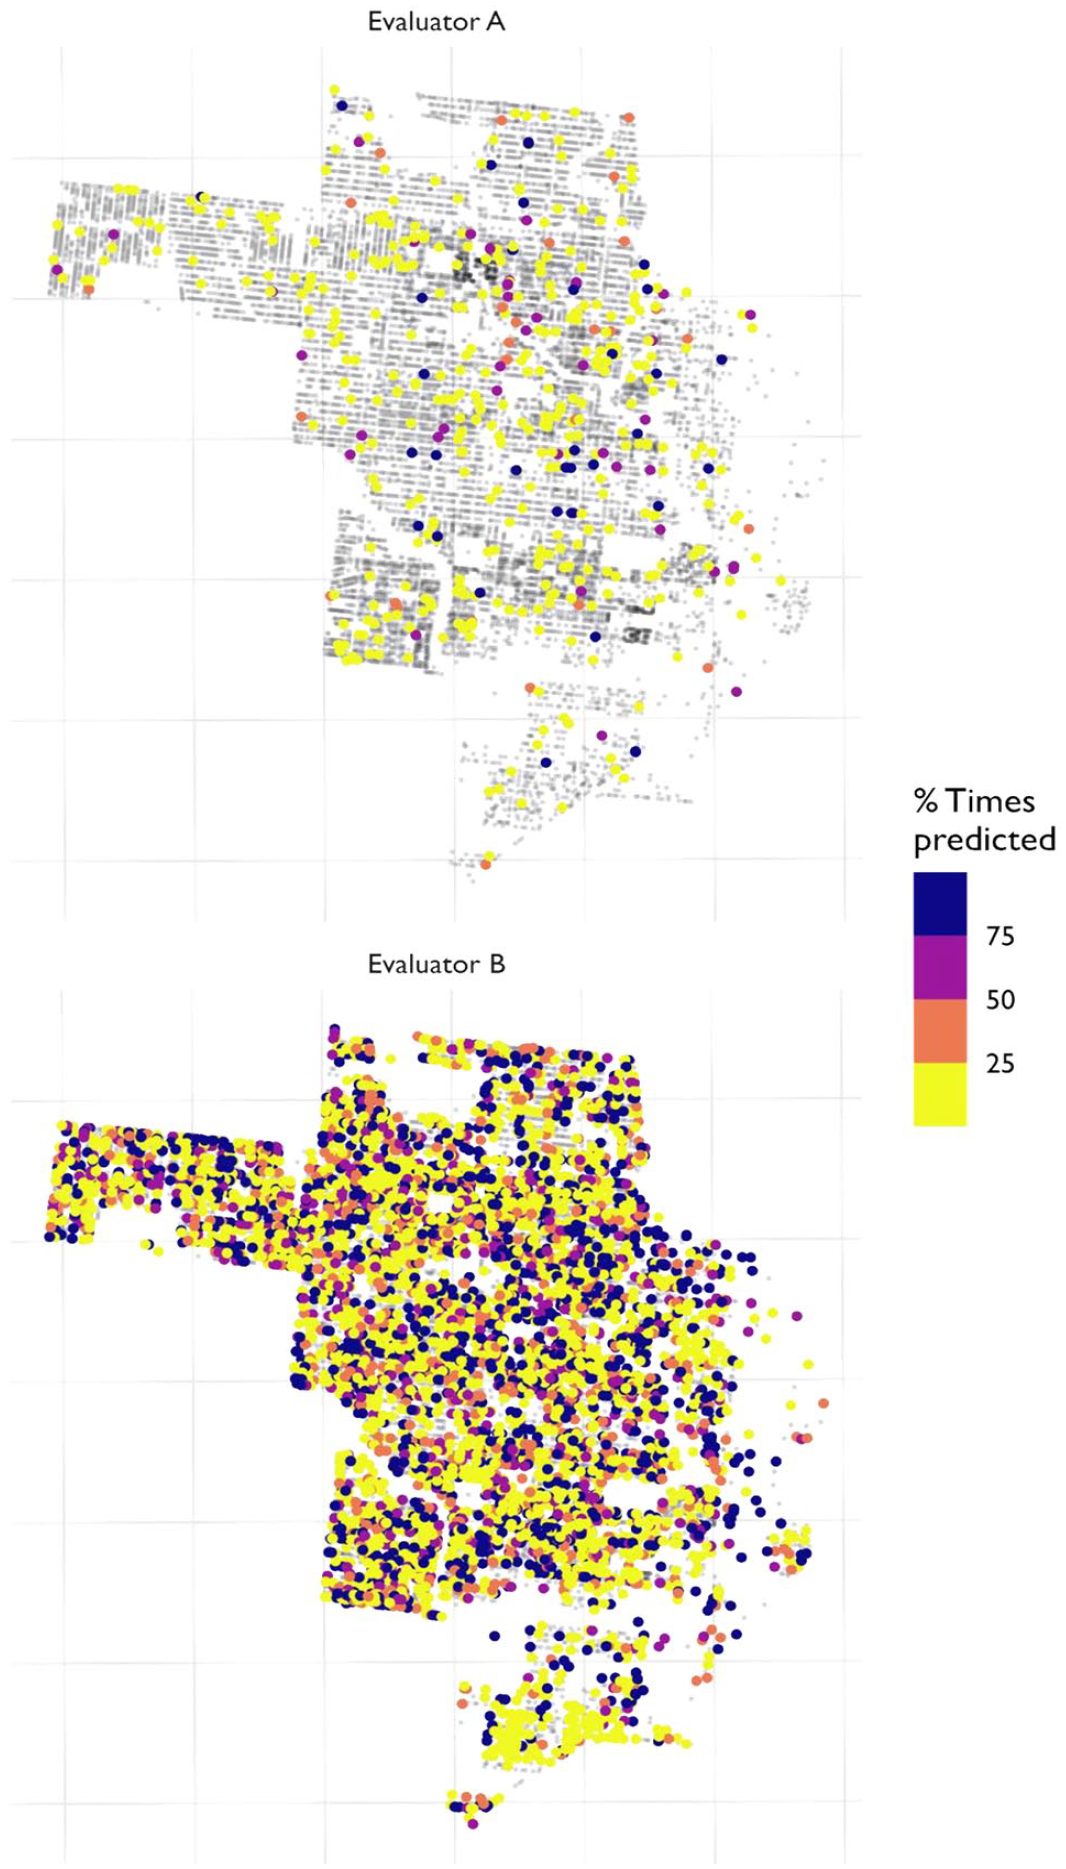
Evaluators’ reference prediction with bootstrapping.
Overall, Figure 7 shows in panel (a), the breakdown of the number of housing units that are predicted (at least once out of the 100 times) to potentially have a demolition order in their future, and the breakdown from those predicted into the specific range of times in panel (b). As mentioned before, Evaluator A is by far the evaluation reference that predicts the lowest number of demolition orders in the neighborhood (282 units), whereas Evaluator B shows an overwhelming number of units as predicted to have a DO (4,675 units). Panel (b) provides an insightful breakdown of the prediction frequency. For example, Evaluator A’s prediction shows only twenty-nine in the upper seventy-five to 100 range of the total 282 housing units predicted to have at least one future DO. Similarly, the CoSA reference shows fifty-three cases in the upper seventy-five to 100 range. However, Evaluator B’s prediction breakdown shows 1,280 in the upper range.
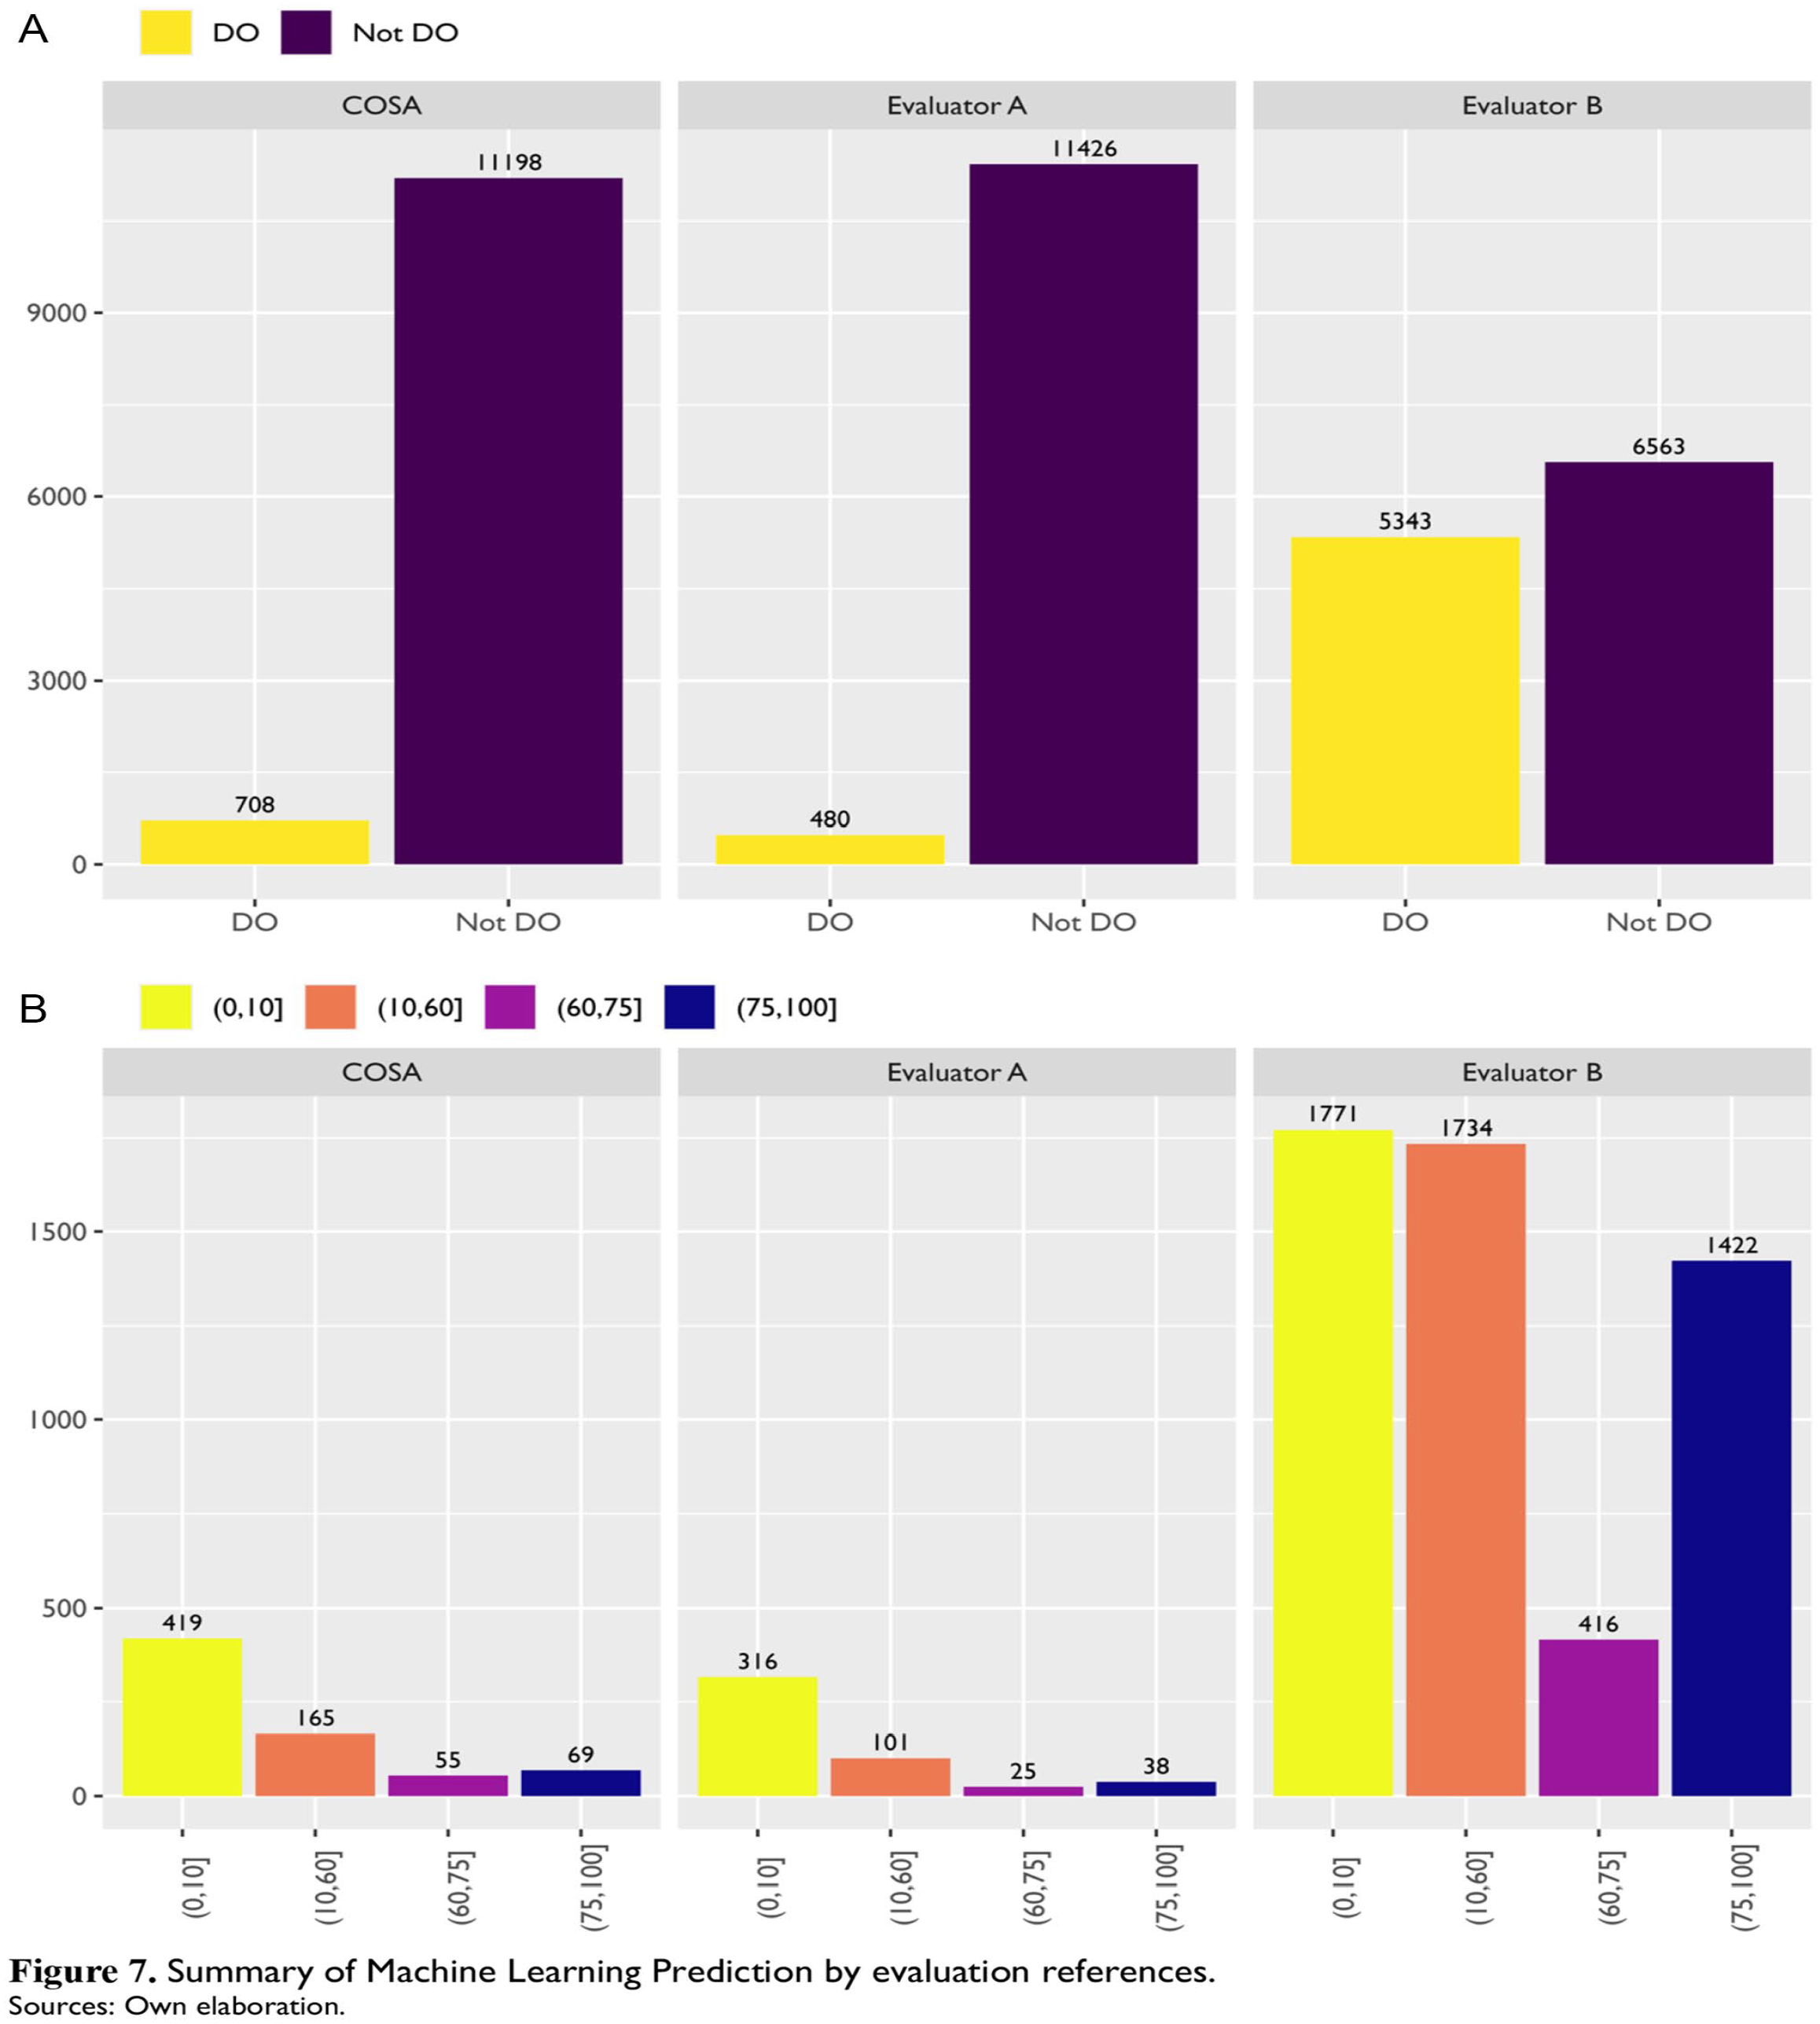
Summary of Machine Learning Prediction by evaluation references: (A) Total Demolition Order (DO) prediction by reference; (B) Demolition Order (DO) prediction breakdown into range of times predicted.
Discussion
This paper presents a method to assess the level of housing decay and the likelihood of demolition orders. Our main goal was to show how this method can be useful to advance housing justice efforts by staying ahead of the curve of housing decay before it becomes beyond savable. Our main results indicate that (1) machine-based evaluation models provide accurate solutions to create predictive models based on our experimental design; (2) our model is capable to provide out-of-sample predictions based only on STV images that capture different evaluation references; and more importantly (3) the number of houses predicted to have a DO are in direct relation to the training background of the evaluator.
We believe our results contribute in several ways. First, from a methodological standpoint, using housing quality perception scores derived from STV images, we introduce a new approach that can proxy housing quality, which is often not considered in traditional studies. Furthermore, we widened urban planning research toolbox by showing how to combine open STV data sets with artificial intelligence methods for predicting housing demolition. In specific, and although there have been other applications of these type of methods for assessing housing decay or other urban challenges (Ilic, Sawada, and Zarzelli 2019; Meyer and Hendricks 2018; Salesses, Schechtner, and Hidalgo 2013; Zhang et al. 2018), to the best of our knowledge this is the first empirical application on the link between housing decay and demolition orders.
Second, and perhaps more importantly, we believe this research could prove quite useful to housing advocates, community leaders and anyone that has as an objective avoiding unnecessary demolition and displacement of low-income communities. By showing that there is a link between the prediction rate for demolition orders and housing quality perceptions, this research suggests that city departments should carefully revise their Standard Operating Procedures as well as their Property Maintenance Codes to minimize potential evaluator biases that could exist among their code enforcement officials as well as any other city staff involved in evaluating future demolition orders. In the particular case of San Antonio, the Development Services Department and their Building Standards Board are particular instances that should carefully revise their parameters for issuing demolition orders. In fact, this research corroborates previous findings from the Ousted report (Way, Judd, and Willis 2021) that reflected and collected the community knowledge on the potential biases and lack of cultural appreciation when demolition orders had been issued in the past.
As discussed in the literature review section, there is evidence of the use of code enforcement for urban renewal purposes in other areas of the country. If San Antonio aims to dismiss all community distrust from the possibility of them engaging in these kind of practices (with or without their own awareness), it is imperative for the city to demonstrate its genuine commitment to social justice and the preservation of its low-income housing stock and communities. To achieve this, dedicated efforts should be directed toward reevaluating the process of conducting demolition orders and, if necessary, retraining or replacing staff members found to exhibit significant bias rates. For example, code enforcement as well as members of the Building Standards Board should participate in training where they rank random STV images from the city, without knowing their location, neighborhood, or any other characteristic. This training would allow them to evaluate their answers and perceptions with true evaluations from architects, engineers, and community members.
Finally, the findings of this research are expected to facilitate the development of strategies and programs aimed at effectively distributing housing repair funds from the city and other institutions. By utilizing the predictions of future demolition orders generated by the research, targeted allocation of resources can be achieved, ensuring that those units most likely to face demolitions receive the necessary support. This approach can enhance the efficiency and effectiveness of housing repair initiatives, ultimately mitigating the need for demolitions and preserving housing stock in the community.
As in any research project, this article is not free of limitations. First, due to budget constraints, this study did not have the resources to acquire STV hardware or invest in a third-party service for higher image resolution. Consequently, the images obtained from the Google Street View service were limited to a resolution of 640 × 640 pixels. Second, it would be useful for future studies to create an image bank of roofs, windows, doors, foundation, walls, and other images of housing characteristics that portray examples of houses in good or poor condition. Third, other variables such as unpaid bills record, title fracture, housing characteristics (year built, materials, years of repairs or improvements, etc.), were not used in this research, but should be considered as a complementary method. Fourth, conducting a more extensive and diverse array of evaluations would enhance the study by introducing a broader spectrum of potential outcomes. This, in turn, would provide a more comprehensive understanding of how various evaluator backgrounds influence the assessment of housing decay. Lastly, analyzing other neighborhoods in San Antonio or other cities, especially higher income neighborhoods would allow comparing the evaluator’s spatial heterogeneity in their housing decay perceptions.
Footnotes
Appendix A
Appendix B
Acknowledgements
The researchers are thankful to the Historic Westside Neighborhood Association, the Esperanza Peace and Justice Center, UT Austin School of Public Law and Texas Housers for sharing their knowledge and information previously collected via freedom of information requests on housing demolition records.
Declaration of Conflicting Interests
The author(s) declared no potential conflicts of interest with respect to the research, authorship, and/or publication of this article.
Funding
The author(s) received no financial support for the research, authorship, and/or publication of this article.