
Abstract
Forsyth County, NC, is the third lowest ranked county in the United States for upward economic mobility. Urban scholars argue that sprawling development is an obstacle. This paper includes a focused analysis of the census tracts in Forsyth County. Using a spatial autoregressive model, we find some evidence that less sprawling tracts have higher rates of upward mobility. We find that tracts with more bus stops and less brownfields have higher rates of upward mobility. Though there are data limitations, findings still offer insights for policies and programs that may help in reversing the county’s low mobility rates.
Introduction
The “American Dream,” which is the belief in the ever-present and enduring upward economic mobility of individuals in America, has given generations hope that things will improve financially in the future with hard work and determination. This ideal is also deeply rooted in the U.S. Declaration of Independence (Ewing et al. 2016). However, studies are questioning whether this dream is true for all Americans (Aaronson and Mazumder 2008; Beyer 2017). Specifically, research highlights the importance of geography and urban form in understanding upward economic mobility (Ewing et al. 2016; Leonhardt 2013).
Research exploring the relationship between geography and economic mobility has found wide variations in a child’s probability of reaching the top quintile of the income distribution, highlighting the importance of place on economic mobility (Chetty et al. 2014). Chetty et al. (2017, 43) state the need for research on the relationship between economic mobility and location at “narrower geographies.” Furthermore, they determine that five factors are strongly correlated with these results: residential segregation, income inequality, school quality, social capital, and family structure (Chetty et al. 2014). Several of these factors have a strong place-based component including residential segregation, income inequality, school quality, and social capital.
In 2016, Ewing et al. (2016) found a relationship between urban form, which is conceptualized as the structure of the built environment, including transportation infrastructure, residential development density, and land-use mixture, and economic mobility. This work concludes that the more compact a geographical area is, the higher upward mobility tends to be. In other words, sprawling built environments are negatively related to upward mobility. Thus, urban form is a critical piece to analyze in regard to the study of economic mobility.
Urban scholars tend to place urban form into two categories: compact development and sprawling development. Compact development was the predominate form of urban development from the inception of cities until the mass adoption of automobiles. Compact development is characterized by high population densities, a mix of land uses, and a grid street system (Ewing and Hamidi 2014). In the United States, a compact form of development was predominant until the mid-1940s, in which urban sprawl became the principal form (Jackson 1987). Sprawling development can be characterized by its reliance on single-use zoning districts, dependence on the automobile, and low-density pattern of development that has all mainly occurred on the outskirts of existing urban areas (Ewing and Hamidi 2014).
Over the last half century, academics, practitioners, and the general public have been concerned with the effects of urban sprawl—the process of creating sprawling development. Scholars discuss the environmental concerns brought about by sprawling development, from air and water pollution, to the loss of prime farmland (Ewing, Pendall, and Chen 2002; Jackson 1987). Indeed, low-density development and decentralization inhibit the full economic utilization of land because of their inefficient/under-utilization of existing infrastructure (Carruthers and Ulfarsson 2003; Ciscel 2001). In regard to social sustainability, the mixed income and mixed-use settlements that were the hallmark of the early twentieth century have given way to homogeneous commercial and residential landscapes that limit social interactions between peoples of different income levels, ethnicities/races, and educational backgrounds (Krause and Reeves 2017).
Understanding the factors that encourage or oppose upward economic mobility, like urban form, is especially relevant in Forsyth County, NC, which is among the worst counties in the United States for upward mobility (Chetty et al. 2014). The county is ranked fifth on the list of counties where the American dream is dead (Frohlich 2019). Moreover, the county has witnessed a 70 percent increase in the percentage of low-income residents living in areas of concentrated poverty since the early 2000s (Kneebone 2014). This county is home to North Carolina’s fifth largest municipality, two Fortune 500 companies, and several distinguished institutions of higher education. Bearing these facts in mind, it is difficult to comprehend how climbing the economic ladder in Forsyth County could be so difficult. Considering these details about Forsyth County and the links between geography, built environmental characteristics, and upward mobility, understanding how urban form has impacted the county’s current predicament is a vital endeavor. In addition, Legacy 2030 (2013) the comprehensive plan for Winston-Salem, Forsyth County explicitly calls for higher densities, and an increase in mixed use and infill development in areas served by municipal services. As a result, these goals provide a ripe arena for exploring efforts to modify the County’s urban form and its potential impacts on mobility rates.
This paper explores the influence of spatial attributes related to urban form on the economic mobility of Forsyth County’s lowest-income residents, at the census tract level. This paper seeks to investigate the following questions: Is urban form related to upward economic mobility at the census tract level? Is there a relationship between certain built environmental characteristics, like brownfields and bus stops, and economic mobility? What can be done to stimulate higher rates of upward mobility, from an urban form perspective? Though our findings are correlational in nature, they can still offer insights into planning decisions surrounding future land-use patterns and the placement of public infrastructure. Furthermore, findings can continue spurring discussions about the relationship between land use and economic mobility.
Literature Review
The relationship between urban form and economic mobility at the metropolitan and county levels has been the focus of several studies (Chetty, Hendren, and Katz 2016; Cohen-Setton 2015; Ewing et al. 2016; O’Brien 2013). Studies find that communities with sprawling development patterns have lower rates of upward mobility compared to more densely populated communities. Chetty et al. (2014) find that a significant predictor of upward economic mobility is the particular place a person is born and raised. Leonhardt (2013) states that “the characteristics of different regions—as opposed to something inherent and unchangeable in the local residents—are helping cause the varying mobility rates.” Therefore, it is critical that urban form is considered when studying the variation in upward mobility across the United States.
In their study of intergenerational income mobility, Chetty et al. (2014) use commute time to work as a proxy for sprawling development patterns, hypothesizing that more sprawling geographies have longer commute times. They report that “areas with less sprawl (shorter commutes) have significantly higher rates of upward mobility” (Chetty et al. 2014, 1611). However, researchers argue that commute time is not a valid proxy for urban sprawl, since some of the most compact places in the country suffer from long commute times (Ewing et al. 2016). To improve this approach, Ewing et al. (2016) used the metropolitan compactness index, instead of commute times, to measure urban sprawl’s impact on mobility.
Ewing et al. (2016) find that the metropolitan compactness index is significantly related to upward mobility. Specifically, they find that the more compact a geographical area is, the higher economic mobility tends to be. They hypothesize that sprawling patterns of development is both directly and indirectly related to upward mobility. Ewing et al. (2016) test several avenues in which urban sprawl may be indirectly related to economic mobility. They argue that the sprawling development patterns of the last seventy years have resulted in the decentralization of jobs and limited mobility for low-income and minority residents left behind in the central city. They find evidence that urban sprawl is indirectly related to upward mobility through its relationship to social capital development, and racial and income segregation. In addition to these indirect avenues, Ewing et al. (2016) find evidence that urban sprawl is directly and negatively related to mobility, which they theorize is driven by job inaccessibility. Nevertheless, it could be argued that job inaccessibility is just another indirect effect of sprawl on economic mobility.
Job inaccessibility or “spatial mismatch” refers to the relationship between workers and employment centers. Spatial mismatch refers to Kain’s (1968) hypothesis that there is a fundamental disconnect between where workers live and where employment is found. He argues that as a result of suburbanization and urban sprawl, low-income minority workers were left behind in cities and could not access jobs in suburbs, which resulted in a “spatial mismatch.” Many studies find that Kain’s work is still relevant (Blumenberg and Manville 2004; Gobillon, Selod, and Zenou 2007; Ihlanfeldt 1994). In fact, a paper by Madjd-Sadjadi and Zeoli (2019) analyzes spatial mismatch in Forsyth County, NC, arguing that the current targeted industry approach will lead to continued low rates of upward mobility. Current development plans are to locate new economic hubs in outlying areas of the county (Madjd-Sadjadi and Zeoli 2019). Hence, sprawling development will continue to limit low-income residents’ access to economic opportunities. Indeed, connecting people to opportunities and each other is a way of promoting social capital growth, which is highly correlated with upward mobility rates.
Declining social capital can be indirectly attributed to sprawling patterns of development, which in turn undermines economic mobility (Leonhardt 2013). Scholars argue that unchecked suburbanization has resulted in a loss of civility, community, and social capital (Putnam 2000). Lower levels of social capital limit relationships and social networks within a community. Studies of social capital have focused on the quality of neighborhood connections and the trust between residents (Freeman 2001; Nguyen 2010). A finding related to urban form and sprawl from these studies is that there is a negative relationship between car usage and social capital (Freeman 2001). Indeed, the auto-dependency of cities has limited the movement of residents without personal automobiles, impeding their ability to access employment opportunities. In addition to making employment hubs difficult to reach for low-income residents, sprawling development inhibits social capital through its promotion of auto-dependency, lowering upward mobility. Moreover, sprawling development contributes to concentrated racial and income segregation.
Sprawling development is associated with higher levels of racial segregation (Jargowsky 2002). Chetty et al. (2014) show that upward economic mobility is negatively related to the share of blacks in a given geography and that whites in areas with large minority populations have lower mobility rates. Racial segregation promotes inequalities and limits exposure to role models, funding for public schools, and access to jobs (Cutler and Glaeser 1997; Massey and Denton 1993; Wilson 2012). In some cases, however, findings surrounding the relationship between urban sprawl and racial segregation are mixed. For example, by controlling for household income and segregation, Kahn (2001) shows that sprawling areas have similar homeownership rates among blacks and whites. Nevertheless, racial segregation is one of the strongest correlates to economic mobility (Chetty et al. 2014). In addition to segregation by race, income segregation is a critical component in understanding upward mobility.
Income segregation, while related to racial segregation, is, nevertheless, experienced by all groups and can be exacerbated by sprawling development patterns (Wheeler 2006). Wheeler (2006) finds that as metropolitan areas spread out, they experience increasing levels of income segregation. Wilson (2012) argues that income segregation impedes upward economic mobility by limiting educational funding, removing successful role models and limiting access to employment in low-income communities. Reardon and Bischoff (2011, 1092) show that “income inequality affects income segregation primarily through its effect on the large-scale spatial segregation of affluence.” Indeed, Chetty et al. (2014) find that income segregation is one of the strongest correlates to economic mobility, while Ewing et al. (2016) find that urban sprawl indirectly effects upward mobility through its promotion of income segregation.
In addition to the impacts discussed above, other factors may be relevant in understanding the relationship between urban form and economic mobility. Brownfields, which are abandoned and environmentally contaminated industrial sites, may offer insights into the urban form of an area (De Sousa 2004; Yount 2003). Brownfields are often found in older, denser, more connected urban cores, which have not been influenced by urban sprawl and are associated with more traditional urban forms (Tiesdell 2008). As a result, the presence of brownfields may reveal a unique potential for redevelopment, which can promote economic mobility as a result of its location within the city and nearby public and private infrastructures (McCarthy 2002). Brownfields may deter un-incentivized private investments nearby, limiting economic activity and restricting opportunities from emerging there. Hence, brownfields may undermine upward mobility, especially among low-income residents who are more likely to live nearby.
The relationship between transportation and urban form has evolved over the last 100 years. Walking and streetcars have been replaced by private automobiles and buses, which has in turn influenced the urban form of cities (Muller 1995). Public transportation, specifically bus stops, is a crucial infrastructural need for low-income populations with low automobile ownership rates in sprawling urban areas (Glaeser, Kahn, and Rappaport 2008). Bus stops tend to be located in areas of higher density, with more transportation infrastructure and a mix of uses (Johnson 2003). The more bus stops, the more likely the urban form is conducive to opportunities associated with the upward economic mobility of low-income persons. For example, the greater the number of bus stops in an area, the easier it is for low-income persons, who typically rely on public transit systems, to reach economic centers and employment opportunities. Hence, the number of transit stops may be positively related to mobility rates.
The relationships with sprawling development would not be possible without the institutions that shape the built environment (Duany, Plater-Zyberk, and Speck 2001). County and local governments adopt local land-use plans, zoning ordinances, and subdivision regulations that influence the built environment. These documents specify where certain land uses can be built, the densities and sizes of buildings, and the road networks, which all influence social capital, racial segregation, income segregation, and the development of employment centers (Brueckner 2000). Government institutions are also responsible for the placement and funding of public infrastructure, such as schools, parks, and roads. Furthermore, the private sector contributes to the built environment. Financial institutions and development agencies finance projects that contribute to urban sprawl (Jackson 1987; Rothstein 2017).
Case Study: Forsyth County, NC
Forsyth County is located in the Piedmont Region of Central North Carolina and includes the City of Winston-Salem (see Figure 1). Table 1 provides a brief comparison between Forsyth County and the overall United States along several socioeconomic variables. Winston-Salem, which is the county seat and largest municipality, has a population of approximately 246,000. The county is part of the Piedmont Triad Region, which consists of eleven counties and a combined population of more than 1.6 million residents. According to some measures of upward mobility, Forsyth is third worst in the United States out of over 3,000 counties, with the two others being American Indian reservations (Chetty et al. 2014).
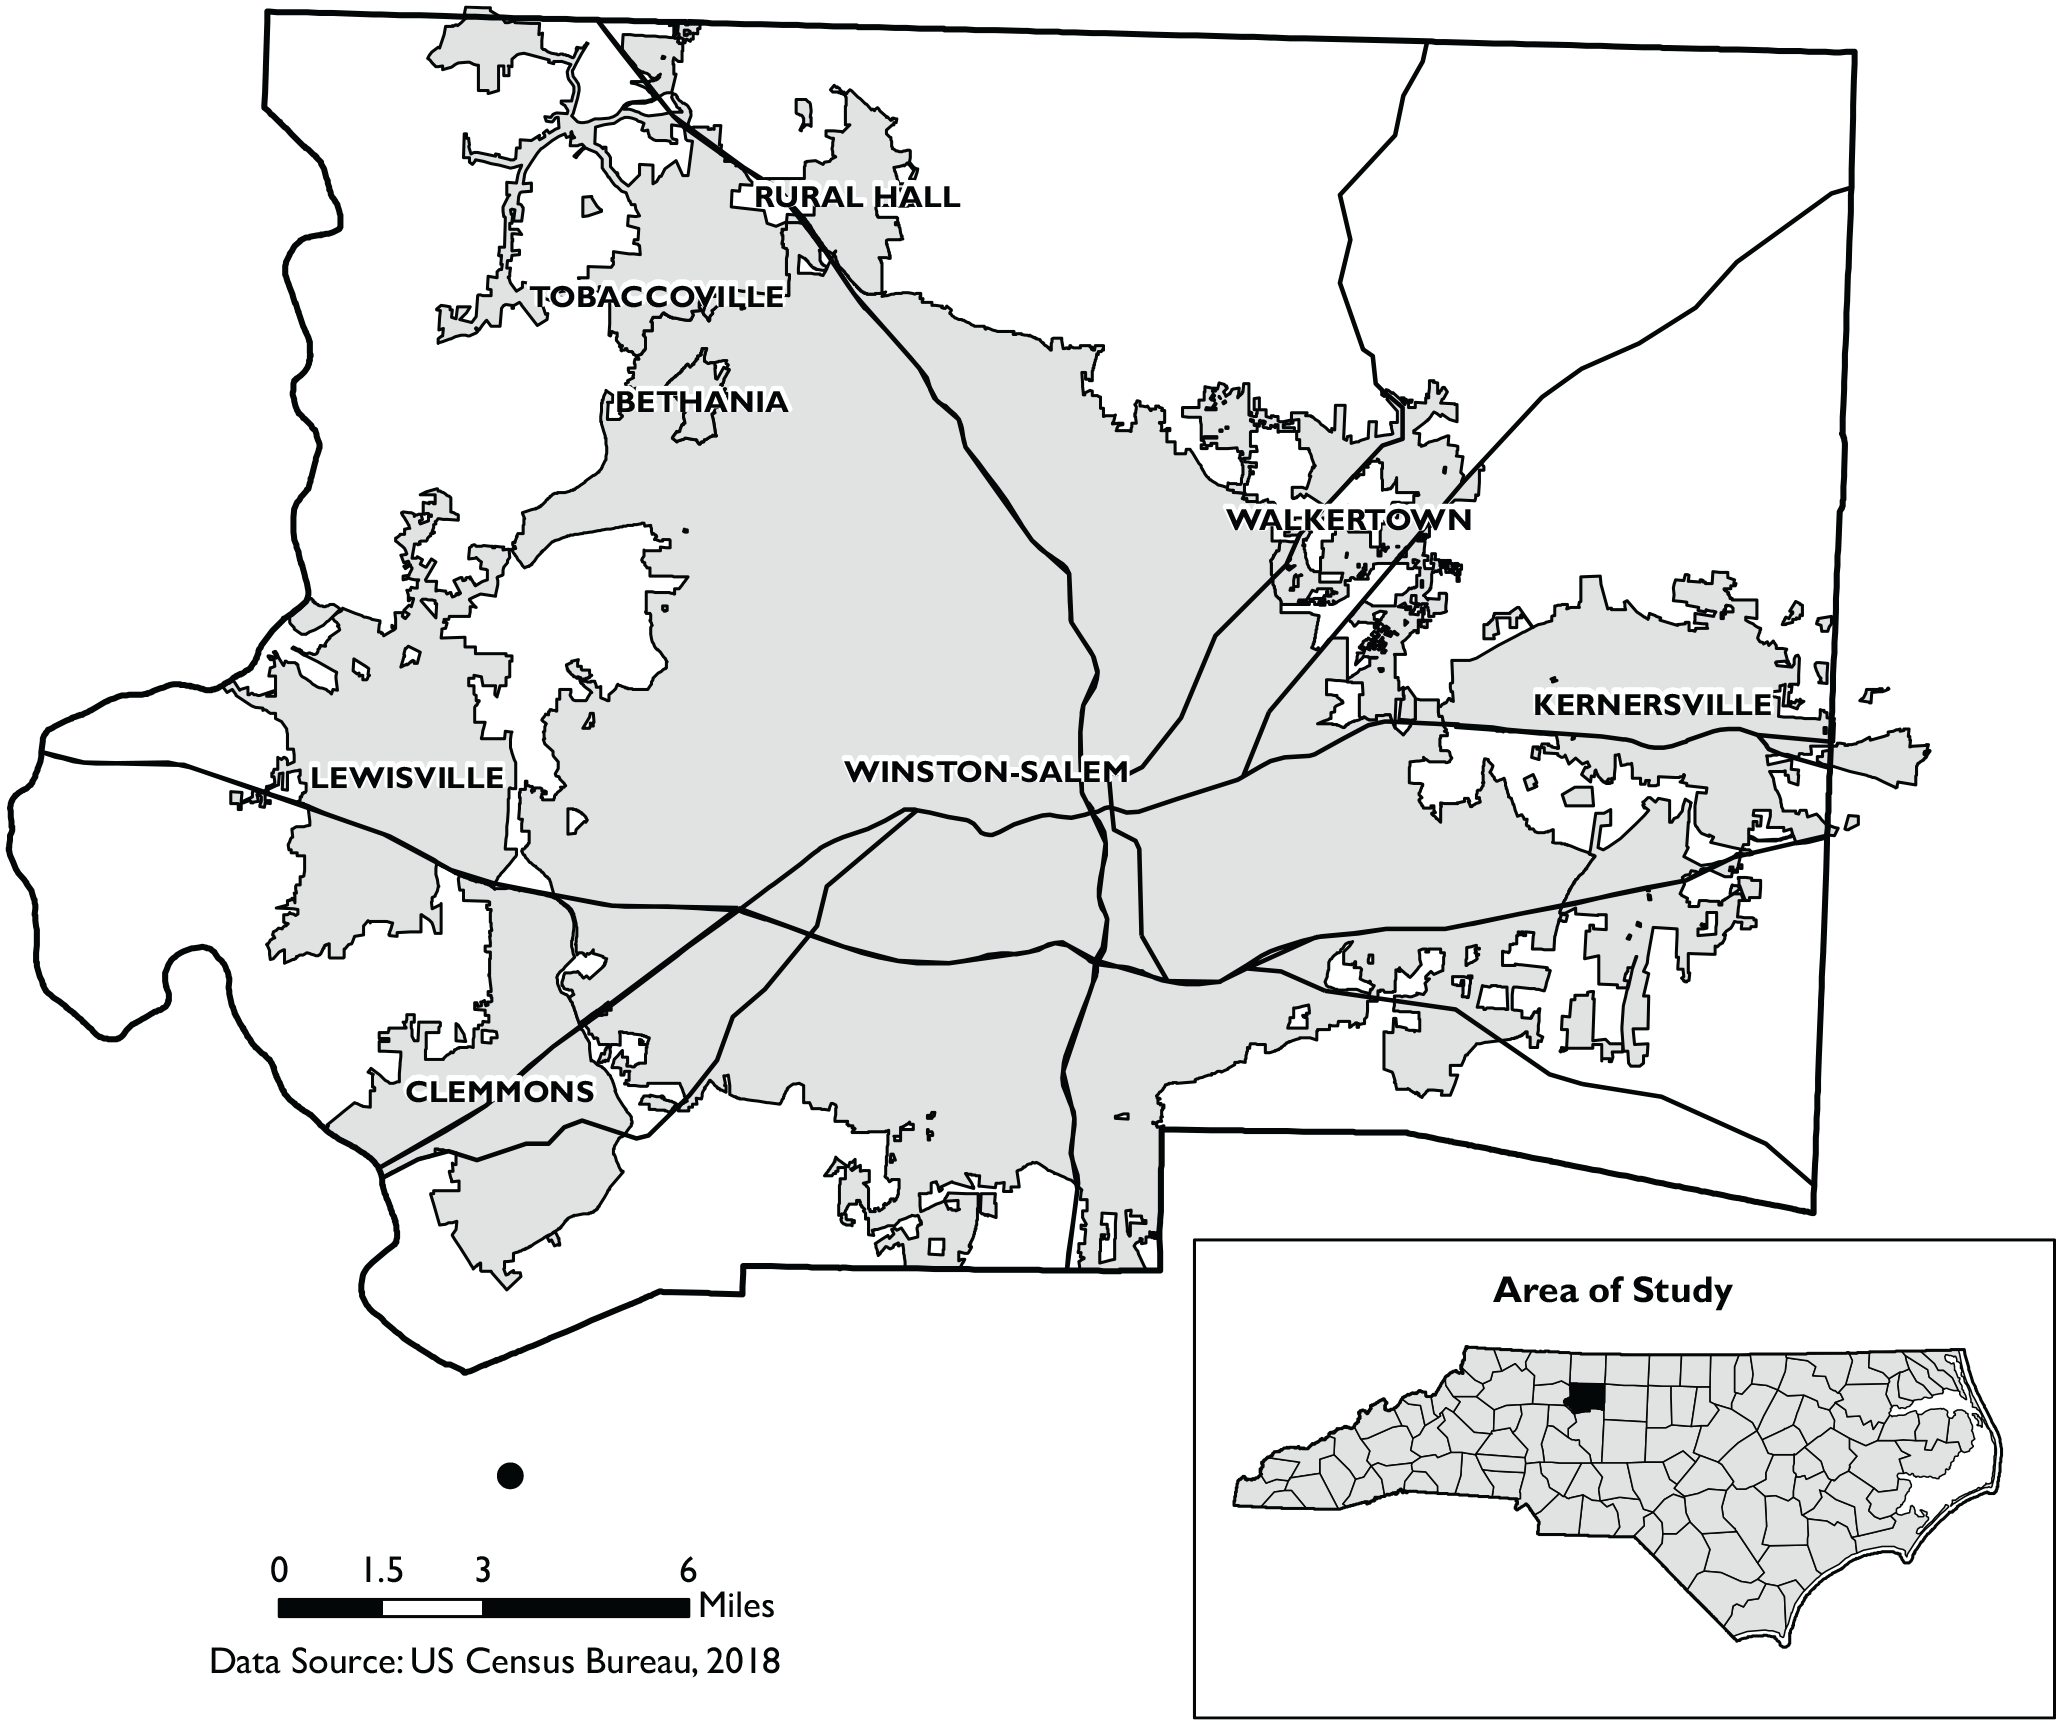
General location map of Forsyth County, NC.
Comparison of Select Demographic and Socio-Economic Characteristics of Forsyth County, NC and the United States.
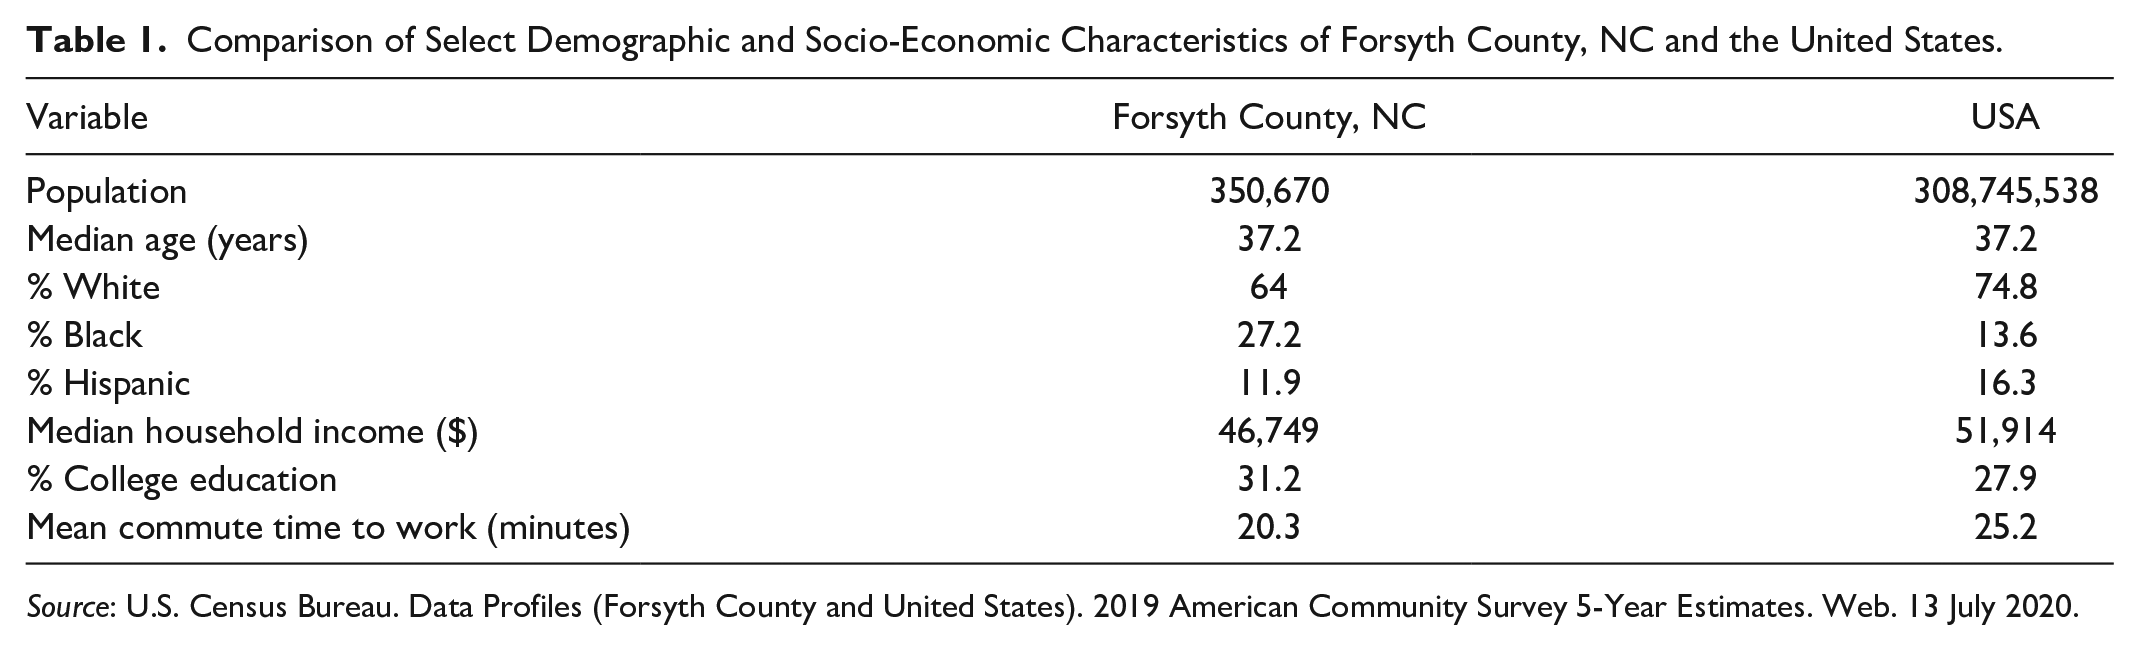
Source: U.S. Census Bureau. Data Profiles (Forsyth County and United States). 2019 American Community Survey 5-Year Estimates. Web. 13 July 2020.
The County’s urban and economic landscapes have experienced profound changes. Beginning as a rural and agricultural society, the county transitioned to a manufacturing economy in the late nineteenth and early twentieth centuries (Tursi 1994). This brought with it a more urban development pattern and an influx of black workers. These laborers found employment in the growing tobacco industry, led by RJ Reynolds Tobacco, and textile industry, led by Hanesbrands (Korstad 2003). Following WWII, Forsyth County experienced several decades of suburban development, which resulted in the relocation of large populations out of the city center and the development of alternative commercial and industrial sites on the urban fringe (Norby et al. 2009). However, the preeminence of manufacturing and booming suburbs would soon end (Tursi, White, and McQuilkin 2000).
Since the early 2000s, Forsyth County has experienced another economic transition, from manufacturing to the service and information economy (Tursi, White, and McQuilkin 2000). This transition stimulated the post-war suburban development pattern, further developing rural landscapes into a mix of single use residential, commercial, and industrial sites (City of Winston-Salem, Legacy Plan 2030). New employers are focusing on biotechnology, education, and health care. They are renovating and locating in vacant textile and tobacco factories and are attracting residents with advanced degrees to the community. Downtown Winston-Salem is experiencing a renaissance, with new apartments, offices, and restaurants occupying once vacant industrial and commercial buildings (Norby et al. 2009).
Research Methods, Data, and Limitations
A regression analysis is performed to examine the relationship between urban form and economic mobility. A group of variables was selected from a review of the literature on economic mobility. Economic mobility is measured with Chetty et al.’s (2014) estimated probabilities of upward mobility (see Figure 2). Chetty et al. (2014) provide these and other statistics in the hopes that researchers will use them to shed light on local variations in economic mobility. The mobility statistics are acquired from their Opportunity Insights databases. Estimated probabilities of upward mobility are calculated at various geographic levels, such as the county and census tract levels.
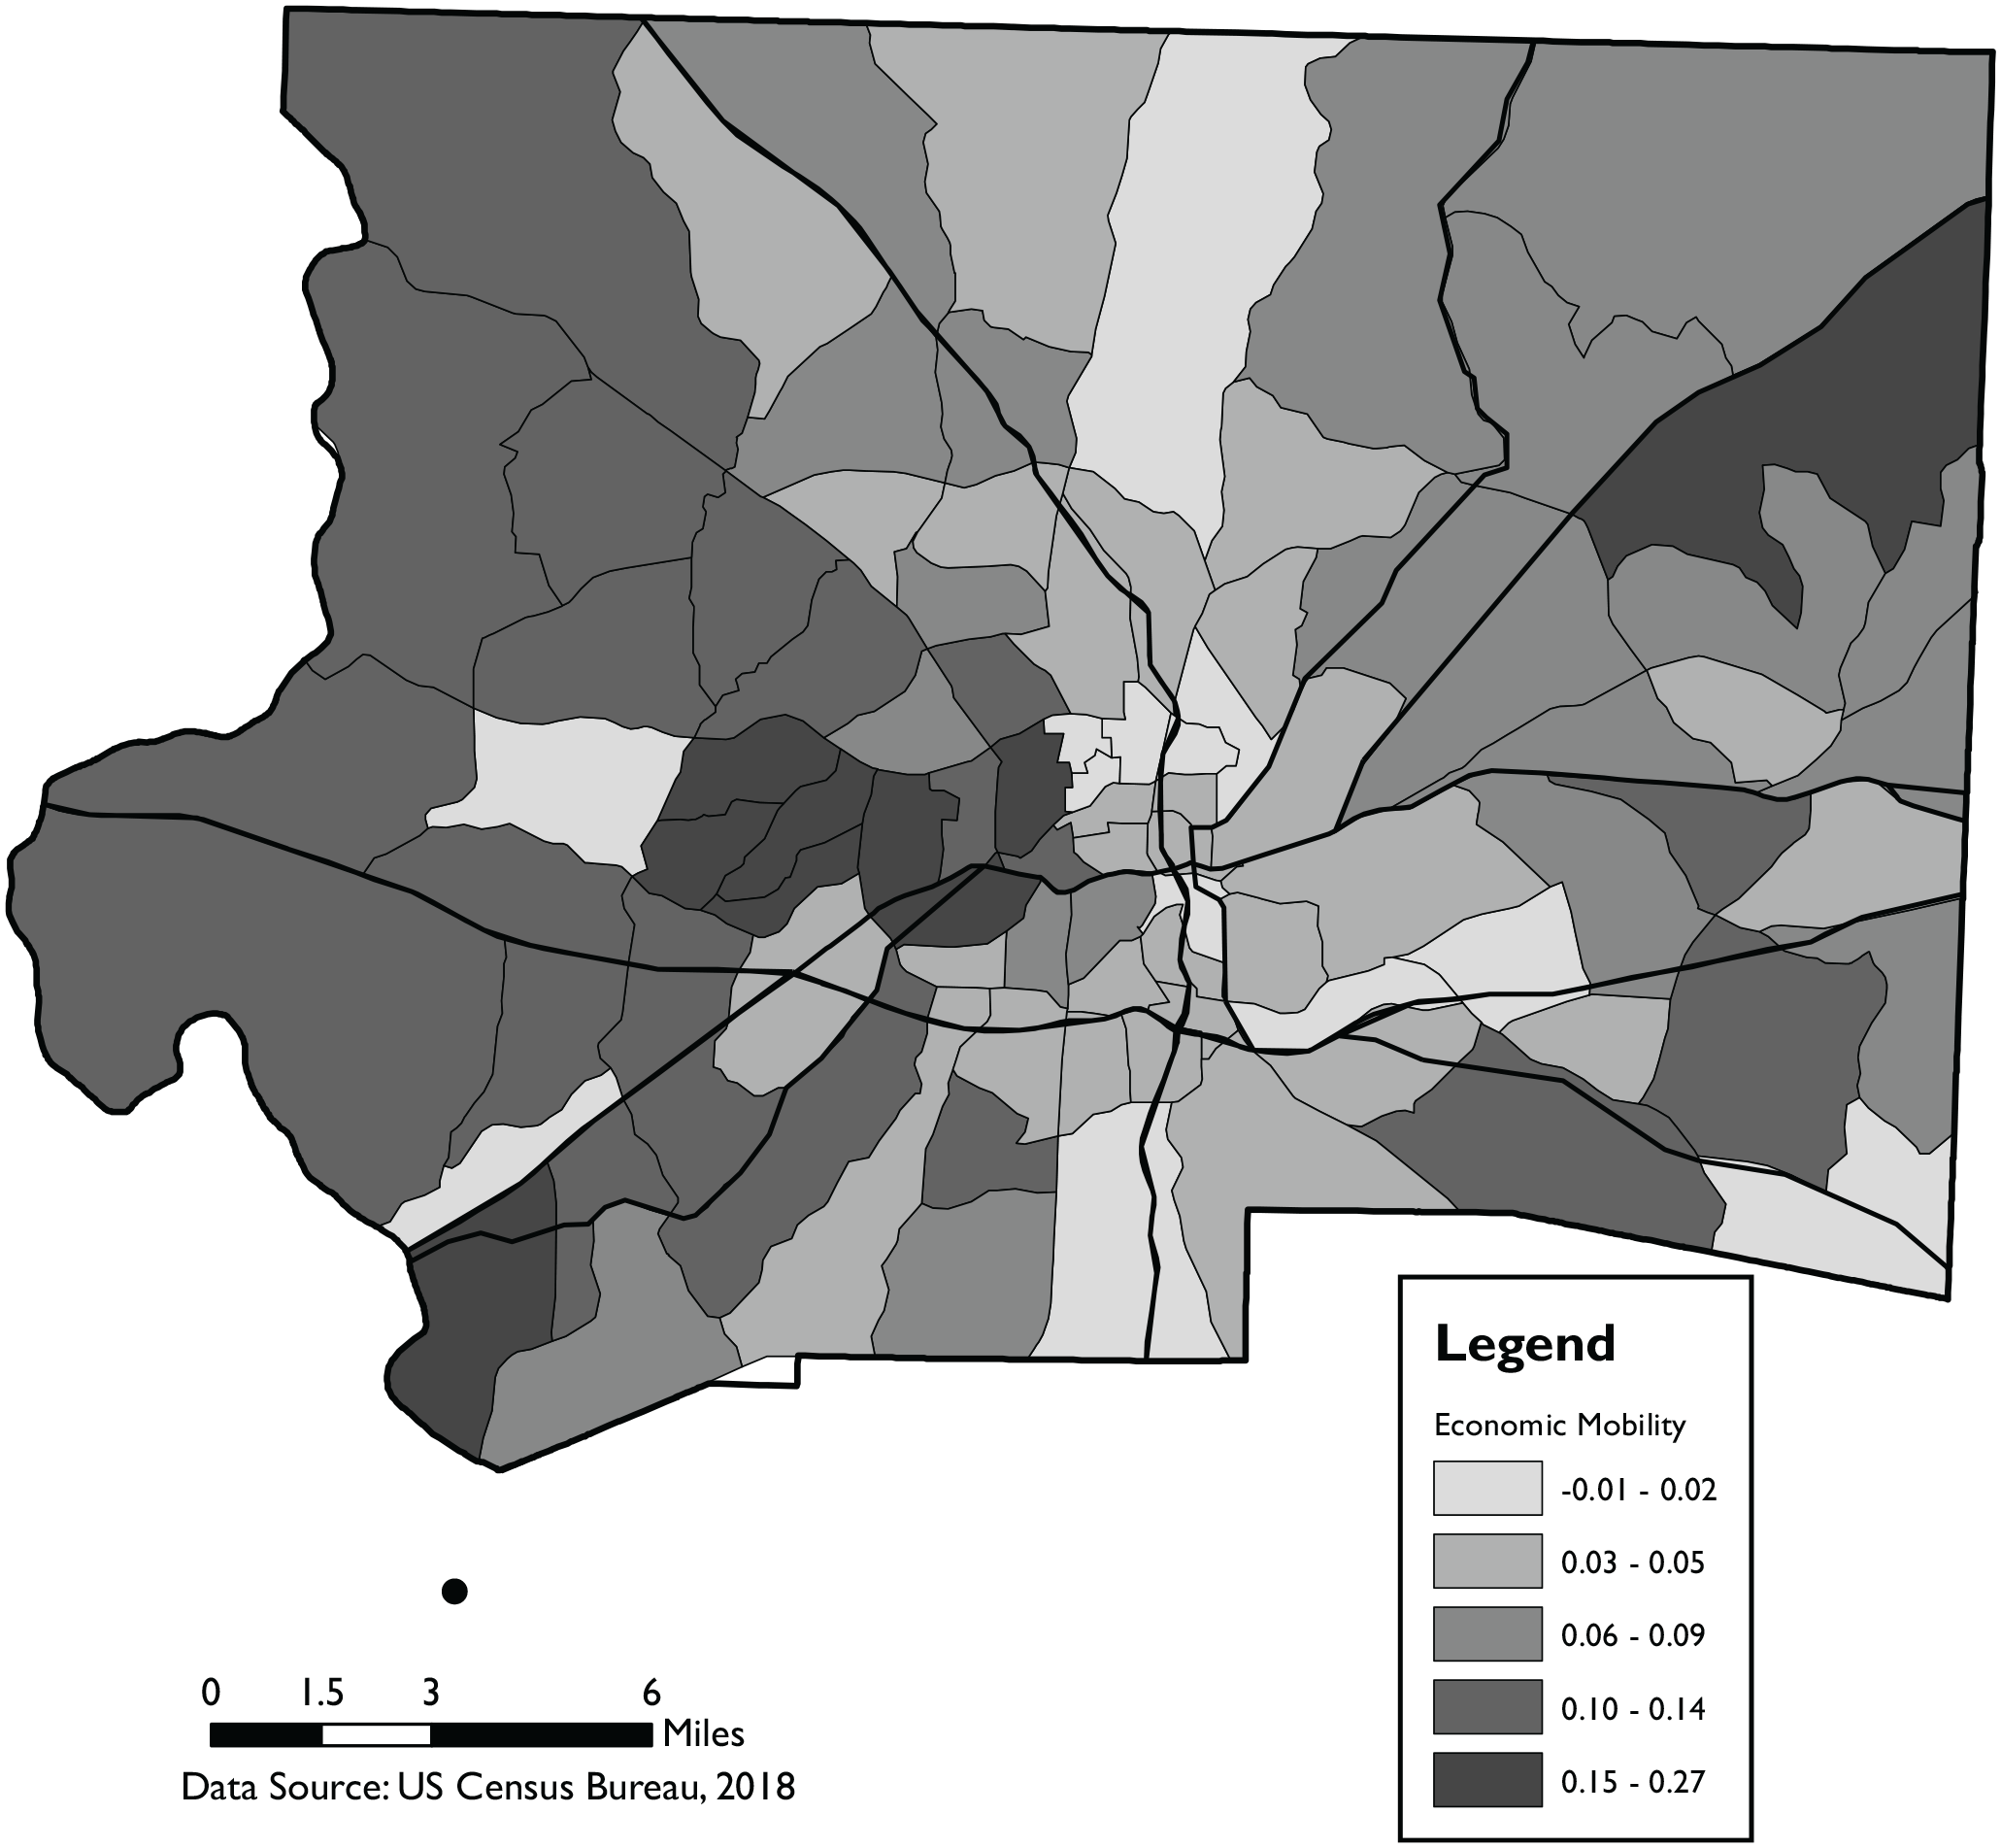
Economic mobility rates across Forsyth County’s census tracts.
The census tract is the geographic unit of this analysis, which was chosen for several reasons. First, it allows for a more nuanced examination than a county level analysis can provide. Previous studies have not examined the hypothesized relationship between sprawl and mobility at such a refined level. Second, it provides for the differences within counties to be included within the study. Using census tracts enables a more precise examination of the relationship between urban form and economic mobility across Forsyth County than has been previously completed. Last, while census tracts vary in size, they have similar populations; therefore, it is easier to control for differences due to population size than it is at the county level.
The Opportunity Insights databases contain mobility statistics that capture different sized “leaps” up the income ladder. Also, two measurements of income are used to calculate different versions of the mobility statistics, which are individual and household income. For example, Chetty et al. provide estimates for the probability of reaching the top 20 percent of the national household income distribution in 2014–2015, for children born to parents in the bottom 25 percent of the national income distribution, as well as the probability of reaching the top 20 percent of the national individual income distribution in 2014–2015, for children born to parents in the bottom 25 percent of the national income distribution. For the present study, individual income, instead of household income, is used primarily because the sample size is quite small (ninety-three observations corresponding to ninety-three census tracts). The estimated probabilities that use household income have larger variances than the probabilities that use individual income, since there are more individuals than households. Hence, the individual income probabilities are used to ensure efficient parameter estimates in the regression analysis to follow. The specific mobility statistic used is the estimated probability of reaching the top 20 percent of the national individual income distribution in 2014–2015, for children born to parents in the bottom 25 percent of the national income distribution among children born in the same year. This version was chosen because it is both a sufficiently large leap up the income ladder, while not being too large like, for example, 1 percent from bottom 25 percent.
Chetty et al. (2014) use U.S. tax records to calculate their mobility statistics. Their sample involves over twenty million Americans that were born between 1978 and 1983. As of 2015, these Americans are in their thirties. Chetty et al. (2014) link these Americans to the census tract that they resided in until they were twenty-three years old. They also link these Americans to their parents. When comparing a child’s income to his/her parent’s income, they use percentile ranks. Hence, this is a relative mobility measurement, instead of an absolute mobility measurement. Chetty et al. (2014) use percentile ranks because the resulting estimates are more precise and stable.
The independent variables in this study include a variety of measures of urban form that have been used in previous studies (Chetty et al. 2014; Ewing et al. 2016). To measure urban sprawl, which is our primary independent variable, a metric developed by Ewing and Hamidi (2014) for each individual census tract is employed. As the urban sprawl metric increases, the geography in question is more compact. When it decreases, the geography in question is less compact and more sprawling. This variable was accessed from the Measuring Sprawl 2014 database. Ewing and Hamidi (2014) first created the urban sprawl metric for larger geographies, but later expanded their attention to more refined geographies, like the census tract. They calculated the metric at the tract level in a similar way to which they calculated it at the metropolitan statistical area (MSA) and county levels.
We summarize the process by which Ewing and Hamidi (2014) calculate the metric. They conceptualize the primary aspects of urban sprawl, which include development density, land-use mix, activity centering, and street accessibility. To measure these aspects of sprawl, they use multiple variables. For development density, Ewing and Hamidi (2014) include gross density of urban and suburban tracts, share of the population in low suburban densities, share of the population living at medium to high urban densities, urban density based on the National Land Cover Database, the estimated density at the center of the metropolitan area, the total jobs per area, the weighted average population density, and the weighted employment density. For land-use mix, the variables include a job-population balance measure, a job mix variable, and a weighted average Walk Score. For activity centering, the variables include the coefficient of variation in census block group population densities, the coefficient of variation in census block group employment densities, the density gradient moving outward from the central business district (CBD), the proportion of employment and population within CBDs and employment sub-centers. For street accessibility, average block length, average block size, the percentage of blocks that are less than 1/100 square mile, intersection density, and the share of four-or-more way intersections are included. For each of the four aspects of urban sprawl, Ewing and Hamidi (2014) conduct a principal component analysis. The component variable that explains the largest amount of the common variance was selected to represent that aspect of urban sprawl (Ewing and Hamidi 2014). The first principal component is transformed into an index with a mean of 100 and a standard deviation of 25.
The additional urban form variables used in our analysis include number of brownfields, number of bus stops, and percentage commuting to work by public transportation. The number of brownfields and bus stops by census tract were obtained from the local Forsyth County GIS data provider—MapForsyth. The percentage of residents commuting to work by public transportation and the percentage of minority (non-white) residents at the census tract level were obtained from the Opportunity Insights database. We discuss these independent variables below.
Analytical Methods
This study uses a spatial regression analysis to measure the association between various indicators of urban form and economic mobility at the census tract level. A spatial regression approach is used because of the spatial autocorrelation effecting the model under consideration, which violates the assumption of ordinary least squares (OLS) that there be no correlation between observations. Census tracts that are closer together are likely to be more similar in regard to economic mobility than those further away. Using the Euclidean distances between the tracts’ centroids, a Moran’s Index test confirms the presence of spatial autocorrelation. The calculated Moran’s Index is 0.3721, and is significant at the 1 percent level. Economic mobility across the census tracts is spatially correlated, exhibiting a clustered pattern.
The spatial regression approach we take in this study is to estimate a spatial autoregressive (SAR) model. In the context of an SAR model, a spatially lagged version of the dependent variable is included in the model with a spatial weight matrix. To create this weight matrix, the centroids for each of the census tracts were found and their corresponding latitudes and longitudes. Using these coordinates, the spectral-normalized inverse-distance method was used to generate the spatial weight matrix.
The primary independent variable of interest is the level of urban sprawl, which is measured using the urban sprawl metric. Previous studies find a positive relationship between compactness and rates of upward mobility at larger geographic units. Researchers argue that this is due to urban sprawl’s impact on a myriad of mobility-promoting factors, like social capital development and job accessibility. In the context our model, a positive parameter estimate on the sprawl metric suggests evidence of a positive association between compactness and upward mobility, while a negative sign suggests a negative association.
We include two other urban form–related variables as independent variables, which are the number of bus stops and the number of brownfields. Bus stops and routes are critical for people toward the bottom of the income ladder, who more often rely on public transportation. Hence, bus stops may boost upward mobility rates among these residents. Moreover, policy recommendations would follow from such a finding. If the relationship is positive, local government may consider placing more transit stops and route extensions in low mobility areas. Regarding the number and presence of brownfields, they are indicators of missed opportunities to infuse economic stimulus into a particular area. Brownfields are signs of an economically depressed area lacking needed development. Hence, more brownfields may lower mobility rates in a particular area by dissuading private investment, suggesting a negative relationship. Two other potentially important variables are included as covariates in the model, such as race, and commuting with public transportation. Race is a vital variable to control for when studying economic mobility. Furthermore, including a race variable will help control for other closely correlated socioeconomic variables, like income segregation and education. This is especially true in the United States, where race looms large in nearly all socioeconomic systems. This is useful in the context of our study since any estimated model using few observations will be subject to high levels of statistical noise and collinearity between covariates may produce volatile parameter estimates.
A linear regression model is also estimated, using OLS, to provide a baseline comparison for the SAR results. The linear regression model is specified as follows:

The formal expression of the SAR model is as follows:

where
Several research limitations exist, which are promptly acknowledged. First, defining urban form is difficult, since it can differ dramatically by geography and is difficult to measure. However, by limiting this study to Forsyth County, NC, similar planning legislation, development patterns, and economic conditions will create a more stable platform by which to explore urban form. The utilization of Ewing and Hamidi’s (2014) urban sprawl metric, which has been employed in numerous studies, adds methodological validity. Second, data are limited. As is well known, geographic data are often inaccurate and unstandardized, which are major challenges to empirical research. These are even more challenging to the present study, since the study’s focus is a single county. Consequently, the sample data set is small and subject to high levels of statistical noise. Complicating things further, this highly focused approach also limits the variables available for use in a modeling approach. Due to data limitations, there are confounding variables that are not controlled for in the analysis. Regardless, focused case studies are crucial.
Findings
Table 2 contains the descriptive statistics for the variables in the study. The mean probability of reaching the top 20 percent of the national individual income distribution in 2014–2015, for children born to parents in the bottom 25 percent of the national income distribution in Forsyth County, NC, is around 0.08. The average urban sprawl metric value is around 81.80. In Forsyth County, the average census tract has around 0.13 brownfields and 9.28 bus stops. The average share of non-white residents living in tracts across Forsyth County is approximately 42.17 percent, while the average share of public transportation commuters living in tracts across Forsyth County is just under 2 percent.
Descriptive Statistics.
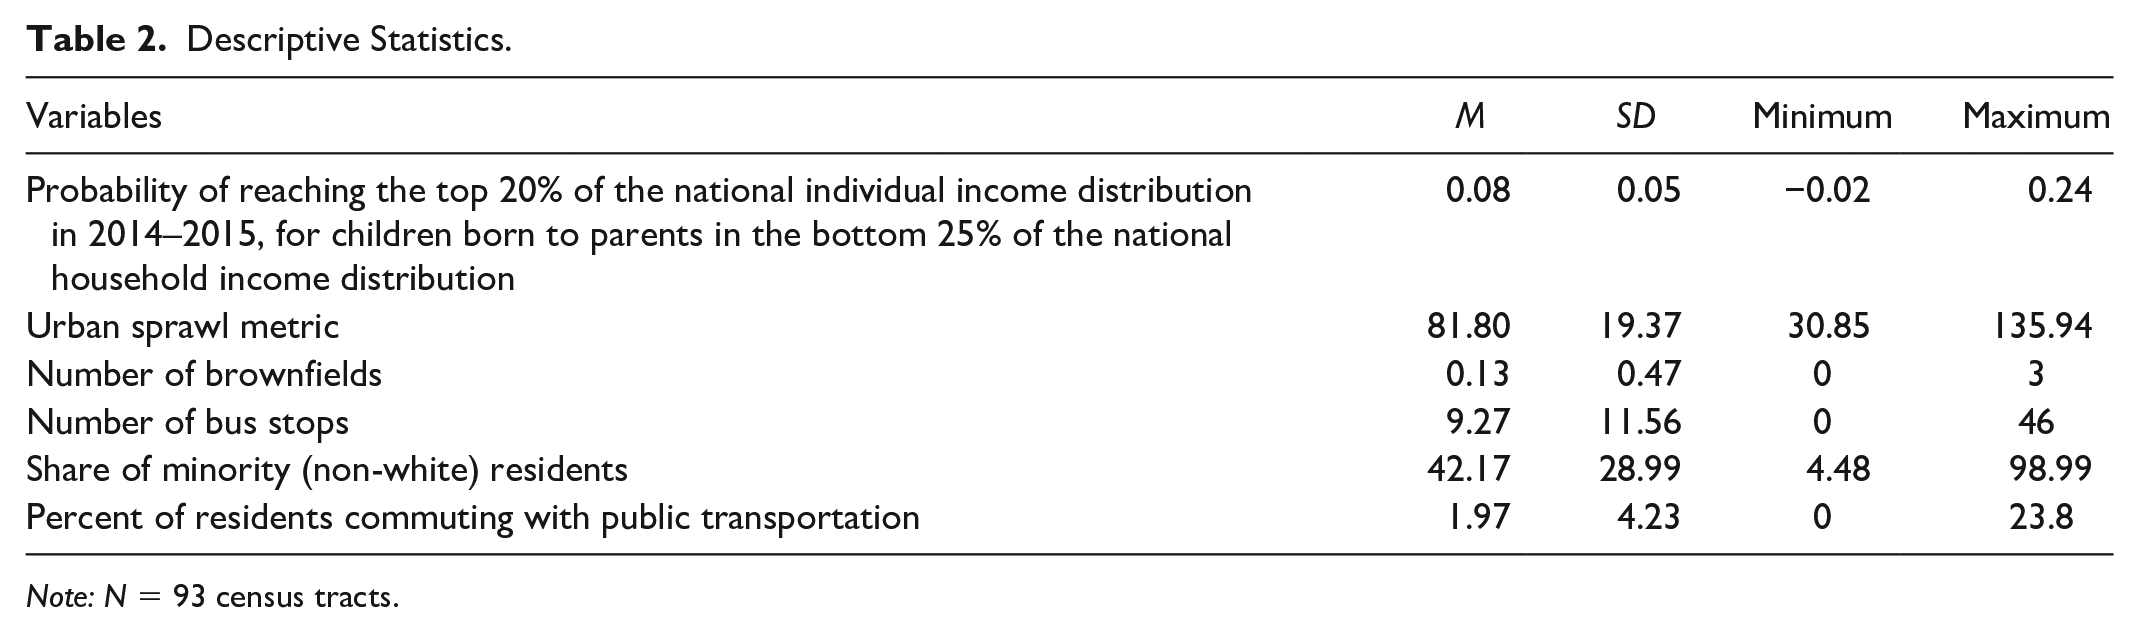
Note: N = 93 census tracts.
Table 3 contains the regression estimates of (1) and (2). The R2 of (1) and (2) are .406 and .405, respectively. According to the R2, the estimates of models (1) and (2) explain nearly 41 percent of the variation in the rates of upward mobility in Forsyth County, NC. The parameter estimate from the linear regression on the urban sprawl metric is 0.0005, which is significant at the 10 percent level, while the parameter estimate from the spatial regression is 0.0004 but is insignificant. The parameter estimates from the linear regression on number of brownfields and bus stops are −0.0213 and 0.0016, respectively. Both are statistically significant, with the estimate for brownfields being significant at the 5 percent level and the estimate of bus stops is significant at the 1 percent level. The parameter estimates from the spatial regression on number of brownfields and bus stops are −0.0189 and 0.0015, respectively. Both are statistically significant, with the estimate for brownfields being significant at the 5 percent level and the estimate of bus stops is significant at the 1 percent level. The estimates for share of minorities from both regressions are negative and highly significant. The estimates from both regressions for the percent of public transportation commuters are negative but statistically insignificant. The estimated lag parameter from the spatial regression is significant.
Regression Results.
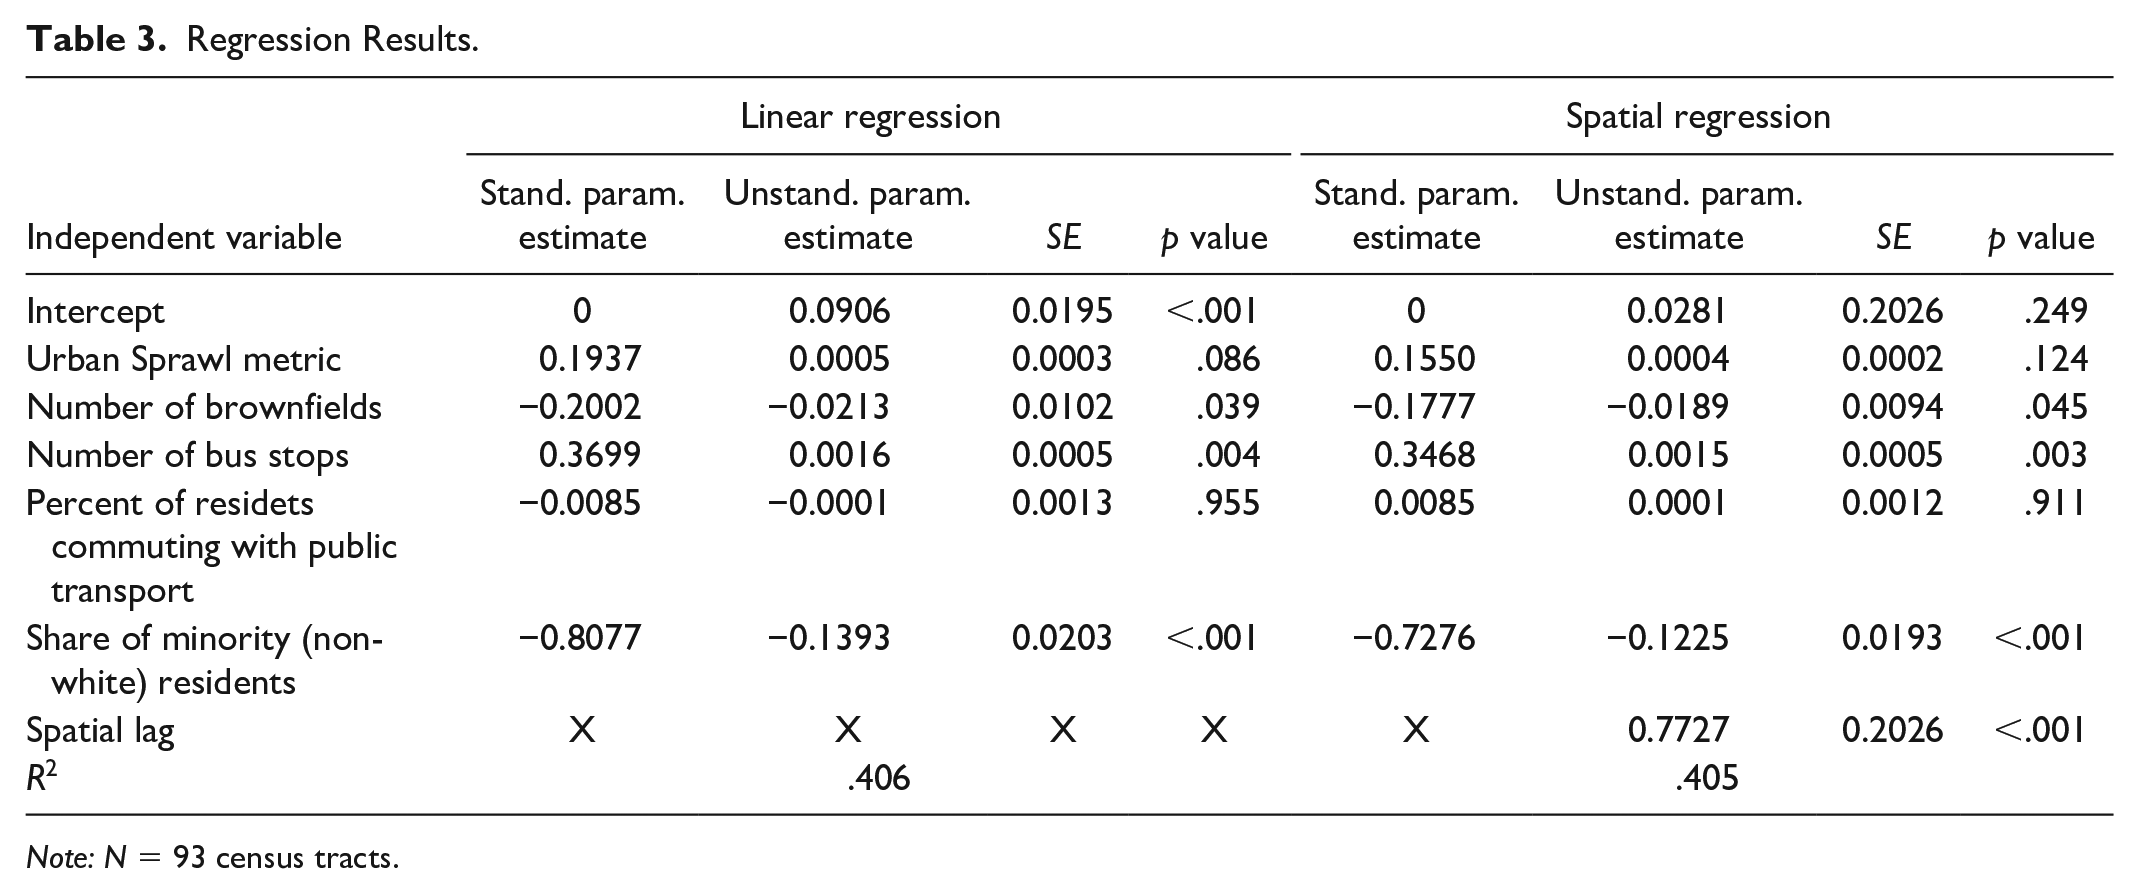
Note: N = 93 census tracts.
To give some interpretative context to the results, a fifty-unit reduction in urban sprawl is associated with an increase in the probability of upward mobility for the residents toward the bottom of the income ladder of around 2.5 percent. An elimination of a brownfield is associated with an increase in the probability of upward mobility for the residents toward the bottom of the income ladder of around 2 percent. Finally, as the number of bus stops increases by 1, the probability of upward mobility for the residents toward the bottom of the income ladder tends to increase by around 2 percent. It should be emphasized, again, that the results are correlational and not causal.
The results above, like those of Ewing et al. (2016), suggest that more compact census tracts are associated with higher rates of upward mobility. As urban sprawl decreases, economic mobility tends to increase. This result is consistent with previous findings, such as those of Ewing et al. (2016). Figure 3 displays the variation in urban sprawl metric values across Forsyth County’s tracts. Note that census tracts closer to the downtown have much higher levels of compactness, indicated by darker coloration.
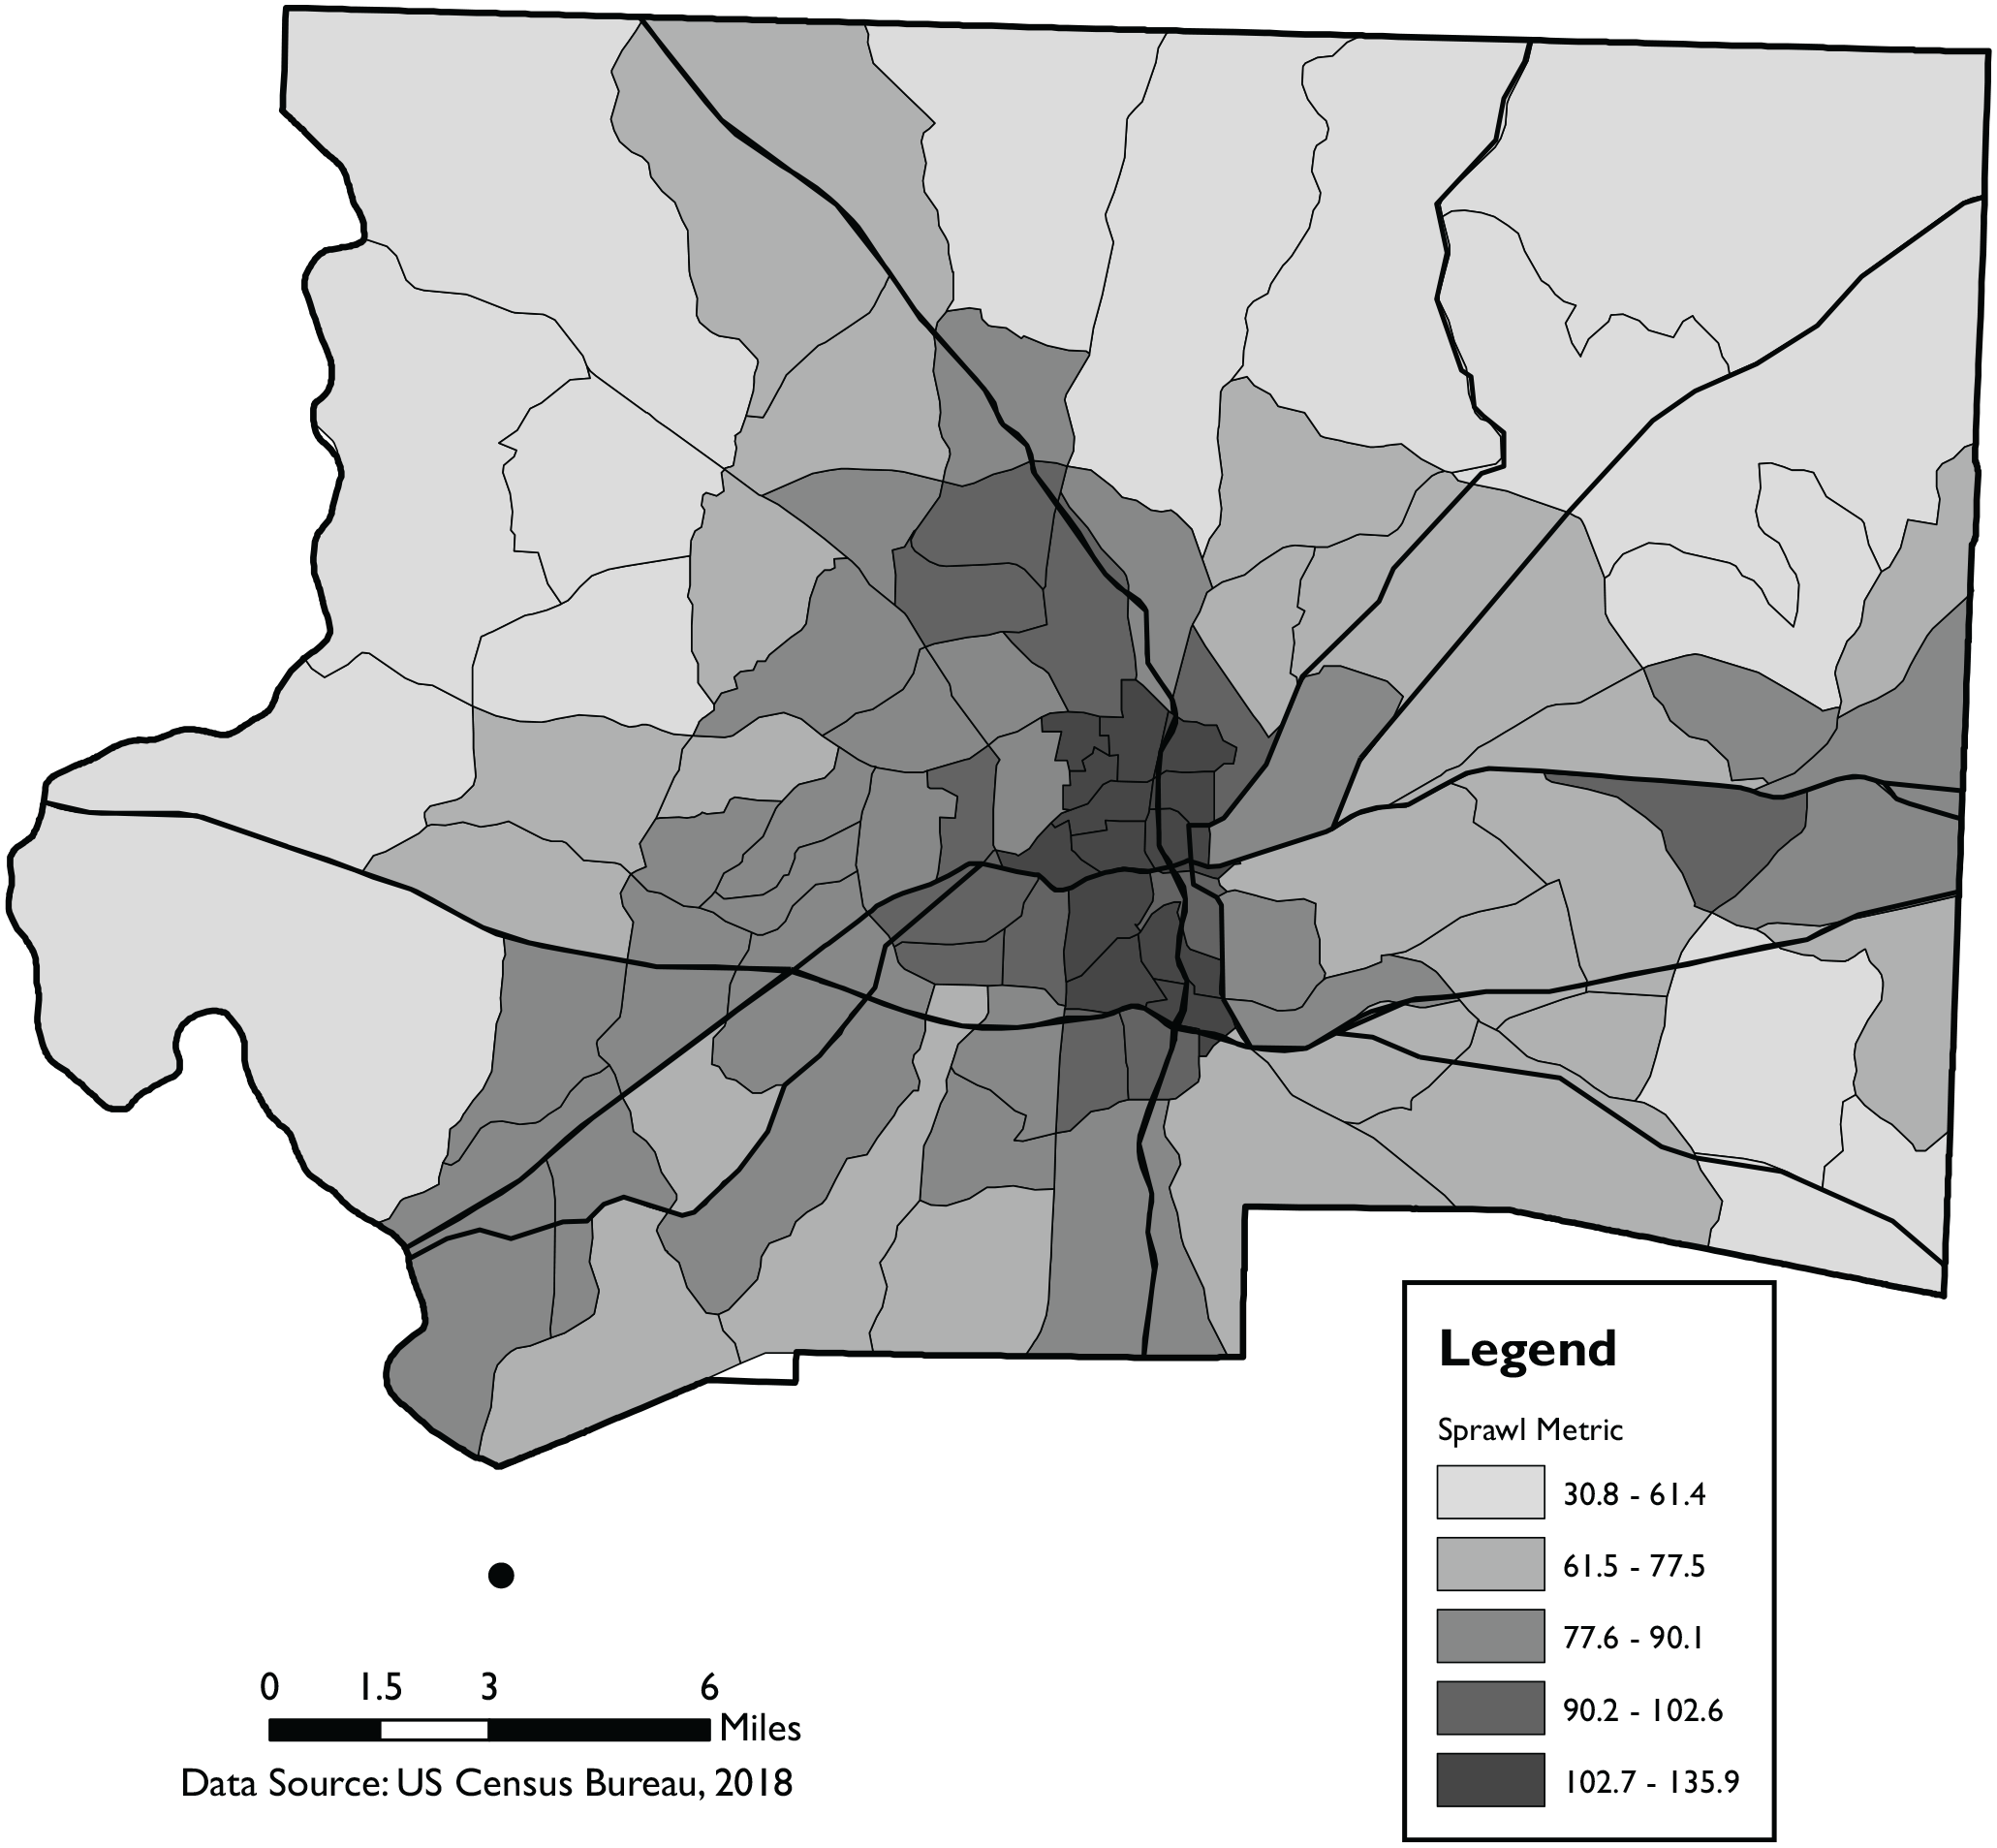
Urban sprawl metric by census tract in Forsyth County.
The regression estimates suggest that as the number of brownfields increase, economic mobility tends to decrease. As it relates to this study, brownfields may serve as a surrogate for the presence of underutilized and/or abandoned property within a census tract. Higher levels of vacant and/or underutilized land will negatively influence compactness and limit economic mobility. These underutilized properties tend to be located in census tracts close to the urban core and offer opportunities for infill development and redevelopment to increase density/compactness (see Figure 4).
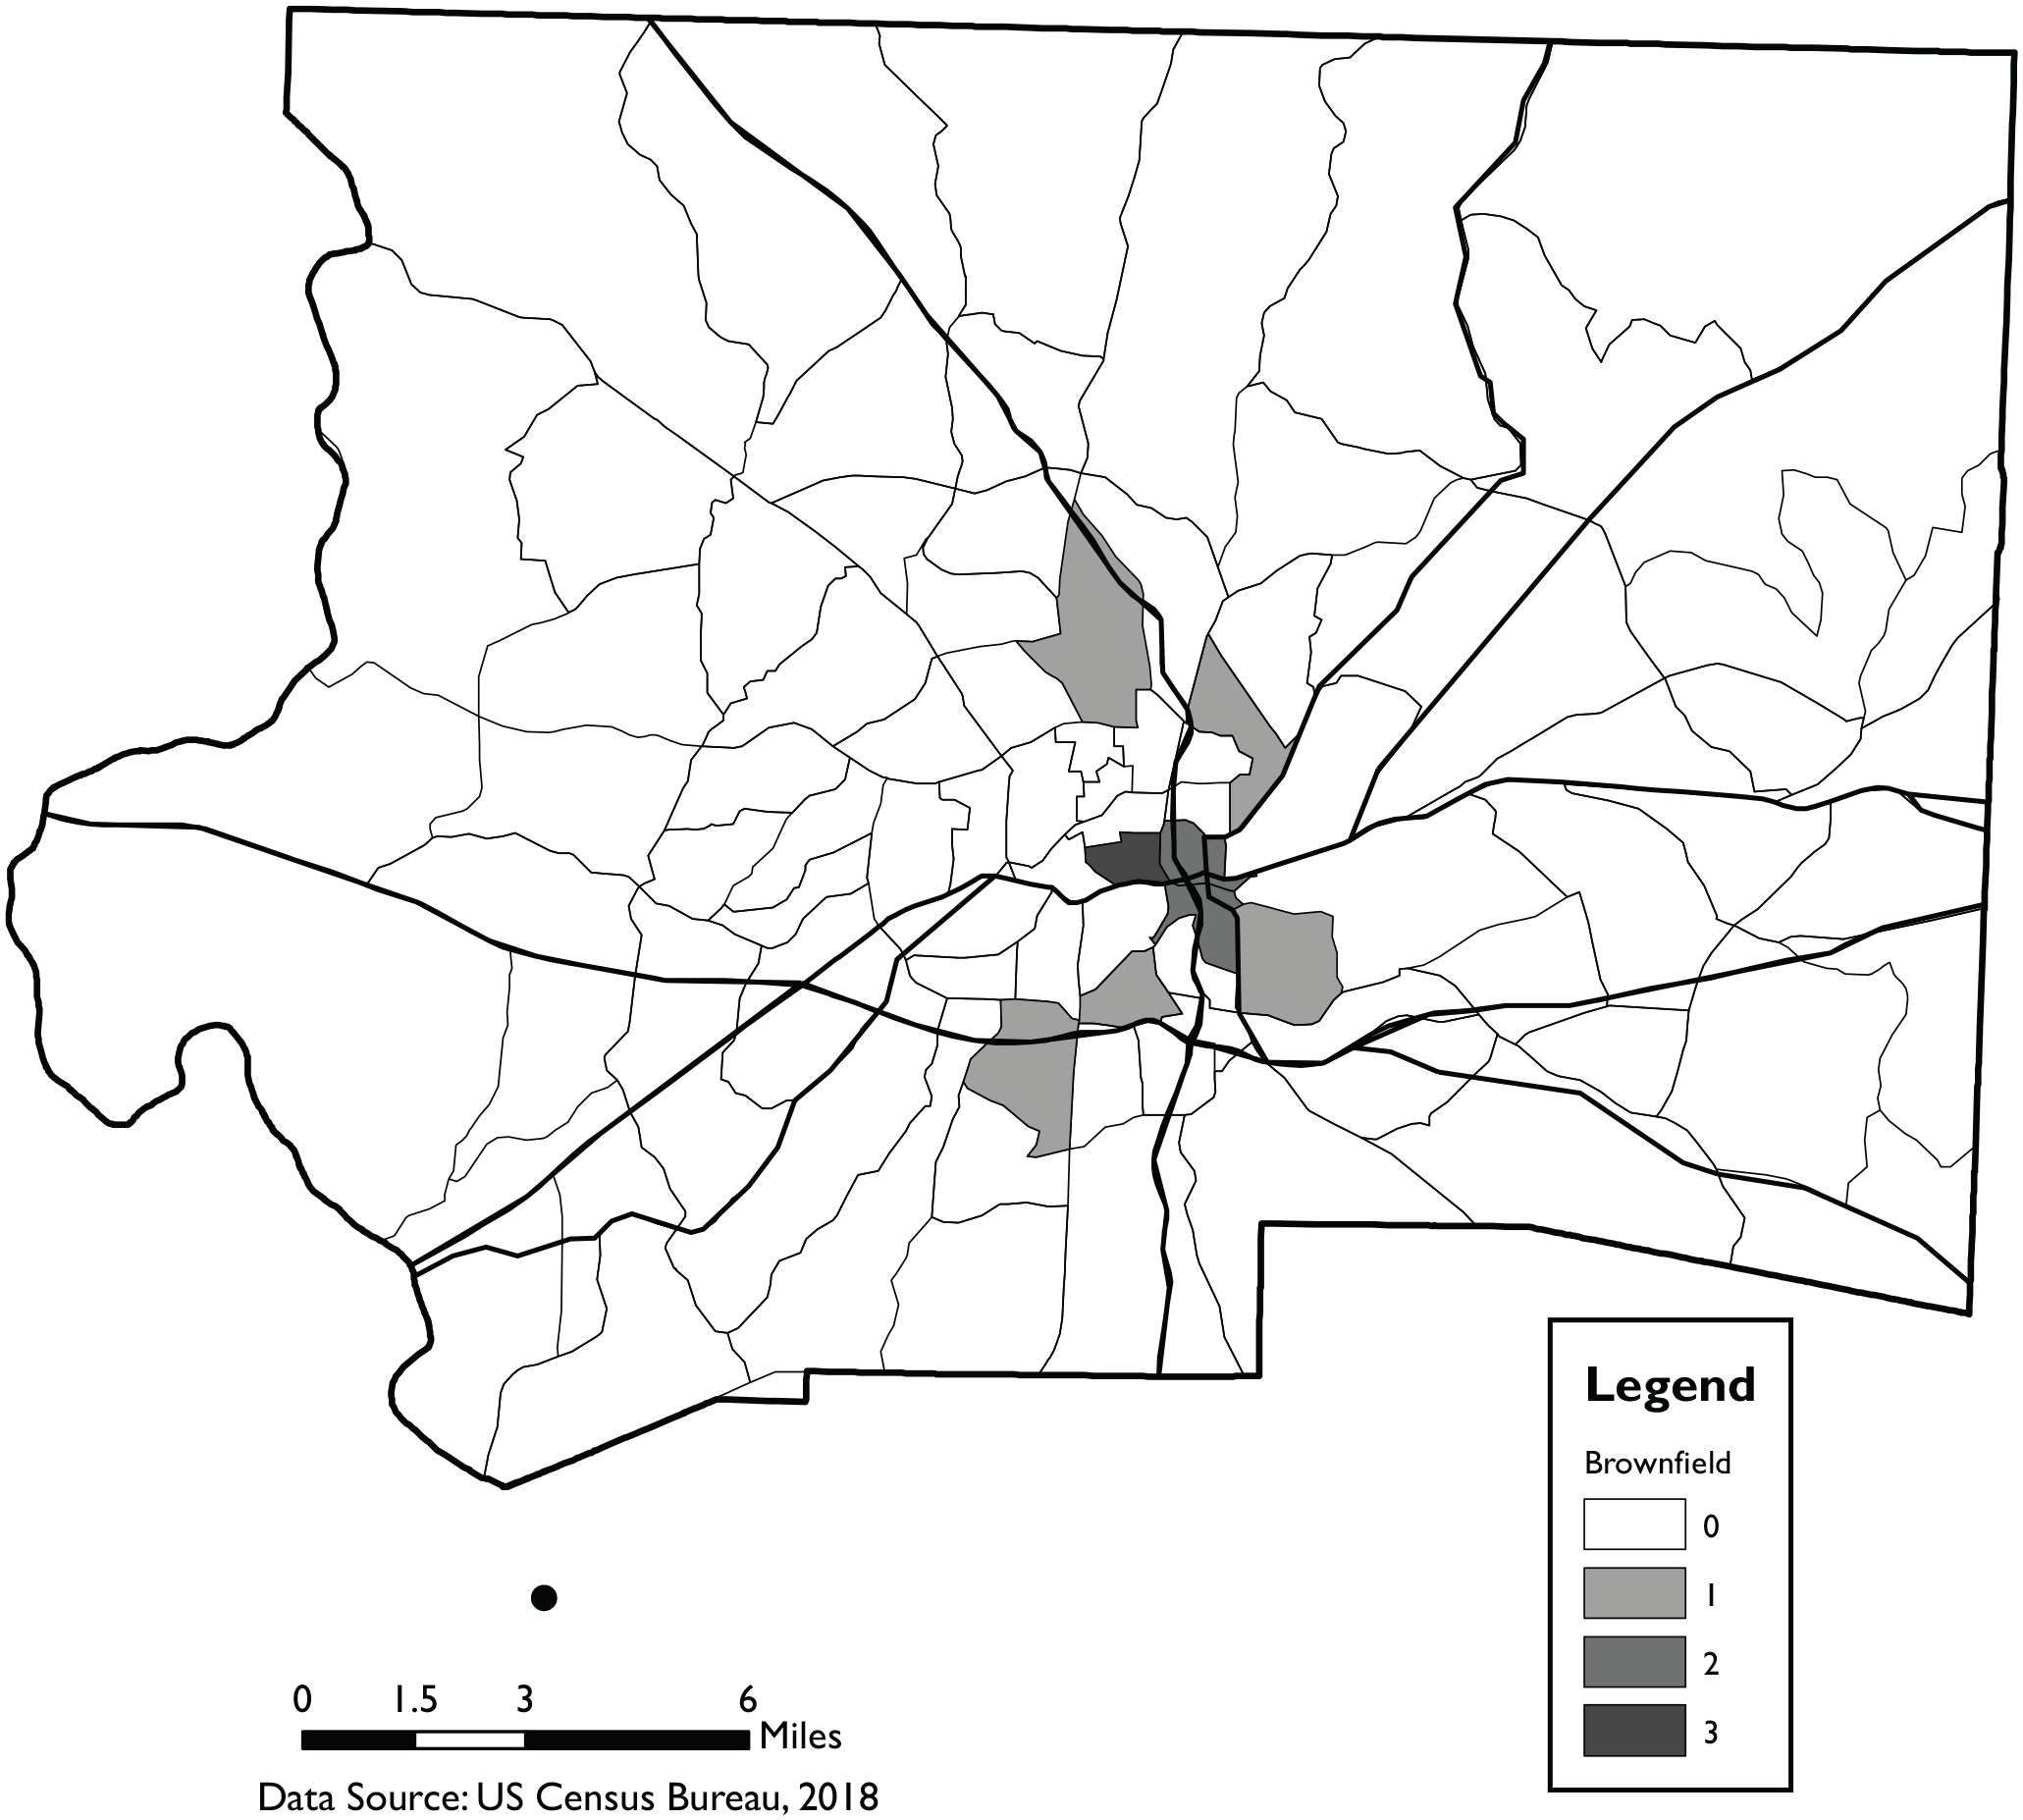
Brownfield sites by census tract in Forsyth County.
Regarding bus stops, this study finds that as the number of stops in a tract increase, economic mobility tends to rise. Transportation to work is a major factor in achieving economic mobility. The decentralization of employment centers from the urban core to the suburbs is a main characteristic of urban sprawl. Residents of the urban core traditionally had access to a wide variety of employment opportunities in closer proximity to their place of residence. As businesses left the urban core, the residents without access to private automobiles may be left behind, unless they are served by public transportation alternatives. The results of this study suggest that when public transportation is available in a census tract, local residents are better able to climb the economic ladder (see Figure 5). We fail to find evidence that the share of residents that use public transportation significantly predicts upward mobility (see Figure 6).
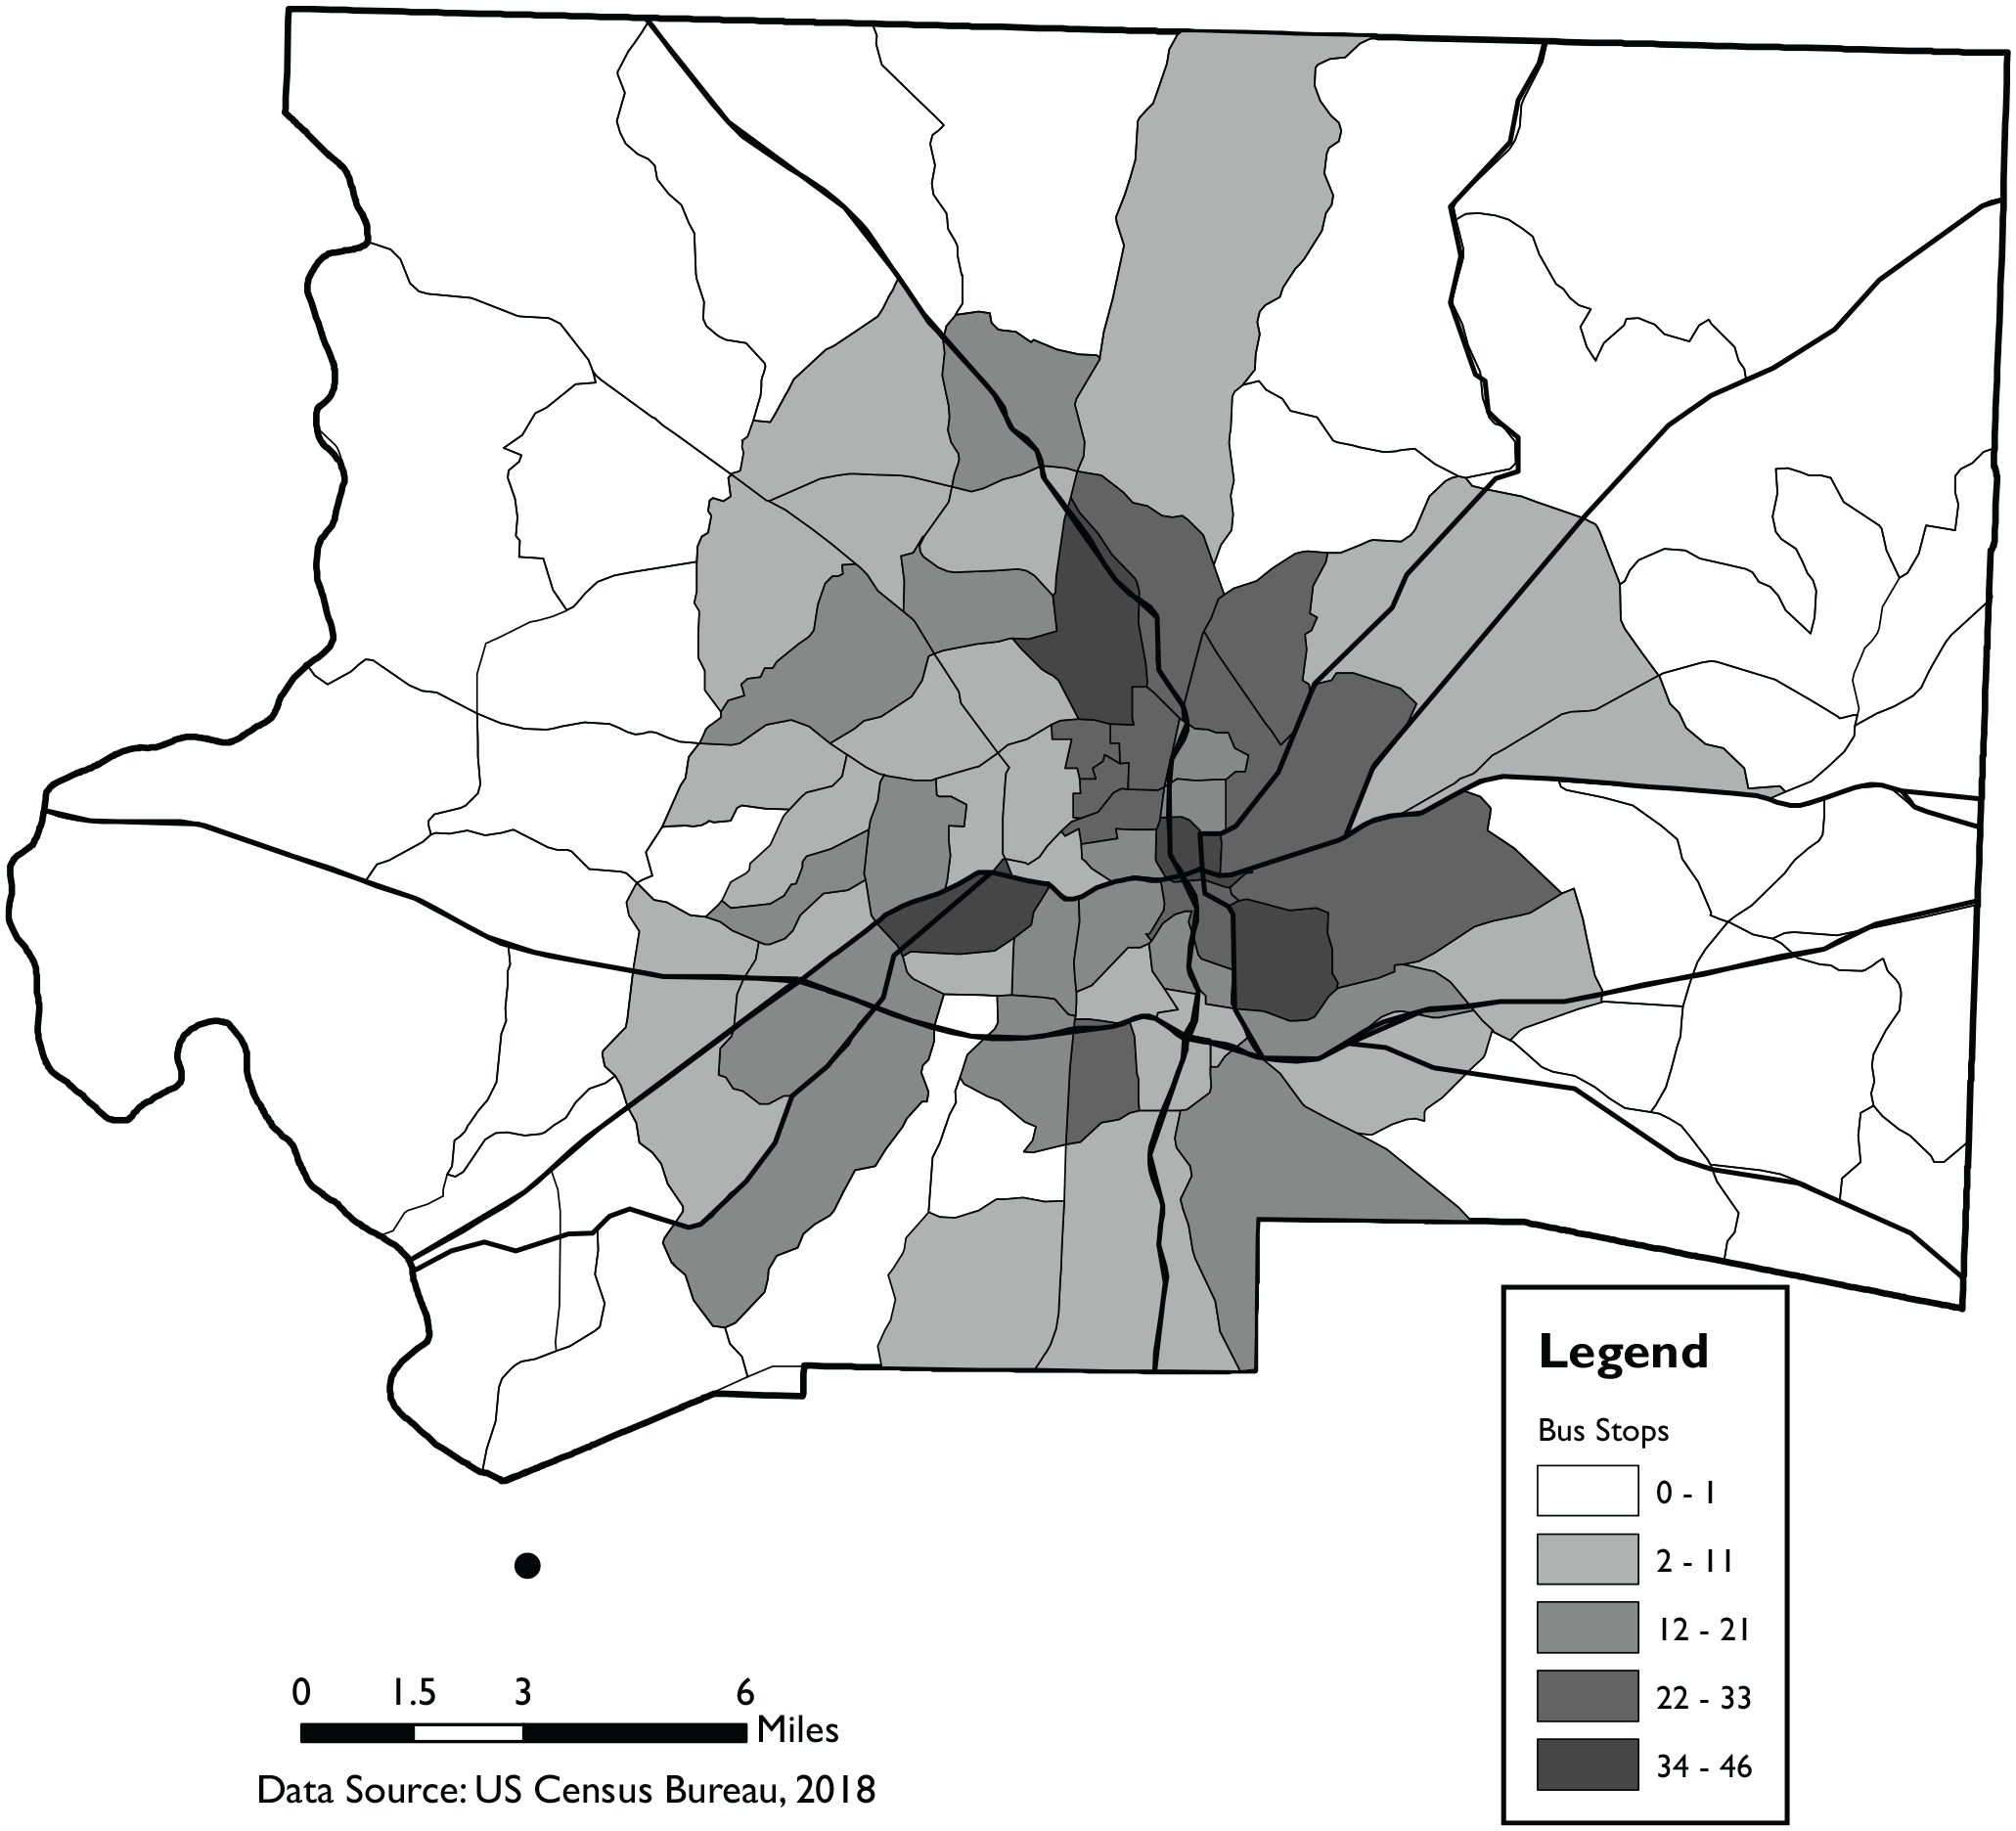
Bus stops by census tract in Forsyth County.
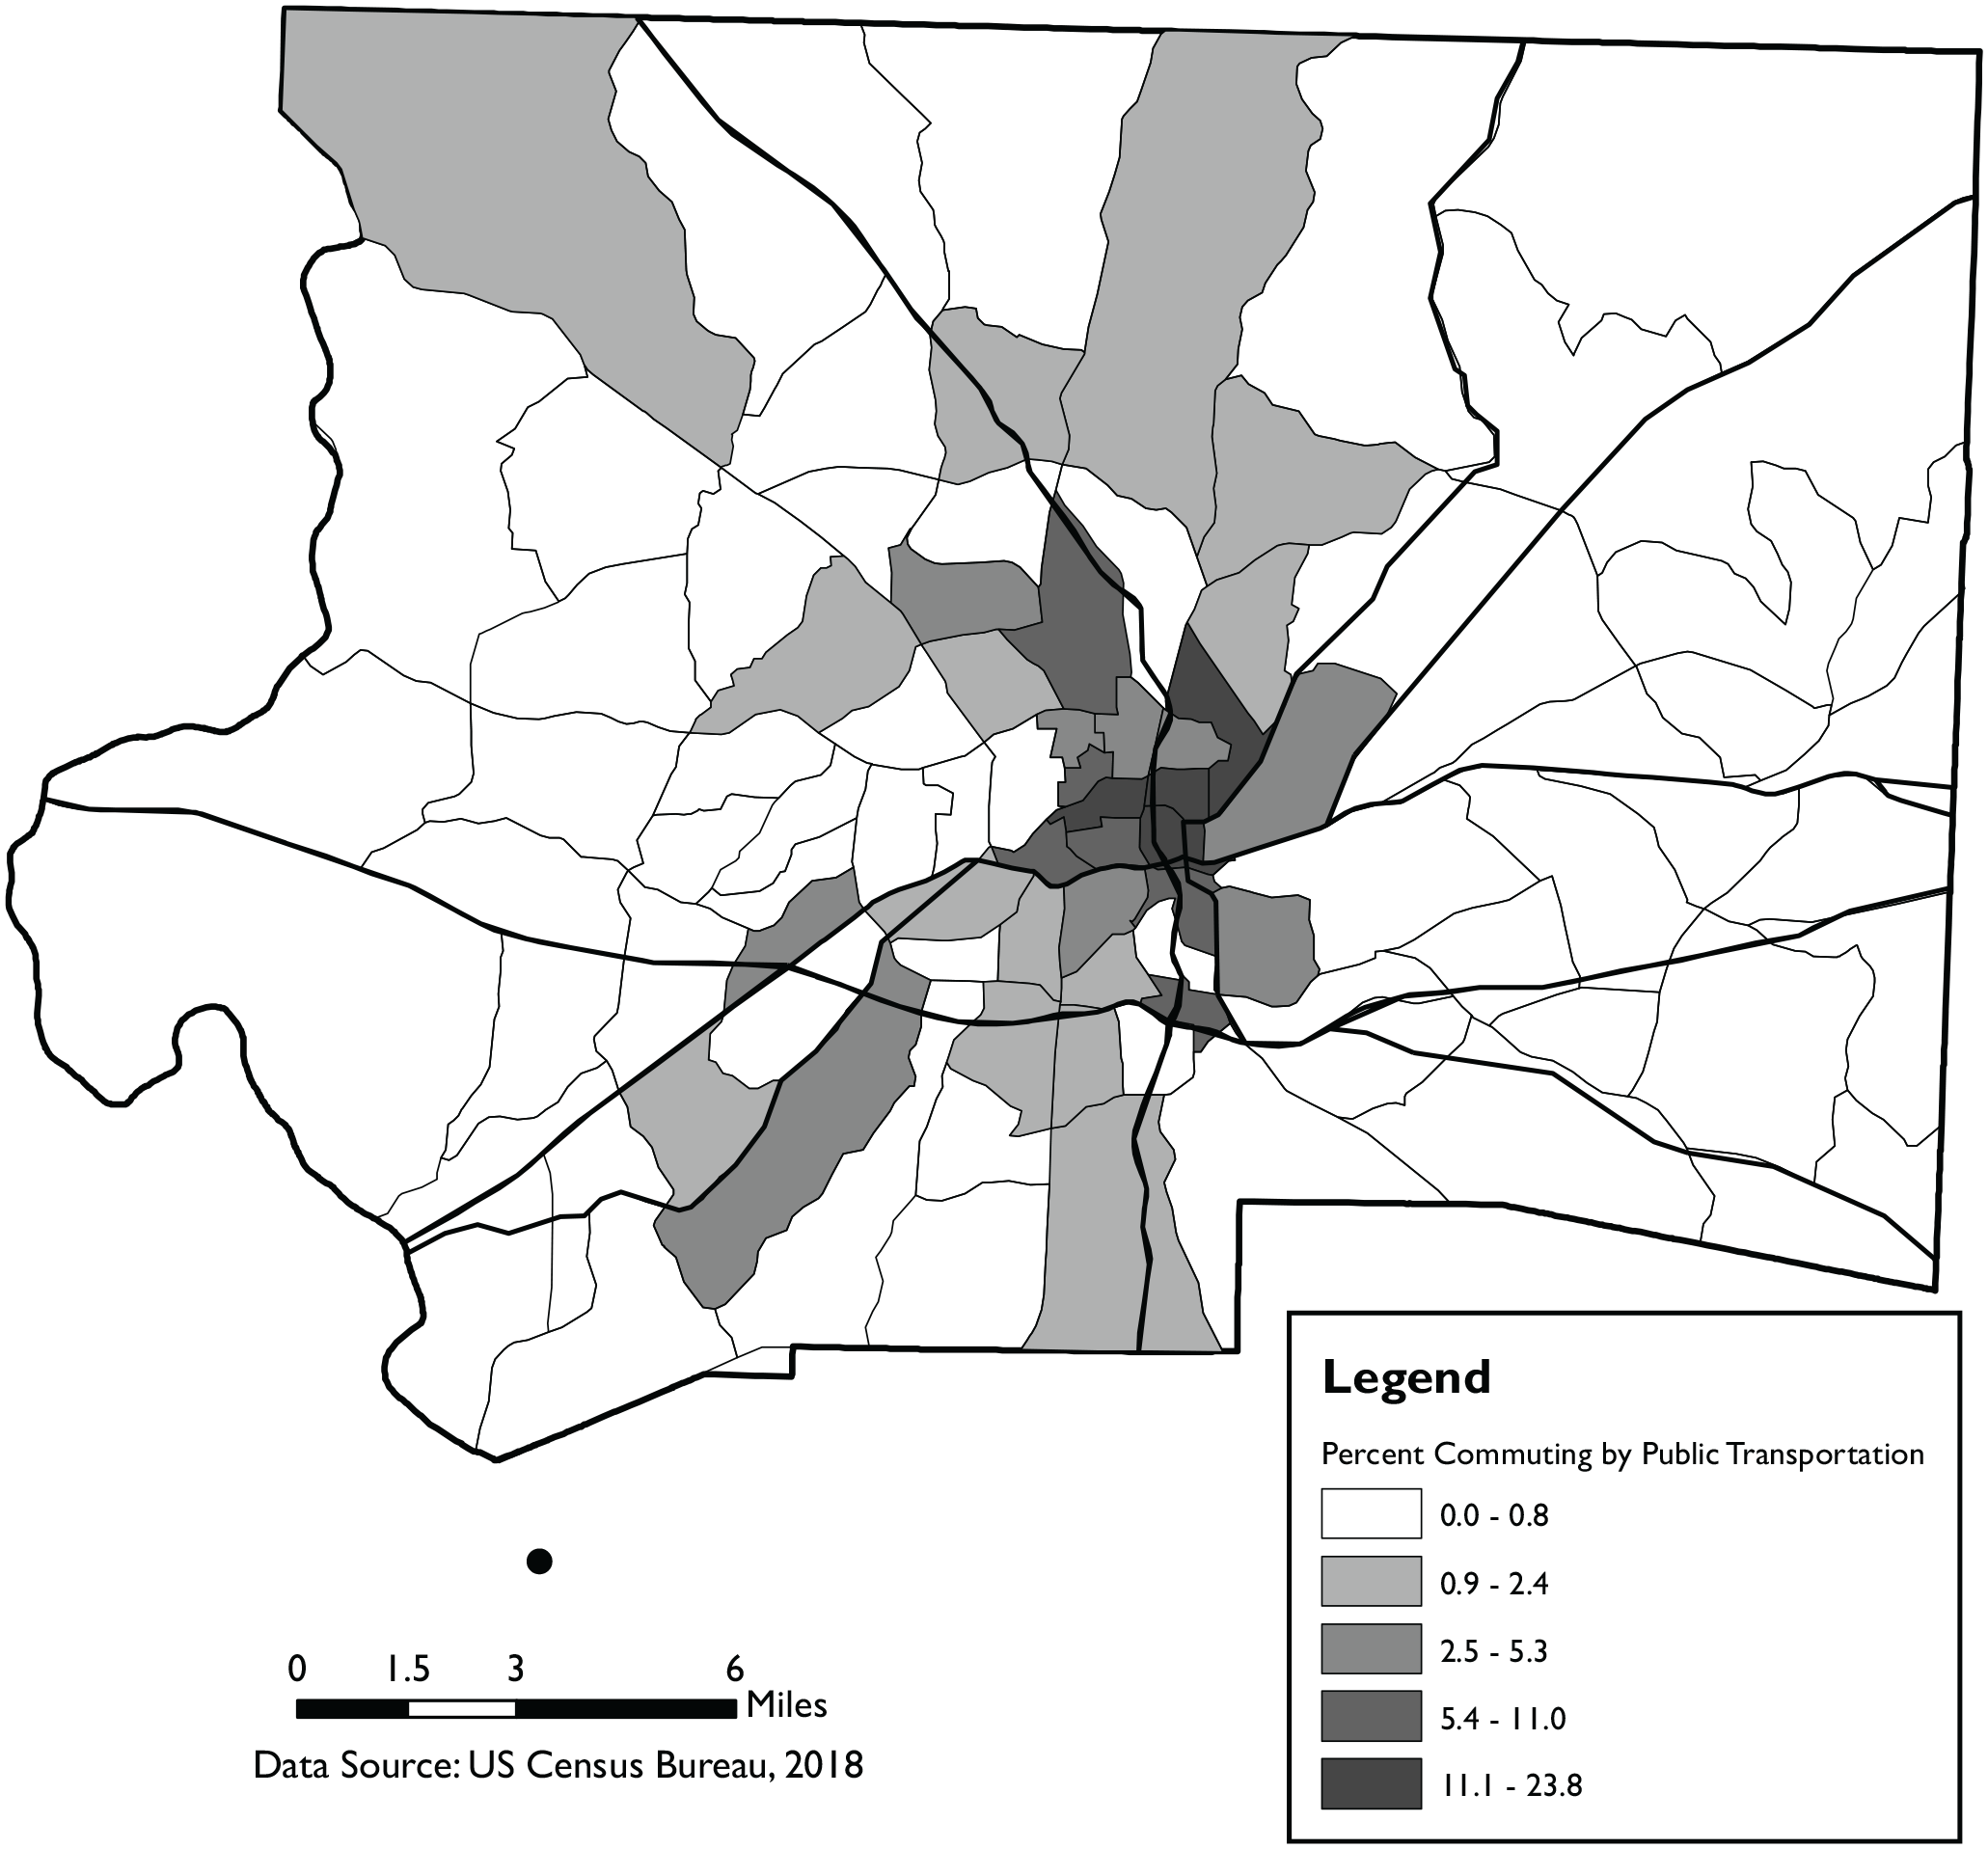
Percent of residents that use public transportation by census tract in Forsyth County.
This study finds that as the percentage of minority population in a census tract increases, economic mobility tends to decrease. This finding is not unexpected due to the relationship between wealth inequality and race/ethnicity in the United States. Though a larger percentage of minority residents live in older, more compact urban neighborhoods, which is often associated with higher levels of economic mobility, the persistence of economic inequality and segregation in the United States offsets the influence of urban form (see Figure 7).
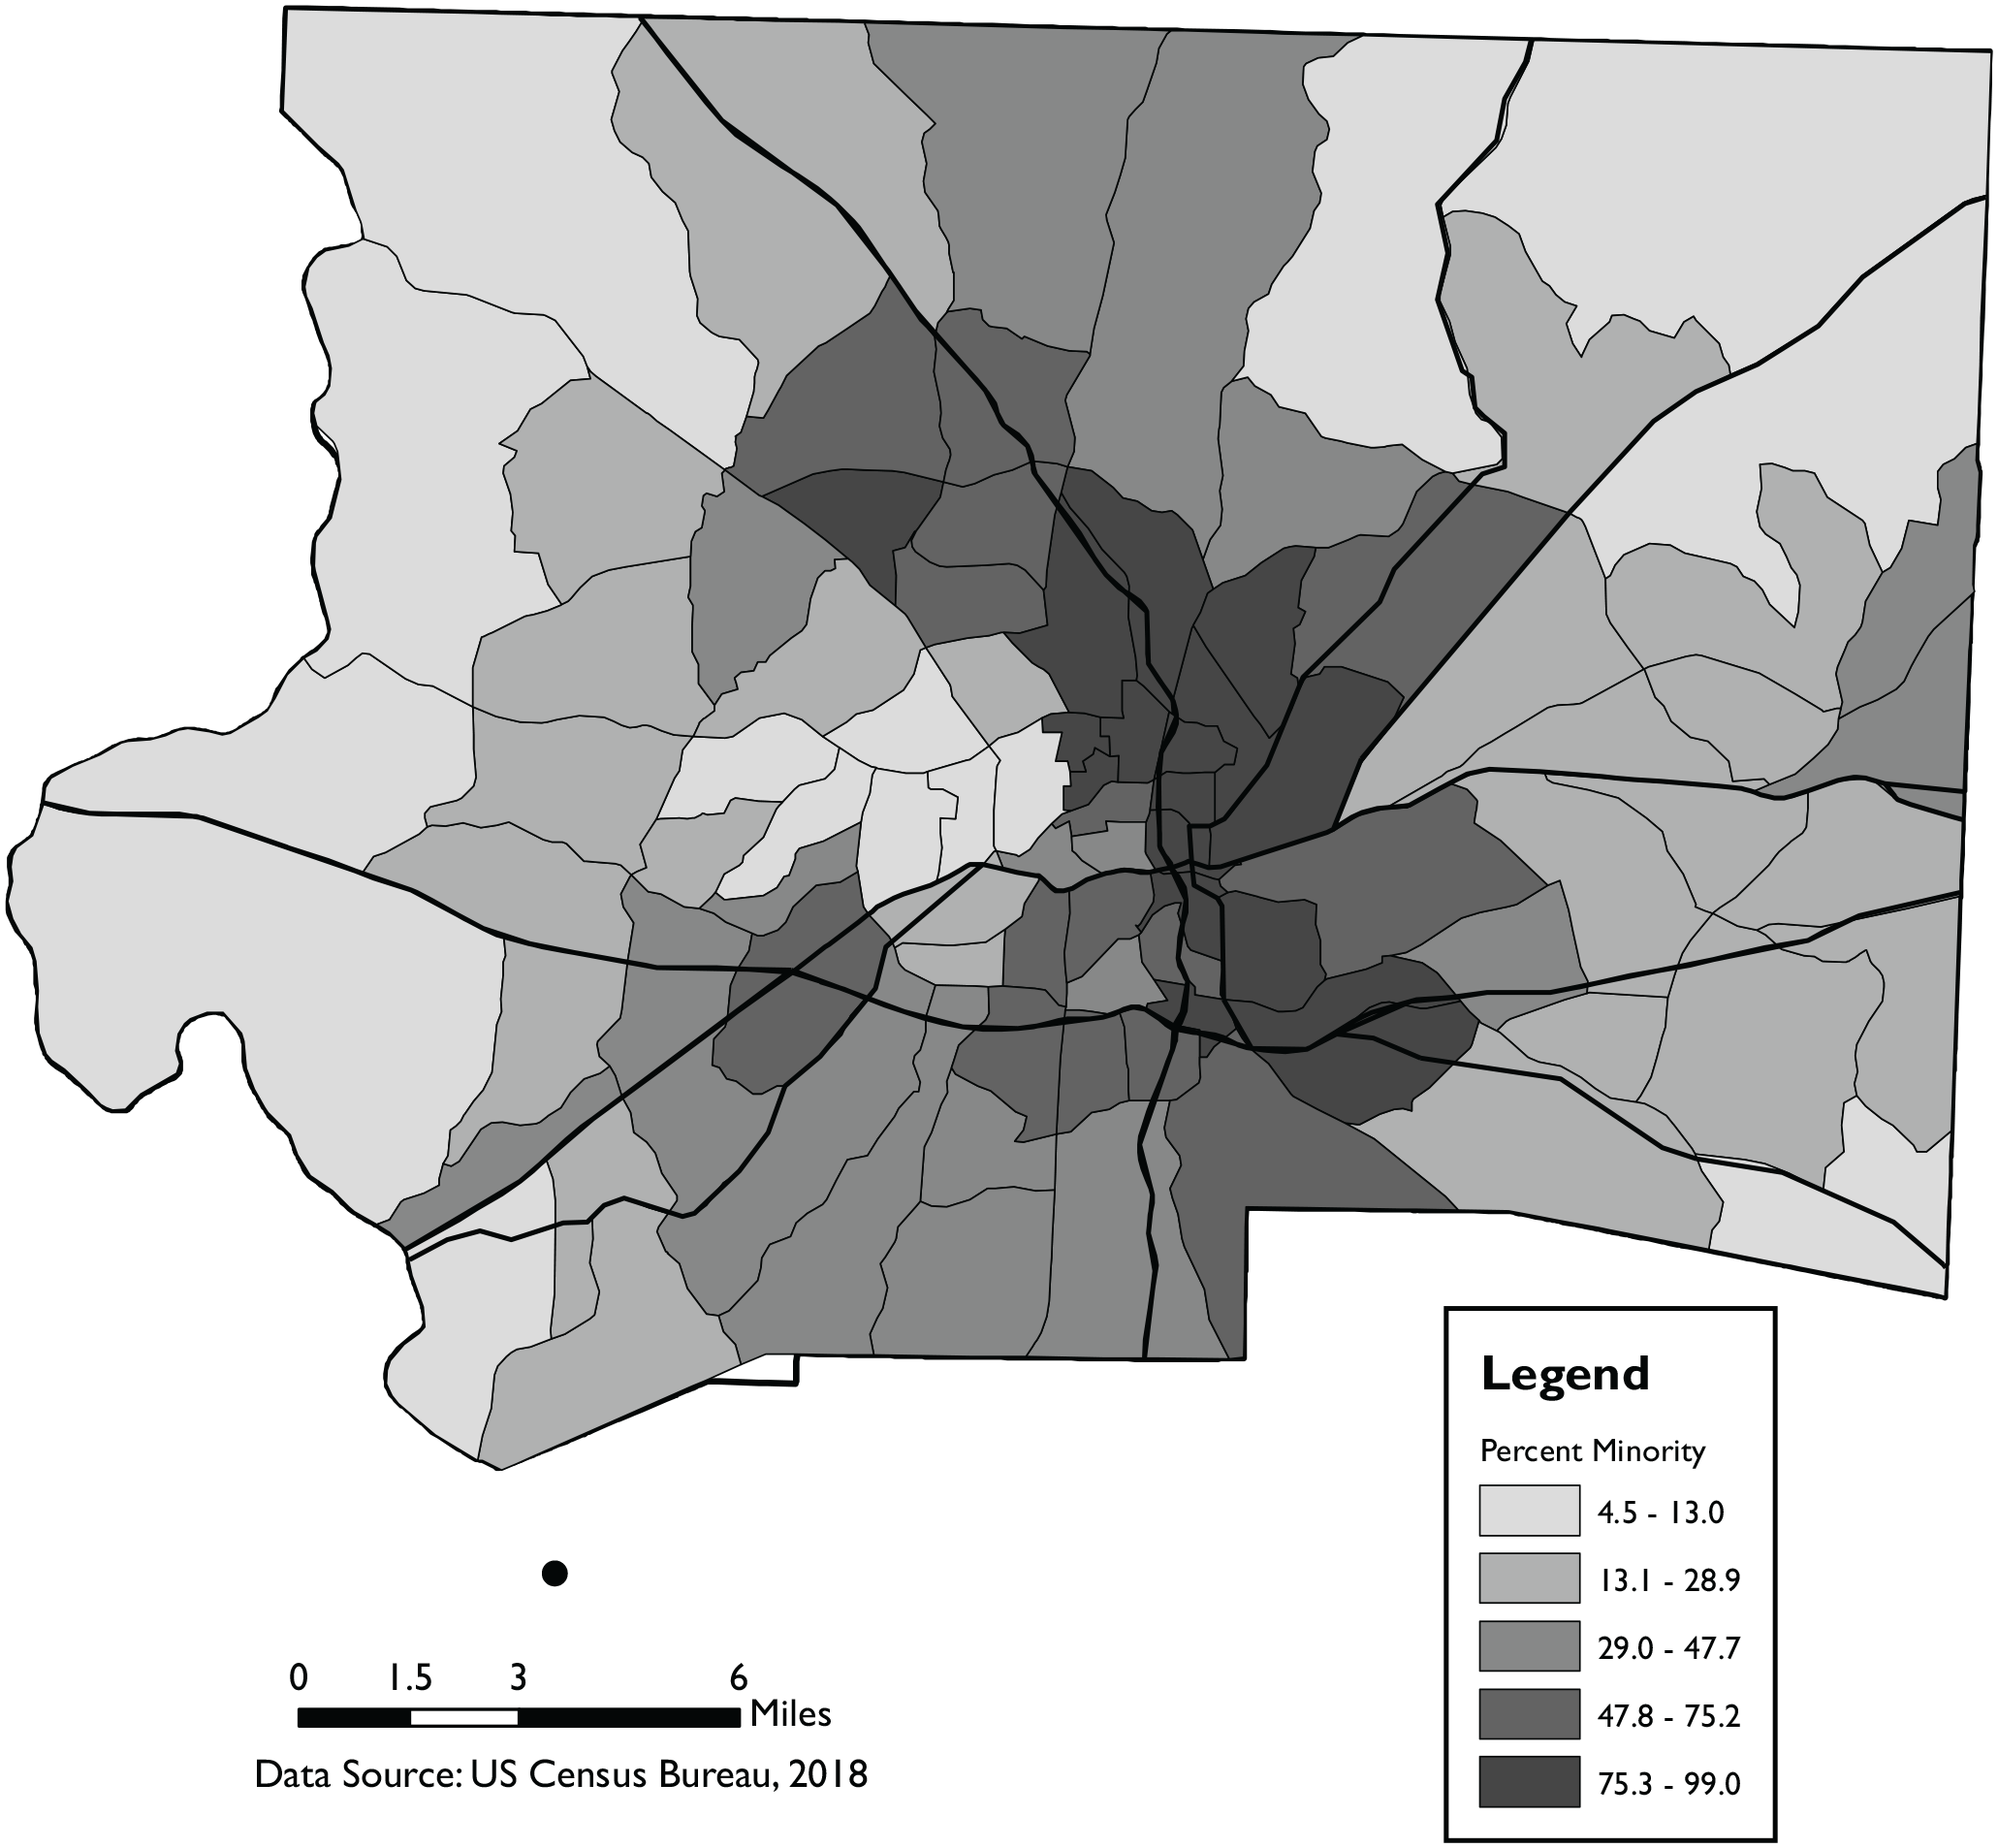
Percent of minority residents by census tract in Forsyth County.
Conclusion and Policy Implications
The estimated relationship between a more compact urban form and upward mobility was expected. As was stated earlier, Ewing et al. (2016) finds a positive relationship between more compact communities and upward mobility. This holds true for the census tracts in Forsyth County, NC. A contribution is that a significant relationship between sprawl and mobility holds when analyzed at a more refined geographic level than has been studied before. Hence, though the correlation is small, more compact tracts are correlated with higher rates of upward mobility in Forsyth County. Likewise, even though the impact of more bus stops and fewer brownfields are small, they are both positively correlated with upward mobility. More brownfields in a tract are negatively related to mobility rates and more bus stops are positively related to mobility rates. Several insights from the analysis hint toward policy recommendations for Forsyth County, which may improve economic mobility rates.
First, considering the findings from this study in tandem with those from Ewing et al. (2016), the City of Winston-Salem and Forsyth County should seek to limit sprawling development patterns that are single use, low density, and automobile dependent throughout their planning jurisdictions. This is already a goal of the community’s long-range comprehensive plan and the results of this study add credence to the importance of this policy (Legacy 2030 Comprehensive Plan 2013). Attention should be given to communities near the urban core that have been previously denser, but have experienced population decline over the years as a result of decentralization and disinvestment. This can be accomplished through several mechanisms. Local government can promote/encourage/require increased housing and population densities for proposed development. More compact development has been associated with higher levels of social capital, lower public service costs, more efficient delivery of services, and preservation of green space. For example, constructing a higher density residential development close to the urban core can result in the use of existing public facilities, the rejuvenation of older neighborhoods, and the reuse of abandoned sites.
Second, public policies that support the expansion of public transportation in the community should be encouraged as a method for improving economic mobility. One policy that would support the expansion of public transportation in the community has already been mentioned, increasing population and residential density. By increasing density, public transportation can more efficiently and frequently serve larger numbers of customers. In low upward mobility areas with many public transportation users, more bus stops and route extensions could be placed there. This would better connect low-income residents into the local economy. Innovative approaches to transportation can solve the transportation disconnect experienced by many of Forsyth County’s lower income residents (Blizard and Richardson 2020).
The community would also be wise to adopt policies and programs to combat the negative impacts of brownfields on economic mobility. One such program would be the identification of brownfields that are ripe for redevelopment. Communities can support financial and regulatory incentives to “prime the pump” on these properties. Through a pro-active redevelopment program, existing brownfield sites can be remediated and redeveloped to contribute toward improving the economic mobility. Brownfields likely discourage private investments in nearby areas, preventing economic activity and hampering opportunities from emerging there. Consequently, brownfields may decrease the upward mobility of low-income persons who are more likely to live close by (De Leon and Schilling 2017). With the redevelopment of brownfields, there is the risk of stimulating gentrification. To counteract this potential negative unintended consequence, redevelopment plans should incorporate affordable housing options for existing residents, explore the use of community trusts for shared land ownership, and encourage mixed income developments (Chetty, Hendren, and Katz 2016; Choi, Van Zandt, and Matarrita-Cascante 2018).
All of the policy recommendations discussed above are warranted, but pale in comparison with the impact of racial segregation on economic mobility. Chetty et al. (2014) and Ewing et al. (2016) both highlight the significant effect that racial segregation has on economic mobility across the United States. This holds true in Forsyth County, NC. The relationship between economic mobility and the share of minority (non-white) residents located within a census tract is negatively and highly significant. As the share of minority residents in a census tract increases, economic mobility tends to decrease. Racial segregation is not, on its own, a component of urban form and is not a focus of this study. Nevertheless, it is important to recognize that it is a byproduct of decades of public and private decisions and policies that created de facto and de jure segregated communities across the nation (Rothstein 2017). Though policy recommendations related to density, public transportation, and brownfields can aid in promoting upward economic mobility in Forsyth County, the community must also acknowledge the influence that racial segregation has on limiting economic mobility and take steps toward creating a more spatially just geography.
Further Research
The findings presented in this paper provide some insights into the relationship between urban form and economic mobility at the census tract level. However, additional research is needed that expands the analysis to the national level, beyond just a single county or region within the United States. A national examination may discover other important urban form–related variables that play key roles in promoting the upward economic mobility of low-income people.
Footnotes
Acknowledgements
We would like to thank Dr. Craig Richardson for his helpful comments on earlier versions of the paper. We would like to thank the Center for the Study of Economic Mobility for funding this research project. We would also like to thank Dr. Joseph Sloop and Map Forsyth for help with acquiring data used in the study.
Declaration of Conflicting Interests
The author(s) declared no potential conflicts of interest with respect to the research, authorship, and/or publication of this article.
Funding
The author(s) disclosed receipt of the following financial support for the research, authorship, and/or publication of this article: Center for the Study of Economic Mobility through a grant received from the Center for Advancing Opportunity and funded through the Thurgood Marshall College Fund and the Charles Koch Foundation.