
Abstract
This study highlights the interaction between cultural industries and regional innovation systems in the U.S. Metropolitan Statistical Areas (MSAs) in 2014–2015. This study finds that California plays an important role in cultural industries. Second, this study highlights that three MSAs (Los Angeles, CA; Providence, RI; and New York, NY) exhibit the most advanced cultural type, whereas thirty-three MSAs, such as Battle Creek, MI; Rome, GA; and Wenatchee, WA, show the most underdeveloped cultural type. Third, this study shows that cultural industries and patents interact positively with each other. The findings suggest that urban planners should consider their mutual relationships to develop cultural industries and regional innovation systems.
Introduction
Cultural industries have become one of the main drivers for developing societies, economies, and cultures. Most countries recognize cultural industries as one of the main strategies to promote economic growth and regional development (see, for example, Jeffcutt and Pratt 2002; Miller 2010; O’Connor 2000). Cultural industries also play a significant role in regional innovation systems because they produce their products based on intellectual property rights (Power 2002; Pratt 1997; Scott 2004, 2006). They play an important role in spillovers of knowledge to other industries (see, for example, Asheim and Isaksen 2002; Bassett, Griffiths, and Smith 2002; City of Berkeley 2017; Cooke 1992; Doloreux and Parto 2004, 2005; Maskell and Malmberg 1999).
While many scholars have focused on cultural industries, they have barely highlighted how cultural industries are associated with regional innovation systems in the U.S. Metropolitan Statistical Areas (MSAs) based on econometric models (see, for example, Banks et al. 2000; Cunningham 2002; Currid and Williams 2010; Garnham 2005; O’Connor and Wynne 1996; Power 2002; Pratt 1997). For example, Currid and Williams (2010) only explore similarities and differences of cultural industries in New York and Los Angeles. Beyers (2008) shows the spatial patterns of cultural industries at the state level. Scott (1997) highlights spatial patterns of cultural employment for selected cultural industries and MSAs. Markusen (2010) only analyzes artists in Los Angeles and the San Francisco Bay Area.
In this vein, this study differs from the previous literature as follows: first, this study explores the spatial patterns of cultural industries based on all cultural sectors, establishments, and U.S. MSAs, while most previous studies have investigated them based on one cultural industry, a small number of establishments, some regions in the United States, or other countries (see, for example, Bassett, Griffiths, and Smith 2002; Cooke 2002; Crewe 1996; Cunningham 2002; Currid and Williams 2010; Garnham 2005; Power 2002; Pratt 1997). Second, this study demonstrates cultural clusters by proposing a new Cluster Quotient (CQ) index, which enhances the conceptual and methodological framework from the Location Quotient (LQ) index. Third, this research analyzes the relationship between cultural industries and regional innovation systems by employing a Seemingly Unrelated Regression (SUR) model based on the U.S. MSAs in 2014 and 2015. To the best of my knowledge, there is no research examining the mutual relationship based on all MSAs, establishments, and cultural fields in an econometric model. The data used in this article were collected from the U.S. Census Bureau, Bureau of Economic Analysis, United States Patent and Trademark Office, and American FactFinder.
Characteristics of Cultural Industries
Cultural industries were first proposed by critical socialists Max Horkheimer and Theodor Adorno (Adorno and Horkheimer 1947). They describe how popular culture plays a pivotal role in providing standardized products (Garnham 2005). The Greater London Council of the United Kingdom expanded the concept of cultural industries in the 1980s to emphasize the role of cultural activities for economic development and regional growth (Bassett, Griffiths, and Smith 2002). This is because, since the early 1980s, cultural industries have consistently risen to prominence as a center of employment and output growth (Power and Scott 2004).
After the 1980s, many international institutes and scholars have tried to describe the definition and range of cultural industries to develop economic policies (Power 2002). After the 2000s, the term is widely used to explain cultural goods, investments flow, and services based on intellectual property rights (Bassett, Griffiths, and Smith 2002; Galloway and Dunlop 2007; Garnham 2005; Markusen and Gadwa 2010; Markusen et al. 2008; Moulaert and Sekia 2003; Power and Scott 2004; Scott 2004, 2006).
Cultural industries have been an innovation driver for many countries (Scott 2004). They are one of the important drivers for economic development and regional innovation systems (Pratt 2008). They are often regarded as a significant asset in promoting knowledge exchange and innovative effort (Asheim and Isaksen 2002; Bakhshi, McVittie, and Simmie 2008; Doloreux and Parto 2004; Maskell and Malmberg 1999; Pratt 1997; Scott 2006).
Some scholars have highlighted how cultural industries play an important role in regional innovation systems and economic development. For example, The European Union (2020) highlights that there are 1.2 million cultural establishments in the EU-28, generating EUR 192 billion of value added, equivalent to 2.7 percent of the non-financial business economy total. Walshok, Shapiro, and Owens (2013) highlight that there is a positive relationship between cultural dynamics and regional innovation systems by analyzing 128 organizations in Philadelphia, St. Louis, and San Diego. Grodach (2013) highlights that cultural industries play a significant role by analyzing twelve art spaces in four counties in Dallas and Fort Worth.
Research Methodology
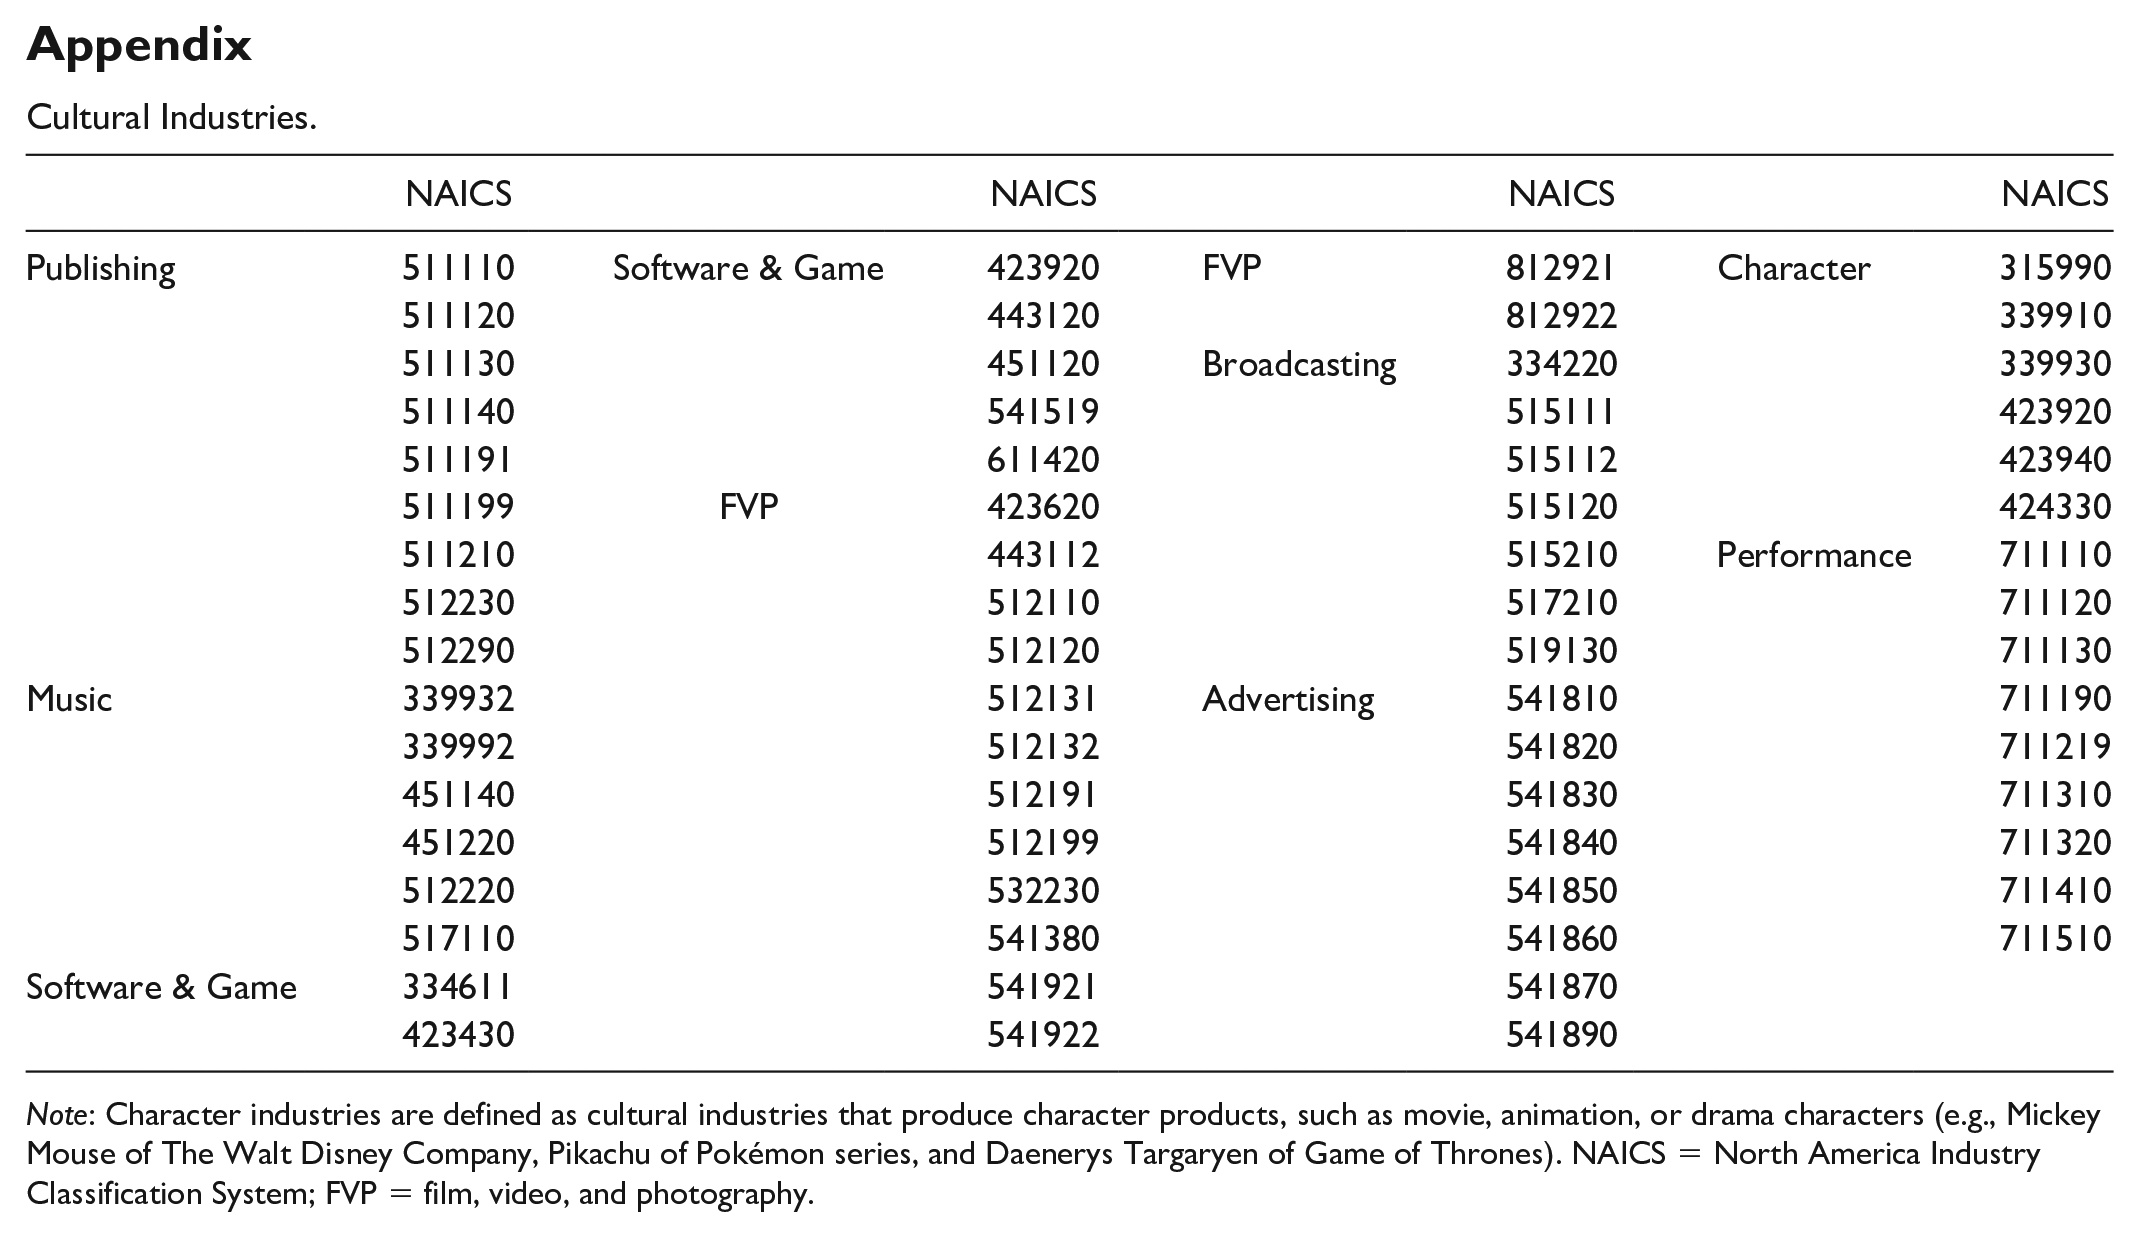
This study defines cultural industries as a broad range of industrial fields that provide cultural goods, objects, investments, activities, or services based on artistic, aesthetic, symbolic, intellectual, historical, social, economic, or creative values. The definition includes publishing; music; software and game; film, video, and photography (FVP); broadcasting; advertising; character; and performance. The study categorizes the cultural industries based on the North America Industry Classification System (NAICS; see the appendix). This article calculates the proportion of cultural industries across the U.S. MSAs (381) in 2015 as follows:

This study employs a CQ index to explore the spatial patterns of cultural clusters across the U.S. MSAs in 2015. This is because clusters are defined as geographic concentrations of interconnected businesses, suppliers, and associated institutions in a particular field (Porter 1990), and the LQ index cannot calculate the geographic concentrations of industries at all because it is only based on the number of workers. In contrast, the CQ index allows us to compute the geographic concentrations based on both the agglomeration of industries and workers. The CQ is calculated as follows:
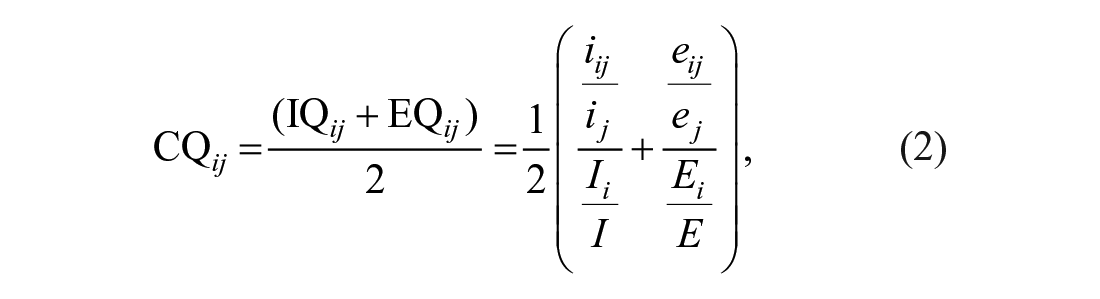
where CQ ij = Cluster Quotient, IQ ij = Industry Quotient, EQ ij = Employment Quotient, i = industries, e = employment, j = MSAs, I = industries in all MSAs, and E = employment in all MSAs. A CQ greater than 1 indicates that the region has a greater share of the cluster than the case in the reference area. If a CQ is equal to 1, then the region has the same share of the cluster as it does in the reference area.
This study employs cluster analysis to categorize cultural industries based on CQ values, the Ward method, and Euclidean squared distance in IBM SPSS Statistics 24. Cluster analysis is a methodology for the task of assigning a set of objects into groups so that objects in the same cluster are more similar to each other than those in other clusters. This article uses the scale readjustment method for the standardization to prevent a phenomenon in which the extreme value distorts the total index. The equation is as follows:

The Ward method is a clustering methodology for hierarchical cluster analysis based on a general agglomerative hierarchical clustering procedure, where the criterion for selecting the pair of clusters to merge at each step is based on the optimal value of an objective function. The Squared Euclidean Distance (SED) is the square of the standard Euclidean distance, which is the length of the line segment connecting two points. To be specific, the Ward method creates clusters by minimizing the total within-cluster variance based on the initial cluster distances calculated by the SED. The Ward method and SED are as follows (see equations (4) and (5), respectively).

where ||x|| is the square root of the sum of the squares of the elements of x (the Euclidean length of the vector x), NK is the number of observations in CK, CK is the Kth cluster, a subset of {1, 2, . . ., n}, and xK is the mean vector for the cluster CK.

Last, this study employs SUR models to investigate the relationship between cultural industries and regional innovation systems. SUR, suggested by Arnold Zellner (1962), is a generalization of a linear regression model that consists of some regression equations and has been widely adopted by many authors (see, for example, Carlson 1978; Greene 2012; Kakwani 1967).
This study employs the SUR model for empirical analyses as the SUR model allows the author to consider the mutual relationship between cultural industries and regional innovation systems. To be specific, the author should develop a set of equations for cultural industries and regional innovation systems to reflect the interaction. While other statistical models, such as Ordinary Least Square (OLS), can have several linear equations, they have a severe problem when the error terms are correlated. The SUR model solves the problem by considering the error terms correlated into the model with unbiased estimators for the parameters by joint analysis of cultural industries and regional innovation systems. The SUR model in this study consists of two equations as follows:
Cultural industries2015 (or CQ2015) = f (the patents2014, population2015, the specialization of knowledge-based industries2015, and the diversity of knowledge-based industries2015).
The patents2015 = f (Cultural industries2014 [or CQ2014], labor stock2015, capital stock2015, an industrial environment2015 [the number of all industries], demographic variables2015 [the proportion of whites, blacks, Asians, and foreigners], educational achievement2015 [the proportion of the bachelor’s degree above]).
This study sets a time lag (one year) between cultural industries (or CQ) and the patents to remove the simultaneity problem. The time lag allows the model to estimate the causal link between cultural industries and patents correctly. In this paper, the first equation estimates the effect of the patents on cultural industries (or CQ). The number of cultural industries (or the CQ value) is the dependent variable, and this study adds three explanatory variables; the population and the specialization and diversity of knowledge-based industries (this study defines knowledge-based industries based on European Commission 2012; Industry Canada and the Business Development Bank of Canada 1996; National Science Foundation 2014; and Organisation for Economic Co-Operation and Development 2006, such as information, finance and insurance, professional, scientific, and technical services, and educational services. Available on request). The specialization and the diversity of knowledge-based industries are calculated as follows:


where Sij denotes the share of industry j in city i, and Sj is the share of industry j in national employment (Duranton and Puga 2000).
In the second equation, the patents are the dependent variable for the regional innovation systems. According to the existing literature, patents are a commonly used measure of the innovative intensity of establishments and industries (see, for example, Acs, Anselin, and Varga 2002; Ahuja 2000; Bottazzi and Peri 2003). This study employs the Cobb–Douglas function to estimate the productivity of cultural industries (or CQ). The study sets some control variables, such as the industrial environment, population composition, and educational achievement. This study also employs OLS models to verify error terms correlated in the SAS 9.4 software program. All variables are transferred into log values except percentage variables for the OLS and SUR models.
The Spatial Patterns of Cultural Industries
This study first explores the proportion of cultural industries across all U.S. MSAs (381) in 2015. This article finds that Los Angeles, CA, and New York, NY, play an important role in cultural industries (see Table 1). For example, Los Angeles, CA, placed first in FVP and performance, and New York, NY, ranked first in publishing, music, software and game, broadcasting, advertising, and character.
The Ranking of Cultural Industries.
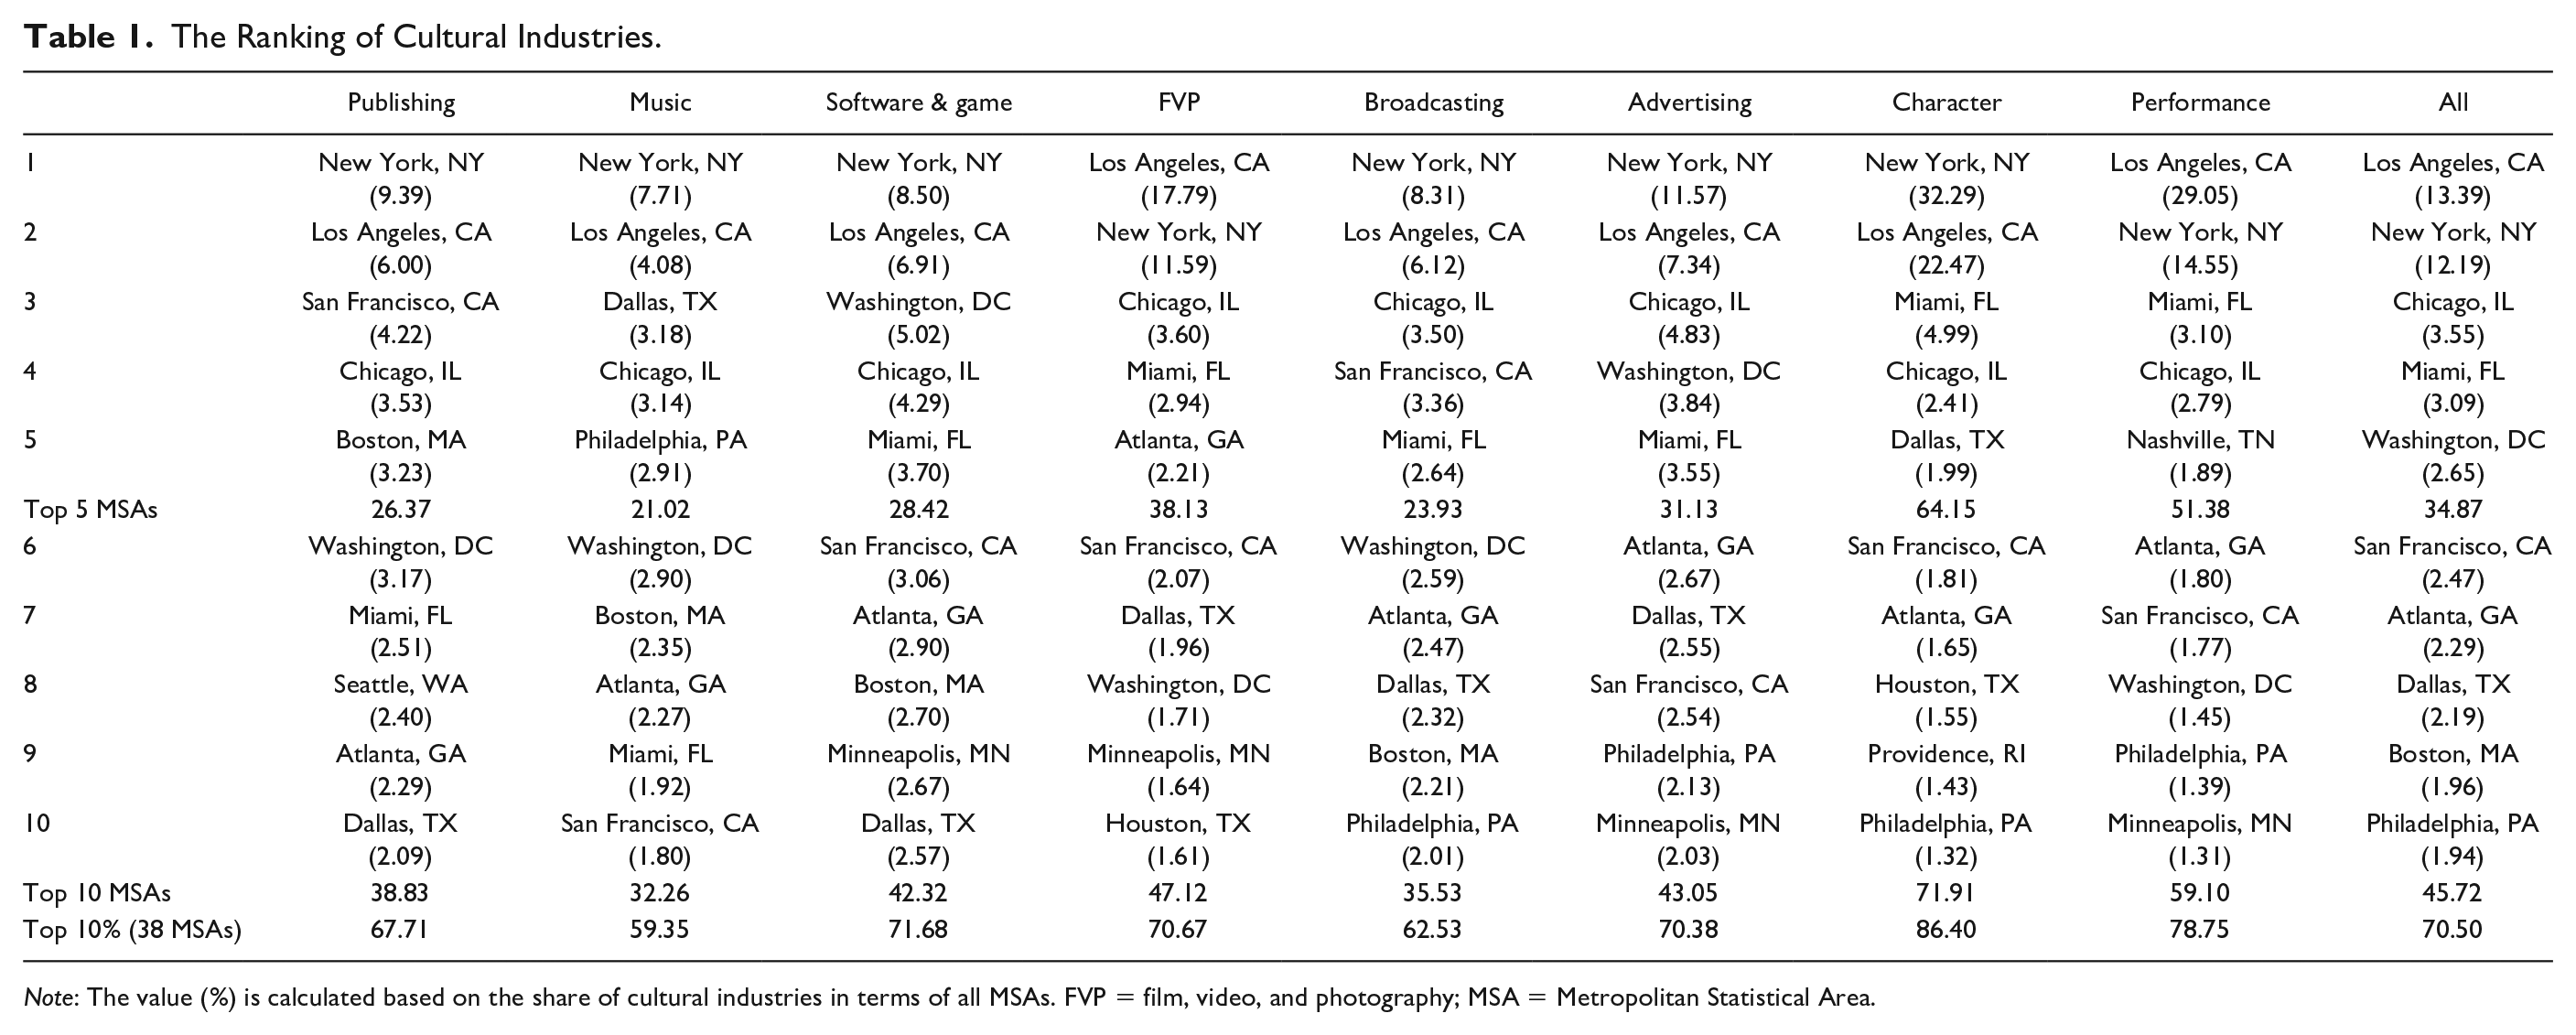
Note: The value (%) is calculated based on the share of cultural industries in terms of all MSAs. FVP = film, video, and photography; MSA = Metropolitan Statistical Area.
When we explore the top five MSAs by each industrial field, character and performance industries show the share higher than 50 percent (character: 64.15% and performance: 51.38%), whereas music and broadcasting industries have the share lower than 25 percent (21.02% and 23.93%, respectively). The results show that the concentration of cultural industries is differentiated by industrial fields. The concentration of cultural industries is in the top five MSAs as follows: character > performance > FVP > advertising > software and game > publishing > broadcasting > music.
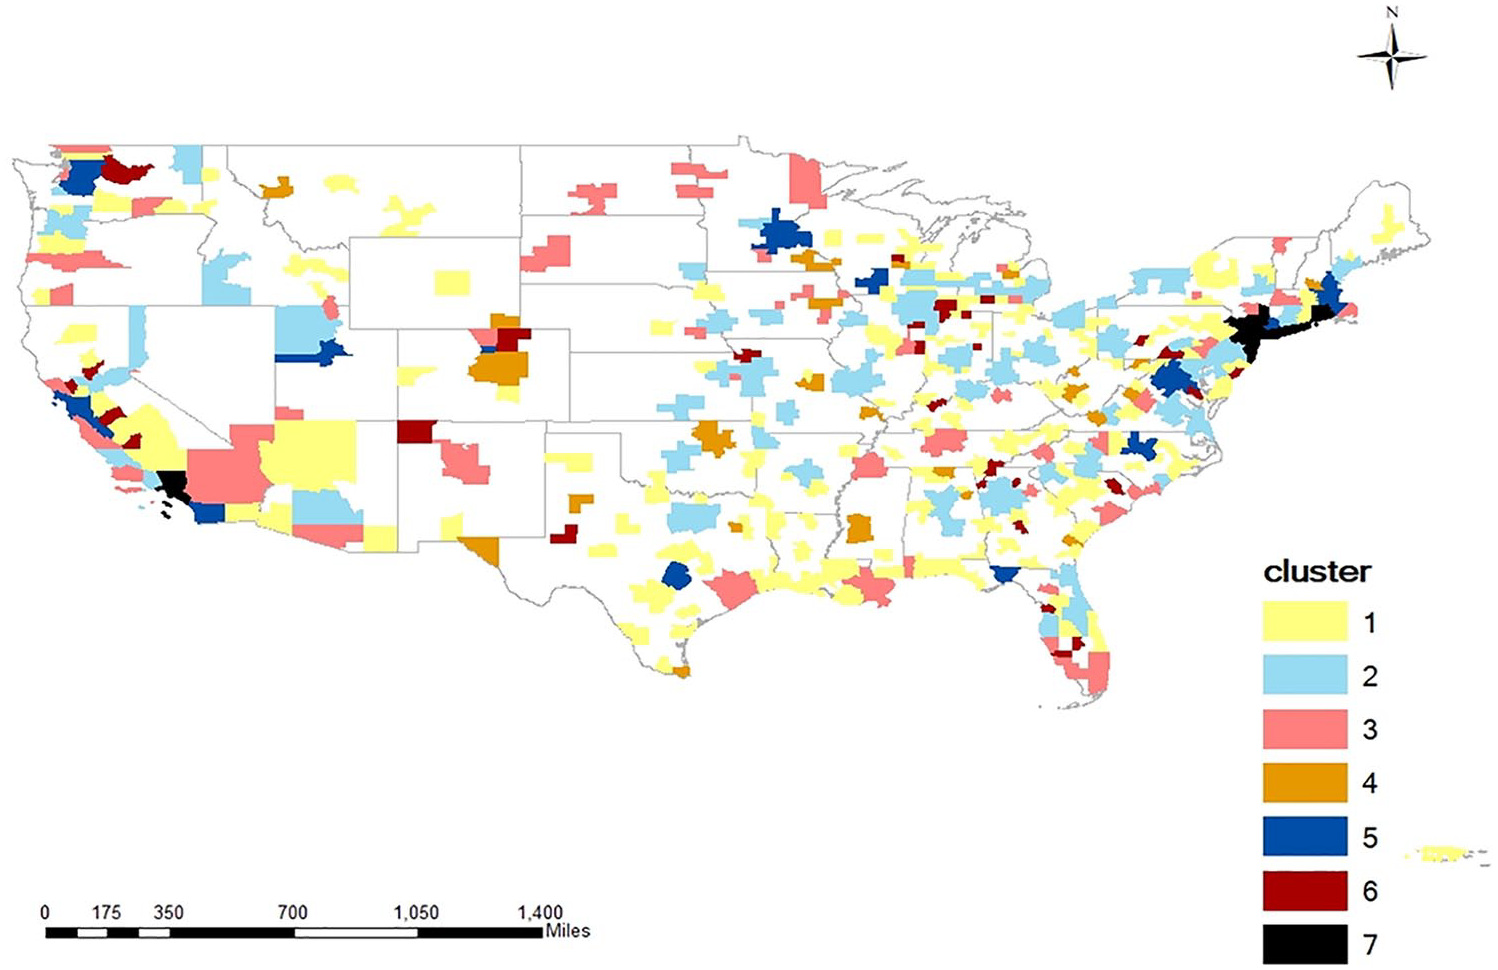
Next, this study analyzes the CQ values across U.S. MSAs in 2015. This study finds that cultural industries are clustered in CA (see Figures 1 and 2). For instance, Los Angeles (2.35), San Jose (2.19), and San Francisco (1.64) place first, second, and third, respectively (see Table 2). New York, NY (1.53) ranks fourth with a CQ value higher than 1.50, meaning that New York, NY, also plays a crucial role in cultural industries. The findings of this research are consistent with prior studies (see, for example, Americans for the Arts 2017; Nation Endowments for the Arts 2014; U.S. Bureau of Economic Analysis 2016).
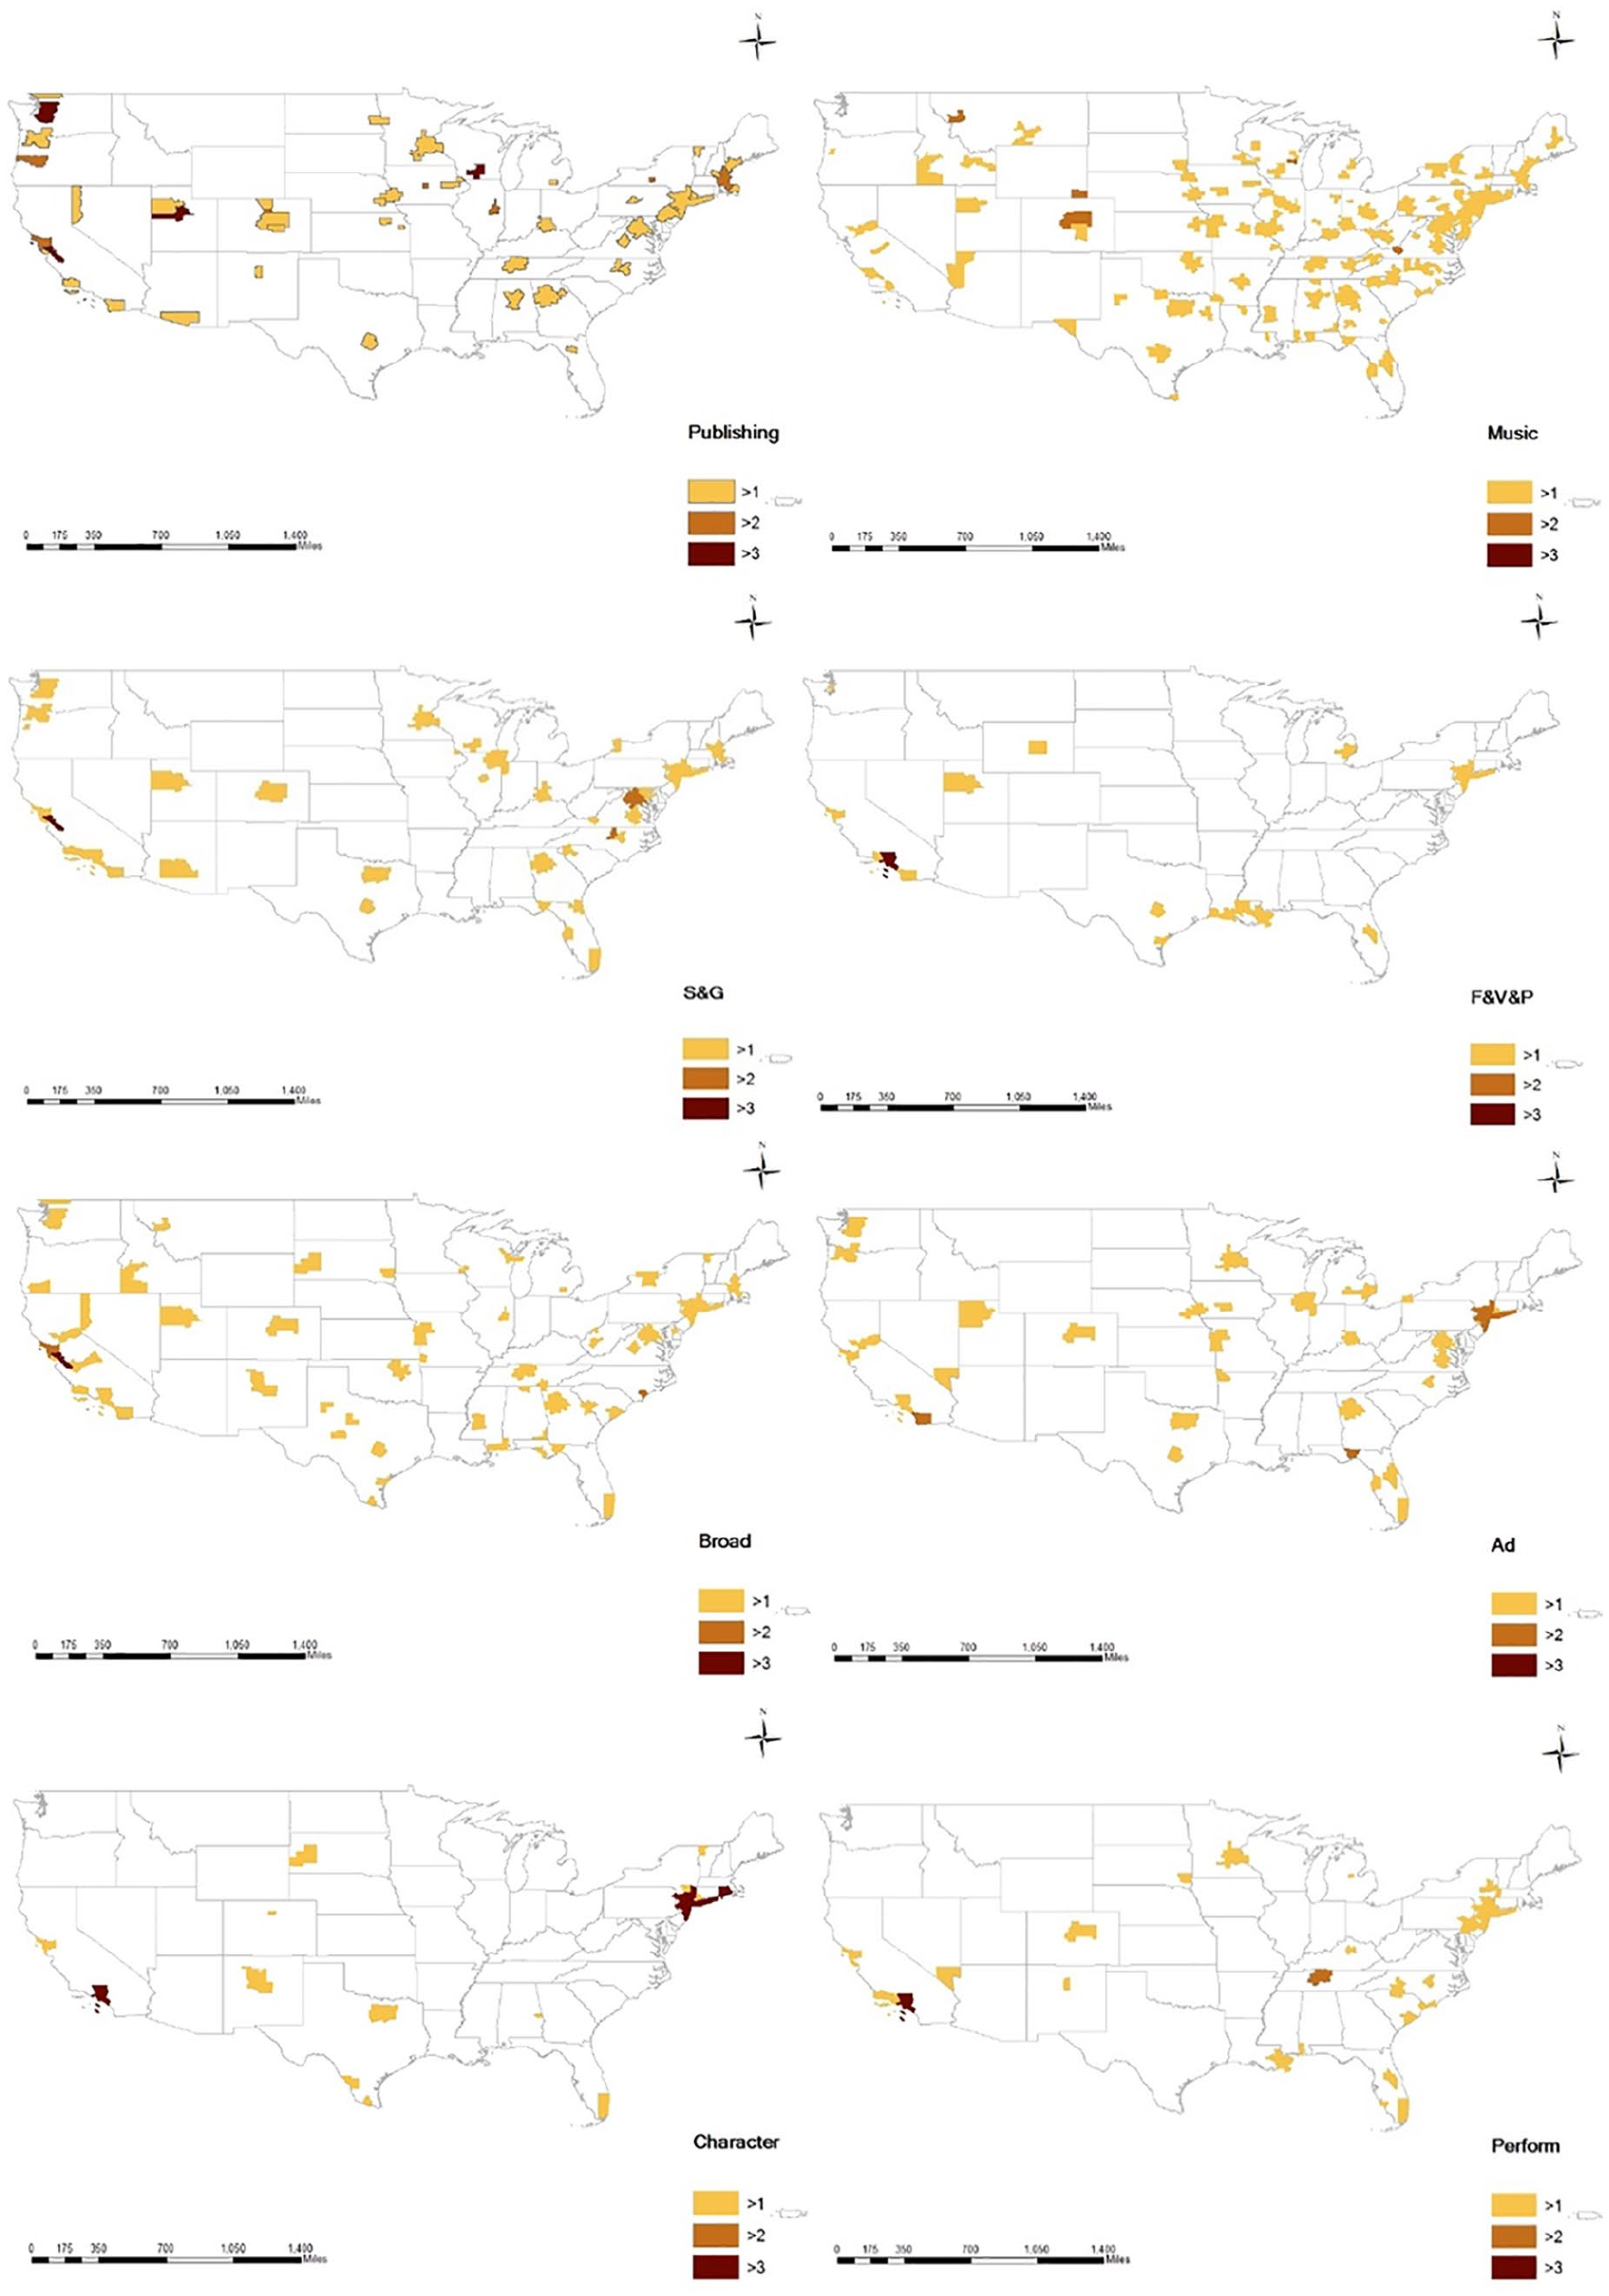
The spatial patterns of CQ values across U.S. MSAs by industrial fields.
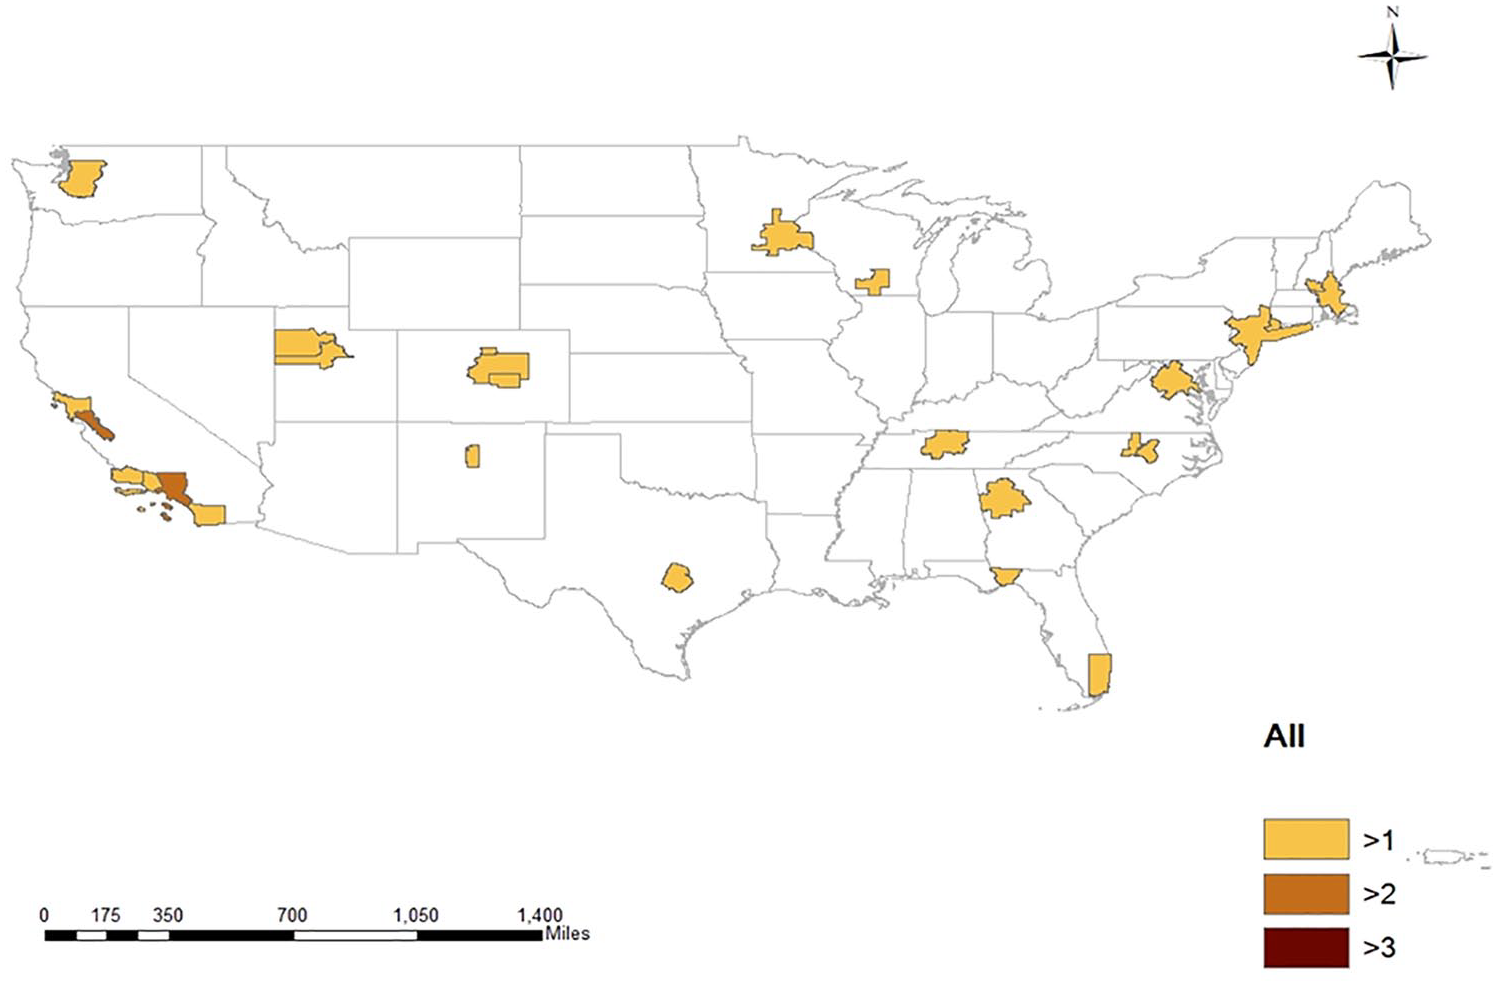
The spatial pattern of CQ values of all cultural industries in U.S. MSAs.
The Ranking of CQ Values in MSAs.
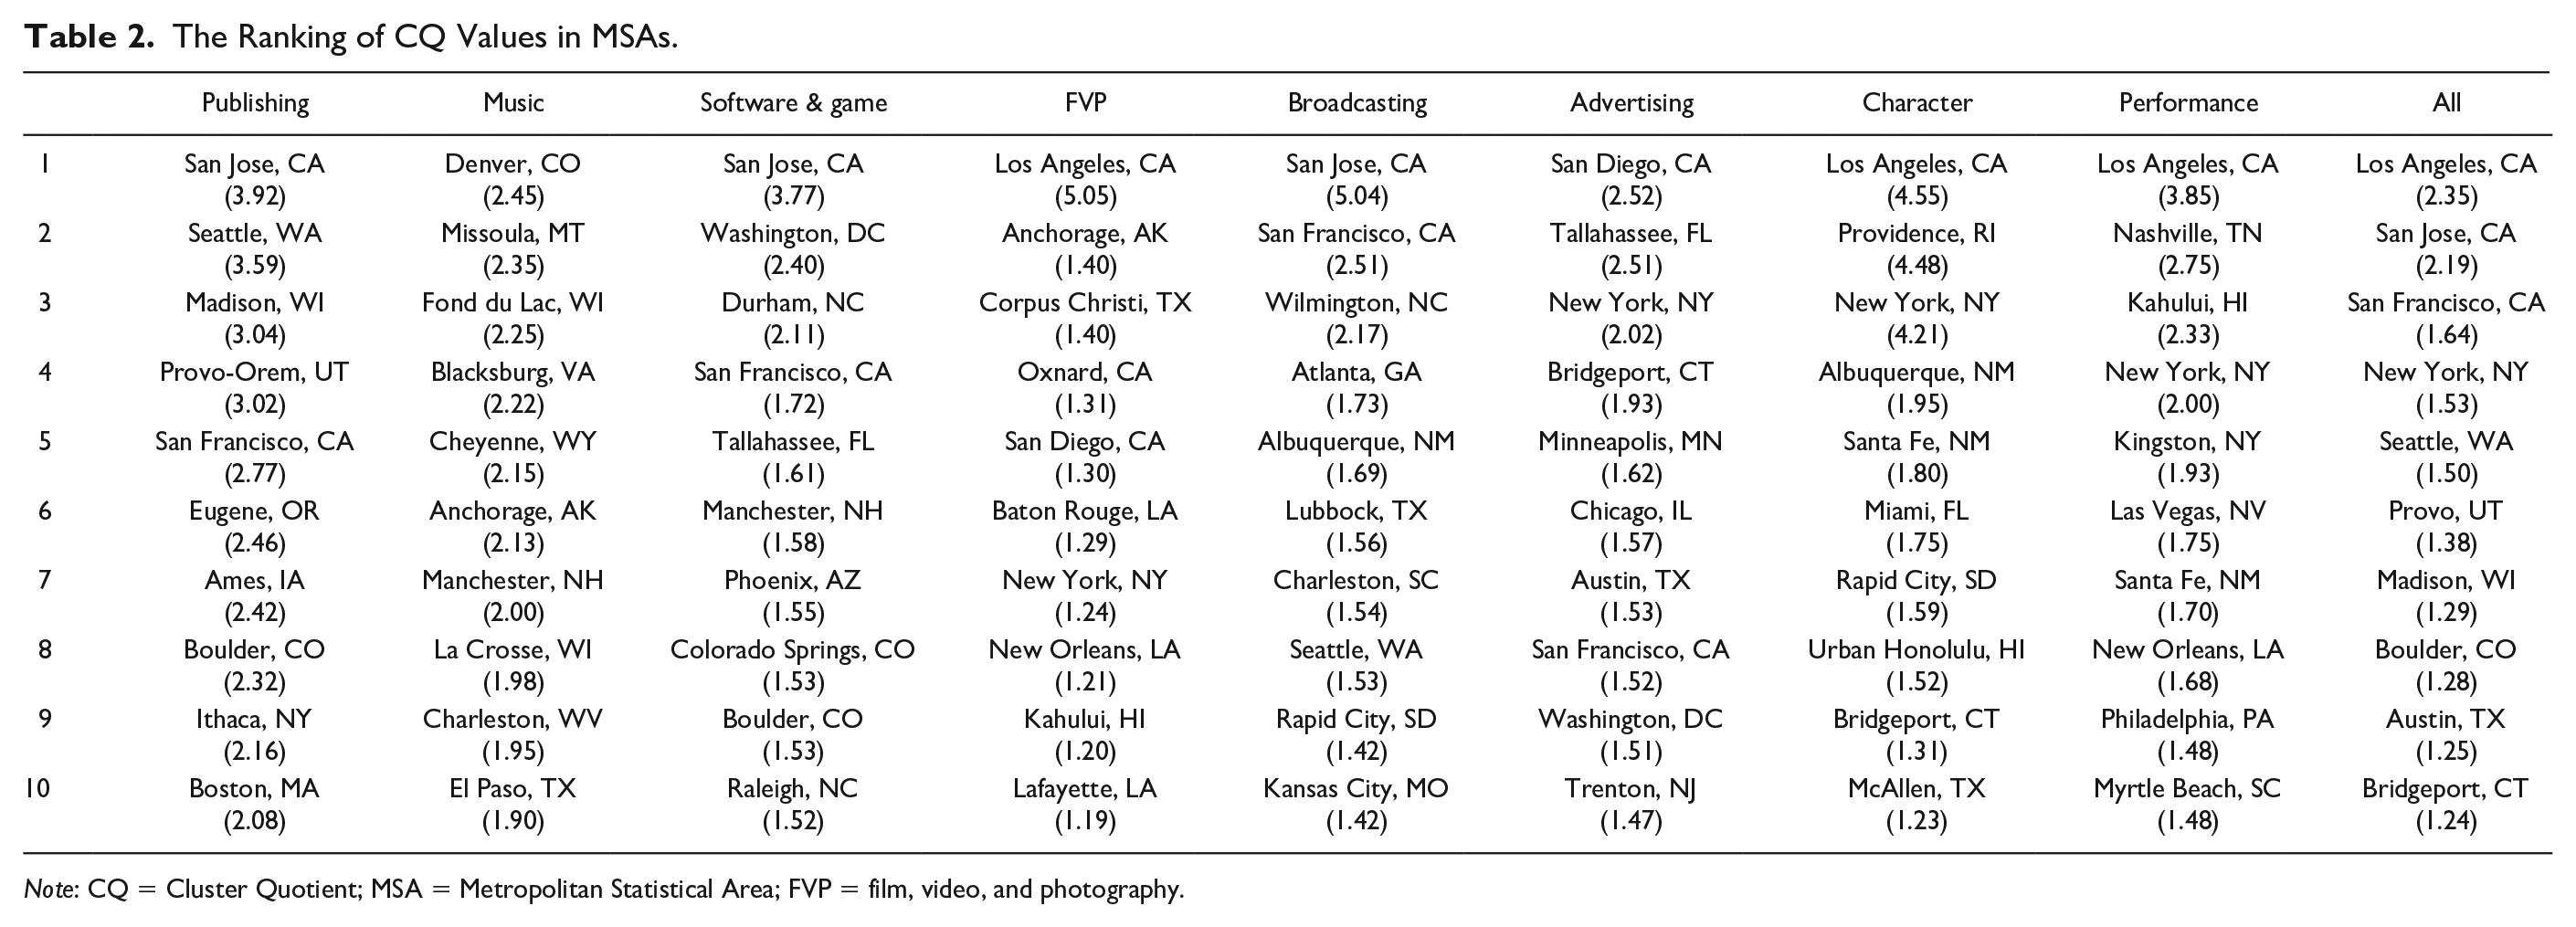
Note: CQ = Cluster Quotient; MSA = Metropolitan Statistical Area; FVP = film, video, and photography.
Cluster Characteristics of Cultural Industries
This study categorizes the U.S. metropolitan areas into seven groups (see Figure 3 and Table 3). Type 1 has the highest number of MSAs (178), whereas type 7 shows the lowest number of MSAs (3). The characteristics of each type are as follows (see Figure 4).
Cluster types of cultural industries.
Descriptive Statistics of Cluster Analysis.
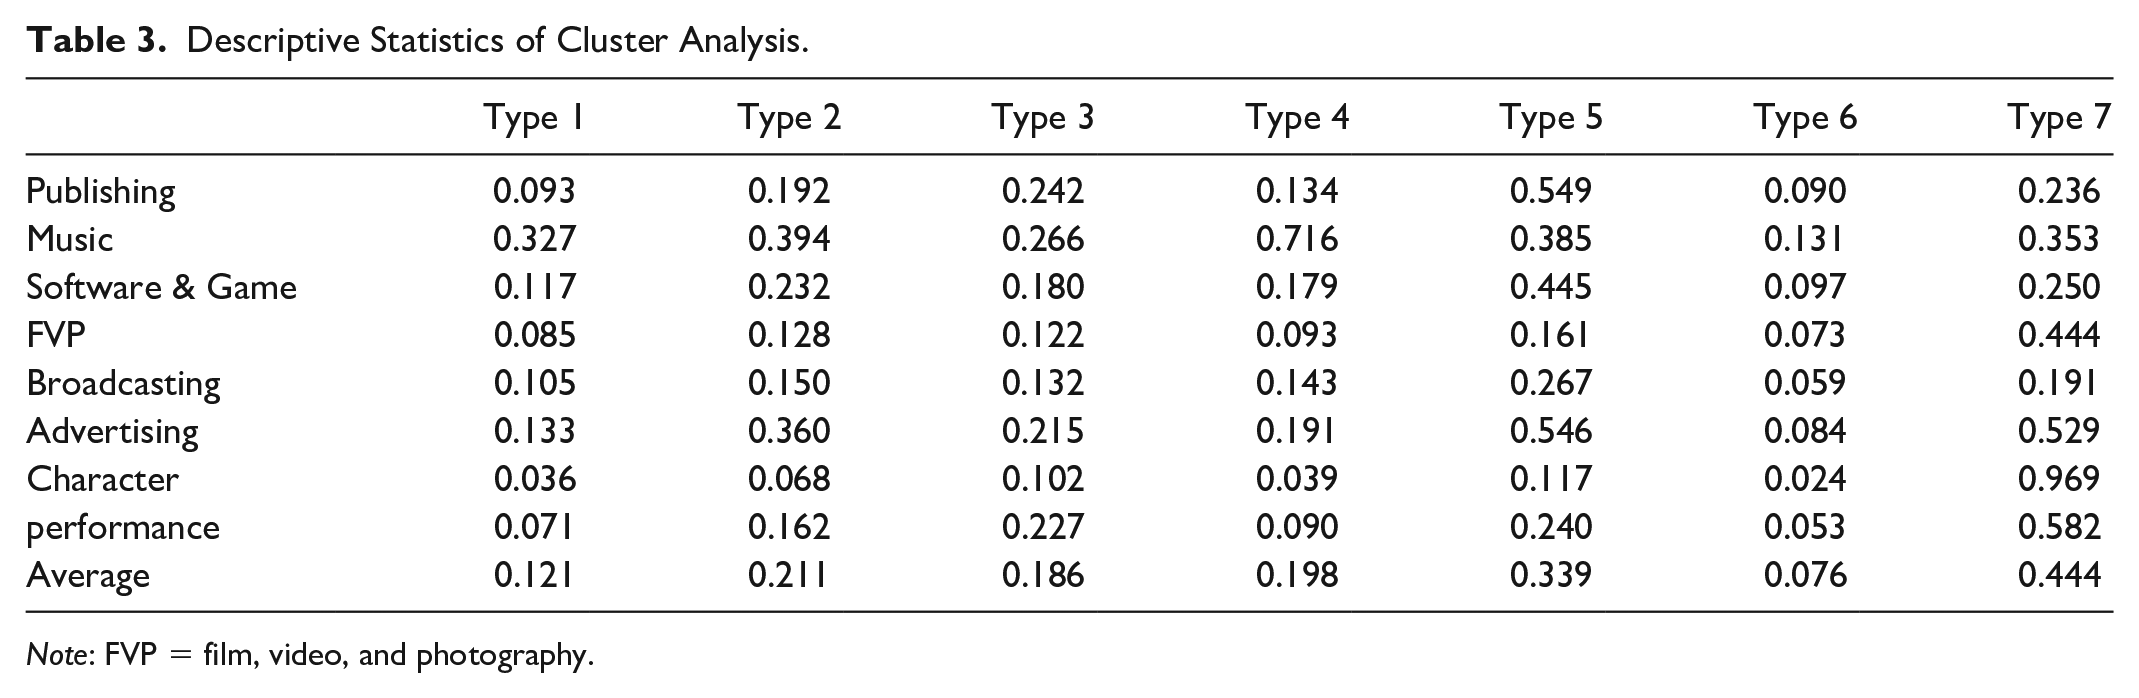
Note: FVP = film, video, and photography.
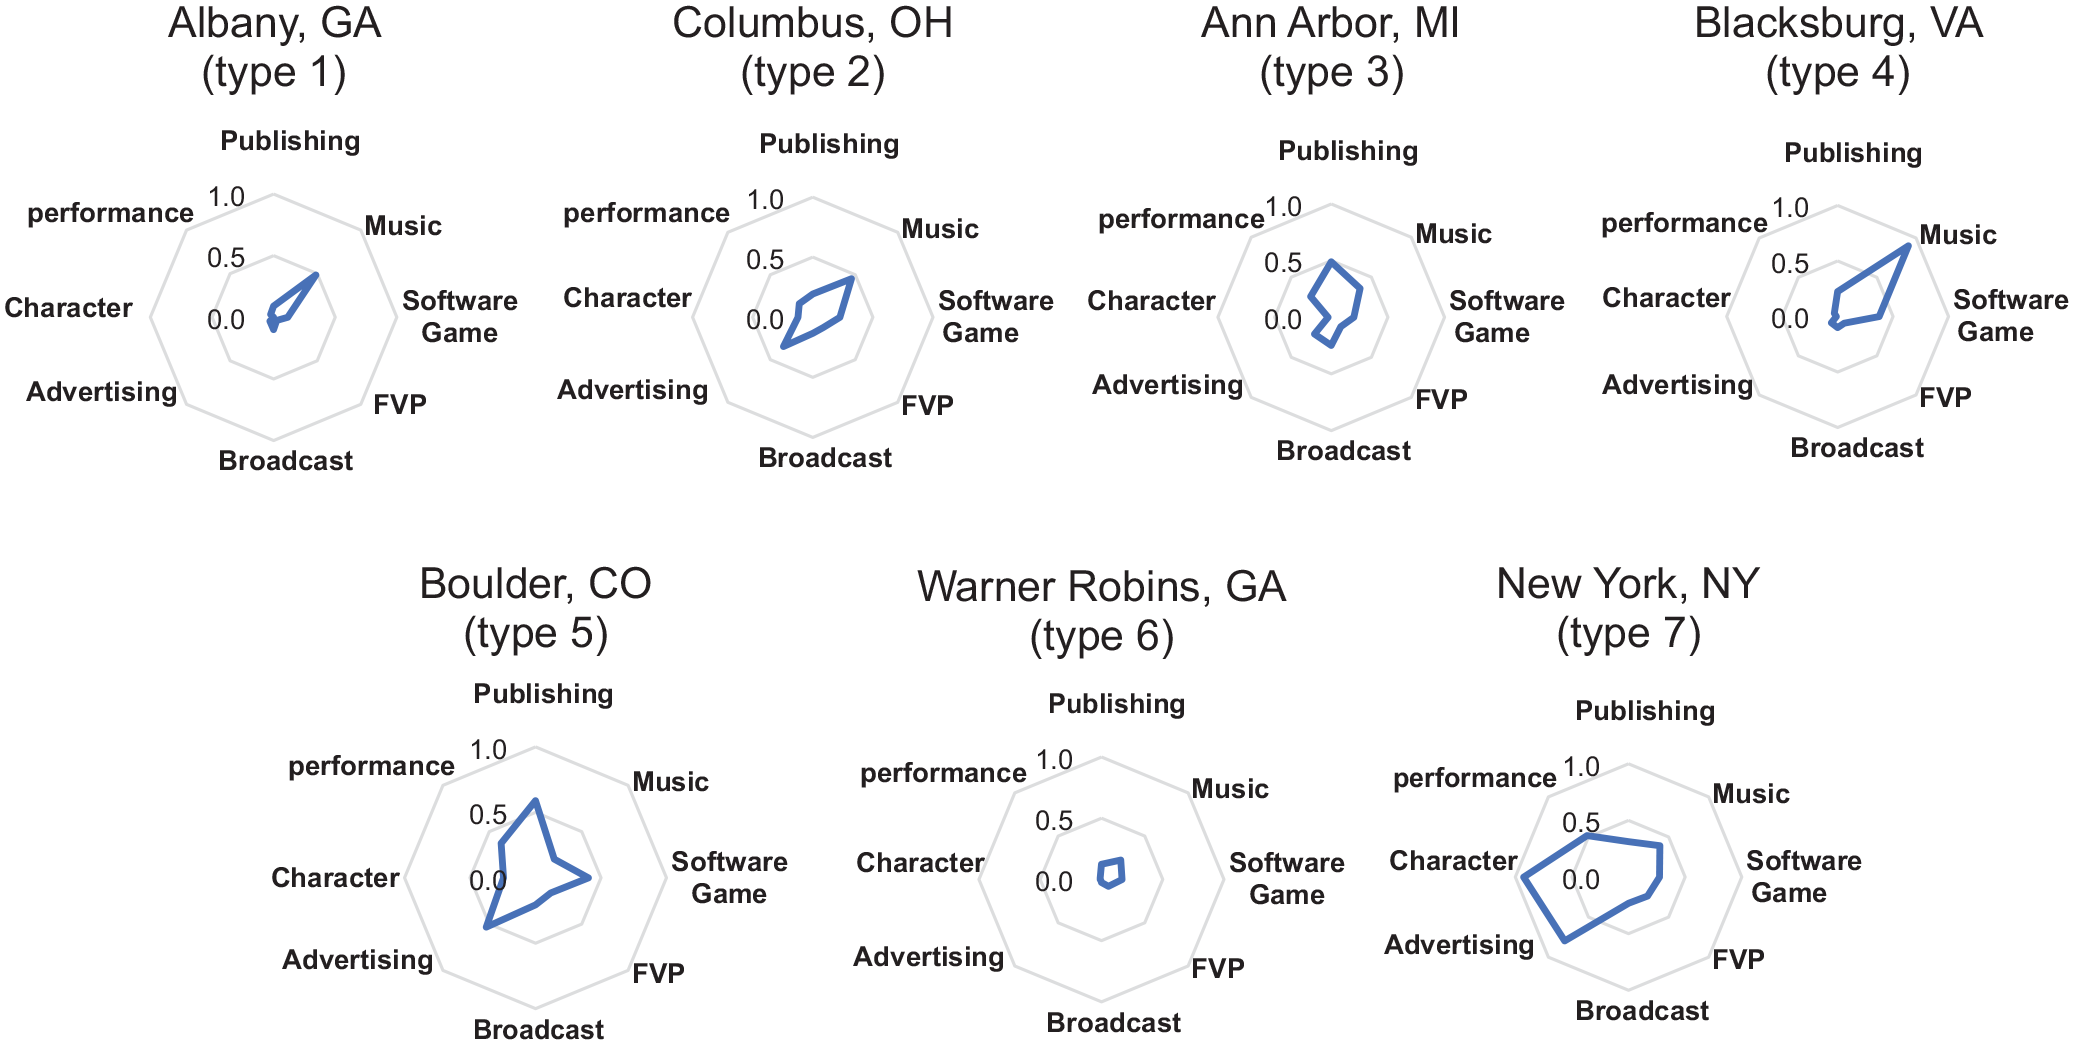
Examples of cluster types.
Type 1: Non-Specialization of Cultural Industries
Type 1 consists of 178 MSAs, such as Abilene, TX; Bay City, MI; and Greenville, NC. The MSAs do not have specialized cultural industrial fields. Type 1 shows the second lowest average value among seven types. Many MSAs are located in the South and the West regions, such as Montana and Idaho.
Type 2: Specialization of Music and Advertising
Type 2 shows developed music and advertising industries in sixty-four MSAs, such as Dallas, TX; Jacksonville, FL; and Wichita, KS. It shows the second highest average value in music after type 4 and the third highest average value in advertising after type 5 and type 7. Many MSAs are located in the Midwest region.
Type 3: Specialization of Publishing
Type 3 shows advanced publishing industries in sixty-one MSAs, such as Ames, IA; Gainesville, FL; and Salinas, CA. It has the second highest average value in publishing after type 5. The MSAs in type 3 are largely located in the west side of California and the south side of Florida along the ocean.
Type 4: Specialization of Music
Type 4 reveals developed music industries in twenty-seven MSAs, such as Anchorage, AK; Blacksburg, VA; and Denver, CO. Type 4 shows the highest average value (0.716) in music, which is about 1.8 times higher than that of the second ranked type 2. MSAs are barely located in the Midwest and the Northeast regions.
Type 5: Specialization of Publishing and Advertising
Type 5 has advanced publishing and advertising industries (fifteen MSAs). Overall, type 5 shows a high value in all cultural fields. For example, it shows the highest value in publishing, advertising, software and game, and broadcasting, and the second highest value in other cultural industry fields except for music. MSAs are relatively concentrated in the West and the South regions.
Type 6: Insufficiency of Cultural Industries
Type 6 shows underdeveloped cultural industries in thirty-three MSAs, such as Battle Creek, MI; Rome, GA; and Wenatchee, WA. Type 6 shows the lowest average value (0.076) among seven cluster types (type 1: 0.121, type 2: 0.211, type 3: 0.186, type 4: 0.198, type 5: 0.339, and type 7: 0.444). Many MSAs are located in the Midwest and South regions.
Type 7: Specialization of Character
Type 7 shows the specialized character industries (three MSAs: Los Angeles, CA; Providence, RI; and New York, NY). Type 7 is the most developed cultural type as it has the highest value (0.444) among seven types (type 1: 0.121, type 2: 0.211, type 3: 0.186, type 4: 0.198, type 5: 0.339, and type 6: 0.076) and represents the highest value in character industries (0.969) among seven types (type 1: 0.036, type 2: 0.068, type 3: 0.102, type 4: 0.039, type 5: 0.117, and type 6: 0.024). MSAs are only located in the West and the Northeast regions.
The Relationship between Cultural Industries and Regional Innovation Systems
This study employs OLS and SUR models to explore the relationship between cultural industries and regional innovation systems (see Table 4 for descriptive statistics and abbreviations of Table 5). This study finds that there are significant differences between them, meaning that the error terms are correlated (see Table 5). The OLS model underestimates the effect of patents on cultural industries and CQ (OLS: 0.160 and 0.119 and SUR: 0.215 and 0.161, respectively). The OLS model also exhibits the elasticity of cultural industries and CQ insignificantly, even though they exert a positive impact on the patents at the .01 level in SUR (OLS: 0.080 and 0.305 insignificantly and SUR: 0.908 and 1.178 at the .01 level, respectively). The results show that the OLS model can bring a biased result and the SUR model would be a better model than the OLS model to understand the relationship between cultural industries and patents. In contrast, capital stock is highly significant at the .01 level with an elasticity of 1.078 in OLS, whereas it is insignificant for the patents in SUR. This result implies that scholars may misunderstand the effect of capital stock on the patents when they do not consider the interaction between cultural industries and patents.
Descriptive Statistics for Empirical Models.
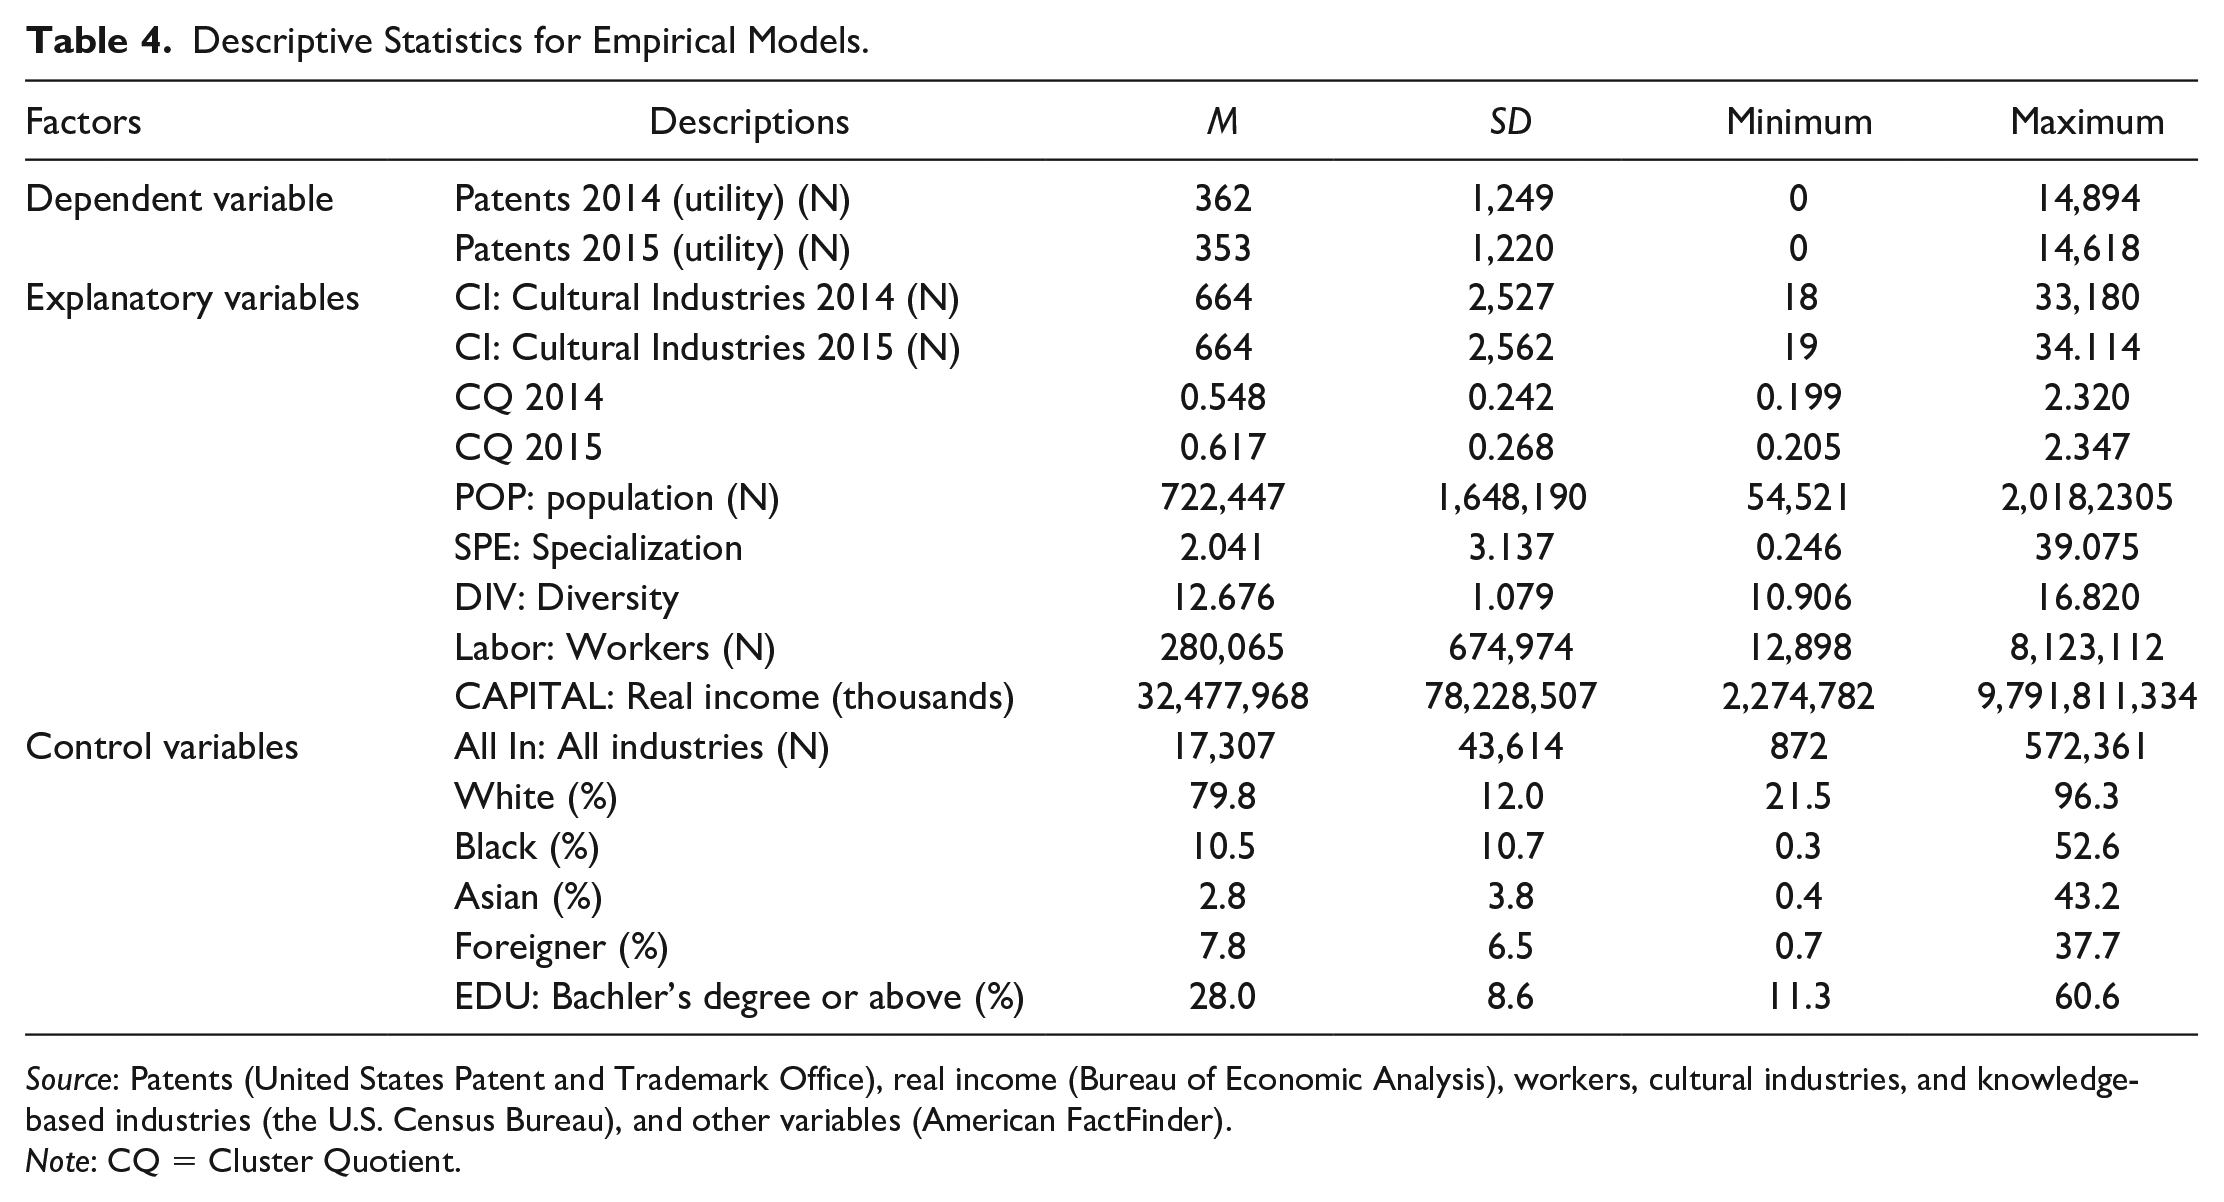
Source: Patents (United States Patent and Trademark Office), real income (Bureau of Economic Analysis), workers, cultural industries, and knowledge-based industries (the U.S. Census Bureau), and other variables (American FactFinder).
Note: CQ = Cluster Quotient.
The results between OLS and SUR.
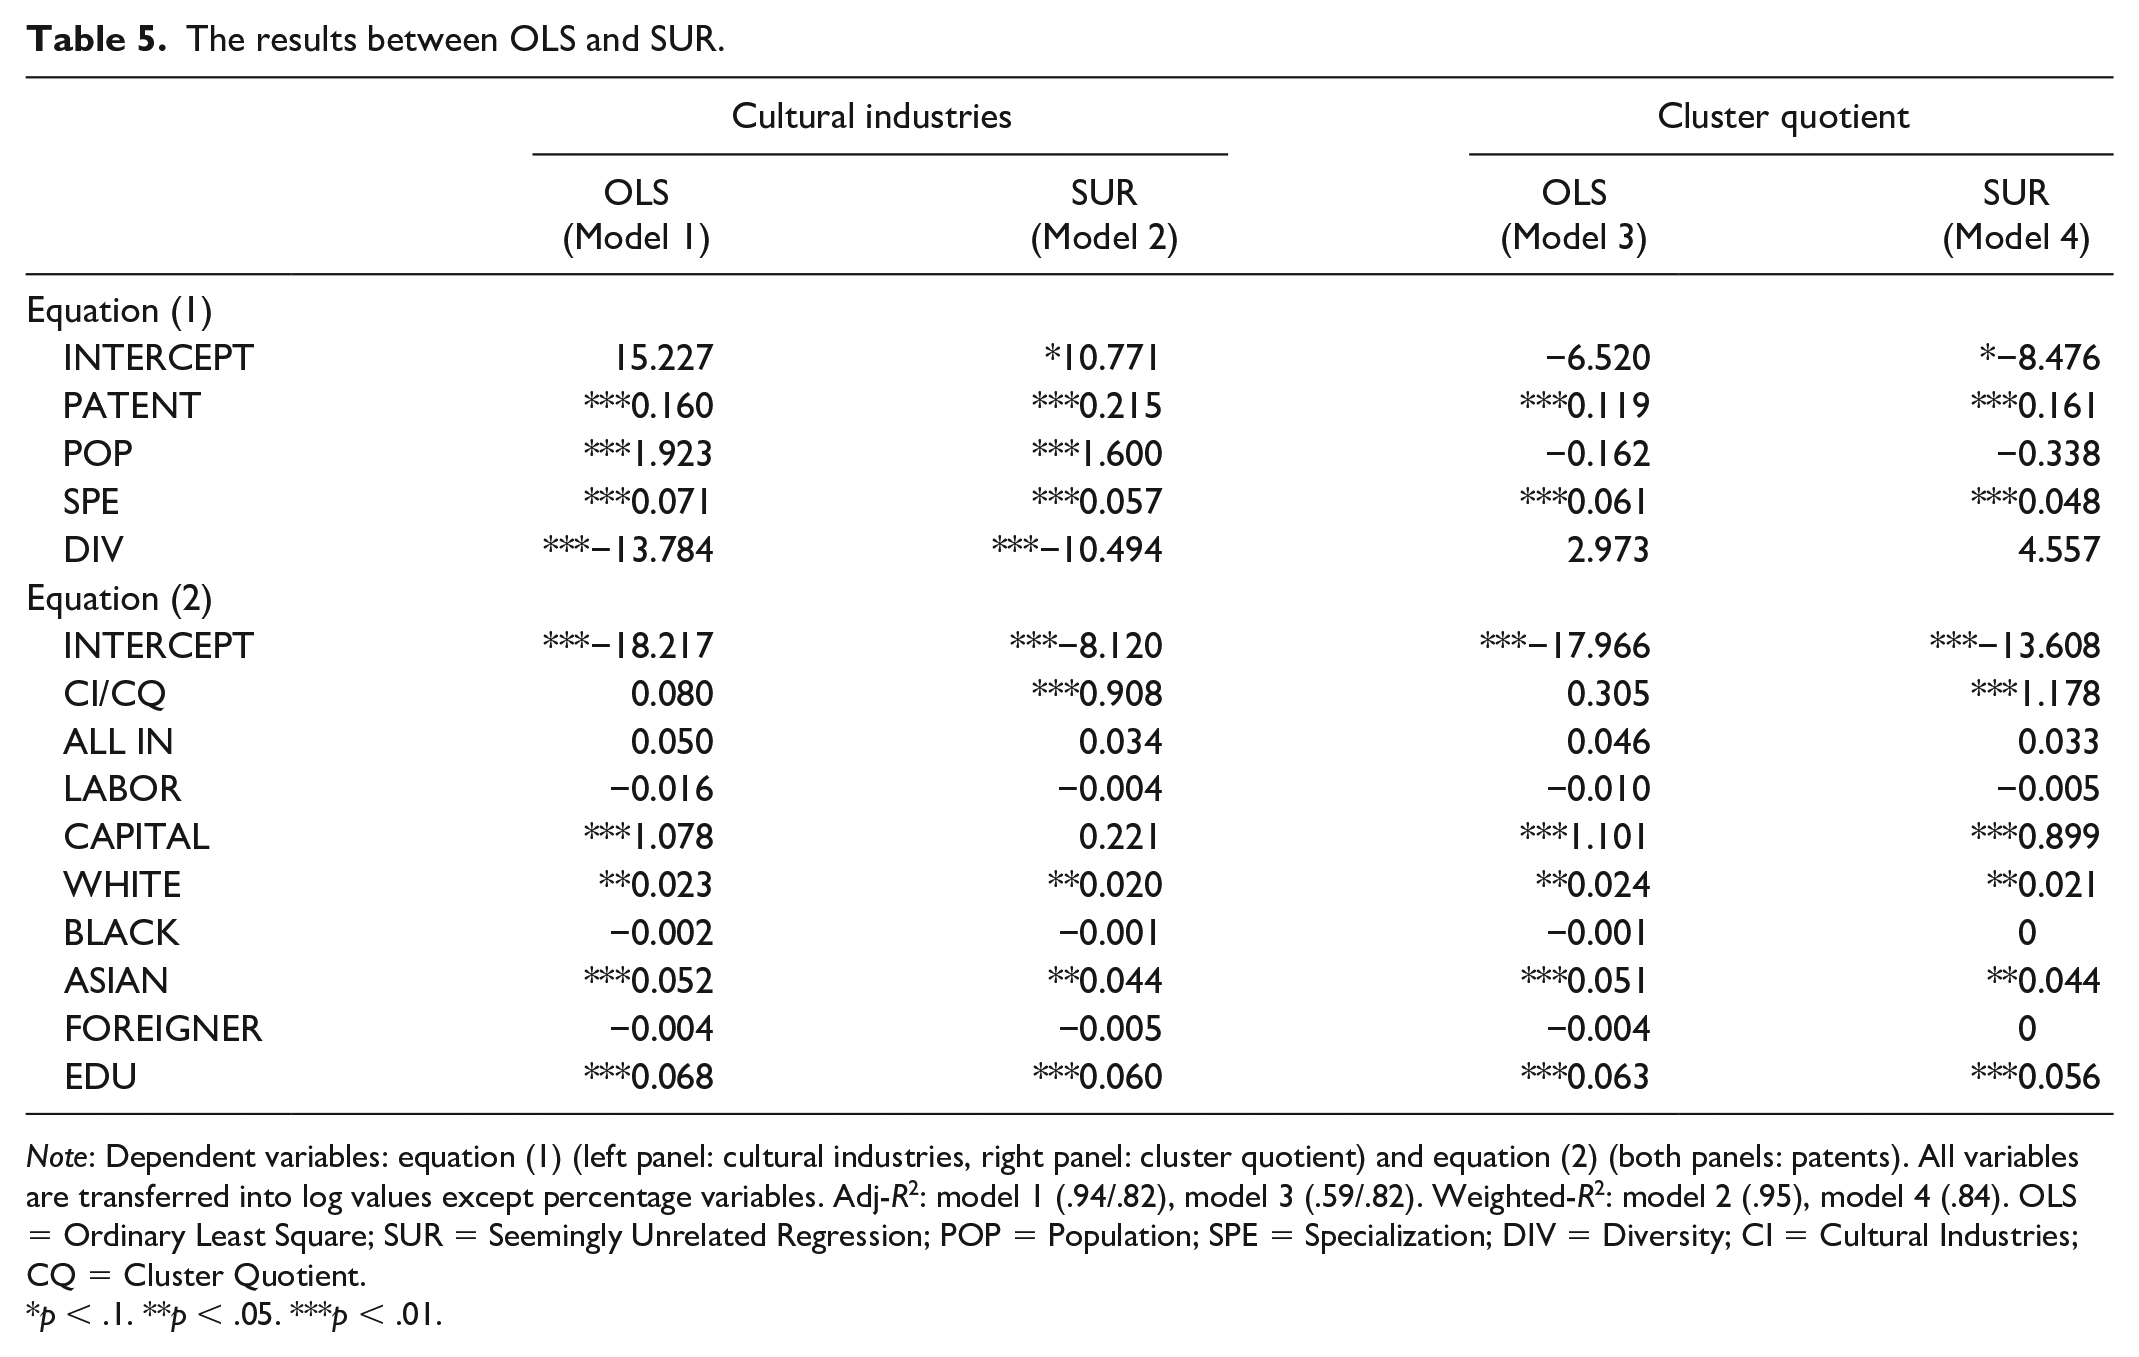
Note: Dependent variables: equation (1) (left panel: cultural industries, right panel: cluster quotient) and equation (2) (both panels: patents). All variables are transferred into log values except percentage variables. Adj-R2: model 1 (.94/.82), model 3 (.59/.82). Weighted-R2: model 2 (.95), model 4 (.84). OLS = Ordinary Least Square; SUR = Seemingly Unrelated Regression; POP = Population; SPE = Specialization; DIV = Diversity; CI = Cultural Industries; CQ = Cluster Quotient.
p < .1. **p < .05. ***p < .01.
To be specific, in equation (1) of model 2, all explanatory variables are significantly associated with cultural industries. The population, patents, and the specialization of knowledge-based industries exert a positive impact on cultural industries, whereas the diversity of knowledge-intensive industries has a negative effect on them. This finding implies that increasing the specialization of knowledge-based industries would be a better strategy than increasing the diversity of those to attract cultural industries in a region. In equation (2) of model 2, cultural industries are significant for patents with an elasticity of 0.908 at the .01 level. The proportion of white people (0.020%), the proportion of Asian people (0.044%), and educational achievement (0.060%) are also positively associated with the patents.
In equation (1) of model 4, patents and the specialization of knowledge-based industries are positively correlated to CQ (0.161 and 0.048, respectively), meaning that regional innovation systems and the specialized knowledge-based environment play an important role in cultural clusters. In equation (2) of model 4, CQ shows the highest elasticity (1.178) for patents, followed by capital stock with an elasticity of 0.899 at the .01 level. The proportion of white people and Asian people, and educational achievement are also positively associated with patents (0.021, 0.044, and 0.056, respectively). The findings in the article suggest that cultural industries (and CQ) and patents positively interact with each other, and they play an important role in regional innovation systems and vice versa. The findings are consistent with prior studies (see, for example, Asheim and Isaksen 2002; Doloreux and Parto 2004; Grodach 2013; Markusen and Gadwa 2010; Pratt 2008; Scott 2006).
Conclusion
Cultural industries play an important role in regional innovation systems. They have been a leading sector of contemporary world economies. In this vein, this study explores the spatial patterns of cultural industries, the types of cultural clusters, and the relationship between cultural industries and regional innovation systems.
This study suggests some important implications as follows: first, the study explores the spatial patterns of cultural industries, cultural clusters, and their cluster types based on all cultural fields, establishments, and U.S. MSAs. For instance, this study suggests that cultural industries are clustered in California, such as Los Angeles (2.35), San Jose (2.19), and San Francisco (1.64). The findings allow governments to understand their cultural industries and cluster types and develop policies to promote cultural industries in the regions. For example, while the Cultural Data Project (CDP) database releases the data collection in arts and cultural organizations, the database only provides some of the U.S. states’ data and does not include industrial data at the MSA level. Therefore, analyzing creative industries at the MSA level in this article sheds new light on driving cultural policy and planning for governments and decision makers.
Second, this study highlights that governments and urban practitioners should try to improve their cultural capital in the regions. For instance, thirty-three MSAs, such as Battle Creek, MI; Rome, GA; and Wenatchee, WA, show underdeveloped cultural capital in their regions. They should develop cultural planning for encouraging artists, designers, performers, and cultural organizations. For example, the MSAs could invite artists and cultural planners, use open space for cultural events, and develop art & cultural festivals. The findings of this study would provide useful implications for governments to develop their cultural planning based on the characteristics of the MSA.
Third, this study presents a better CQ index to find cultural clusters to enhance conceptual and methodological strength from the LQ index. The CQ index allows scholars to consider both the agglomeration of industries and workers. For instance, the LQ index cannot consider the difference between region A (one major company with 1,000 workers) and region B (hundred start-up companies with 1,000 workers), whereas region A cannot have the cluster effect by itself. In contrast, the CQ index can correct the problem by considering the agglomeration of industries. Therefore, the CQ index helps governments and scholars measure not only the magnitude of cultural clusters but also other industrial fields, such as creative industry fields and high-tech industry fields. For instance, governments and urban planners could draw upon the CQ index for exploring the degree of cultural, creative, and high-tech industry clusters and choose the best industries to promote industrial clusters for their region.
Fourth, this study finds that cultural industries and patents in MSAs interact positively with each other. For example, the elasticity of patents for cultural industries is 0.215, and cultural industries are also significant for patents with an elasticity of 0.908. Also, a 1 percent increase of patents leads to an almost 0.161 percent increase of CQ, and CQ also has a positive impact on patents with an elasticity of 1.178. The finding indicates that governments should develop cultural planning and regional innovation systems based on the positive interaction and elasticity.
Fifth, this study suggests the factors related to the agglomeration of cultural industries and the patents based on the simultaneous equations model. For instance, the population, patents, and the specialization of knowledge-based industries exert a positive impact on cultural industries (1.600, 0.215, and 0.057, respectively). The educational achievement plays a positive role in patents (0.060). The empirical results help urban practitioners establish policies with a deeper understanding of the factors associated with cultural industries and patents.
Meanwhile, this study has some limitations and addresses future directions as follows: first, this study designs the CQ index based on the same weight to the agglomeration of cultural industries and cultural workers for computing the magnitude of clusters. However, they might play a different role in the cluster effects. Second, this study explores the spatial patterns of cultural industries and the relationship between cultural industries and regional innovation systems by analyzing two years data. The future research would explore them based on longitudinal analysis, such as panel models. Third, this study highlights the cultural industries based on the NAICS codes. However, the codes do not provide detailed information for cultural industries. In other words, while this study uses the most detailed information of the NAICS codes (six-digit code), the codes cannot fully highlight the specific role of industries. For example, some of the newspaper publishers (511110) may be unrelated to cultural industries. Future scholars could conduct more elaborate analyses when the U.S. government releases more detailed data.
Footnotes
Appendix
Cultural Industries.
| NAICS | NAICS | NAICS | NAICS | ||||
|---|---|---|---|---|---|---|---|
| Publishing | 511110 | Software & Game | 423920 | FVP | 812921 | Character | 315990 |
| 511120 | 443120 | 812922 | 339910 | ||||
| 511130 | 451120 | Broadcasting | 334220 | 339930 | |||
| 511140 | 541519 | 515111 | 423920 | ||||
| 511191 | 611420 | 515112 | 423940 | ||||
| 511199 | FVP | 423620 | 515120 | 424330 | |||
| 511210 | 443112 | 515210 | Performance | 711110 | |||
| 512230 | 512110 | 517210 | 711120 | ||||
| 512290 | 512120 | 519130 | 711130 | ||||
| Music | 339932 | 512131 | Advertising | 541810 | 711190 | ||
| 339992 | 512132 | 541820 | 711219 | ||||
| 451140 | 512191 | 541830 | 711310 | ||||
| 451220 | 512199 | 541840 | 711320 | ||||
| 512220 | 532230 | 541850 | 711410 | ||||
| 517110 | 541380 | 541860 | 711510 | ||||
| Software & Game | 334611 | 541921 | 541870 | ||||
| 423430 | 541922 | 541890 |
Note: Character industries are defined as cultural industries that produce character products, such as movie, animation, or drama characters (e.g., Mickey Mouse of The Walt Disney Company, Pikachu of Pokémon series, and Daenerys Targaryen of Game of Thrones). NAICS = North America Industry Classification System; FVP = film, video, and photography.
Declaration of Conflicting Interests
The author(s) declared no potential conflicts of interest with respect to the research, authorship, and/or publication of this article.
Funding
The author(s) received no financial support for the research, authorship, and/or publication of this article.