
Abstract
This study presents findings from a survey with 1,284 students at three Los Angeles area universities, exploring their experiences with sexual harassment in transit environments, and how these differ by gender, race/ethnicity, and sexual orientation. It finds that sexual harassment is a common occurrence, forcing precautionary behaviors. Nevertheless, reporting of harassment incidents is extremely low. Regression models find that certain individual characteristics of students and environmental characteristics of transit settings influence the incidence of victimization and student perceptions of safety. The study discusses multi-pronged strategies to tackle harassment in transit environments that include research, design, and policy initiatives.
Introduction
The #MeToo movement has brought under bright lights the phenomenon of sexual harassment against women. This attention—primarily focusing on sexual harassment in politics, the military, educational institutions, media and entertainment industries, and other workspace settings—has generated discussion, litigation, and response (anti-harassment employee training, workplace firings, expulsions of perpetrators from colleges, etc.). However, less attention has been paid in addressing sexual harassment in transit environments.
Studies find that sexual harassment incidents are taking place daily on buses, bus stops, and trains in cities around the world. More serious sexual assaults and even “transit rapes” have generated public outrage in places as diverse as New Delhi/India, Rio/Brazil, or Los Angeles/United States (Best 2013; Romero 2013). A Washington Post article titled “Why the #MeToo movement is a public transportation issue” emphasizes that public transportation is a common setting for sexual harassment. According to the article, “For many, it’s a depressing but foregone conclusion: If you’re a woman who rides public transportation, you’re almost guaranteed to experience the kinds of demeaning or threatening encounters that fit squarely within the bounds of the #MeToo conversation” (Powers 2017).
If women do not perceive public transportation as safe, their mobility and accessibility to destinations and urban amenities is impaired (Ceccato 2017). Fear may lead women to take precautionary measures that influence their travel patterns and constrain their mobility (Lynch and Atkins 1988), such as adopting certain behavioral mechanisms when in public; choosing specific routes, travel modes, and transit environments over others; or completely avoiding particular settings and activities (Loukaitou-Sideris 2014).
Buses, bus stops, trains, and train stations are populated by thousands of anonymous riders on the move and are sites of fleeting interactions. Transit settings attract different types of crime. A robust literature has examined such settings as both crime generators and crime attractors (Irvin-Erickson and La Vigne 2015). Researchers indicate that different types of transit crime happen under different environmental conditions; thus, while pickpocketing may be facilitated by the crowded setting of the transit vehicle, robberies and assaults occur more easily at desolate bus stops (Loukaitou-Sideris 1999). But despite our understanding of the environmental factors that enhance or mitigate opportunities for transit crime, we know little about the extent, type, and characteristics of sexual harassment in transit environments.
This study aims to gain more knowledge of this phenomenon. We use the term “sexual harassment” to indicate “any unwanted attention including lewd comments, leering, sexual invitations, threats, displaying pornographic material, being followed or pictured, and public masturbation” (Gekoski et al. 2017, 4). Ceccato and Loukaitou-Sideris (2020) identify three categories of sexual harassment in transit environments: verbal, physical, and nonverbal/nonphysical. 1
This study surveys college students of three universities in Los Angeles—University of California, Los Angeles (UCLA), California State University, Los Angeles (CSULA), and California State University, Northridge (CSUN)—to examine their transit safety concerns and victimization experiences. We chose to focus on college students because they represent a group of commuters who may be more affected by sexual harassment than older commuters. In addition, college students are more likely to use transit and less likely to travel alone by private car because they typically have lower incomes and car ownership rates than the general public. Many students are “transit captives”: they do not own a car and rely mostly on public transit to move around the city. All three universities encourage students to ride transit, providing them with transit passes at discounted rates. An additional motivation to focus on college students was that they can be easily reached through particular campus offices, which have listservs of enrolled students.
Below, we first give an overview of the literature on sexual harassment in transit settings. We then discuss the research design and context of the empirical study. Next, we present and discuss our findings, followed by a concluding section that also offers recommendations for research and policy.
Literature Review: Sexual Harassment in Transit Environments
The first studies on sexual harassment on public transit appeared in the 1980s (Beller, Garelik, and Cooper 1980; Lynch and Atkins 1988). Prior to that time, studies of transit crime were gender-blind, not distinguishing between victimization against men or against women. In the last decade, an emerging literature has turned its attention to sexual crimes against women in transit environments (Ceccato and Paz 2017; Gardner, Cui, and Coiacetto 2017; Gekoski et al. 2017; Hsu 2011; Natarajan et al. 2017; Stringer 2007), but the extent of sexual harassment in transit environments still lacks the evidence of large-scale data. This may be attributed to both underreporting and the fact that official crime statistics do not often collect data on sexual harassment (Gardner, Cui, and Coiacetto 2017).
There exist only a few relatively large-scale studies examining sexual harassment in transit environments in North America and Europe. In a 2007 survey of 1,790 New York City subway riders (63% female and 32% male), 63 percent of respondents reported having been sexually harassed on the subway, while 44 percent had witnessed a sexual harassment incident (Stringer 2007). Ten years later, a smaller survey of 140 female college students in New York City found that 77 percent had experienced or witnessed sexual harassment in transit environments (Natarajan et al. 2017).
Surveys undertaken by transit operators typically find smaller percentages of victimization. A 2018 onboard passenger survey by the Los Angeles County Metropolitan Transportation Authority found that 26 percent of women and 21 percent of men riders had experienced sexual harassment during their transit trips over the six prior months (Los Angeles Metro 2018). In the same year, a survey by the Washington Metropolitan Area Transit Authority (WMATA) found that 21 percent of women and 14 percent of men riders had experienced sexual harassment during their transit trip (WMATA, Collective Action for Safe Spaces, and Stop Street Harassment 2018). In London, a telephone survey by Transport for London found that 15 percent of women had experienced sexual harassment in transit environments (Twyford 2013). These surveys indicate that sexual harassment on transit is a common occurrence, even though the reported percentages of victimization vary. Such variations may reflect the different ways that survey questions about sexual harassment were asked—such as asking about different time periods (e.g., experiences over lifetime or over a shorter period) or different transit settings (transit vehicles, transit stops, whole journey 2 )—as well as the characteristics of transit environments that vary across cities (different crowding levels, policing levels, etc.).
Studies find that sexual harassment occurs onboard the transit vehicle but also at bus stops, station platforms, and on the way to or from the transit stop; however, the distribution of harassment incidents varies by transit settings and city context (Ceccato and Loukaitou-Sideris 2020). A study in Austria found that 71 percent of incidents took place on the transit vehicle, and only 29 percent at transit stops (Stark and Meschik 2018), while the aforementioned WMATA, Collective Action for Safe Spaces, and Stop Street Harassment (2018) survey found that approximately two-thirds of the transit riders who reported harassment had experienced the incident onboard a train. The temporal distribution of harassment incidents varies, depending on the type of offense. Studies find that sexual harassment in transit environments often takes place during peak traffic hours (Stringer 2007), when transit environments are overcrowded; however, rape and sexual assault tend to happen during nighttime or early morning hours (Koskela and Pain 2000).
Women are disproportionately more victimized by harassment than men. A 2004 report by the U.K. Department for Transport estimated the risk of victimization as four times higher for women than for men (Crime Concern 2004). However, only a handful of studies examine differences among subgroups of women, and very few examine gender categories beyond the binary male/female classification. A review of the literature finds that younger women are more likely to be harassed than older women (Gekoski et al. 2017). Race may also be a factor in the differential experiences of women transit riders, with minority women being more fearful of sexual harassment (Loukaitou-Sideris 2005). Sexual orientation may also relate to victimization risk: a study of transgender and gender-nonconforming individuals in Portland, United States, found they experience frequent sexual harassment in transit environments (Lubitow et al. 2017). Reviewing a limited literature, Ludici, Bertoli, and Faccio (2017) found that women with disabilities experience higher rates of physical and sexual aggression on transit.
Safety concerns are more prominent among women riders, and the risk of harassment in transit environments can lead to “fear-based exclusion” (avoiding transit use because of fear; Church, Frost, and Sullivan 2000). Some women exercise partial avoidance (temporal or spatial), not riding buses and trains after dark (Koskela and Pain 2000), or avoiding certain lines and stops (Hsu 2011). Others exercise risk management strategies, such as trying to sit or stand near other women passengers or the bus driver, or using their bags and backpacks strategically to avoid being touched (d’Arbois de Jubainville and Vanier 2017; Hsu 2011). These findings are consistent with one of the earlier studies on the influence of harassment on women’s travel behavior, which found that women in Southampton, United Kingdom, adopted precautionary actions in response to sexual harassment in public spaces (Lynch and Atkins 1988).
There is consensus in the literature that sexual harassment in transit environments remains largely underreported (Ding, Loukaitou-Sideris, and Weinstein Agrawal 2020). An early study in the New York City subway found that sex crimes are underreported to a greater extent than other crimes (Beller, Garelik, and Cooper 1980), while a later study in the same city found that only 4 percent of riders who had been sexually harassed on the subway reported the incident to the police or transit operator (Stringer 2007). The British Transport Police Authority (2008) estimated that underreporting may be as high as 90 percent. Similarly, the LA County Metropolitan Transportation Authority (Los Angeles Metro 2018) found that while 20 percent of its passengers had experienced sexual harassment during rides over the previous six months, they had received only ninety-nine official reports during the whole year. Victims and bystanders are often reluctant to report harassment incidents, because of embarrassment, perceived inaction by authorities, or fear of the police (Loukaitou-Sideris 2015).
Thus, while the literature is definitive about the presence of sexual harassment on transit, its reported extent varies because of inconsistent definitions of the term and methodological inconsistencies among various studies. While some transit agencies have started asking about sexual harassment in their onboard passenger surveys, large-scale surveys of transit riders are rare, and there are gaps in our knowledge of how sexual harassment affects different sub-groups of riders differently. The literature indicates that none of the elements of a transit system is immune to harassment incidents, although there is no consensus regarding which type of setting is more vulnerable, as different environmental and contextual factors can be at play. Very few studies examine the spatial and temporal characteristics of transit settings, and how they relate to higher incidence of different types of harassment. Last, most studies examining the occurrence of sexual harassment in transit environments focus on the general public, and it is not clear if similar patterns hold true among college students, a group with particularly high potential to use transit. To cast light on some of these issues, we turn to our empirical study.
Research Design
We distributed a survey to students at UCLA (in May 2018), at CSULA (in November 2018), and at CSUN (in March 2019) to find out about student harassment experiences in transit environments and respond to the following questions.
What is the extent of sexual harassment experienced by university students in transit environments?
Do individual characteristics of students and characteristics of the physical or social environment of the transit setting affect students’ risk of victimization and perceptions of safety?
Do students take any precautions to minimize the risk of sexual harassment in transit environments?
What measures can lead to reducing sexual harassment incidents in transit settings?
Research Context
The larger geographic context of this study is the city of Los Angeles, where the three universities are located. The city is served by a large transit network of about 14,000 bus stops, four light rail lines, and two subway lines serving ninety-three rail stations (Los Angeles Metro N.d.). Los Angeles bus riders are disproportionately female (55%), Latino (66%), and poor (61% below the poverty line). The sociodemographic profile of railway riders is somewhat different: mostly male (54%), Latino (46%), with 39 percent falling below the poverty line (Los Angeles Metro 2017). Transit ridership has been dropping in Los Angeles over the last decade, a fact that is primarily attributable to the increase of ridehailing services but also some passengers’ concerns about safety (Manville, Taylor, and Blumenberg 2018). A recent survey showed that transit ridership of a newly built light rail line in Los Angeles was significantly lower among women, partly because of safety concerns (Hsu, Boarnet, and Houston 2019).
Transit ridership among Los Angeles County residents is very low—only 6 percent of residents commute to work by public transit. In contrast, 79 percent drive to work alone; 9.8 percent carpool, 2.7 percent walk, and 2.4 percent use other forms of transportation (County of Los Angeles, Open Data N.d.). However, college students represent a group that uses public transit in higher percentages than the general public. For example, 26.2 percent of UCLA students not living on campus use public transit for their commute to campus (UCLA Transportation 2018).
The focus of this study was student transit riders at UCLA, CSULA, and CSUN, three large public universities in Los Angeles with relatively racially diverse student bodies. Part of the ten-campus University of California system, UCLA is an elite public university that serves a mix of affluent and lower-income full-time students, who come not only from Los Angeles or California but also from other U.S. states and different countries. The UCLA campus is located in the affluent Westwood neighborhood, 15.6 miles west of downtown. It is well served by six transit agencies and eighteen bus lines with bus stops on or adjacent the campus; however, the closest railway station is 2.2 miles away. CSULA and CSUN are the two Los Angeles campuses of the twenty-three-campus Cal State University system. They attract primarily Los Angeles–area undergraduates and smaller numbers of graduate students (about 13.5% of their student bodies). About 20 percent of their students are enrolled part-time. CSULA is located just five miles east of downtown, adjacent to the working-class neighborhoods of El Sereno and Ramona Gardens. The university is serving high numbers of lower-income students, who are primarily Latino (72.6%). The campus is served by eighteen bus lines of Metro and Foothill Transit, while a Metrolink rail station is located on the campus. CSUN is situated in the middle-class suburban community of Northridge, at the heart of San Fernando Valley, twenty-six miles northwest of downtown. It serves a mixture of low-income and middle-income students. More than half of CSUN students are Latino, and about one quarter are white (Table 1). The campus is served by only three bus lines of Metro and AVTA, while a university shuttle connects the campus to the closest Metrolink railway station, 2.3 miles away.
Sociodemographic Profile of UCLA, CSULA, and CSUN Students Compared with the Survey Samples.
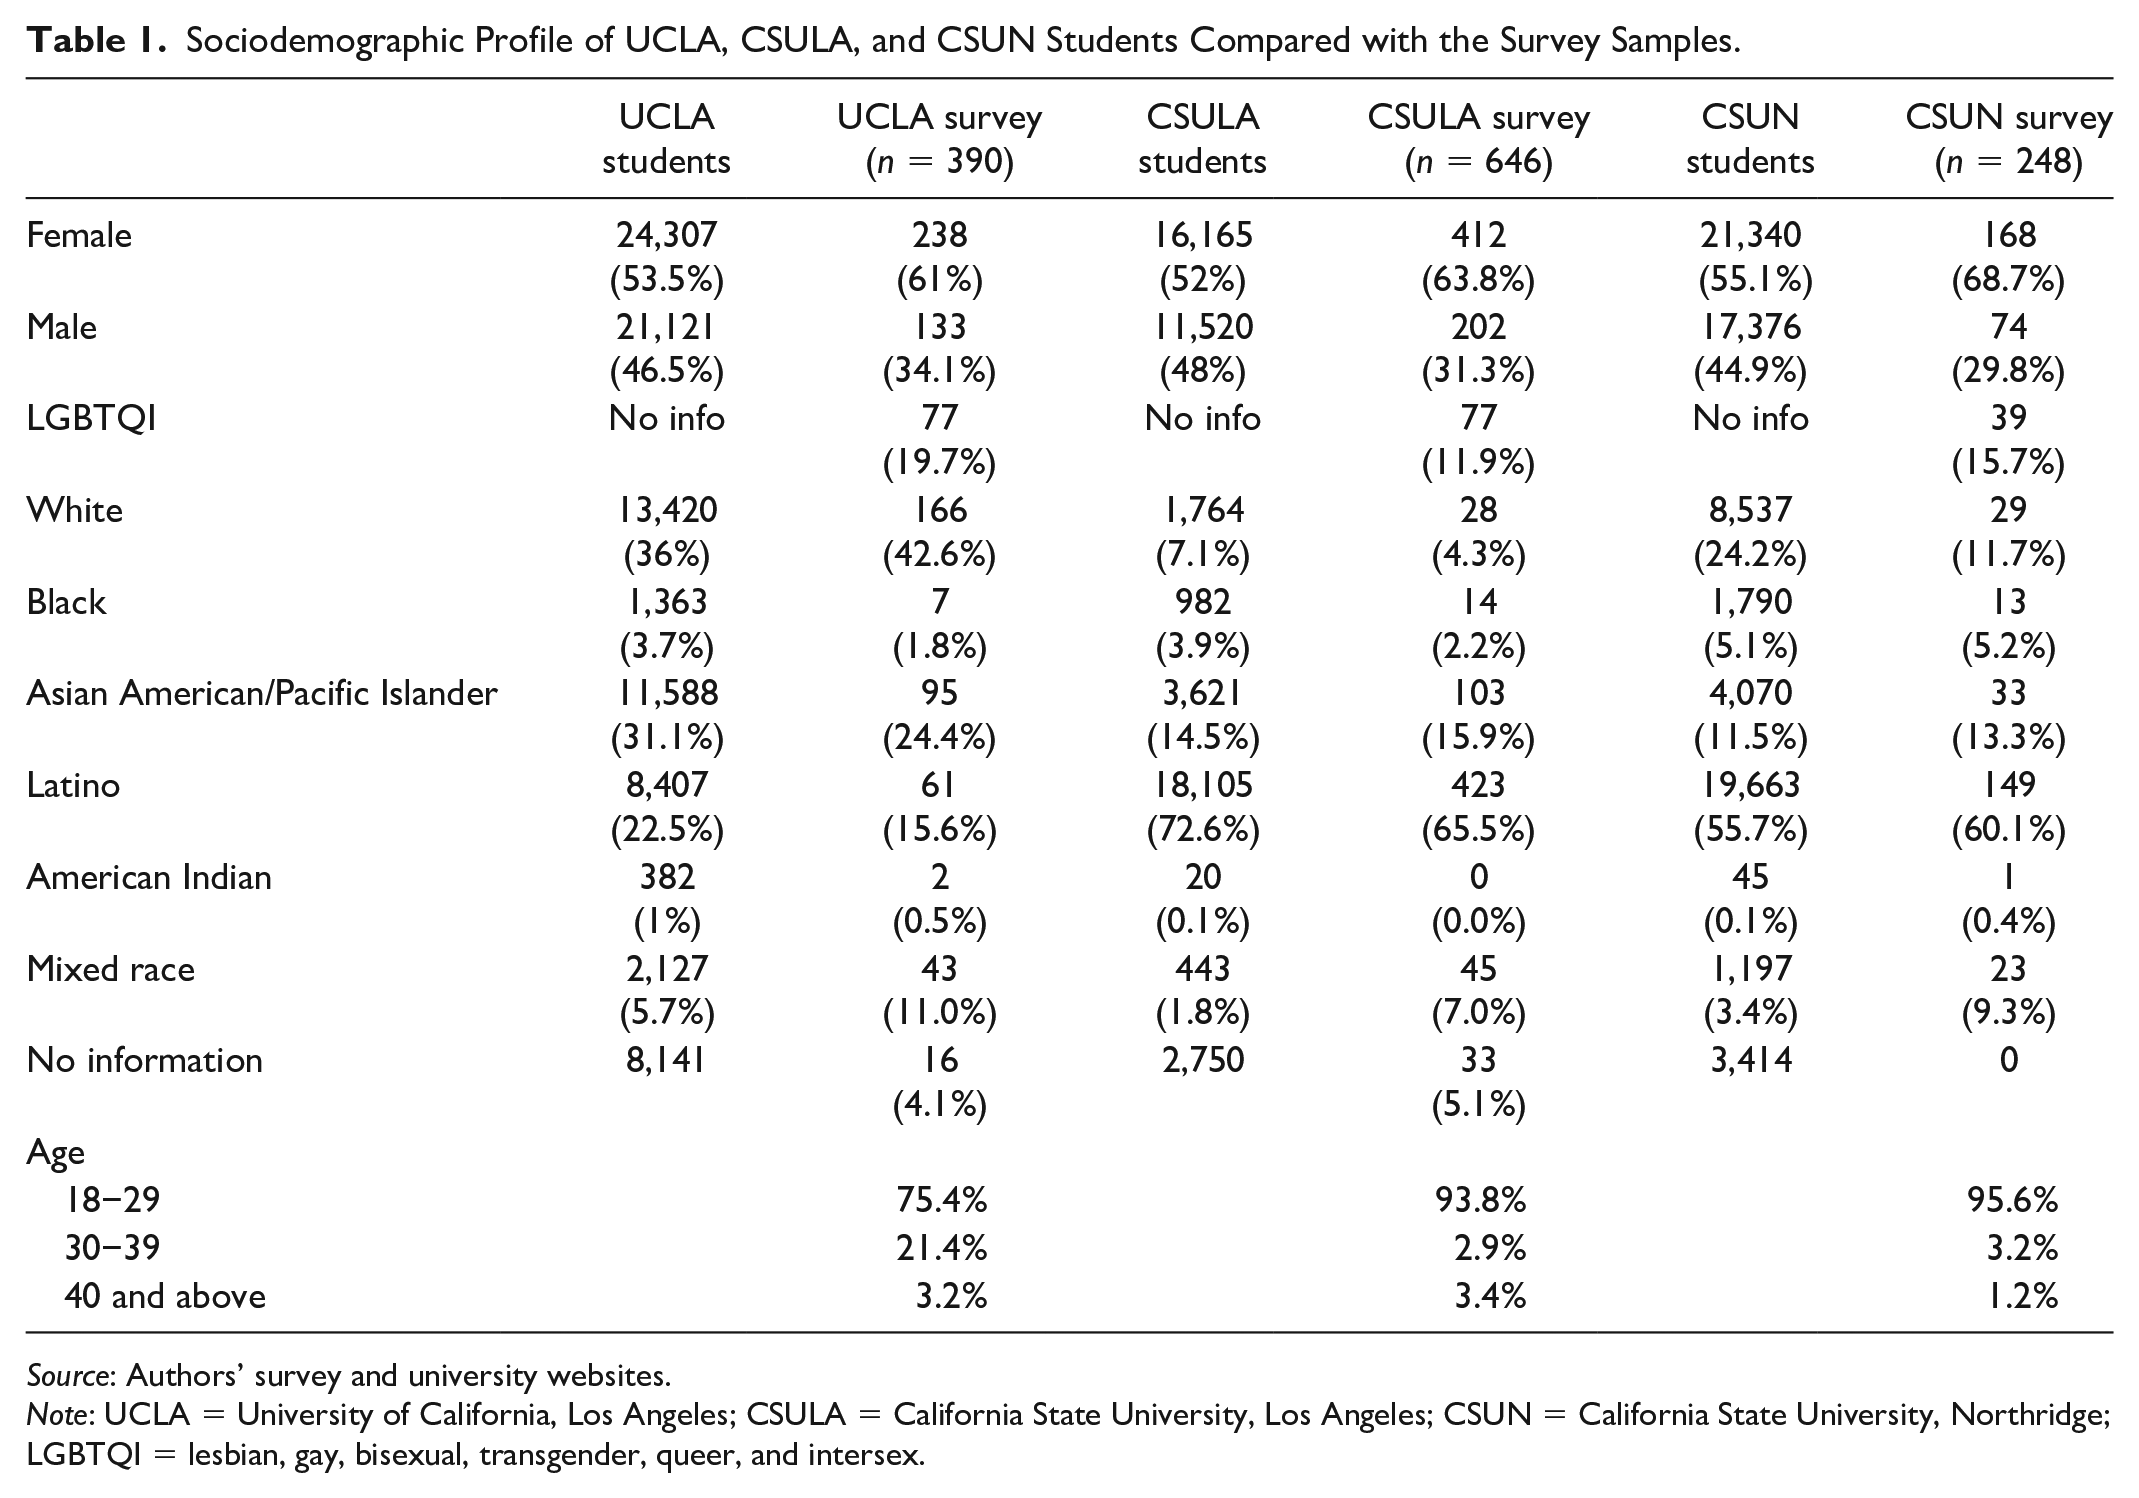
Source: Authors’ survey and university websites.
Note: UCLA = University of California, Los Angeles; CSULA = California State University, Los Angeles; CSUN = California State University, Northridge; LGBTQI = lesbian, gay, bisexual, transgender, queer, and intersex.
Table 1 shows the sociodemographic characteristics of respondents compared with the student populations at each campus. We received valid survey responses from 1,284 students (63.7% female; 31.9% male; 4.4% other or no response). About 15.5 percent of all students self-reported as LGBTQI (lesbian, gay, bisexual, transgender, queer, and intersex). The significant over-representation of female respondents is likely a reflection that sexual harassment is of greater concern to them. In terms of race/ethnicity, 17.4 percent of all respondents were white, 2.6 percent black, 49.3 percent Latino, 18 percent Asian American, 0.2 percent American Indian, 8.6 percent mixed race, while 3.8 percent did not report their race/ethnicity. The great majority of respondents were between the ages of eighteen and twenty-nine. Only at UCLA, a significant minority of respondents (21.4%) were between thirty and thirty-nine, reflecting the large numbers of graduate students (28% of the student body) in this university.
Research Methods
We employed a forty-five-question survey instrument used by Ceccato and Loukaitou-Sideris (2020) in a global study of sexual harassment. We sent the survey to all students in the three campuses who had transit passes because we wanted to receive responses from frequent transit riders, as they are more knowledgeable about transit settings and likely more exposed to harassment incidents. The three universities provide transit passes to students who request them and subsidize about half of the ticket cost; therefore, transit passes are primarily requested by frequent transit riders. Each campus maintains a listserv of transit pass holders. However, the campuses do not document the sociodemographic characteristics of transit pass holders; therefore, a weakness of our study is that it cannot compare the characteristics of respondents with those of the larger population invited to respond.
The survey was carried out electronically and was the same for all three campuses. In each university, a survey link was sent only to students holding transit passes, who received the same invitation letter. At UCLA, the link was distributed from the office of UCLA Transportation Services to 3,406 students; we received back 390 completed questionnaires (11.5% response rate) at this campus. At CSULA, the link was distributed by the campus Department of Public Safety, which oversees campus parking and transportation services; 3,480 students received the survey link, and we received back 646 completed questionnaires (18.6% response rate). At CSUN, the transit pass program is administered through the Associated Students Association, who provided us with a list of email addresses for the 2,221 student transit pass holders. We sent these students a link to the survey through our university’s Institute of Transportation Studies and received back 248 completed questionnaires (11.2% response rate). It is feasible that fewer students chose to participate in the survey at CSUN because they received the survey link from an entity from another university; however, the response rates at CSUN were similar to response rates at UCLA. Overall, response rates were modest but not atypical for surveys distributed on college campuses; studies find that students in public universities and minority students have lower response rates (Porter and Umbach 2006).
The survey asked respondents about their sexual harassment experiences when using public transit: if they had been victims of harassment; if they had reported their victimization; if they had witnessed sexual harassment against others on the transit system; how safe they felt riding transit or waiting for the bus or the train during the day or night; what types of problems they encountered in the physical or social environment of transit settings; what safety precautions, if any, they typically take when using public transit; and what suggestions they have to address sexual harassment in Los Angeles transit settings. These questions were repeated for both bus and rail transit, for both night and day travel, and for each of three settings (transit stop, transit vehicle, trip to/from the stop). Thus, students using only one mode of transit, and/or traveling only during daytime had to respond to a smaller sub-set of questions. In addition, respondents were asked questions about their age, gender, race/ethnicity, and sexual orientation. Questions had multiple-choice responses; however, respondents could optionally add comments at the end of the questionnaire. Responding to all forty-five questions took about seventeen minutes. No incentives were given to encourage response. 3
For each theme, we compared results across genders. We used χ2 tests to check for statistically significant differences between gender groups, racial/ethnic groups, and between groups who did and did not self-identify as LGBTQI. We also used regression models to determine which of three different categories of variables—individual characteristics of students, characteristics of the physical environment of the setting, and characteristics of the social environment of the setting (as reported by students)—significantly affected the incidence of sexual victimization of students as well as feelings of fear in transit environments. Victimization was measured by asking respondents, “In the last three years have you experienced any of the following while traveling on, heading to, or waiting for the bus or rail?” and listing sixteen different harassment behaviors (see Note 1). 4 Feelings of fear were measured asking the respondents to evaluate if they felt fearful (on a Likert-type scale from 1 to 5, with 1 = never afraid and 5 = always afraid) waiting for the bus or riding the bus during the day and during the night. Table 2 shows the variables in the regression models.
Variables in the Regression Models.
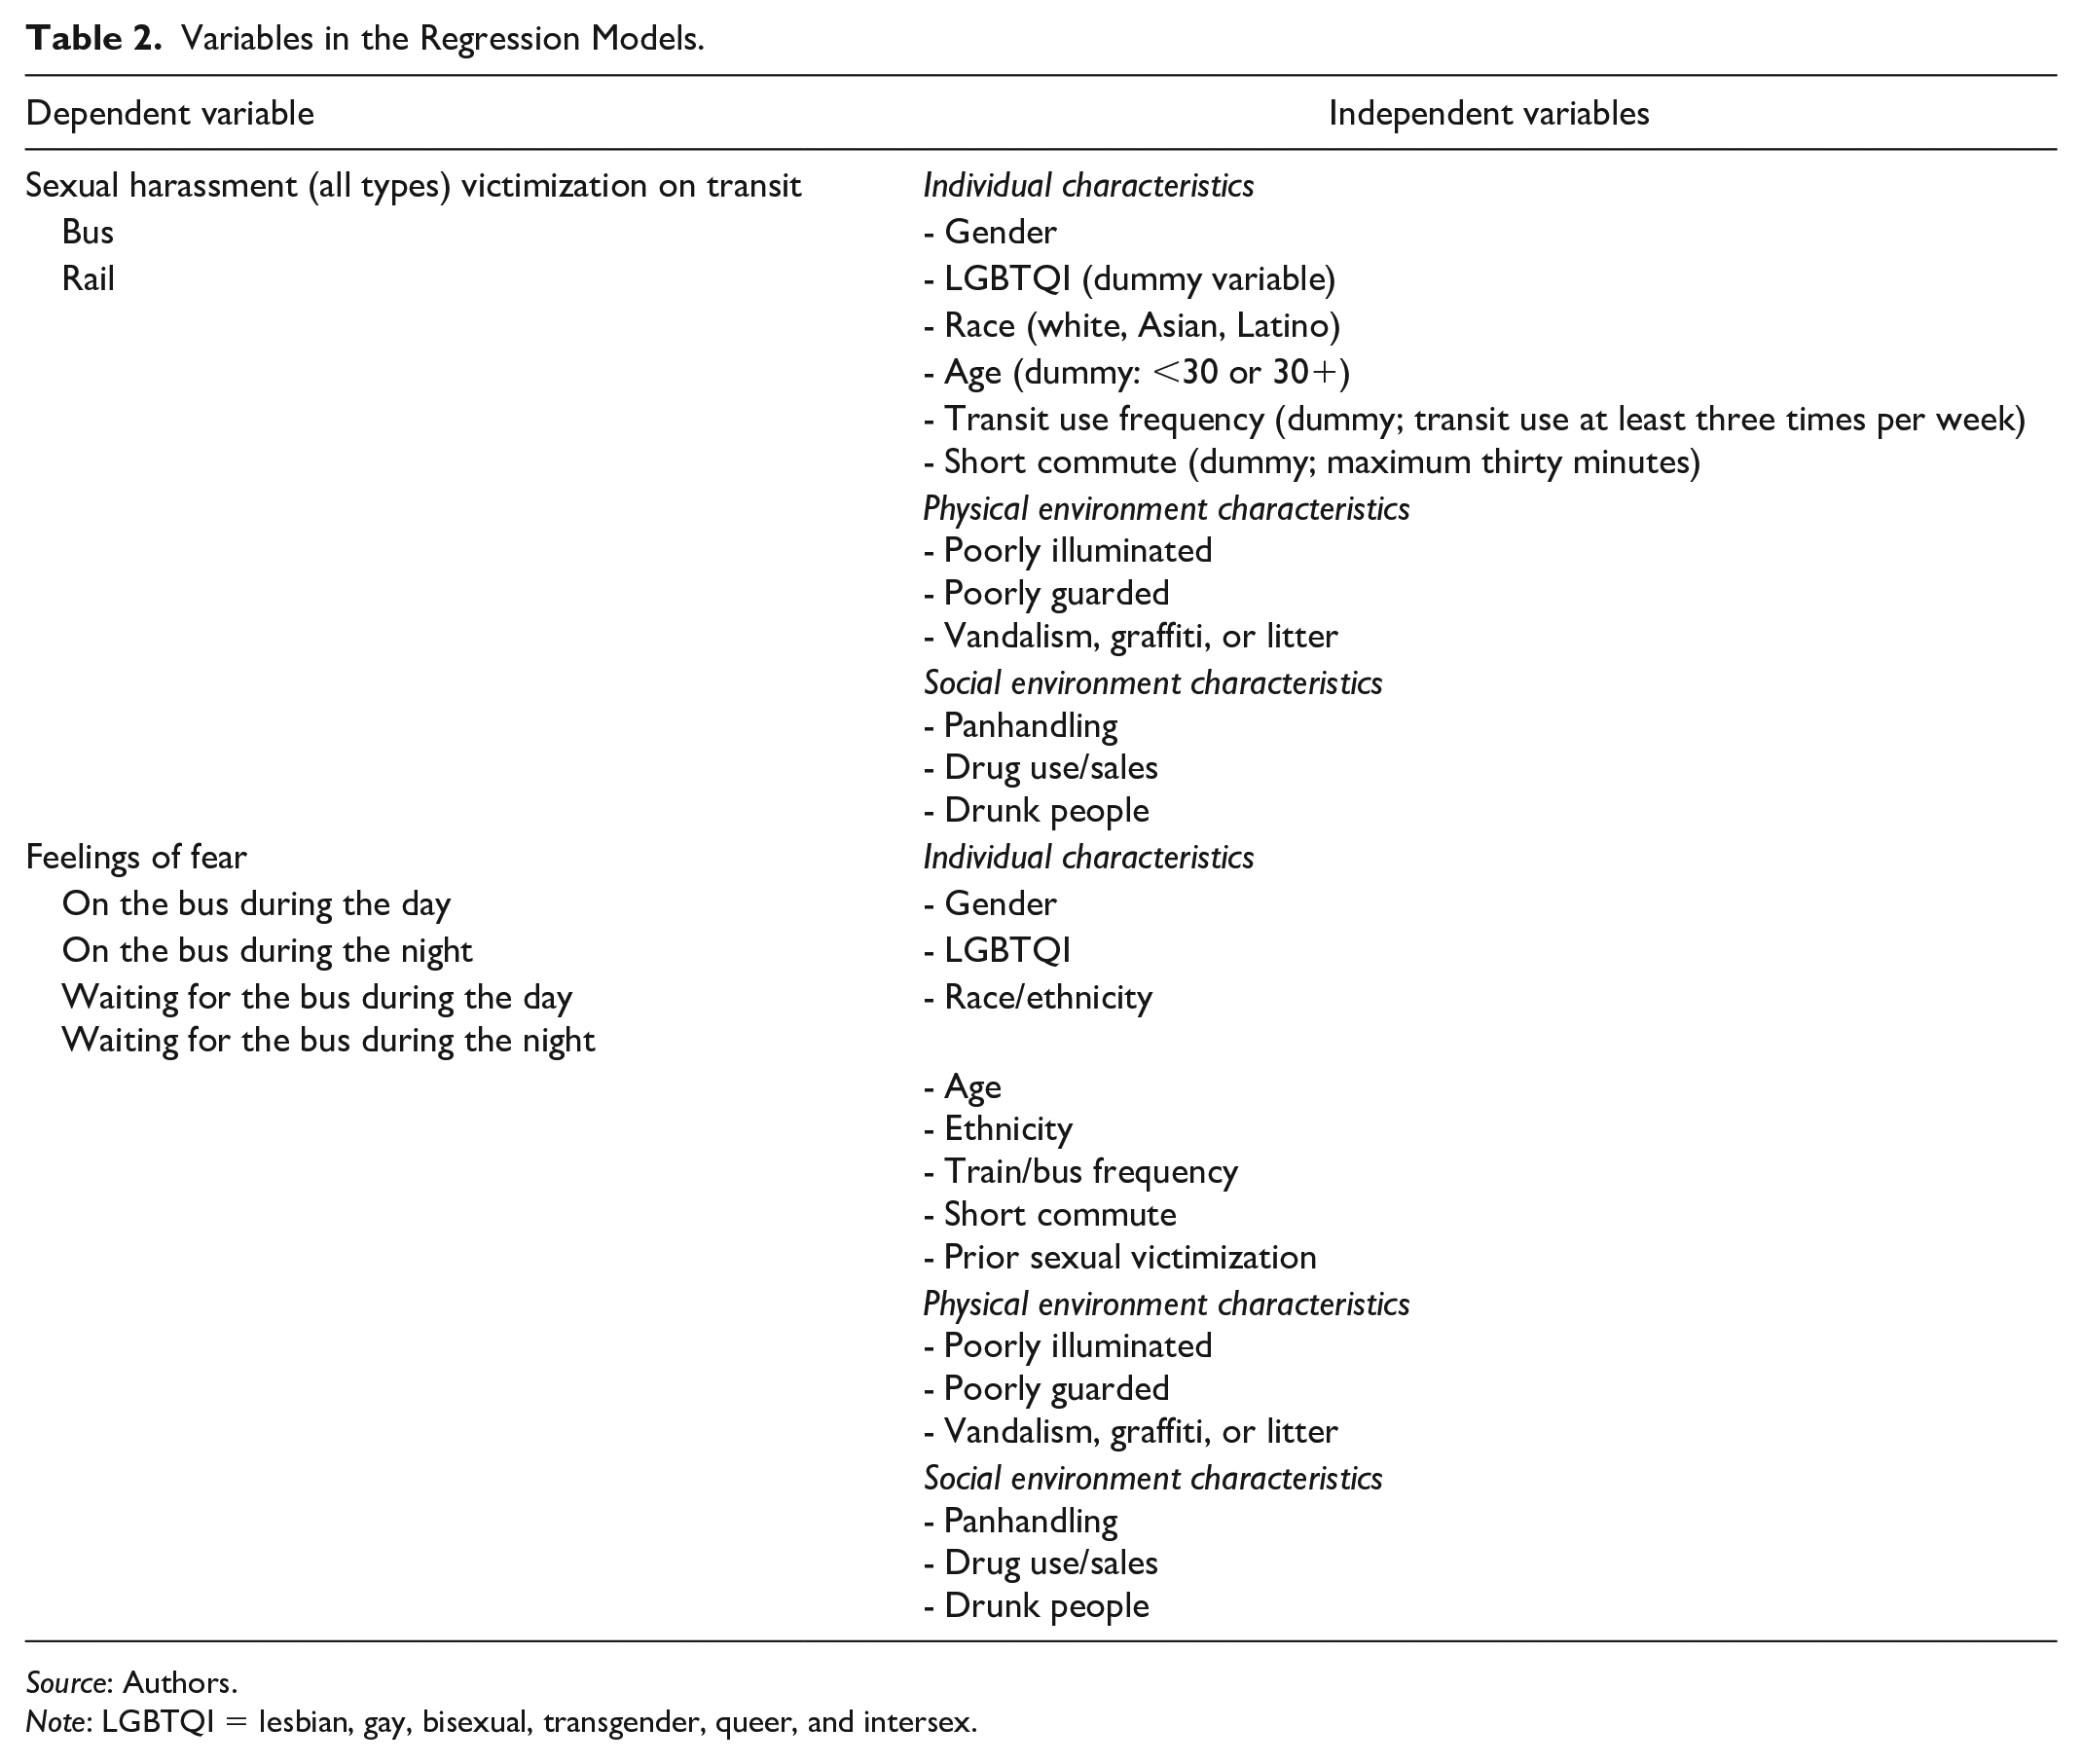
Source: Authors.
Note: LGBTQI = lesbian, gay, bisexual, transgender, queer, and intersex.
Findings: Experiences of Students at Los Angeles Transit Settings
Respondents’ Transit Use Characteristics
As mentioned, the survey focused on frequent transit users; nevertheless we found that the three samples of respondents had some differences in their transit use characteristics (Table 3), which are reflective of differences in the student population of the three campuses. Higher proportions of CSULA respondents were frequent transit riders than respondents in the other two universities. Only 17 percent of CSULA respondents owned a car, compared with 27 percent of CSUN and 62 percent of UCLA respondents. 5 Railway use by UCLA respondents was very low (13%), reflecting this campus’s lack of good access to metro services. At UCLA and CSUN, about one quarter of respondents had short transit commutes (less than thirty minutes) to/from campus, while this was the case for significantly lower percentages of CSULA respondents (13%).
Transit Use Characteristics of Respondents.
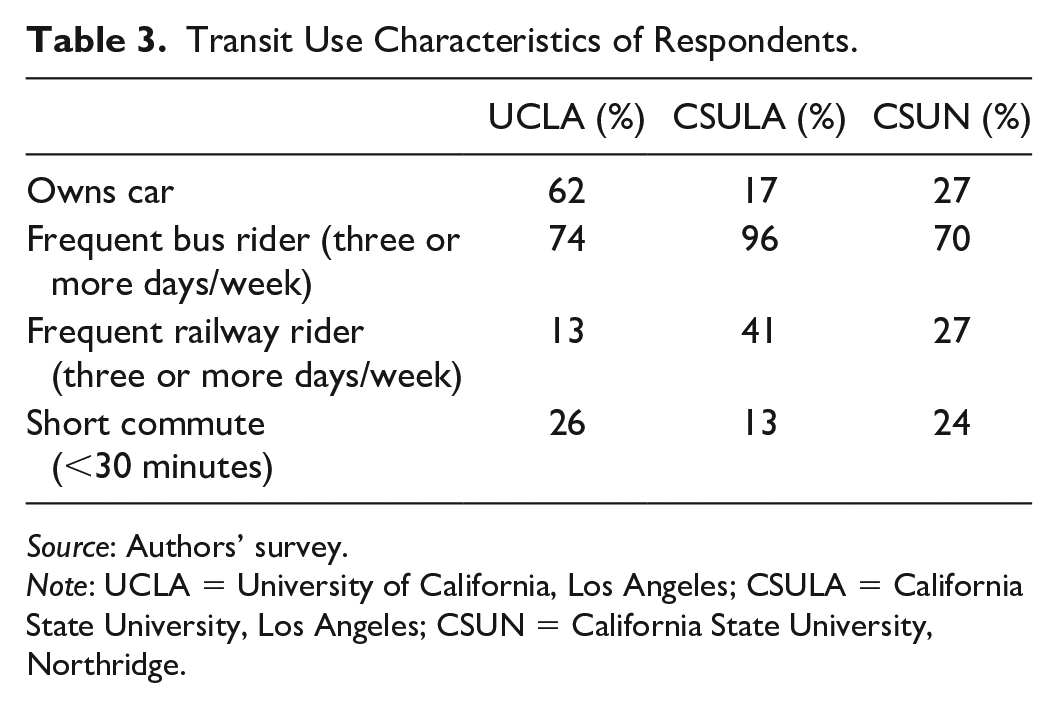
Source: Authors’ survey.
Note: UCLA = University of California, Los Angeles; CSULA = California State University, Los Angeles; CSUN = California State University, Northridge.
Victimization
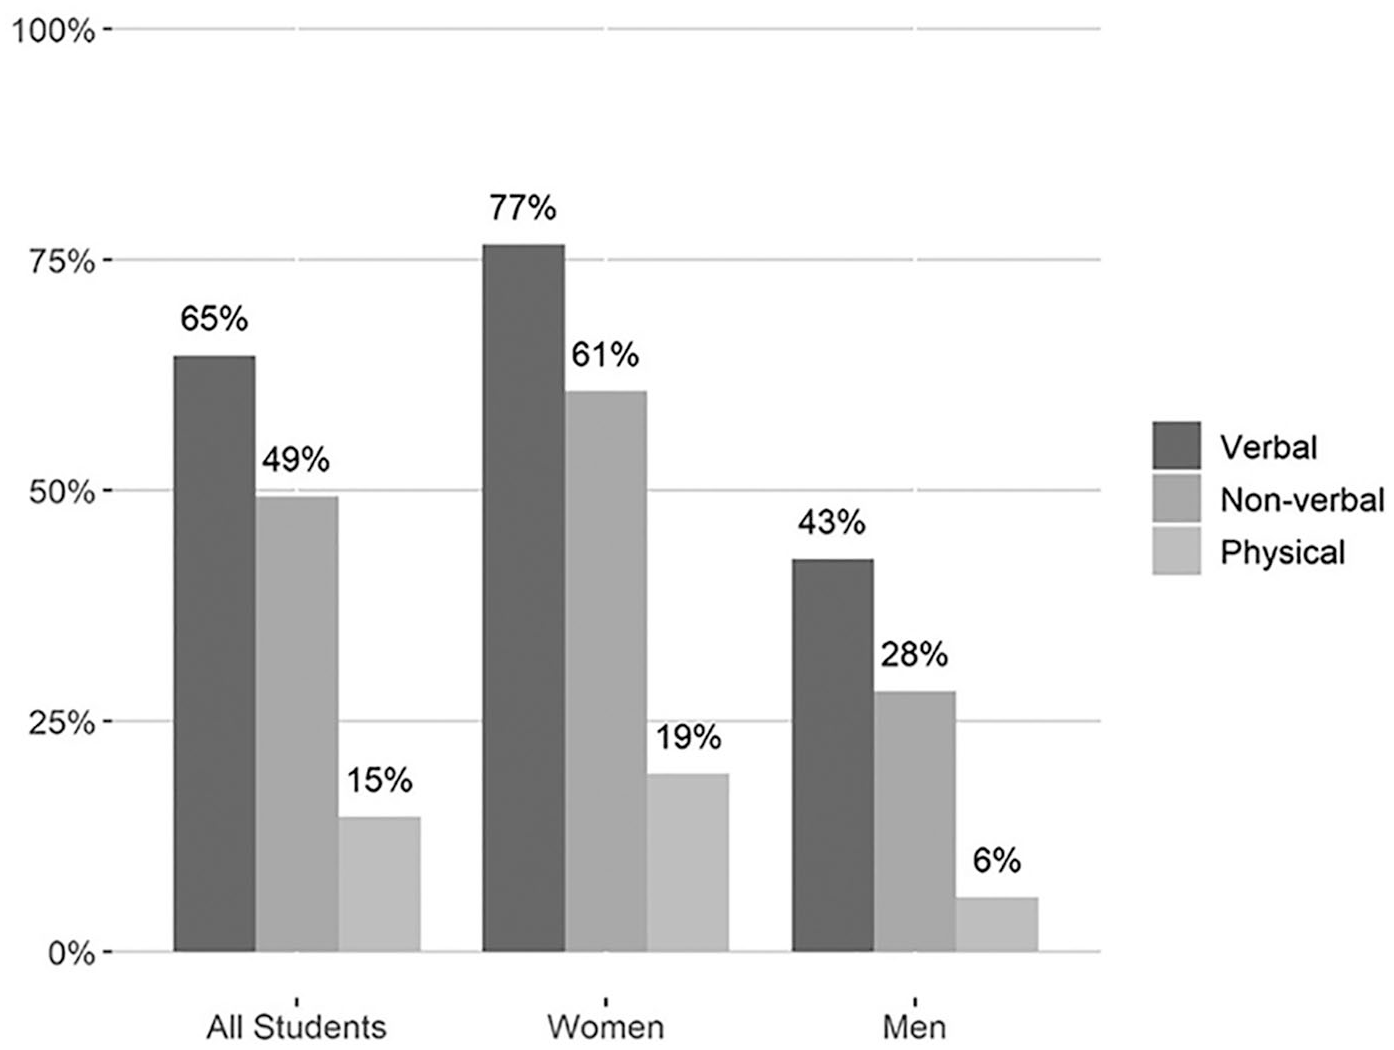
Sexual harassment was a very common experience among college students at the three campuses: 71 percent of respondents reported experiencing at least one type of sexual harassment behavior using the bus or rail system in Los Angeles. As Figures 1 and 2 show, verbal harassment was the most common form of harassment: 65 percent of bus respondents and 42 percent of rail respondents reported having experienced it over the last three years. Nonverbal/nonphysical harassment was also significant, with 49 percent of respondents on bus systems, and 32 percent of respondents on rail systems experiencing it. On the contrary, physical harassment was the least common; nevertheless, 11 and 5 percent of female respondents reported being groped on the bus and train, respectively.
Types of sexual harassment experienced by respondents on the bus system.
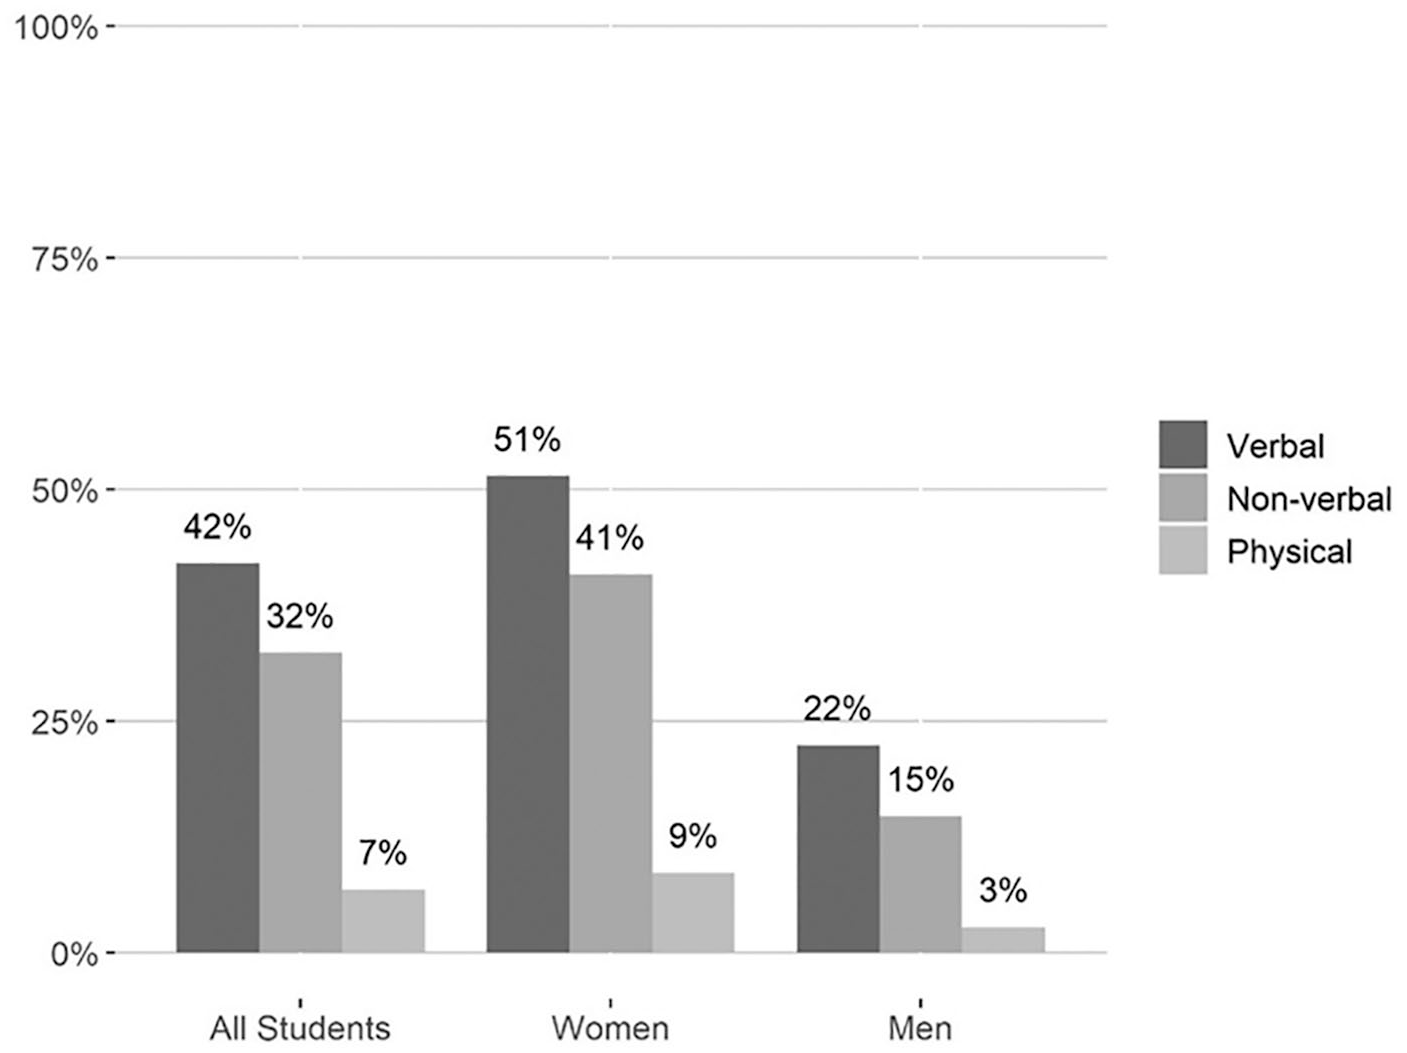
Types of sexual harassment experienced by respondents on the train system.
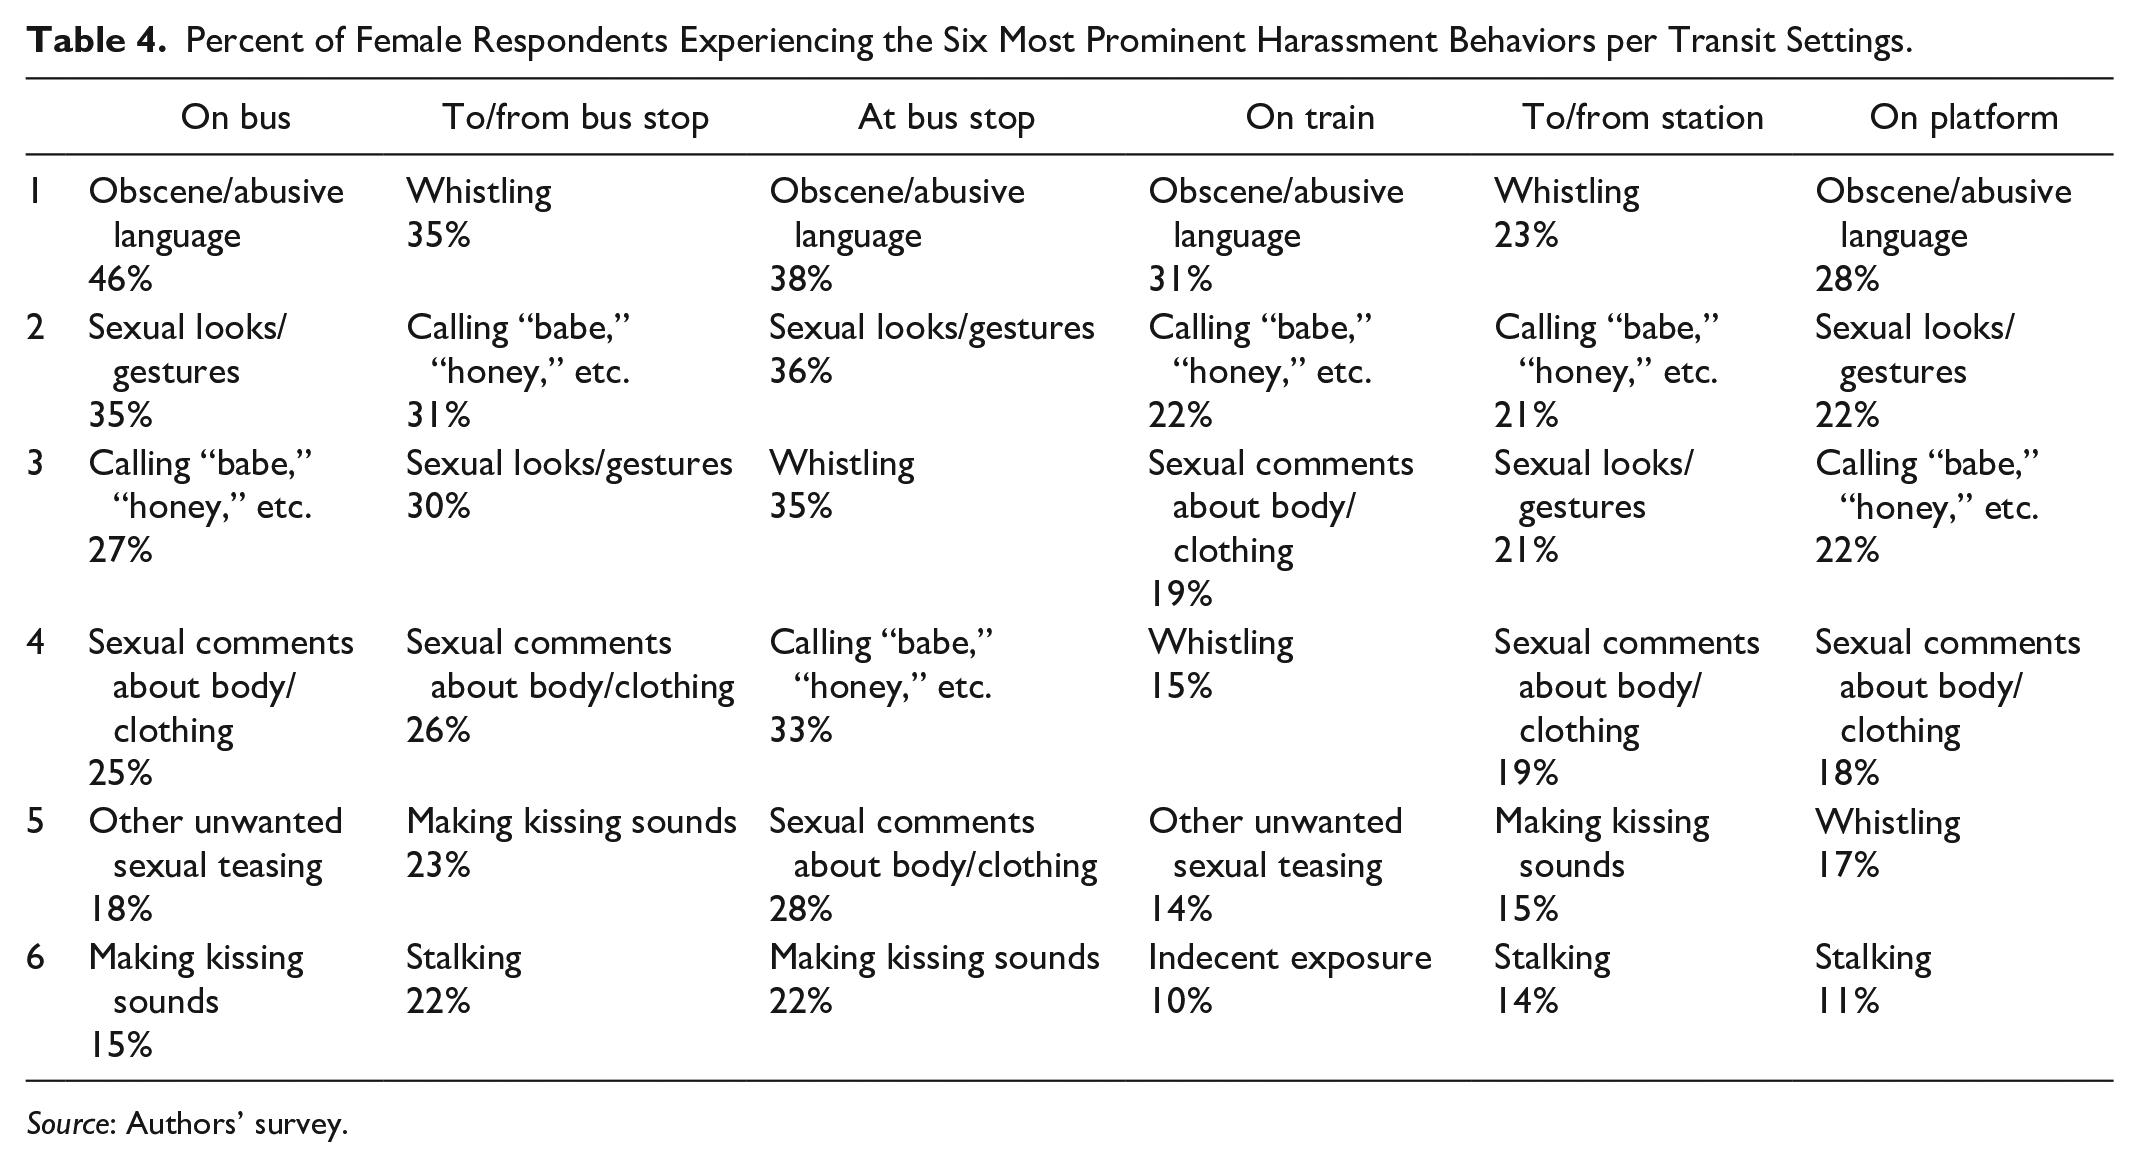
Certain individual characteristics of students and environmental characteristics of transit settings seemed to affect the incidence of harassment. Female respondents experienced harassment to a greater extent than male respondents at all different transit settings (Figures 1 and 2). But the setting where each type of harassment mostly occurred was different. For example, female respondents were more likely to experience groping on the transit vehicle than at the transit stop, while nonverbal harassment (from unwanted looks, to stalking, to indecent exposure) was more common at bus stops or during the walk to/from the stop. Verbal harassment took place at all types of transit settings (transit vehicle, bus stop, or platform, and during walk to/from the stop or platform), but different verbal harassment behaviors were more prominent at some settings than others. For example, women were more likely to be whistled or catcalled on their way to the bus stop or train station than while waiting for the transit vehicle. Table 4 shows the most prominent harassment behaviors experienced by female respondents in different types of transit settings. These behaviors are not considered “criminal” by the penal code; nevertheless they make primarily female students uncomfortable and force them to take precautions, as will be discussed below.
Percent of Female Respondents Experiencing the Six Most Prominent Harassment Behaviors per Transit Settings.
Source: Authors’ survey.
Certain subgroups of students were more harassed than others. Gender was a clear factor affecting harassment; significantly higher percentages of female respondents (81% on the bus and 57% on the train system) than male respondents (48% on the bus and 28% on the train system) reported experiencing some form of sexual harassment behavior; χ2 tests confirmed that this differential gender experience was statistically significant (p = .000). Race/ethnicity was also a significant factor affecting victimization; however, different types of harassment affected different racial/ethnic groups differently. Thus, χ2 tests showed that white respondents were more likely to indicate having been victims of verbal harassment (p = .017); Latino (p = .000) and Asian respondents (p = .002) were more likely to indicate victimization from nonverbal harassment; and Latino (p = .022) and white (p = .012) respondents were more likely to indicate victimization from physical harassment. The very small numbers of African American respondents prevented examination of their experiences separately.
According to χ2 tests, sexual orientation affected victimization in one transit mode: LGBTQI respondents run a statistically significant higher chance of being sexually victimized than straight respondents, but only on the subway (p = .002). However, when we broke the LGBTQI sample into LGBTQI women and LGBTQI men, we saw that LGBTQI men were not statistically more likely to be victimized than other men on the bus or train; in contrast, LGBTQI women were statistically more likely to be victims than straight women or straight men on either transit mode (p = .003). Last, frequent transit use increased the risk of victimization, likely because it results in greater exposure.
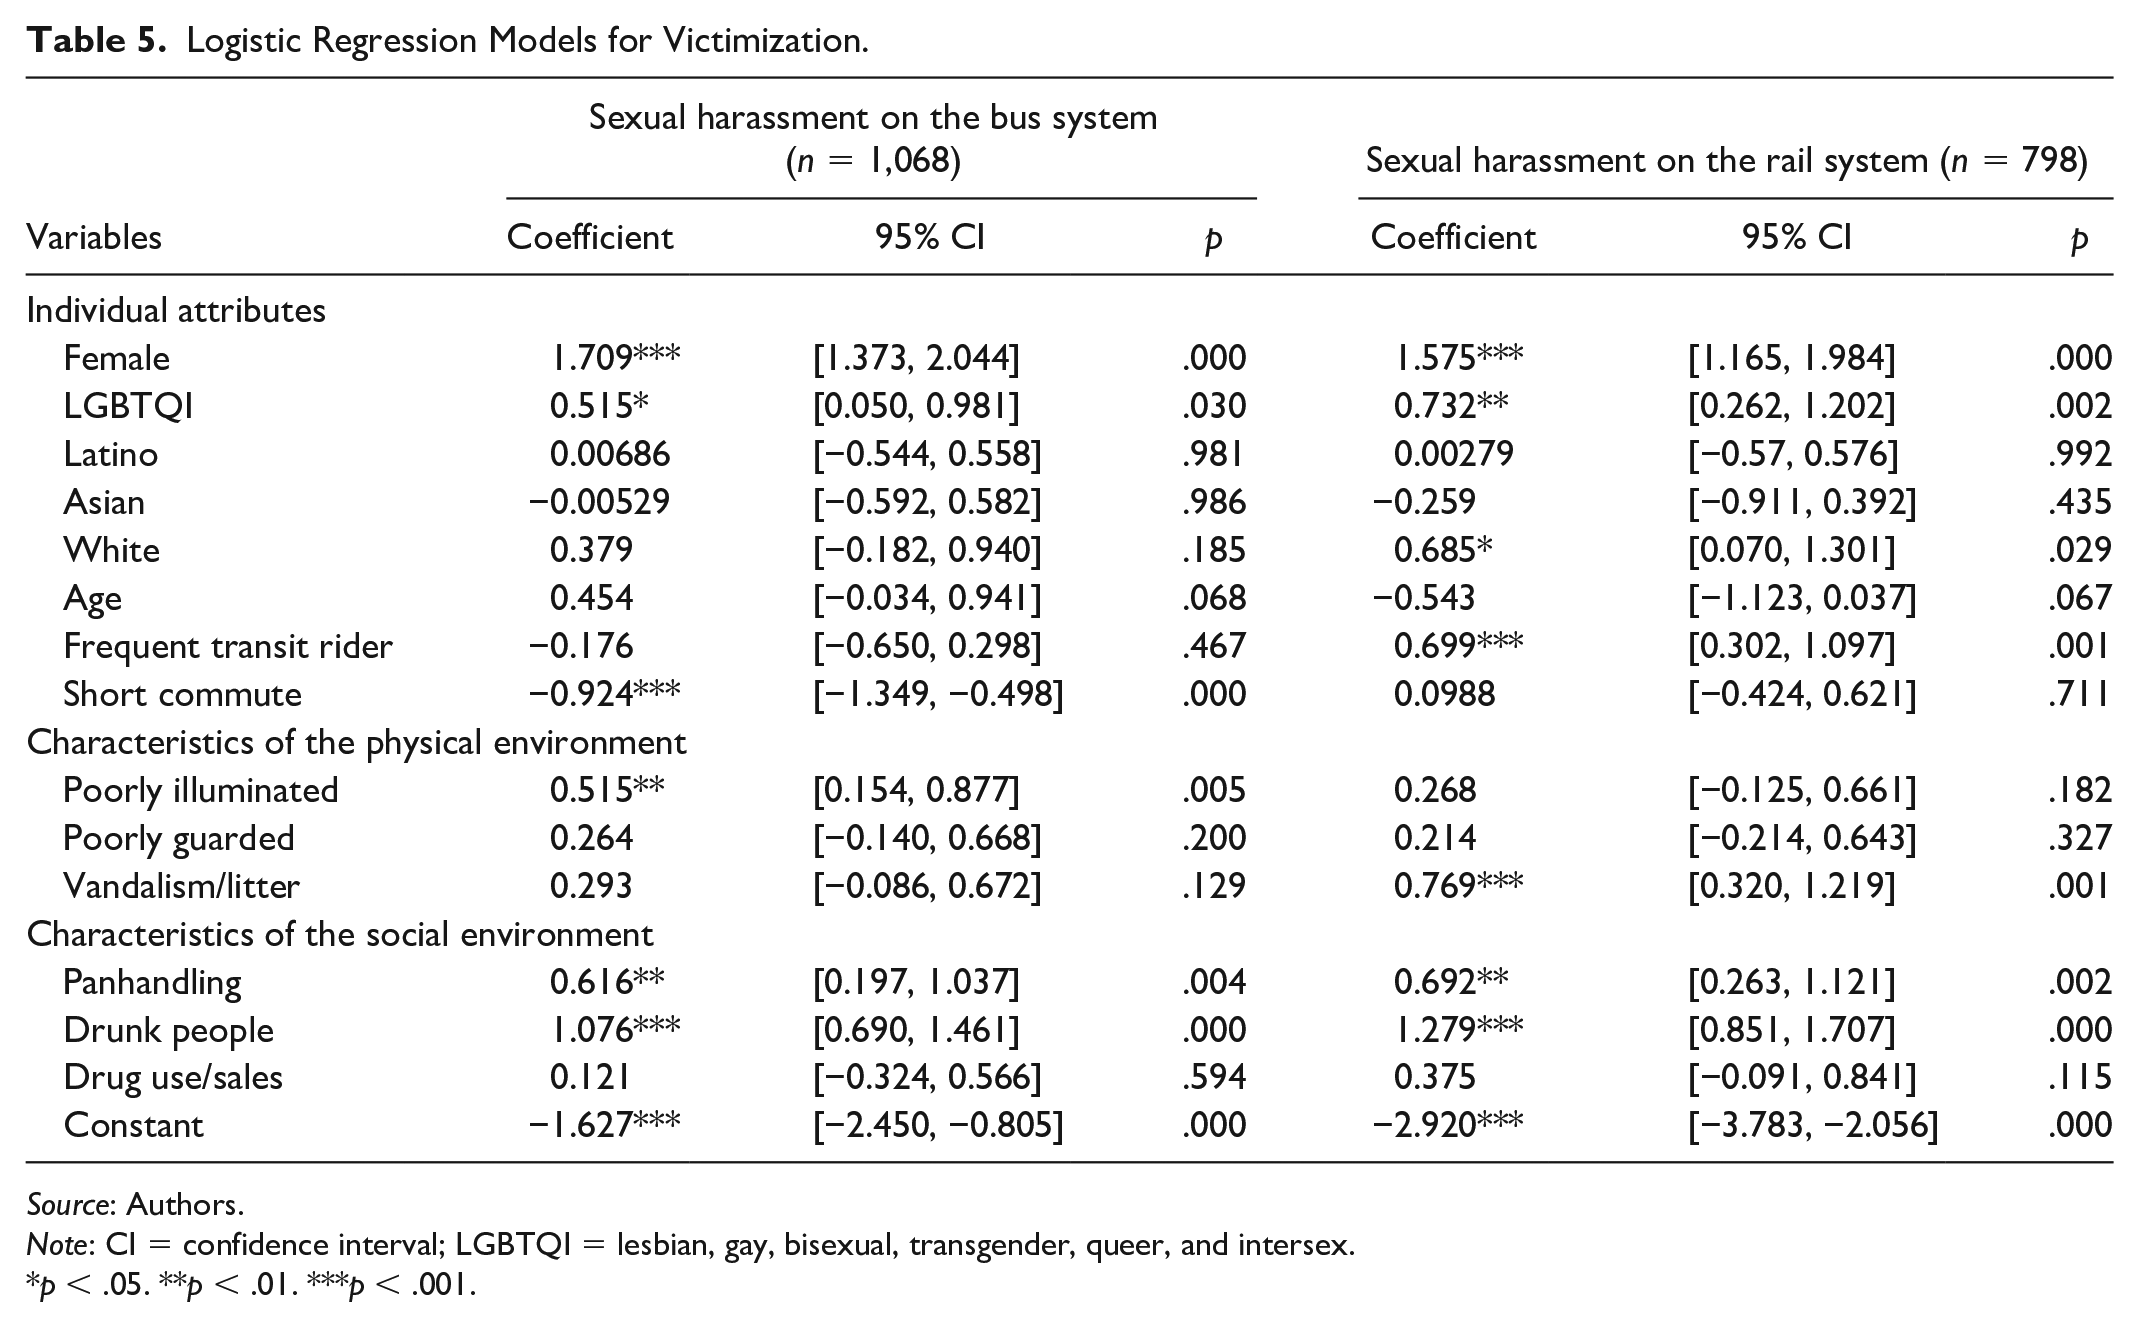
To understand the relative significance of the multiple independent variables on the incidence of victimization from sexual harassment, we ran two regression models (Table 5) examining victimization in the bus and in the train systems separately. In both models, the most significant predicting variable of sexual harassment was gender: depending on the transit mode, female respondents were 1.6 to 1.7 times more likely to be harassed than male respondents. LGBTQI respondents run a statistically significant higher risk of victimization in transit settings, while being white was statistically significant only for the rail model. Not surprisingly, respondents using the rail more frequently had a higher risk of victimization; however, we did not find a similar relationship between the frequency of bus use and sexual harassment. Students having short bus commutes were less likely to be harassed on the bus, but a short commute was not a statistically significant variable for the rail system. Some characteristics of the social environment of a transit setting, as reported by students, namely, the presence of drunk people and panhandlers were statistically significant factors relating to sexual harassment for both the bus and rail systems. Certain physical environment characteristics were also related to higher risk for sexual harassment: students indicating encountering vandalism/litter on the train system or poorly illuminated bus stops run a statistically significant higher risk of victimization.
Logistic Regression Models for Victimization.
Source: Authors.
Note: CI = confidence interval; LGBTQI = lesbian, gay, bisexual, transgender, queer, and intersex.
p < .05. **p < .01. ***p < .001.
Safety Perceptions
The perception of lack of safety on public transit can have an important impact on ridership (Delbosc and Currie 2012). Studies find that women riders are more likely to feel unsafe and exhibit higher levels of anxiety than their male counterparts (Smith and Cornish 2006). In a survey of riders waiting for the bus at the ten most crime-ridden bus stops in Los Angeles, 59 percent of women respondents felt unsafe, compared with 41 percent of men (Loukaitou-Sideris 1999). This female fear may relate to a higher risk of sexual victimization in transit settings (Best 2013). We found statistically significant gender differences among respondents in their perception of safety while traveling or waiting for the transit vehicle. While 45 and 41 percent of male students “always” felt safe waiting for or riding the bus or the train, respectively, during the day, only 26 and 21 percent of female students felt always safe riding the bus or the train, respectively, during daytime. For both genders, perceptions of safety in the bus or rail systems were significantly lower during nighttime. However, statistically significant higher numbers of women never felt safe waiting for the subway (28%) or bus (14%) at night compared with men (2% for train; 7% for bus).
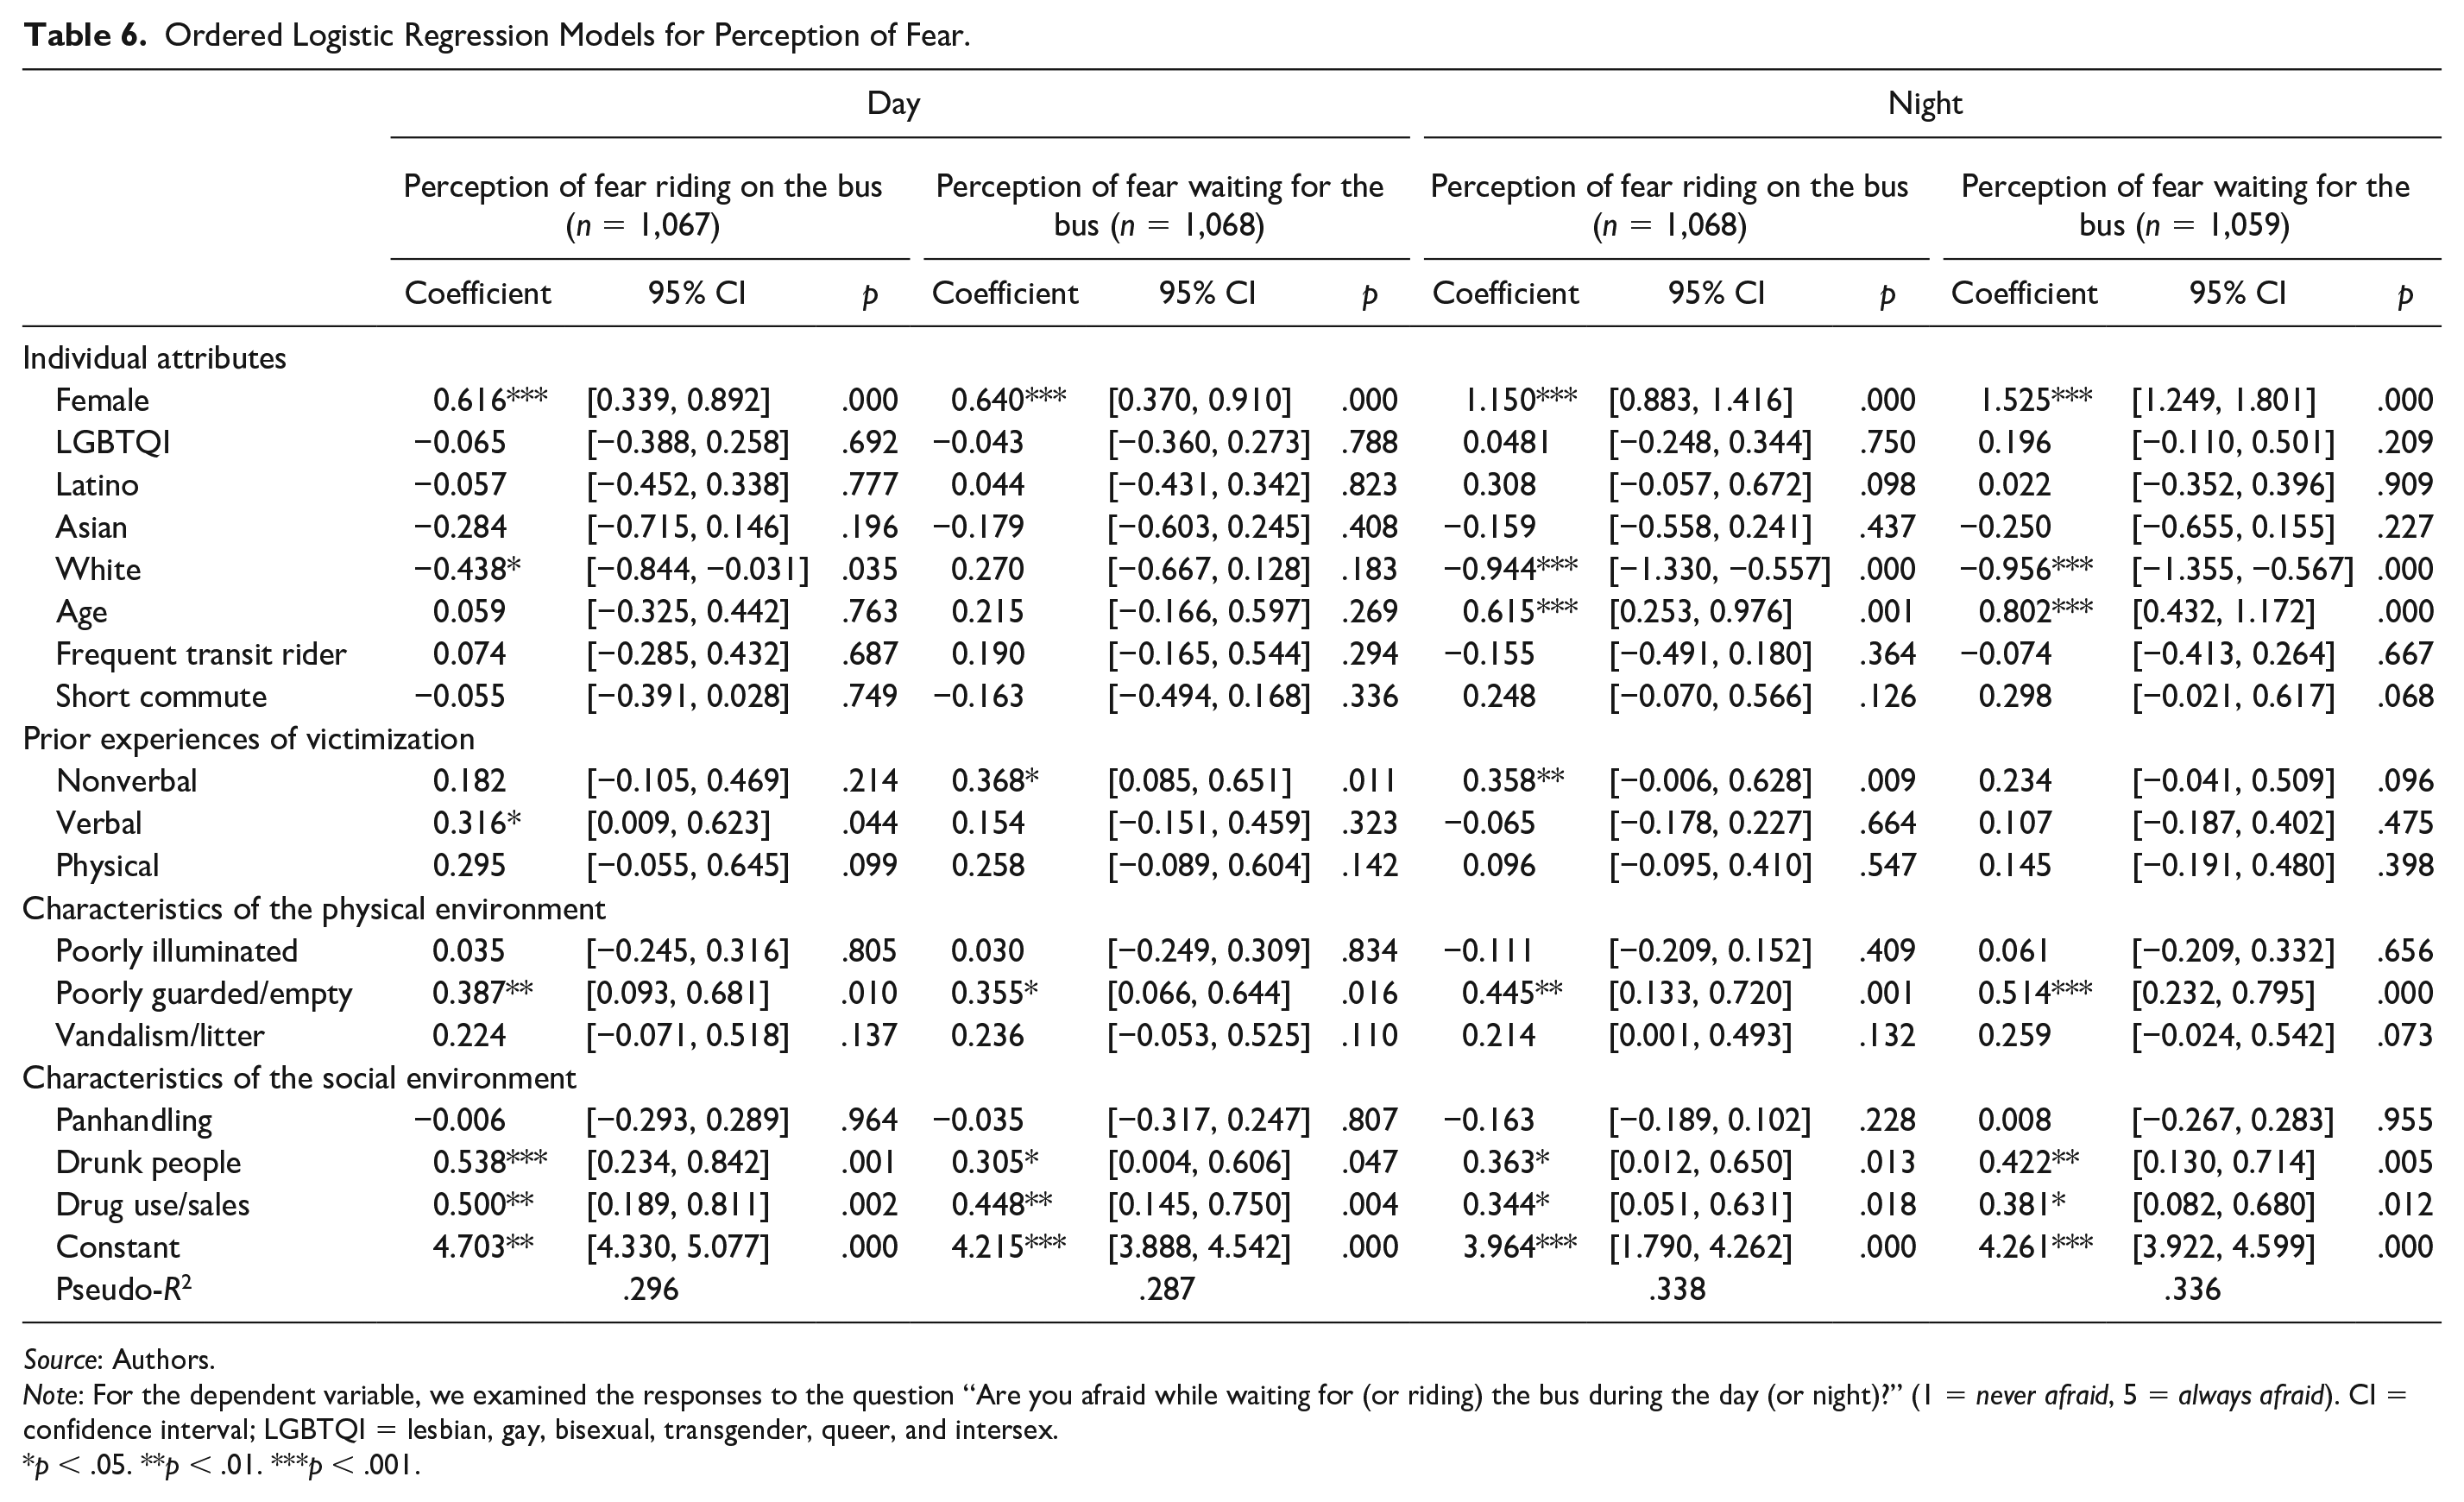
To understand the relative significance of the different independent variables on students’ feelings of fear while traveling on or waiting for the bus during day and nighttime, we ran four ordered logistic regression models (Table 6).
Ordered Logistic Regression Models for Perception of Fear.
Source: Authors.
Note: For the dependent variable, we examined the responses to the question “Are you afraid while waiting for (or riding) the bus during the day (or night)?” (1 = never afraid, 5 = always afraid). CI = confidence interval; LGBTQI = lesbian, gay, bisexual, transgender, queer, and intersex.
p < .05. **p < .01. ***p < .001.
Across all four models, the most significant independent variable was, again, gender, with female respondents much more likely than male respondents to express feelings of fear during their travel on the bus or waiting for the bus, day or night. White respondents were more likely to feel safe (likely because they use transit settings in safer neighborhoods), while older students (thirty years or older) were more likely to feel afraid during nighttime waiting for or riding the bus. On the contrary, sexual orientation was not a significant predictor of fear in any model.
The only environmental variable that was a significant predictor of fear across all models was “poorly guarded/empty” transit settings. The presence of drug sales or drunk people at the transit setting was a statistically significant predictor of fear during day and night. Last, prior victimization from nonverbal harassment was a predictor of fear for those waiting for the bus during the day or riding the bus at night.
While the slow journey times and unreliable bus service were the most important reasons that prevented most respondents from using bus transit more frequently, female students also listed anti-social behavior (44%), fear of victimization (34%), and sexual harassment (33%) as significant factors. In general, there were fewer complaints about the rail, but the three top reasons that female respondents reported as preventing them from using the rail system more frequently were anti-social behavior (35%), fear of sexual harassment (31%), and fear of victimization (30%). Table 7 shows the most common precautions reported by students in response to the fear of harassment.
Most Significant Precautions Adopted by Respondents.
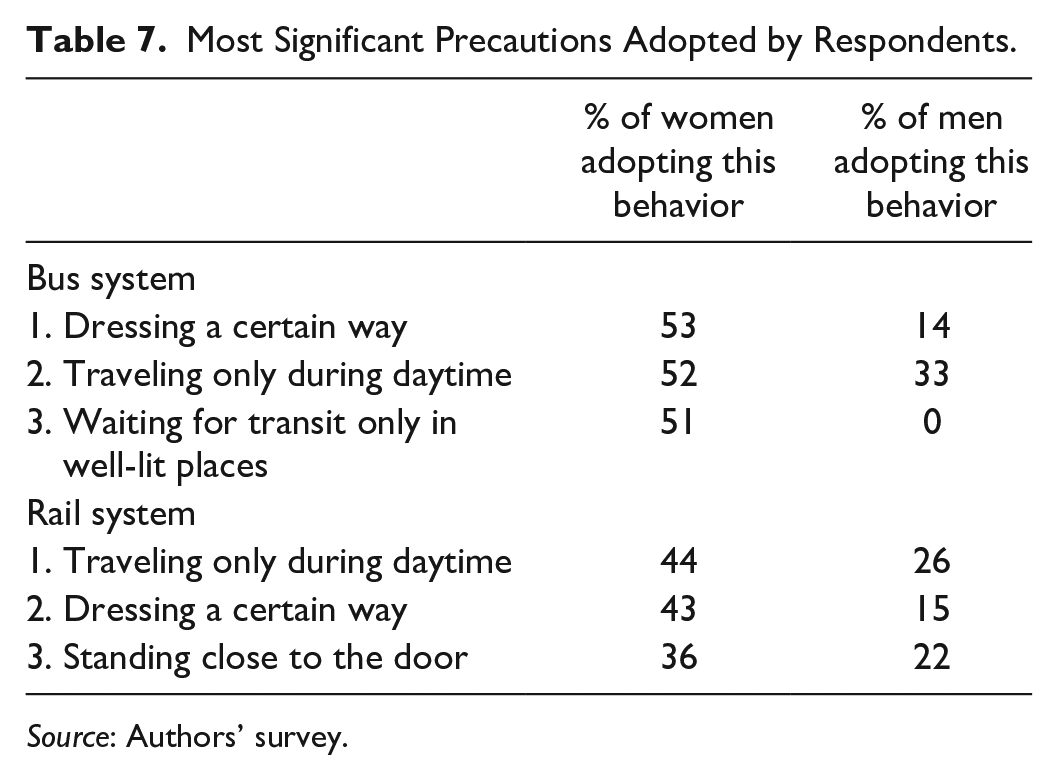
Source: Authors’ survey.
Reporting
Consistent with the findings of other studies, we found very significant underreporting of sexual harassment incidents. Only 10 percent of those who had experienced or observed sexual harassment on transit reported it. Reporting rates were similar between male and female respondents. The most common reasons given for not reporting included “did not believe that the criminal would be caught,” “to avoid trouble,” “the incident was not very serious,” “did not know how to report it,” and “was embarrassed.” The presence of bystanders did not appear to increase reporting: 64 percent of men and 68 percent of women who had witnessed a harassment incident on transit pretended not to see it; only 20 percent of women and 18 percent of men came forward and talked to the victim, and 14 percent of women talked to the offender; none of the men witnessing a harassment incident did so.
Differences among University Samples
We noted some statistically significant differences among the three university samples in the respondents’ perceptions of safety using transit at night. While only 5 percent of UCLA respondents indicated never feeling safe using the bus or train during nighttime, 21 and 19 percent of CSULA respondents and 20 and 19 percent of CSUN respondents reported the same for nighttime use of the bus and train, respectively. This difference in perceptions maybe a result of the geographic setting of each university. On the contrary, the percentages of students experiencing sexual harassment behavior in transit settings were not significantly different: 67 percent of UCLA students, 70 percent of CSUN students, and 73 percent of CSULA students. This may indicate that some of these harassment behaviors (especially verbal harassment) are widespread throughout transit environments.
Addressing Sexual Harassment in Transit Environments
Sexual harassment is a common but highly underreported occurrence in transit environments, disproportionally affecting some student groups. When asked about suggestions for addressing harassment in Los Angeles transit settings, both female and male respondents in all campuses gave similar suggestions, asking for more frequent transit service (to minimize long exposures at bus stops and train platforms), better lighting at transit stops, installation of security cameras and digital timetables at bus stops, and security patrolling of transit settings. On the contrary, women-only transit vehicles—common in some countries—were not popular among students.
Listening to student suggestions can be one of the first steps that transit operators can take to ease fear and perceptions of risk. But to tackle a phenomenon as pervasive as sexual harassment in transit environments, we need multi-pronged strategies that include research, design, and policy action.
In terms of research, we need to develop meticulous data collection methods that can help us understand what types of harassment take place at which types of transit settings. With few exceptions, most transit operators do not survey passengers about their harassment experiences. Even when surveying takes place, it is typically limited to on-vehicle experiences and does not inquire about the whole transit journey. At the same time, crime coding by the police in most cities does not take into account the different types of sexual harassment offenses. But as this study showed, it is important to understand how harassment may affect different subgroups of transit riders, and how characteristics such as age, race/ethnicity, sexual orientation, or disability may interact with gender to increase harassment risk. Studies about sexual harassment examine women as victims and men as perpetrators, as this is true for the majority of incidents. However, almost one-third of male students also reported victimization from verbal harassment. More research is necessary to understand the characteristics of harassment against male victims, and who are the offenders in such circumstances. Future research should also go beyond the simple women/men binary and examine how harassment affects gender nonconforming and transgender groups.
The regression models showed that certain characteristics of the physical environment may enhance or decrease harassment risk and student feelings of fear in transit settings. For example, desolate bus stops increased the fear felt by survey respondents. Crime Prevention through Environmental Design (CPTED) strategies that have been shown to have positive impacts on transit crime reduction (Cozens and Love 2015) may help deter sexual harassment offenders. For example, placing bus stops near people and activities better allows for natural surveillance (Loukaitou-Sideris 1999), and the addition of lighting at dark bus stops and CCTV cameras at station platforms would not only help increase visibility but also lessen the fear of some transit riders. In addition, installing digital timetables at some bus stops, a common feature of rail stations, would ease rider anxiety, especially at night (Yoh et al. 2011).
The regression models also showed that certain characteristics of the social environment, such as drunk individuals and drug use/drug sales at transit stops, may increase the incidence of sexual harassment. Employing more security patrols in these problematic locations would be helpful. However, we should also underscore the tension between increasing policing and issues related to systemic discrimination against certain racial/ethnic groups in the criminal justice system. While some students explicitly asked for more police, others emphasized that “more cops is not the answer” and preferred the presence of transit agency staff. In general, respondents not only wished for more security but wanted security to be better allocated and targeted. As some students wrote, Sometimes there are securities [sic] or police officers on the bus/ trains/ platforms but they are not circulating the area. That’s my concern. I don’t believe the police should be in buses for protection, but there should be like a safety task force riding in buses to help with any conflict.
A series of policies can make the incidence of sexual harassment in transit environments more visible to the larger public and public agencies. Public outreach campaigns in social and print media and signs and posters on buses, trains, and transit stops, as well as educational campaigns at high schools and colleges can tout how sexual harassment is an offense and encourage bystanders and victims to report it. Transit and police agencies should also find ways to make reporting easier. Being able to report harassment incidents online or text to a dedicated police line in real time (as the incident is happening) might help increase reporting and catching the offenders. As suggested by a student, “there should be a number that can be texted when there is a problem . . . Especially on trains, no one is going to use the intercom—it’s too public and people are too afraid.” Transit operators may also increase staff training so that they know how to respond when/if they become aware of harassment incidents.
Increasing transit frequency and reliability will minimize the time that a rider has to wait at a transit stop, reducing the risk of harassment. A number of student comments alluded to this fact: We need more buses after 8 pm so we don’t need to wait 45 min in the dark with no light. Increased frequency and reliability of services would increase security greatly. I just wished the buses would come more often so I wouldn’t have to wait by myself for 20 minute.
Smart phone Apps showing real time transit vehicle arrival information can help riders plan their trip to avoid long waits (and harassment exposure) at the transit stop. Finally, as groping and other physical harassment take place primarily in overcrowded transit vehicles, adding more transit vehicles and vehicles of higher capacities during peak hours will also help reduce overcrowding and groping.
Conclusion
Transit operators have an important role to play in tackling sexual harassment, but they alone cannot singlehandedly end its occurrence. Larger changes also need to happen in the criminal justice system, so that penal codes encompass the full cadre of sexual harassment behaviors as criminal offenses and define appropriate penalties for each. Finally, parents and teachers should tout to their children and students from an early age the importance of respect toward the other gender. As one student added at the end of her questionnaire, “I think there generally needs to be more emphasis on teaching how to respect others in public space.” In conclusion, we all need to recognize that sexual harassment is a phenomenon that affects and hurts many people, limiting their mobility and increasing their fears. Eliminating sexual harassment from transit settings will make the travel of different groups and their access to opportunities around the city safer and more pleasurable.
Footnotes
Acknowledgements
This study was funded by the California Department of Transportation (Caltrans) through the University of California Institute of Transportation Studies. We would like to thank Mr. Bradley Mizuno and Ms. Christine Azevedo from Caltrans, who oversaw our study, and Ms. Penny Menton (UCLA Events and Transportation), Ms. Carmen Gachupin and Ms. Betina Cervantes (CSU-LA Department of Public Safety), and Mr. Ken Premo (CSU-Northridge Associated Students) for helping us administer the survey to their campuses.
Declaration of Conflicting Interests
The author(s) declared no potential conflicts of interest with respect to the research, authorship, and/or publication of this article.
Funding
The author(s) disclosed receipt of the following financial support for the research, authorship, and/or publication of this article: The authors received funding support for this study from the California Department of Transportation through the University of California Institute of Transportation Studies.