
Abstract
Do violence during a civil war and its aftermath leave a mark on political behaviour? In this article I study how violence perpetrated by the left and repression by the right during and after the Spanish Civil War shaped vote choice and turnout in 1977, in the first legislative election after a 40 year dictatorship. I argue that the effect of repression travels over time when actions are perpetrated by clearly identifiable antagonistic actors. By using a dataset that captures the intensity and the type of violence, results indicate that repression perpetrated by the Francoist dictatorship during and after the conflict had a positive and significant effect on left-wing support in 1977. Results are consistent across different indicators, such as religious violence, distance to mass graves or sanctions to teachers, confirming that violence triggered greater support for the political left. In contrast, results show no relationship between repression and turnout.
Introduction
Under what conditions, and in what direction, does violence by a particular side towards a population with particular political leanings impact vote choice and political participation in the long run? Despite the recent interest on the effects of conflict on political behaviour, the empirical evidence on whether repression leaves a long-term positive or a negative imprint on how people vote is still mixed. This article studies whether, and in what direction, violence affects political behaviour in the long run, in the founding elections, a moment of ‘high drama’ (O’Donnell et al., 2013). More concretely, it empirically analyses the legacy of violence focusing on what occurred in Catalonia during and immediately after the Spanish Civil War and its effects on the 1977 election, when Spain celebrated the first open and free election in 41 years.
This paper argues that the effect of violence and repression travels over time when violent actions are perpetrated by clearly identifiable antagonistic actors. We contend that violence turns voters against the side that committed it and that more intense violence by one side or another tilts electoral behaviour against the more violent perpetrator. Thus, and despite the potentially paralysing effect of repression, people affected by repressive events react when a window of opportunity arises, such as the first democratic election after four decades. Looking at the founding election carries a clear substantive advantage: in founding elections both citizens and political actors generally have low information and unclear expectations about the outcome. Parties are less likely to coordinate into pre-electoral coalitions or to strategically run in certain districts. Consequently, in founding election voters are more likely to vote expressively, and to disregard strategic considerations. The Spanish case, where partisan competition almost neatly reflected the poles of past victimization, offers an ideal setting that can inform us about what might happen in founding elections in other post-conflict societies that transition from a (violent) conflict to a democratic regime.
This study makes three contributions. First, it contributes to the literature on the relationship between the long-term effects of violence on electoral behaviour. The debate on the topic has been intense. For instance, while Voigtlander and Voth (2012) and Fontana et al. (2017) find that violence has a negative impact on political polarization, Costalli and Ruggeri (2019) shows that civil war violence in Italy increased support for the left. As for turnout, the debate is also vivid: on the one hand, Balcells (2012) finds no effect of violence on political participation; on the other hand, Booth and Richard (2006) and Blattman (2009) conclude that violence increases turnout, while Zhukov and Talibova (2018) show that exposure to violence decreases political participation.
Second, compared with most previous works, this article focuses on a case in which violence did not come from an external actor or from repressive actions solely perpetrated by the authoritarian regime. Instead, the Spanish Civil War constitutes a paradigmatic case of a conventional civil war (Beevor, 2006), in which violence came from two opposite ideological groups. On the one hand, the left was composed of the loyalists to the democratic Republican government. Once the Civil War started, some left-wing groups violently reacted against those actors, such as the Church, that explicitly or implicitly supported the coup d’etat. On the other hand, the right was against the Republic and in favour of a dictatorship and it also unleashed severe repressive measures against the loyalist Republican actors. 1 Catalonia, the region included in the analysis, arises as a suitable case of study as it witnessed high levels of both left-wing violence and repression by both Republican actors and the Francoist dictatorship.
Finally, the research design employed in the article unpacks a plethora of repressive actions perpetrated by the left (‘red’ violence) and the Francoist dictatorship (‘blue’ repression), such as the number of executions, sanctions to teachers or proximity to mass graves. Most crucially, I take advantage of an original list of victims that includes a complete census of repressive actions undertaken by the dictatorship, which represents a contribution in itself.
The empirical strategy is based on a series of regression models and, in the second part of the empirics, I make use of a geographical regression discontinuity design (GRDD). In the latter, I compare municipalities just east and just west of the Lleida front-line, a battlefront that was stable during nine months because both armies decided to devote a large amount of resources to another battle (the Ebre battle). As I show, this discontinuity is exogenous (and therefore uncorrelated) to pre-existing differences.
Results are in line with my argument and show that left-wing violence is associated with less support for the left 40 years later, in the 1977 election. However, this effect is largely compensated by the positive effect that repression perpetrated by the dictatorship has on left-wing support. In substantive terms, in places where Francoist repression was one percentage point higher, left-wing support in 1977 was 0.7 percentage points higher. Notably, the effect is consistent across different models and indicators of repression and seems to be driven by places that experienced hard repressive actions, like jail time or executions. Overall, findings are consistent with the idea that right-wing repression triggered greater support for the forces on the opposite ideological side than that of the autocratic regime. Finally, this article finds no support for the idea that violence or repression affects political participation.
Legacies of violence
Scholars have devoted increasing attention to study the long-term effects of violence on political behaviour and political and social attitudes. Most works agree that the effect of violence on post-conflict societies profoundly shapes how people think about politics or interact with the state (Simpser et al., 2018). Studies suggest that, at least in the short run, violence has the potential to increase collective action (Bellows and Miguel, 2009; Blattman, 2009; Bauer et al., 2016), decrease political trust (Grosjean, 2014) or even increase it in the case of terrorist attacks (Wollebaek et al., 2012).
Moving beyond the short-term effects, a vibrant research agenda has argued that the traumatic experiences associated with a conflict are likely to mark people's attitudes in the long run (Argenti and Schramm, 2012; Heberle et al., 2020), as the memory of violence, or the new norms associated with it, is passed on through family socialization to the new generations (Lupu and Peisakhin, 2017), leaving an attitudinal residue that goes beyond the generations directly affected by violence (Aguilar and Ramírez-Barat, 2016; Neundorf and Pop-Eleches, 2020). Fontana et al. (2017) has found that the intensity and duration of World War II in Italy left a lasting legacy on vote choice: the vote share of the extreme left parties was larger in municipalities that were more exposed to violence. Similarly, Blattman (2009) shows that violence among Uganda ex-combatants led to political activation and Bellows and Miguel (2009) conclude that individuals whose households directly experienced more intense war violence are more likely to vote. Chiou and Yeon-Hong (2021) find that Taiwanese citizens were less supportive of the Kuomintang where repression by the KMT army was more intense. Rozenas et al. (2017) show that Stalin's indiscriminate violence reduced long-term political support for the perpetrator. Finally, Balcells (2012) finds that victimization experiences during the Spanish Civil War led to the rejection of the perpetrators’ identities along the left–right dimension and Rodon and Tormos (2022) show that old age cohorts exposed to higher levels of repression are less likely to support Catalan secession decades later.
As the previous summary illustrates, the debate about the long-term effect of violence on political behaviour is still unsettled. Besides the question of whether violence triggers apathy or mobilization – also known as the repression–dissent nexus or the repression–mobilization nexus (Lichbach, 1987; Hirsch, 1990; Earl, 2011) – efforts to understand the conditions under which, and in what direction, violence by a particular side of a conflict impacts political behaviour in the long run are still scarce. A notable exception comes from Villamil (2021), who argues that memories of the violence perpetrated during the Spanish Civil War are capitalized to increase mobilization when local networks opposing the regime are created or maintained.
Disparate findings may also stem from the fact that the literature has some unresolved questions. First, albeit with exceptions, it has mainly studied contexts in which one side of the conflict – normally the autocrat – inflicts higher rates of violence or contexts where external forces (for instance, a different country) perpetrate most of the violence on the local population (such as the case of the Nazis in Italy during World War II). Second, most works focus on the consequences of violence when this mainly comes from one side of the conflict, either because most violent events are perpetrated by one side or because of data availability. Albeit with notable exceptions (Balcells, 2012), works largely ignore the countervailing effects of having experienced violence from multiple perpetrators and in many different forms, and the effect this exerts in the long run. Third, as pointed out by Gutiérrez-Sanín and Wood (2017), political violence does not constitute a single coherent event, but rather a configuration of repertoire, targeting, frequency and technique. This distinction means that studies need to not only empirically capture different types of violence, but also consider the theoretical underpinnings of how they affect political behaviour in the long run. Finally, and particularly in third-wave democracies, such as Spain, Portugal and Greece, scholars have argued that countries that recently experienced a violent authoritarian regime report higher levels of political distrust and lower levels of confidence towards the political system, which they argue should lead to lower levels of electoral participation (Di Palma, 1970; Montero et al., 1997; Magalhães, 2005; Torcal and Montero, 2006). Yet we do not know whether the behavioural implications of this distrust can be observed in political participaton or no vote choice.
This article argues that the effect of violence and repression travel over time when violent actions are perpetrated by clearly identifiable antagonistic actors. It suggests that the creation of collective memories of the violence and its translation into political preferences occur even if both sides engage in violent tactics or even in the absence of clandestine networks of opposition (Villamil, 2021). In a conflict with a clear winner, such as the Spanish Civil War, the winners and the losers of the conflict are clearly identifiable, thereby forcing people to sit with one side over the other. The use of violence and repression strengthens this differentiation, encouraging out-group and in-group dynamics (Tajfel and Bruner, 1981; Bauer et al., 2014), and makes the effect of victimization more likely to persist over time. When the transition to democracy occurs, voters are still able to identify the side they favour – and the one they dislike – which eventually shapes their political behaviour. Overall, I argue that some citizens hold political parties accountable for past violence. This idea goes in line with previous research on political persistence, which suggests that post-conflict institutions are crucial components of the transmission of political allegiances over time (Simpser et al., 2018). I contend that violence makes voters more likely to vote against the side that committed it and that more intense violence by one side or the other tilted electoral behaviour against the perpetrator that exerted more violence.
The main empirical implication of this process is that violence and repression undertaken by the winners (or the losers) will leave a long-lasting effect on political behaviour. Even though the winners – more so if the war is followed by an authoritarian regime – will probably try to legitimize, and hence dissipate, the negative consequences of their actions perpetrated during the conflict, I argue that the in-group/out-group processes will persist. 2 Despite countervailing violence dynamics (Kalyvas, 2006; Balcells, 2017), if voters are able to distinguish both sides of the conflict, which is what occurred in the Spanish case, the reminiscence of violence will persist over time. In addition, I argue that violence produces a legacy of victimization that intensifies with the magnitude of violence. 3
In the case of Spain, this mechanism of attribution affected political behaviour patterns because the repression perpetrated by the dictatorship was more intense and lasted for a long period of time (Solé-Sabaté and Villarroya, 1993; Blanch, 2004). The Francoist dictatorship engaged in intense repressive actions in the aftermath of the civil war (mainly up until the mid 1950s) and the governmental propaganda reminded everyone, right until the end of the dictatorship, of the atrocities committed by left-wing actors. The winner of the civil war globally perpetrated higher levels of repression over time and did not engaged in a pacific, cross-ideological reconstruction. This might have served many citizens as a reminder of the atrocities committed by the dictatorship. Thus, in the qualitative accounts given by Balcells (2012) for the Spanish civil war, interviewees clearly mention their political group and they are always capable of identifying each side of the conflict. In the 1977 election, the first democratic contest to be celebrated since 1936, parties were aligned between those associated with Francoism and those opposing the dictatorship. Last but not least, many candidates on the right-wing side were former ministers during the Francoist regime, while those on the other side had been important oppositional figures during those years.
The scars of the Spanish civil war and the Francoist dictatorship in Catalonia
This article uses Catalonia as a case study. As part of Spain, the Catalan region witnessed the Spanish Second Republic (1931–1939), the civil war (1936–1939) and the Francoist dictatorship (1936–1975) before the transition to democracy and the first free legislative elections (1977). The Spanish Second Republic started on 14 April 1931. During this period, numerous reforms were carried out, including an important land and religious reform and a devolution process to grant certain powers to Catalonia by passing a Home Rule Law. However, the Republican period also witnessed high levels of polarization and conflict. There was increasing violence between the left and the right, and various strikes and popular uprisings contributed to the instability of both left-wing (1931–1933 and 1936–1939) and conservative governments (1933–1936). A few months after the left-wing victory in February 1936, General Franco attempted a military coup d’etat, which was met with serious resistance and eventually led to a full-blown civil war. The Second Spanish Republic effectively came to an end on 1 April 1939, when General Francisco Franco and his army was declared victorious. After four decades of dictatorship, the dictator Franco died in 1975 and Spain slowly transitioned to a parliamentary monarchy. The first democratic election was held on 15 June 1977, with the goal of electing a Constituent Cortes to draft a new constitution.
Although Catalonia differs from the rest of Spain in some important characteristics (higher levels of industrialization, a higher salience of the centre–periphery cleavage and a different party system), it is also a suitable case for the analysis. First, Catalonia experienced high levels of both left-wing violence, perpetrated by different left-wing groups after the coup d’etat, and right-wing repression, perpetrated by the dictatorship during and after the civil war – especially up until 1945 (Terradellas, 2015). Both actors were clearly antagonistic and identifiable, which solidified the in-group/out-group logic over time.
Second, the context of violence and repression during and after the Spanish Civil War can be classified as a critical juncture in the recent country's history. With the goal of ‘evangelizing’ the opposition, the Francoist forces designed a detailed plan to repress the enemy (Solé-Sabaté and Villarroya, 1993). This process was especially intense in the Catalan region: Franco cancelled the autonomy granted to the region, ordered the execution of the Catalan prime minister and banned the Catalan language and all the Catalan symbols.
Third, a common narrative in Spain by many has long stated that the transition to a democracy succeeded because many elites were able to set aside or forget grievances from the past (Higley and Gunther, 1992). 4 Therefore, if this conventional wisdom is correct, we should not expect any relationship between violence and repression during and after the civil war and the founding elections in 1977. However, one ought to consider that the Spanish transition was a confrontational period and the uncertainty about the new regime was very high, which migh have served as a reminder of the past (Sánchez-Cuenca and Aguilar, 2009).
Political campaigns in the 1977 election revolved around many issues that were directly linked to the dictatorship or even the Second Republic, such as the role of the monarchy, the role of the army or whether Communist forces will be loyal to the new democratic regime. The agreed transitional nature of the newly established democracy also meant that many political parties and candidates had a clear connection with the dictatorship. The Prime Minister Adolfo Suarez, deputy in the Francoist Cortes and in charge of piloting the transition after 1976, was the candidate in 1977 of the reformist Unión de Centro Democrático, and Fraga Iribarne, minister during the Francoist period and, most notably, Minister of the Interior between 1975 and 1976, a role that often placed him in the spotlight for his use of the police and repressive apparatus, was the candidate for the conservative Alianza Popular. In the left-wing camp, the candidates in Catalonia of both the PSC (Socialistes de Catalunya) and the PSUC (Partit Socialista Unificat de Catalunya), the most important left-wing parties, were well-known figures that made a name for their clandestine activities against the Francoist regime – especially the PSUC. Regarding the role of the territorial cleavage, in the 1977 election it was not as salient as it would be in subsequent years, mainly owing to parties’ efforts to prioritize democratic reforms and to the ambiguity of the territorial claims. All in all, in the run-up to the 1977 election partisan competition generally reflected the poles of past victimization and voters were able to identify a robust connection between parties and their past violent actions.
Finally, I focus on Catalonia for practical reasons. Although other Spanish regions have data on repression (see, for example, Balcells (2017) and Villamil (2021)), the data for Catalonia cover many different repressive actions, which allows me to validate the results using different measures and see potential differences between them. For example, as I detail below, I make use of a recently published list of judicial repair to victims (Solé-Sabaté, 1985; Terradellas, 2015) that constitutes a comprehensive census of all victims of reprisals by the dictatorship. Most importantly, I am able to include pre-War electoral behaviour patterns and, therefore, to control for the persistence of voting patterns over time. None of the other regions offers such rich information.
Data
Election results
The empirical analysis employs a dataset built from primary and secondary sources. The analysis explores the effect of violence on the first difference between the left-wing (or turnout) vote share in 1977 and 1936. We subtract 1936 from 1977 values. Since support for the left was on average higher in 1936 than in 1977, the average is negative (mean −16.9) and hence values approaching zero or positive values imply that support for the left (or turnout) on a given municipality was higher in 1977 than in 1936. Following previous works, such as Balcells (2017) and the Villamil (2021), we also include a measure of the vote share received by the left in 1936 in order to control for different baselines. This control is important as I aim at analysing the effect of repression on vote choice and abstention net of long-term trends in political behaviour.
Data on the 1936 election results comes from Vilanova (2005), whose work includes all parties’ vote shares, turnout and electoral census at the municipality level. We considered the left vote share as the electoral support received by the leftist coalition Front Popular (Popular Front) in each municipality. Data from the 1977 election comes from the Catalan Department of Public Administration. In the share of the votes received by the left, I include the three main Catalan leftist parties at the time (PSC, PSUC and ERC) and several small left-wing political formations: the main left-wing parties were the Socialists of Catalonia (PSC), the Unified Socialist Party of Catalonia (PSUC) and the Republican Left of Catalonia (Esquerra Republicana de Catalunya or ERC). Crucially, these last three left-wing parties made the issue of the Francoist regime's repression very salient in their campaign and were clearly seen as anti-Francoist organizations. This was especially the case for the PSUC, which was identified by the public as the main anti-regime political organization (Puigsech, 2001). Contrary to the Communist Party in the rest of Spain, the PSUC had an important organizational base and, eventually, a comparatively larger electoral support. In total, the support for the left variable captures the vote share of 12 left-wing political organizations. The 1977 election in Catalonia was won by the PSC with 28.55% of the votes (15 seats). The PSUC was second and obtained 18.31% of the votes (and 8 seats). The ERC got 4.72% of the votes and one seat.
The focus on the 1977 legislative election is important for two reasons. First, information about the election outcome was low, including potential government coalitions. Crucially, as is usually the case in founding elections, many parties decided to run – 19 parties ran in the four Catalan districts – which gave voters a wide range of ideological options. Although some pre-electoral coalitions were formed (Gunther et al., 1988; Hopkin and Gunther, 2002), founding elections are considered a tabula rasa moment in which parties and voters have less information about their respective behaviour, making coordination in terms of pre-electoral agreements less likely (Bielasiak, 2002). Second, from the demand side, voters had little information about the future election result – only a few pre-election polls were published – lowering the incentives to cast a strategic vote and, in turn, increasing expressive voting (de Kadt, 2017). Despite it usually being regarded as peaceful, the period of transition to democracy was often marred with violence. As reported by Sánchez-Cuenca and Aguilar (2009), there were 504 fatalities owing to political violence between 1 January 1975 and 31 December 1982. At the same time, the number of protests was remarkable: between May 1976 and December 1978, 965 demonstrations were organized with an estimated participation of more than 13.5 million people. Therefore, while instrumental considerations were arguably lower compared with subsequent elections, this does not mean that voters did not have them in mind, as they might have feared that certain results could destabilize the transition to democracy.
The focus on this election is a notable difference from previous works, which, albeit with some exceptions (Villamil, 2021), mostly average out results from different elections over a long period of time. Focusing on the founding elections is important in itself, as these key elections may shape not only future electoral politics, but also the characteristics or the sheer existence of the democratic system (Gunther et al., 1988; Bielasiak, 2002).
Finally, it is important to highlight that the number and the boundaries of the municipalities in the Second Republic and in the 1977 election were different. To deal with it, I proceeded in the following way. First, I reconstructed the 1936 shapefile in order to distinguish the boundaries of the total number of municipalities in 1936 (1062 municipalities). Second, I matched these municipalities with the 1977 municipalities (934 municipalities). Depending on whether the municipality split or merged, I summed up or divided the election results in 1936 in order to merge it with the corresponding 1977 municipality dataset.
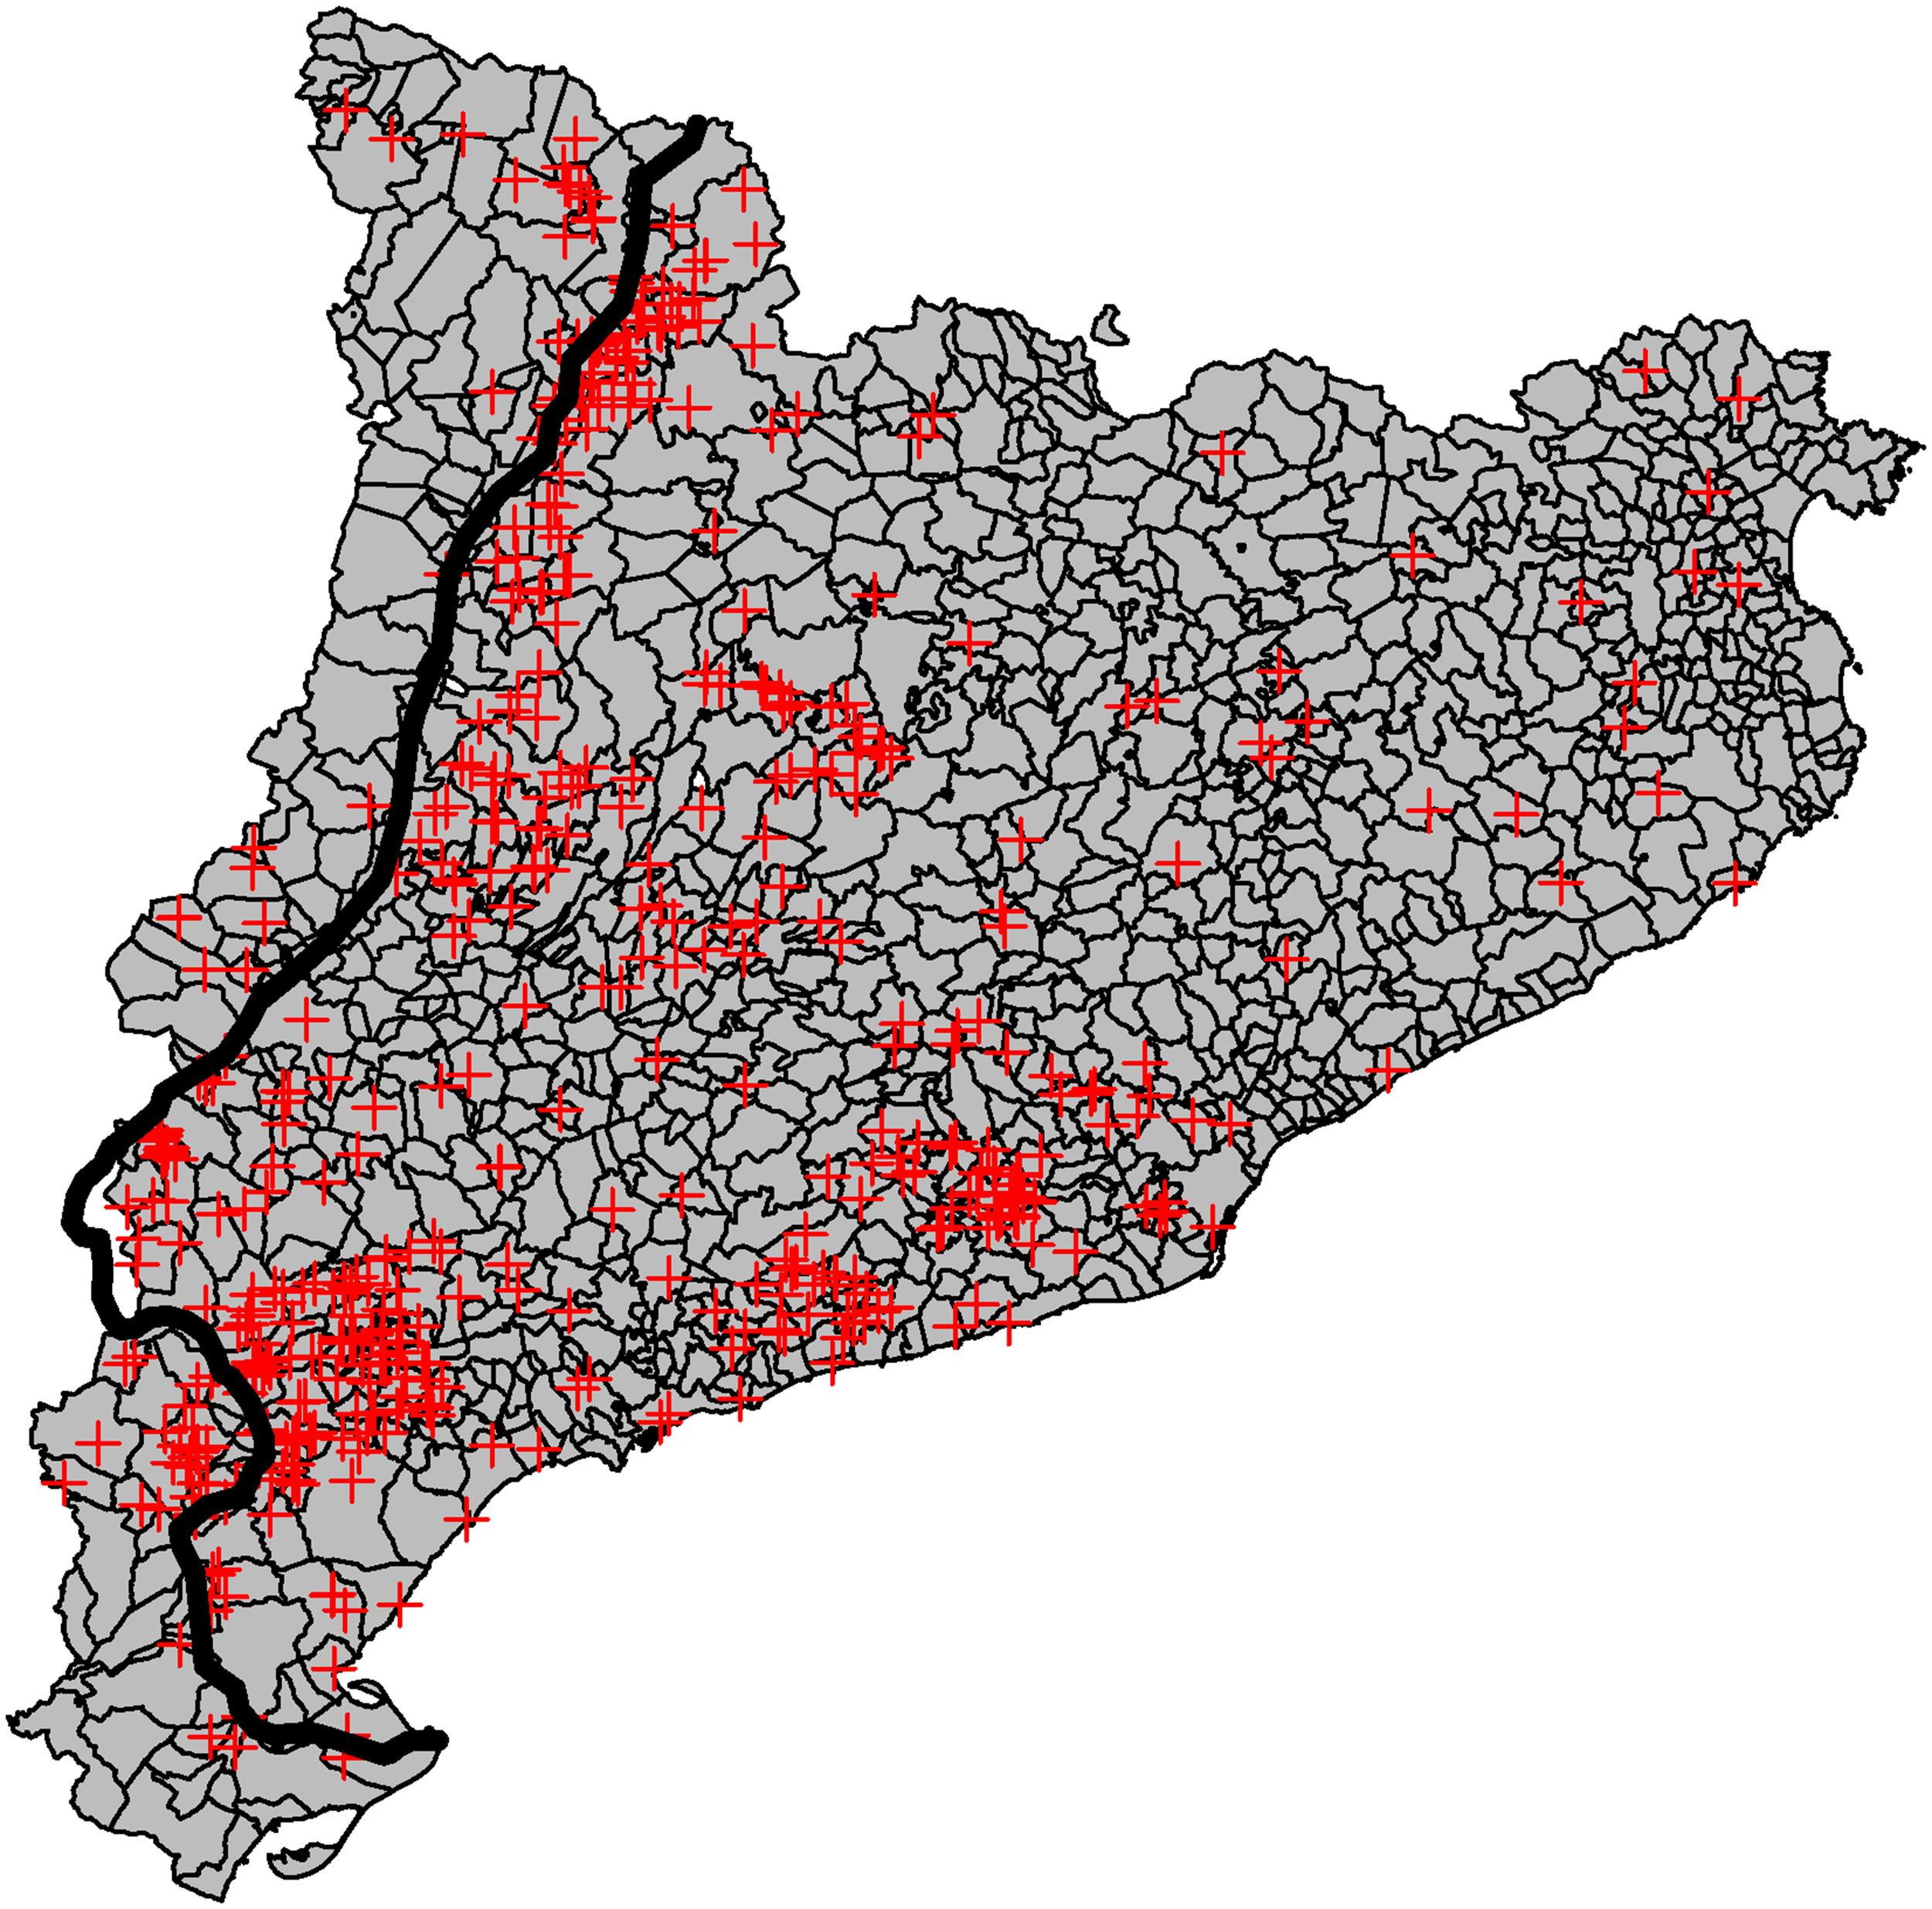
Figure 1 maps the spatial distribution of left-wing support in 1977 and the spatial distribution of turnout. Both maps show substantial variation across space, especially on left-wing support. Throughout the article, I removed the city of Barcelona from all the analyses, as it constitutes an outlier in multiple dimensions. 5
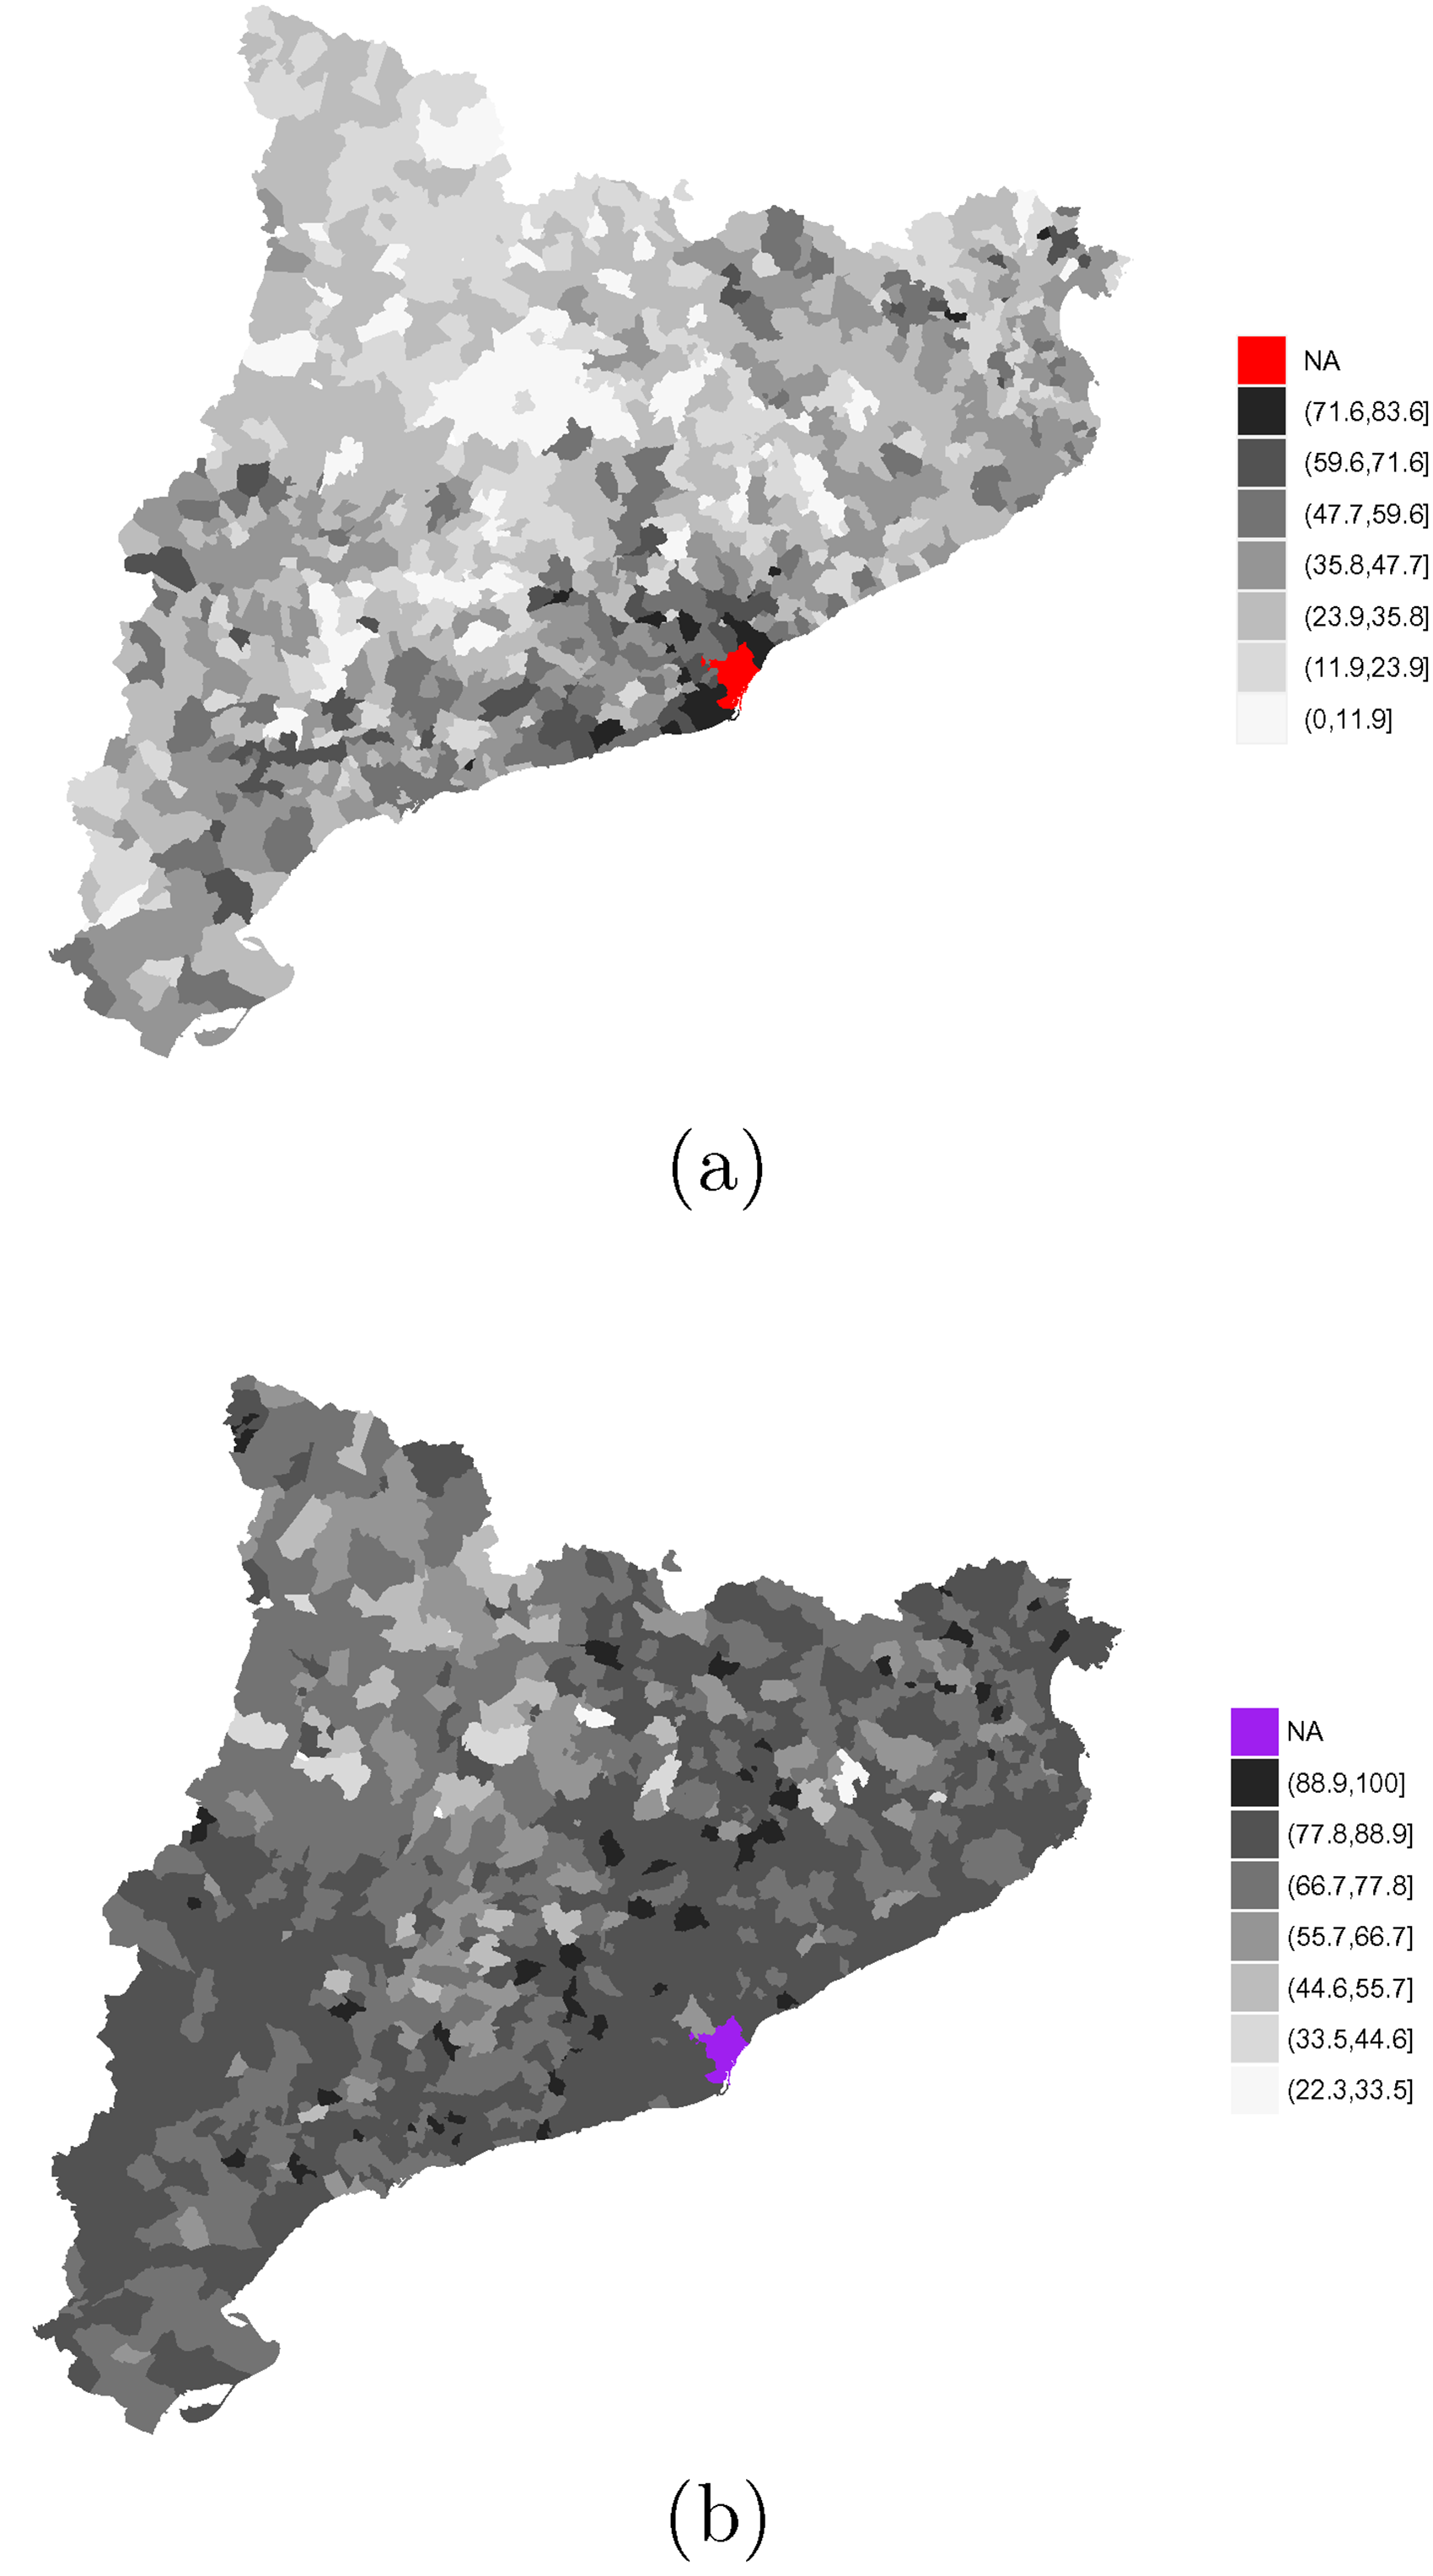
Spatial distribution of left-wing electoral support and turnout in 1977. (a) Left-wing electoral support in 1977. (b) Turnout in 1977. Maps show the spatial distribution of left-wing parties across Catalan municipalities in 1977 (left panel) and turnout in 1977 (right panel). The limits of the municipalities correspond to the 1936 boundaries.
Violence and repression
Did the repressive dynamics during and after the Spanish Civil War leave a mark on the Spanish voting patterns 40 years later? The Spanish Civil War, which began as a military coup against a legally constituted democratic government, lasted for almost three years and caused around 800,000 deaths (including combatants and the civil population) and over 440,000 externally displaced persons. The total number of civilian deaths in the Francoist area is estimated to have amounted to ca. 150,000 (Preston, 2012). In the Republican area the total number of civilian deaths was 49,272. Next, I explain the data used in this article in order to capture the patterns of violence that took place in Catalonia during the civil war and in the early period of the Francoist Regime.
‘Red’ terror
Violence perpetrated by the left – which has also been called ‘red terror’ – is considered to have started on 18 July 1936, when the army staged a military coup against the elected Republican regime. The civil war outbreak unleashed violence against clergymen, church properties, bourgeois members and land-owners.
According to Solé-Sabaté and Villarroya (1989), the total number of victims of leftist direct violence during the civil war in Catalonia was 8352. The highest levels of leftist repression took place just after the military coup in July 1936 and in the first two months of 1939, right before the occupation of the region by the Nationalist army. ‘Red’ violence is captured in this article through different indicators. First, I employ data collected by Solé-Sabaté and Villarroya (1989) and digitized by Balcells (2010), which covers all executions perpetrated by the left in each municipality during the civil war. 6 This number is then divided by the total population in 1936. In addition, I also use data compiled by Hurtado et al. (2010) and calculate the (log of the) number of religious buildings burnt or destroyed in each municipality.
Figure 2 plots the main indicator, that is, the percentage of population executed by the left across Catalan municipalities.
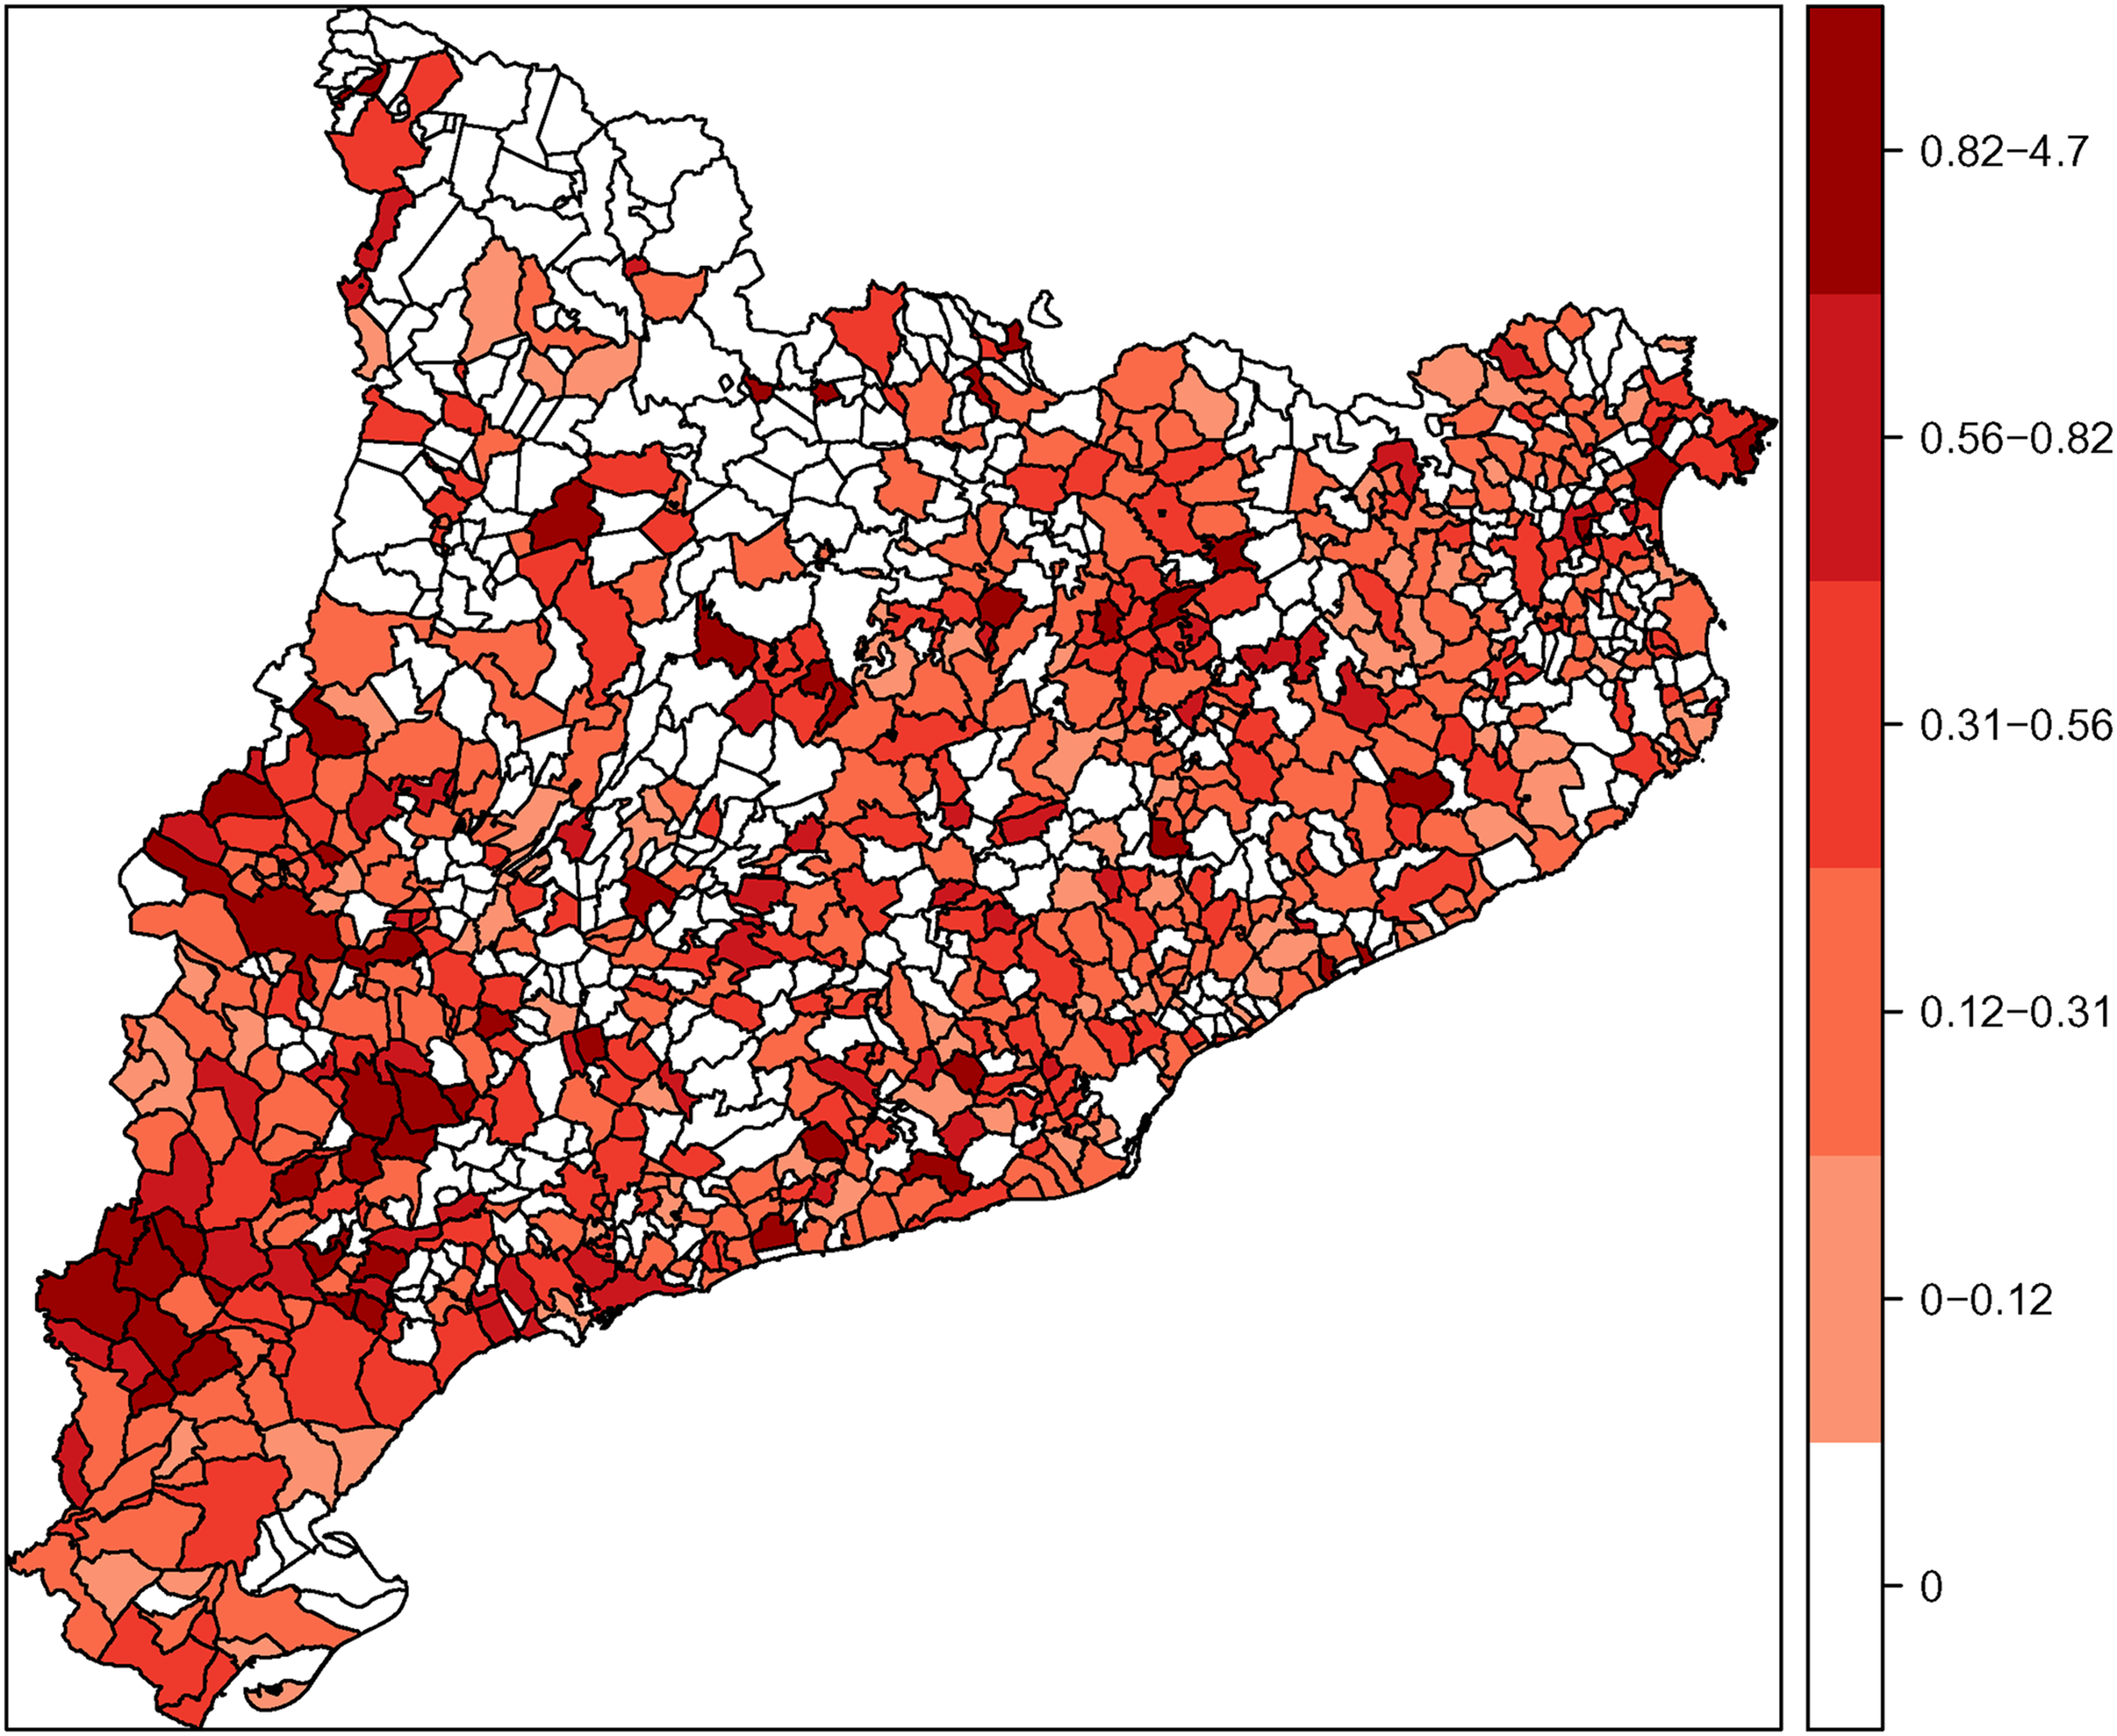
Repression orchestrated by the left. Spatial distribution of ‘red’ repression across Catalan municipalities between 1936 and 1938. Barcelona is considered missing.
‘Blue’ terror
Right-wing or ‘blue’ terror refers to all violent and repressive actions perpetrated by the Francoist forces. 7 Unlike ‘red’ violence, ‘blue’ violence continued after the Civil War – especially up until 1950 (Rodrigo, 2005). Rightist repression during and after the civil war encompassed lethal executions, social marginalization, economic sanctions, arrests, deportations and labour subordination (Sánchez, 2009). 8
Empirically, ‘blue terror’ is captured using the list of military judicial procedures that occurred during the Francoist dictatorship (Terradellas, 2015). The list has been published by the National Archive of Catalonia and constitutes a comprehensive census of all victims of the dictatorship between 1938 and 1978. It is important to note that these are not pro-active claims by victims and, therefore, data do not systematically come from places with more active networks against the dictatorship. It was compiled by the Francoist authorities with the goal of monitoring low-rank officials. 9 According to the data, the Francoist regime opened 81,966 cases against 78,331 civilians. 10 The list includes, for each individual, several details, such as the gender, the type of procedure, the date of the beginning of the judicial process and the victim's municipality of residence. With this information, I calculate the percentage of the population repressed by the Francoist forces (the total number of victims divided by the total number of citizens living in a municipality, according to the closest demographic Census). In a second step, I use the type of repression the victims suffered to distinguish whether soft measures (such as absolving the accused or small fines) have a different effect on vote choice and turnout than hard measures (jail time or executions) 11 . Figure 3 plots the spatial distribution of the ‘blue terror’.
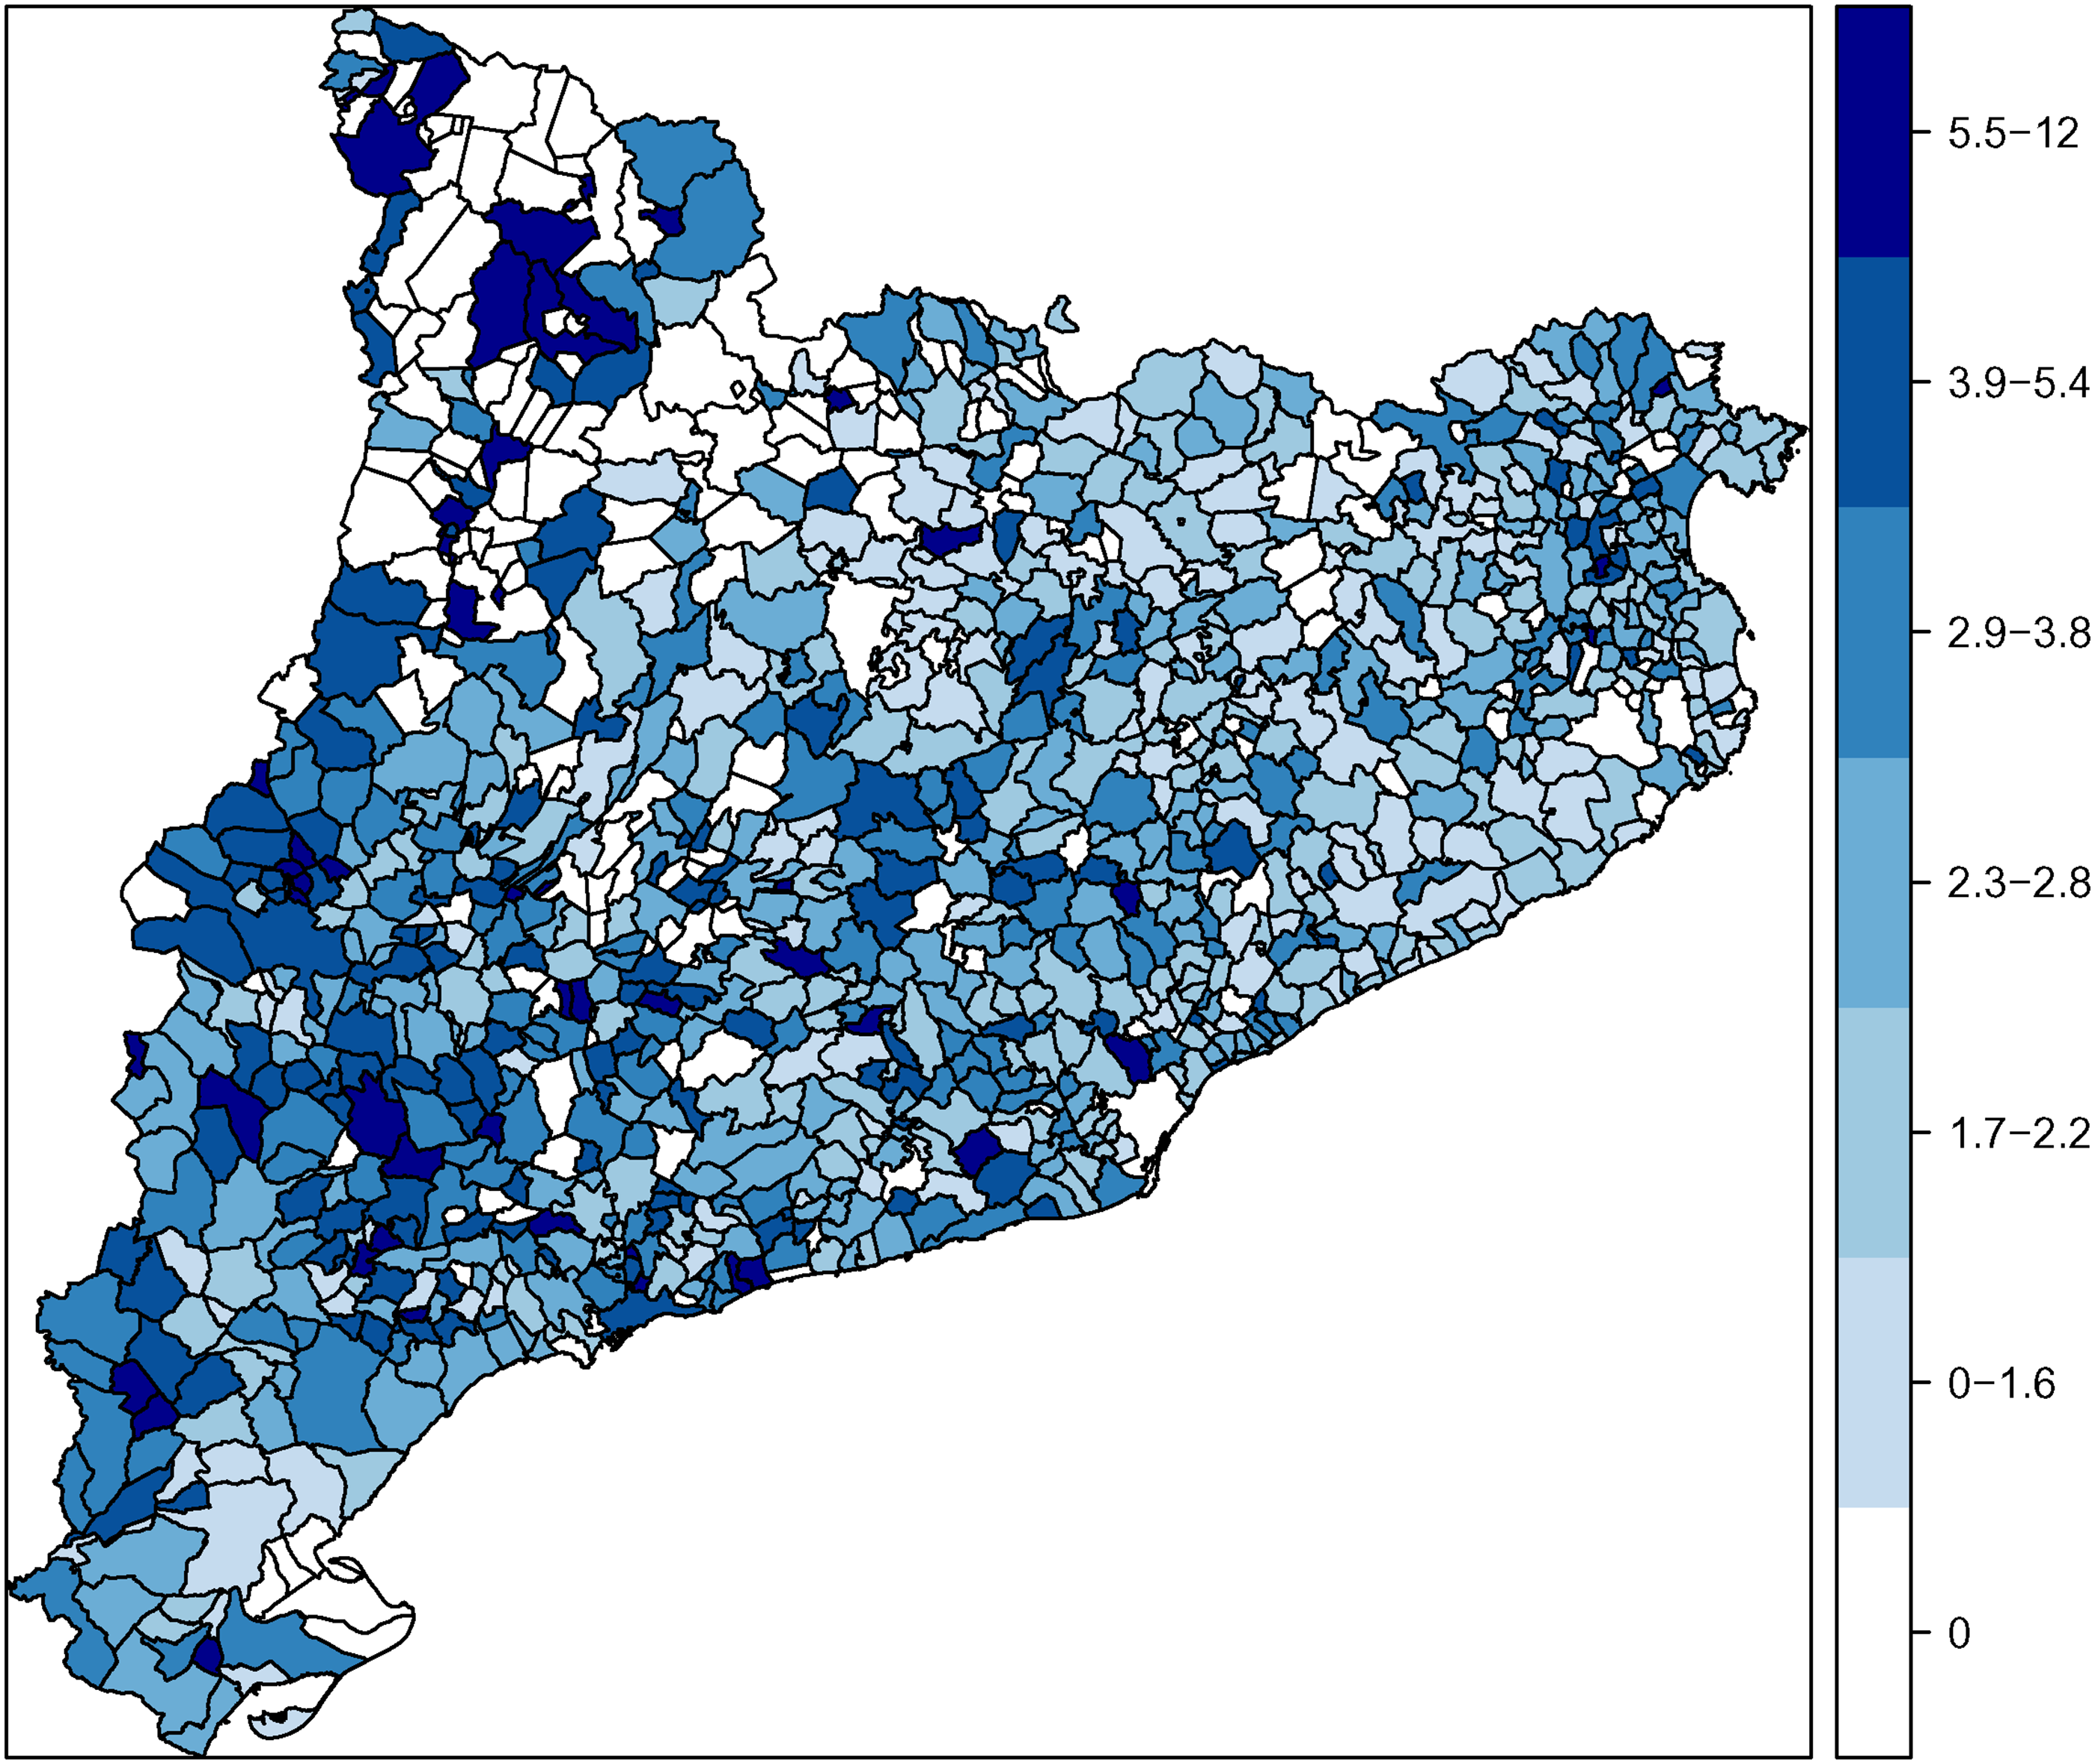
Repression orchestrated by the right. Spatial distribution of ‘blue’ repression across Catalan municipalities between 1938 and 1975. Barcelona is considered missing.
Repression perpetrated by the dictatorship is also captured employing other indicators. First, I use the location of mass graves identified by the Catalan Ministry of Foreign Affairs in 2017. 12 Besides the repression component, mass graves constitute a permanent reminder of the past violence and the actors behind them. The dataset includes information on which side of the war the grave belonged to, and the number of corpses that have been identified. I calculate the distance between the municipality's centroid and the closest mass grave with Republican corpses (the majority of them) and weight it by the number of exhumed corpses. In addition, I employ data regarding the number of sanctions imposed on teachers in each municipality between 1939 and 1943 (González-Agápito and Marqués, 1996). Most of these sanctions were imposed on teachers accused of being left-wing or teaching immoral knowledge and ranged from economic sanctions to loss of their job. It is worth noting that the use of different indicators of violence and repression will allow me to examine whether violence produced a legacy of victimization which intensified with the magnitude of violence.
Finally, it is worth stressing that some empirical analyses use two additional indicators of violence. The first indicator taps into the difference in repression perpetrated by the dictatorship and that of the left-wing groups. Positive values indicate that in a given municipality the level of right-wing repression was higher than that of left-wing violence. A second indicator is a categorical variable that aims at capturing the dynamics of violence between both blocks. It distinguishes between places that experienced no violence and those with a combination of low/high left-wing/right-wing violence. To create the latter, I have calculated four quartiles and intersected them. Thus, if a municipality has a low value for both left-wing violence and right-wing repression (first quartile), it is assigned to the ‘low–low’ category. The majority of municipalities (around 27%) experienced more right-wing repression than left-wing violence. Both indicators will allow me to examine potential different dynamics when both types of violence are considered simultaneously – there is not a clear expectation when comparing high victimization by both sides with the (rare) situation of no victimization.
Additional controls
All analyses adjust for potential confounders that might affect the relationship between repression and left-wing support or turnout in 1977. First, I control for (the log of the) municipality's population in 1977. The effect of repression might have persisted more easily in small towns than in big municipalities. In small towns citizens are more likely to get in contact with people from the other ideological side, which can act as a reminder of the atrocities perpetrated during and after the civil war.
Second, besides repression, municipalities experienced substantial population changes owing to people fleeing into exile. Memory persistence could be different in municipalities that experienced higher population losses. Hence, models control for the (log of) population changes between 1936 and 1940.
Third, and following a similar rational, I also control for the (log of the) population changes between 1936 and 1977. During the 1960s and the early 1970s, Catalonia experienced important net demographic changes, with the estimated arrival of 1.5 million people, the vast majority of whom arrived from other parts of Spain. Demographic data come from the National Statistics Institute census of 1930 and 1940 and the Statistical Institute of Catalonia. 13
Fourth, models also include a measure of electoral competition between the left-wing and the right-wing bloc in 1936. Following Balcells (2017), the level of political parity between the two groups was an important driver of violence during and immediately after the conflict.
Five, models include the standard deviation of elevation within each municipality. This acts as a control for inaccessibility and rugged terrain – characteristics that might have influenced repression and sociopolitical dynamics.
Finally, I also include the share of the industrial workforce in 1964, defined as the share of the population that worked in the industrial sector. Data were extracted from the 1965 Workers and Business Census published by Pujol (1970).
It is important to note that models also include province fixed effects. In both the 1977 and 1936 elections, provinces corresponded to electoral districts. The district magnitude had substantial variation and the district's electoral lists were different.
The Online Appendix shows the summary statistics of the different variables employed in the analyses and several robustness checks including additional indicators.
Results: the long-term effect of repression on vote choice and turnout
The Results section proceeds in different steps. In the first part, I explore whether repression by the left during the civil war and by the Francoist regime during and after the civil war left a residue on political behaviour four decades later. Additionally, to identify the type of violence driving the effect, I examine what type of repression – ‘hard’ vs. ‘soft’ – drives the effect. In the second part, I explore the impact of being close to a mass grave on vote choice and turnout. On this part, I also take advantage the geographic discontinuity set up by the Lleida front-line, which (quasi-randomly) generated higher levels of repression east of the line, as compared with the west Following previous works showing that violence increases electoral support for radical left-wing parties (Fontana et al., 2017; Lupu and Peisakhin, 2017), I run two additional analysis using as an outcome the share of the votes received by the two main leftist parties, namely the more moderate PSC and the more extreme PSUC.
Models indicate that the effect of leftist violence perpetrated during the civil war on the share of the votes received by the left 40 years later is negative and, conversely, repression perpetrated by the dictatorship during and after the conflict has a positive and significant effect on left-wing support in 1977.
To illustrate the effects, Figure 4 plots the predicted support of the difference in left-wing parties share of the votes in 1977 vs. 1936 as a function of the different indicators of violence. As the top-left figure shows, higher levels of leftist violence are associated with lower levels of left-wing support in 1977 compared with 1936. This result indicates that the left was punished in places where it committed violence, despite the fact that right-wing repression affected more people and for a longer period of time. Also, the effect of repression on left-wing support in 1977, compared with 1936, is positive (top-right panel). Thus, in places where the ‘blue terror’ was more intense, the left performed comparatively better in 1977 than in 1936. A one-point increase in the share of individuals repressed by the dictatorship increases leftist support by 1.8 percentage points.
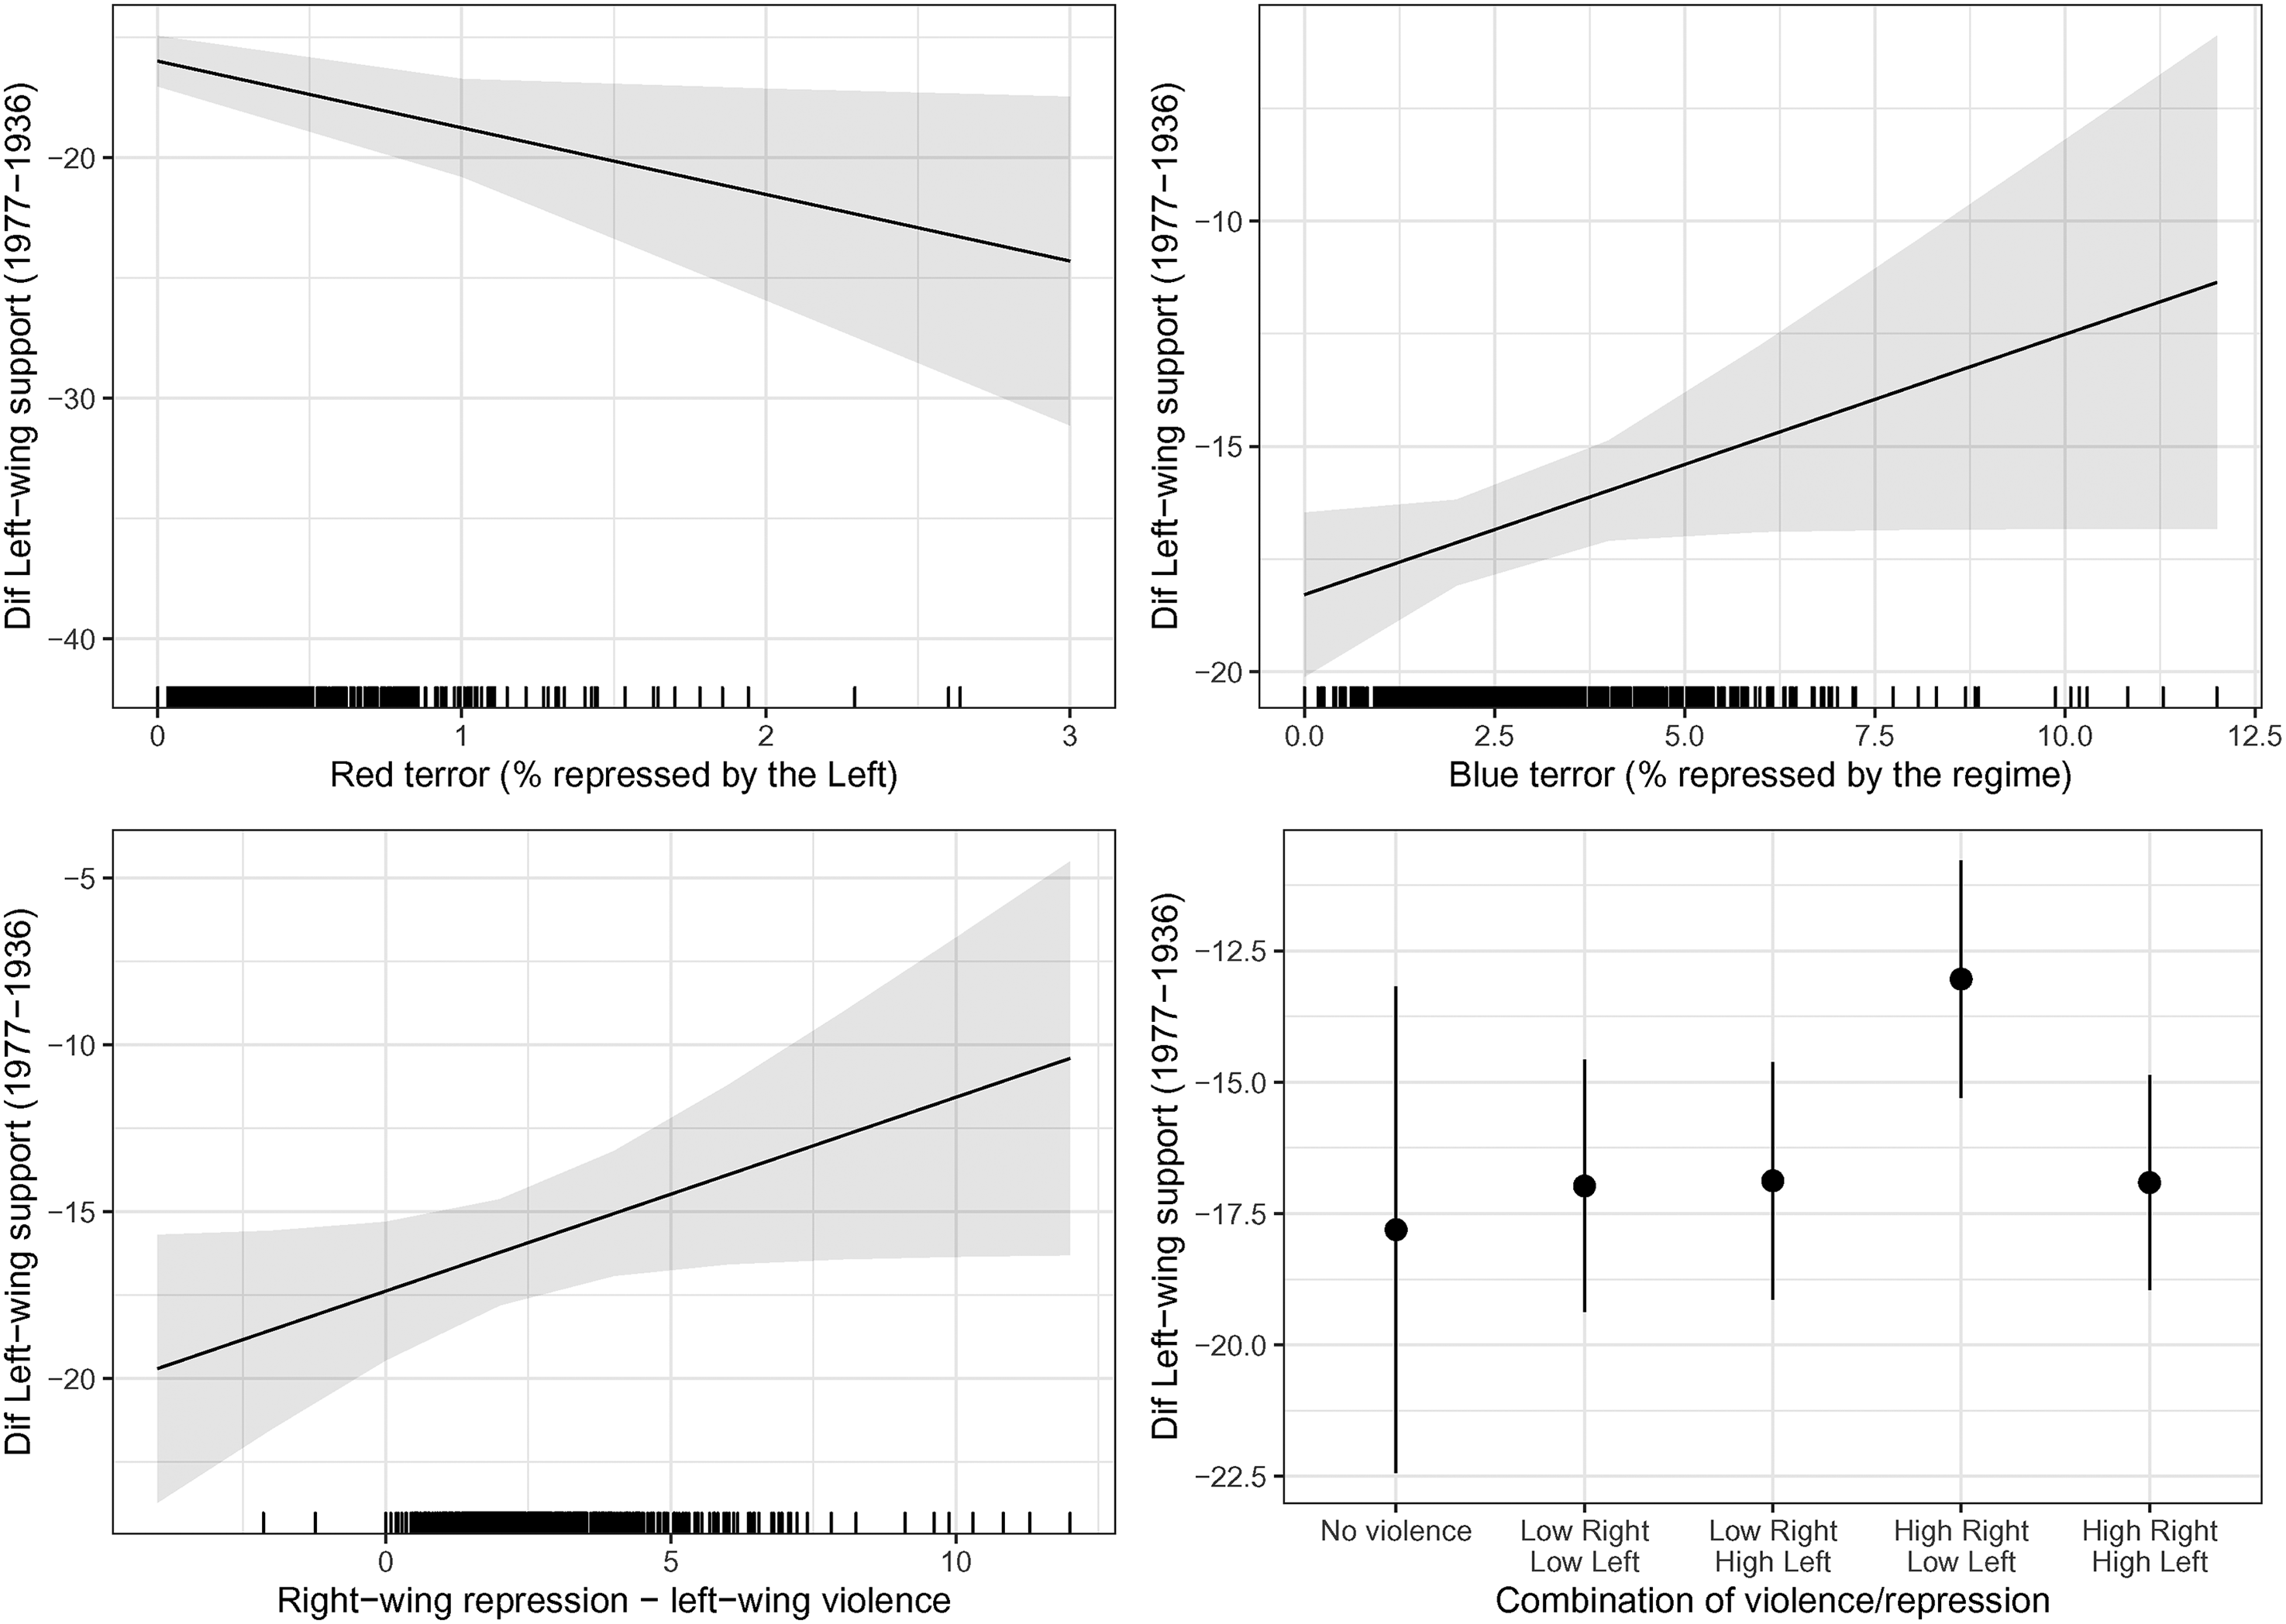
The effect of blue and red repression on the difference in left-wing support (1977–1936). Plots show the predicted left-wing electoral support in 1977 across different values of leftist repression (top-left panel) or dictatorship repression (top-right panel), or the difference in repression between the left and the Francoist dictatorship (bottom panel). Estimates are based on Table B1 in the Online Appensix. The shaded area represents the 95% confidence interval (CI).
To take into account that violence/repression came from both sides, the analysis also uses as an independent variable the difference in repression by both sides or a categorical variable capturing the different combinations of violence. Results in the bottom-left figure are consistent with the figures in the top panel. In other words, municipalities that experienced more left-wing violence than right-wing repression were less likely to support left-wing political parties 40 years later. Yet it is important to consider that repression by the Francoist regime lasted longer and affected most of the Catalan municipalities, subsequently producing a larger effect. In places where the dictatorship's repression was higher than left-wing violence, left-wing electoral support went up in 1977 compared with 1936. In substantive terms, in places where the dictatorship's repression was one percentage point higher, left-wing support in 1977 was 0.7 percentage points higher. The bottom-right graph further dissects the dynamics of violence and confirms previous results: violence closed the difference in electoral support of the left between 1977 and 1936, especially in those places where Francoist repression was high and left-wing repression was low. This results confirm the idea that more intense violence by one side of the conflict tilted electoral behaviour against the more violent perpetrator.
Finally, the results in the Online Appendix show that Francoist repression seems to have benefited the PSUC, the main clandestine political party in Catalonia during the Francoist regime (Dowling, 2013). In addition, results show that in places with higher levels of violence/repression, the Catalanist centre-right did not perform better in 1977. In other words, the legacy of violence in places with higher levels of repression seems to have largely benefited the left, which was comparatively more active among the Francoist opposition forces. Overall, this first piece of empirical evidence provides support for the idea that repression generated an anti-Francoist regime effect in the founding election, an effect that benefited left-wing parties.
Do violence and repression also have an effect on turnout patterns? Figure 5 explores this question by displaying the same models as before but employing the difference in turnout between 1977 and 1936 as an outcome. Although the results seem to point in a similar direction, none of the coefficients is statistically significant. This effectively means that municipalities that experienced more left-wing violence or higher levels of repression by the Francoist dictatorship (either in absolute or relative terms) did not significantly participate or abstain more in the first Spanish legislative elections in 1977.
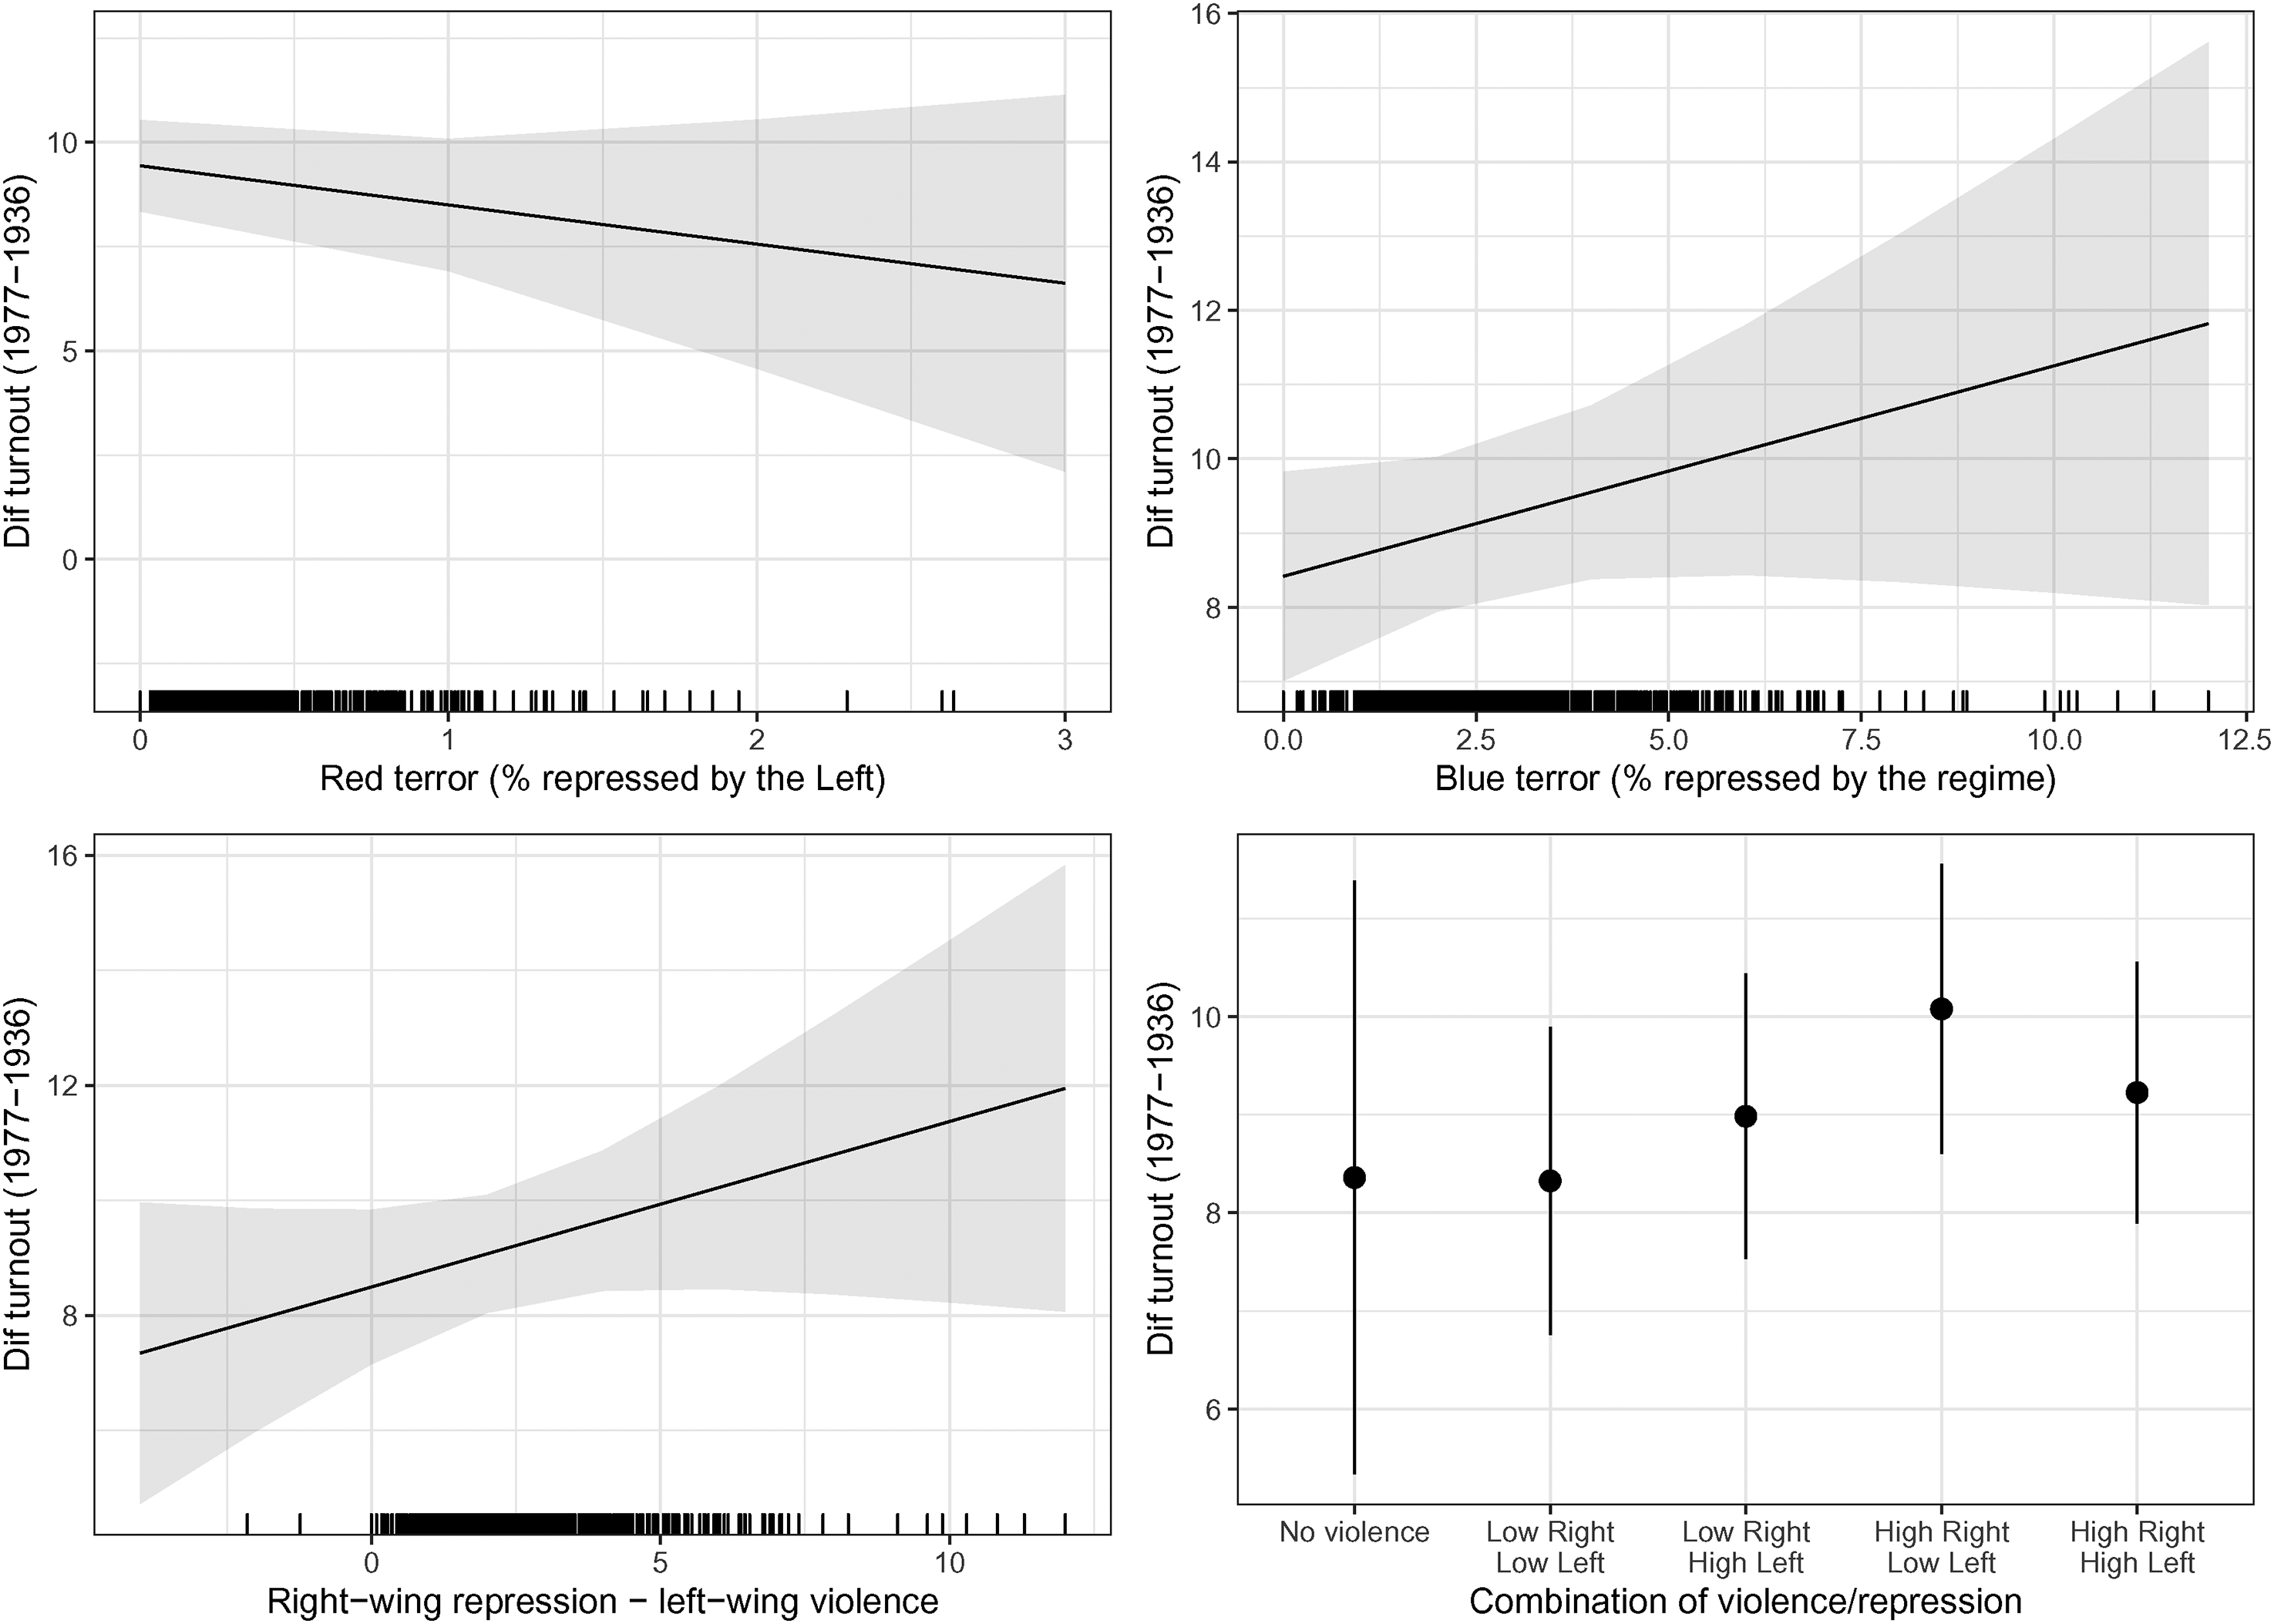
The effect of blue and red repression on the difference in turnout (1977–1936). Plots show the predicted turnout in 1977 across different values of leftist repression (top-left panel) or Francoist repression (top-right panel), or the difference in repression between the left and the dictatorship (bottom panel). Estimates are based on Table B2 in the Online Appendix. The shaded area represents the 95% CI.
An interaction between the indicators of violence and repression and previous levels of electoral support yields non-significant results, which points to the idea that the long-term effect of violence did not depend on previous municipality-level characteristics. Next, I provide further evidence that repression by the dictatorship generated higher support for left-wing parties by using different repression indicators.
Figure 6 illustrates the results of the additional analyses. The left panel shows that the number of religious buildings burnt or destroyed by left-wing groups is associated with less support for the left, while the right panel shows that the percentage of teachers sanctioned by the Francoist regime is associated with higher left-wing support. Both work in the expected direction. Municipalities that were affected by left-wing violence, mainly in the early instances of the civil war, were less likely to vote for the left in 1977 compared with 1936. Conversely, in places where a higher proportion of teachers were sanctioned, the left-wing parties closed the gap in electoral support between 1936 and 1977. Albeit indirectly, these results reinforce the article's main argument: even when considering two different violent dynamics, one that took place in the early months of the civil war and the other lasting for many years during the Francoist period, the effect on political behaviour persists as voters were able to identify the identity of the perpetrator.
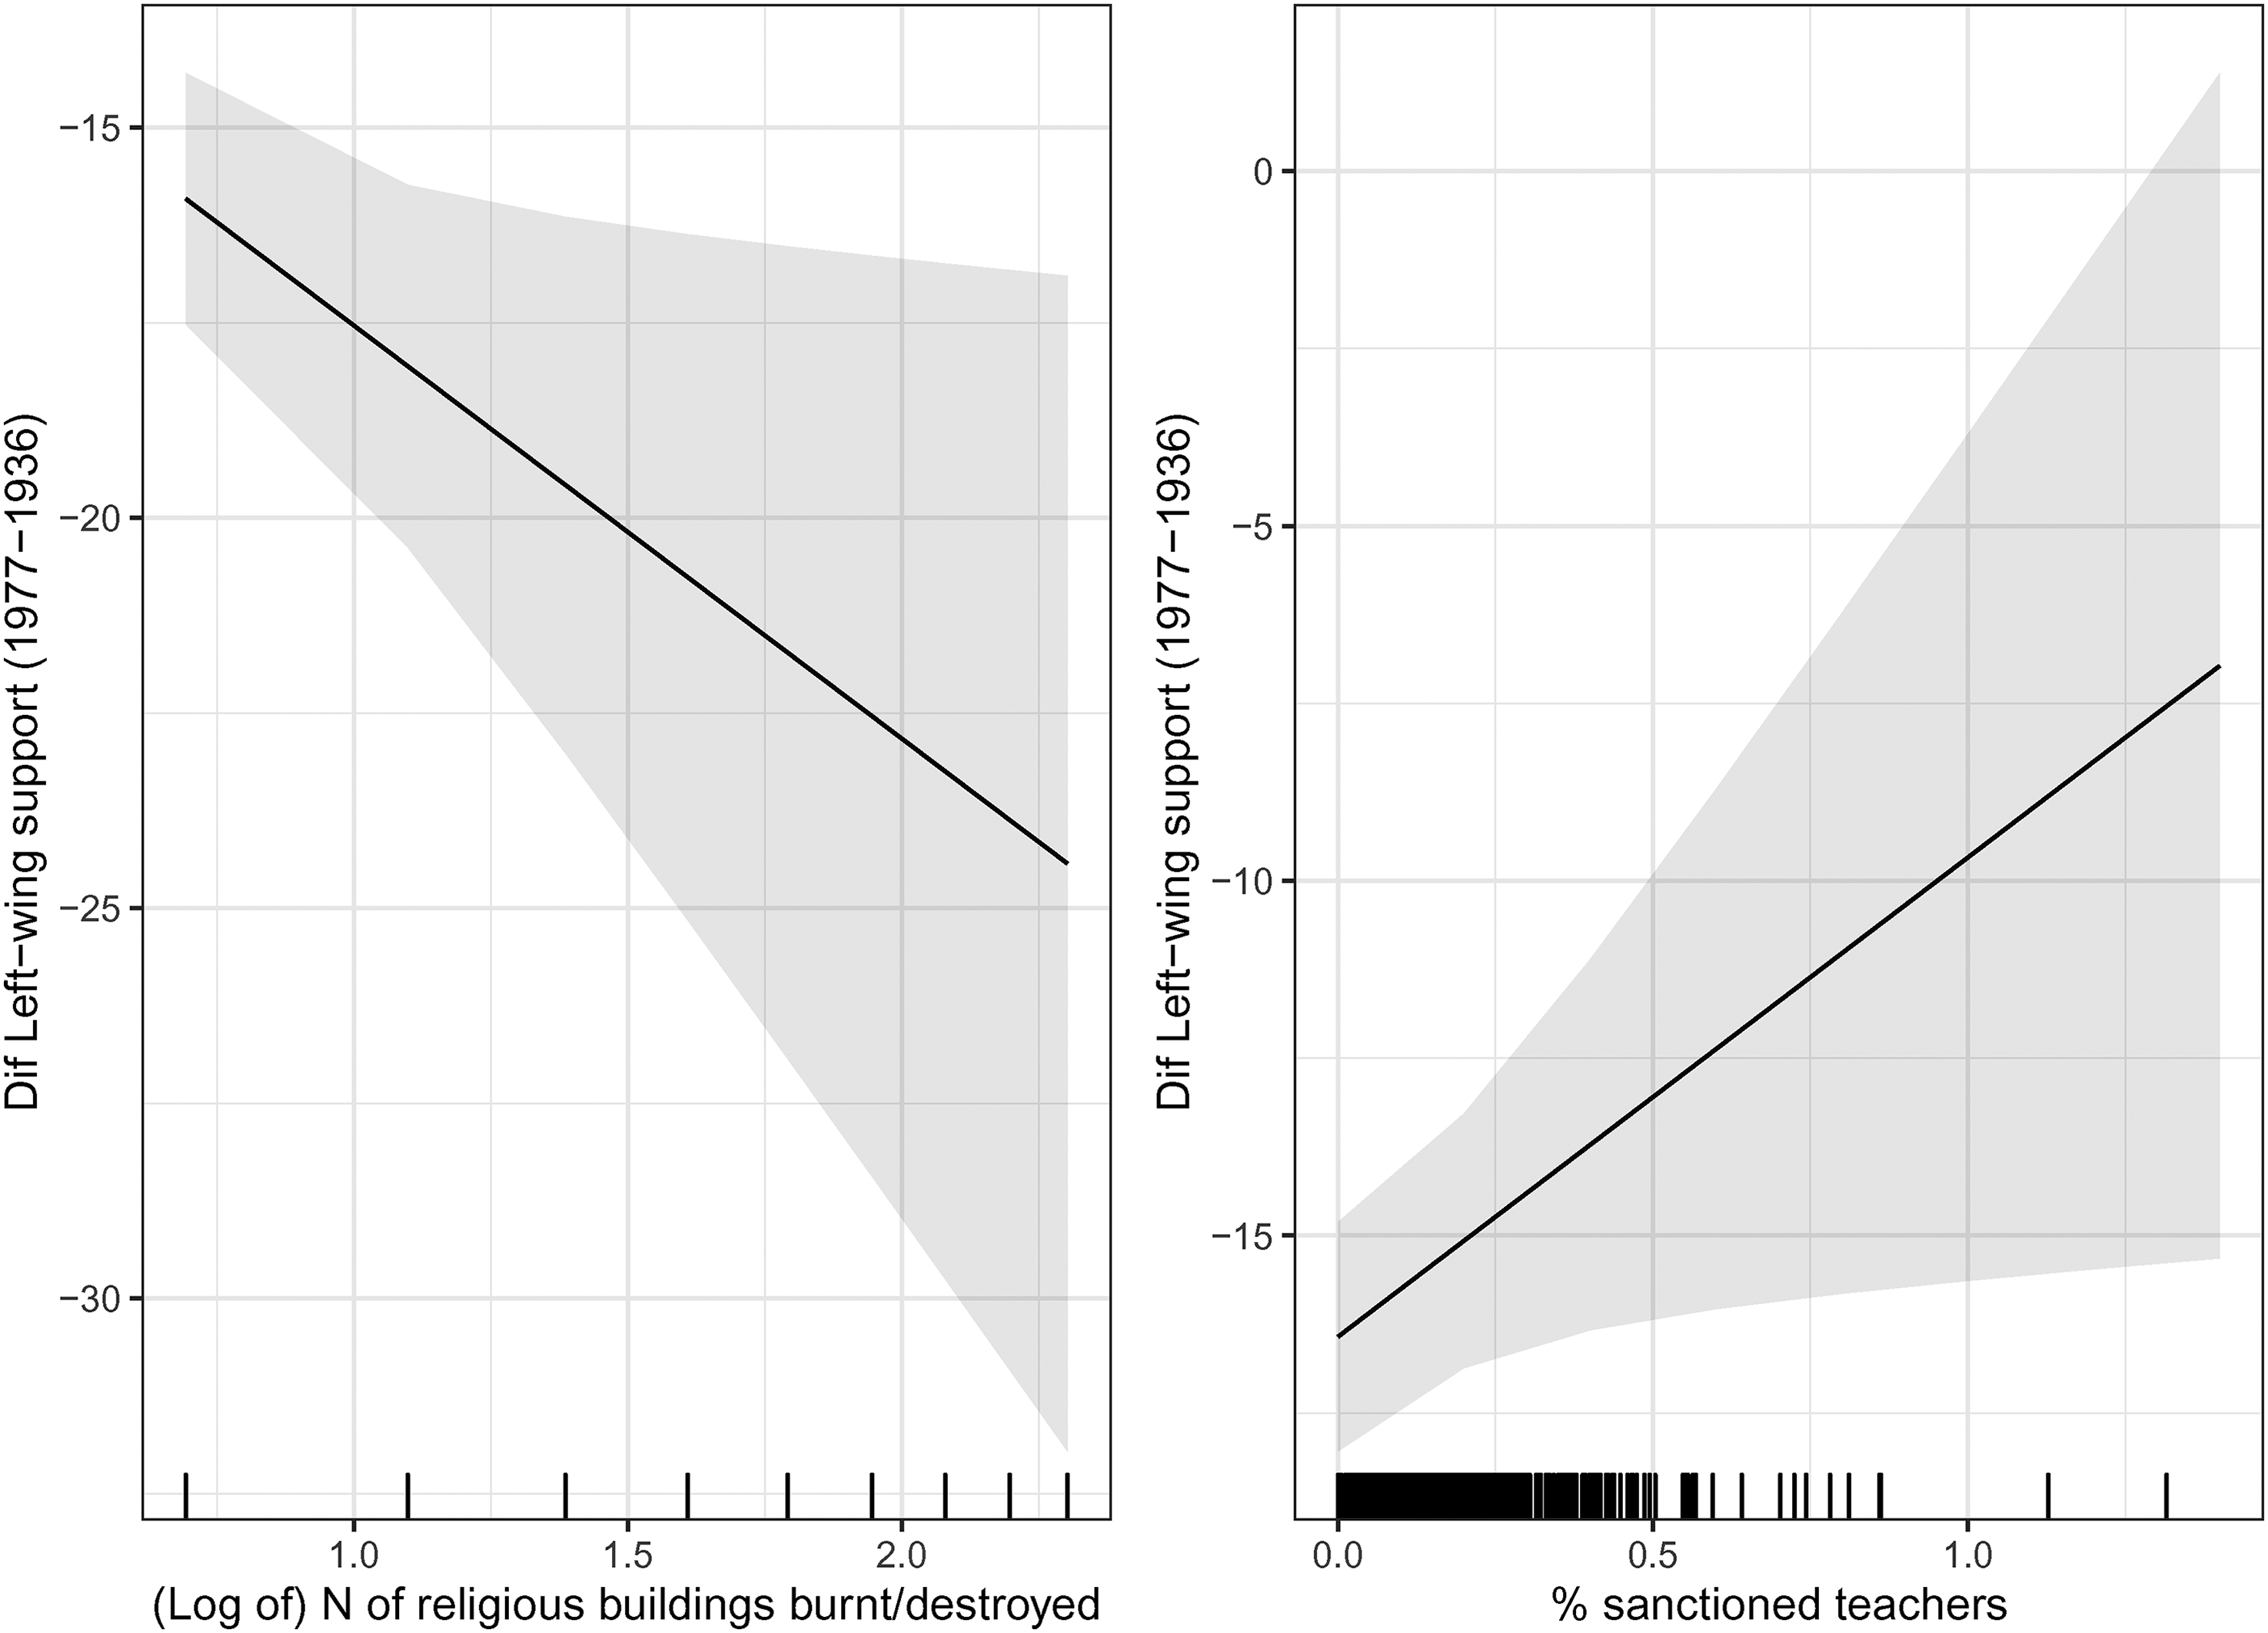
The effect of anti-clerical violence and sanctions on teachers on the difference in left-wing support (1977–1936). Plots show the predicted left-wing electoral support in 1977 across different values of the (log of the) number of religious buildings burnt/destroyed (left panel) and the percentage of sanctioned teachers. Estimates are based on Table B1 in the Online Appendix. The shaded area represents the 95% CI.
To further investigate what type of violent events perpetrated by right-wing forces are behind the transmission of violence, I next unpack the effect of different repressive strategies. Accordingly, Table 1 repeats the previous models but includes three different variables: the percentage of prosecuted individuals that were later absolved, the percentage of individuals that received an economic sanction 14 and the percentage of individuals that received any form of what I label hard repression (this includes jail, forced exile or execution). To compare the coefficients, the three variables are standardized. The models also control for the mean age of the repressed population, the year in which the last case was resolved (most of the judicial resolutions ended in 1950), the percentage of repressed individuals born in Catalonia and the percentage of repressed individuals that were men. The idea behind this analysis is that violence is likely to lead to a legacy of victimization that intensified with the magnitude of violence.
The effect of repression type on the difference in left-wing support and turnout (1977–1936).
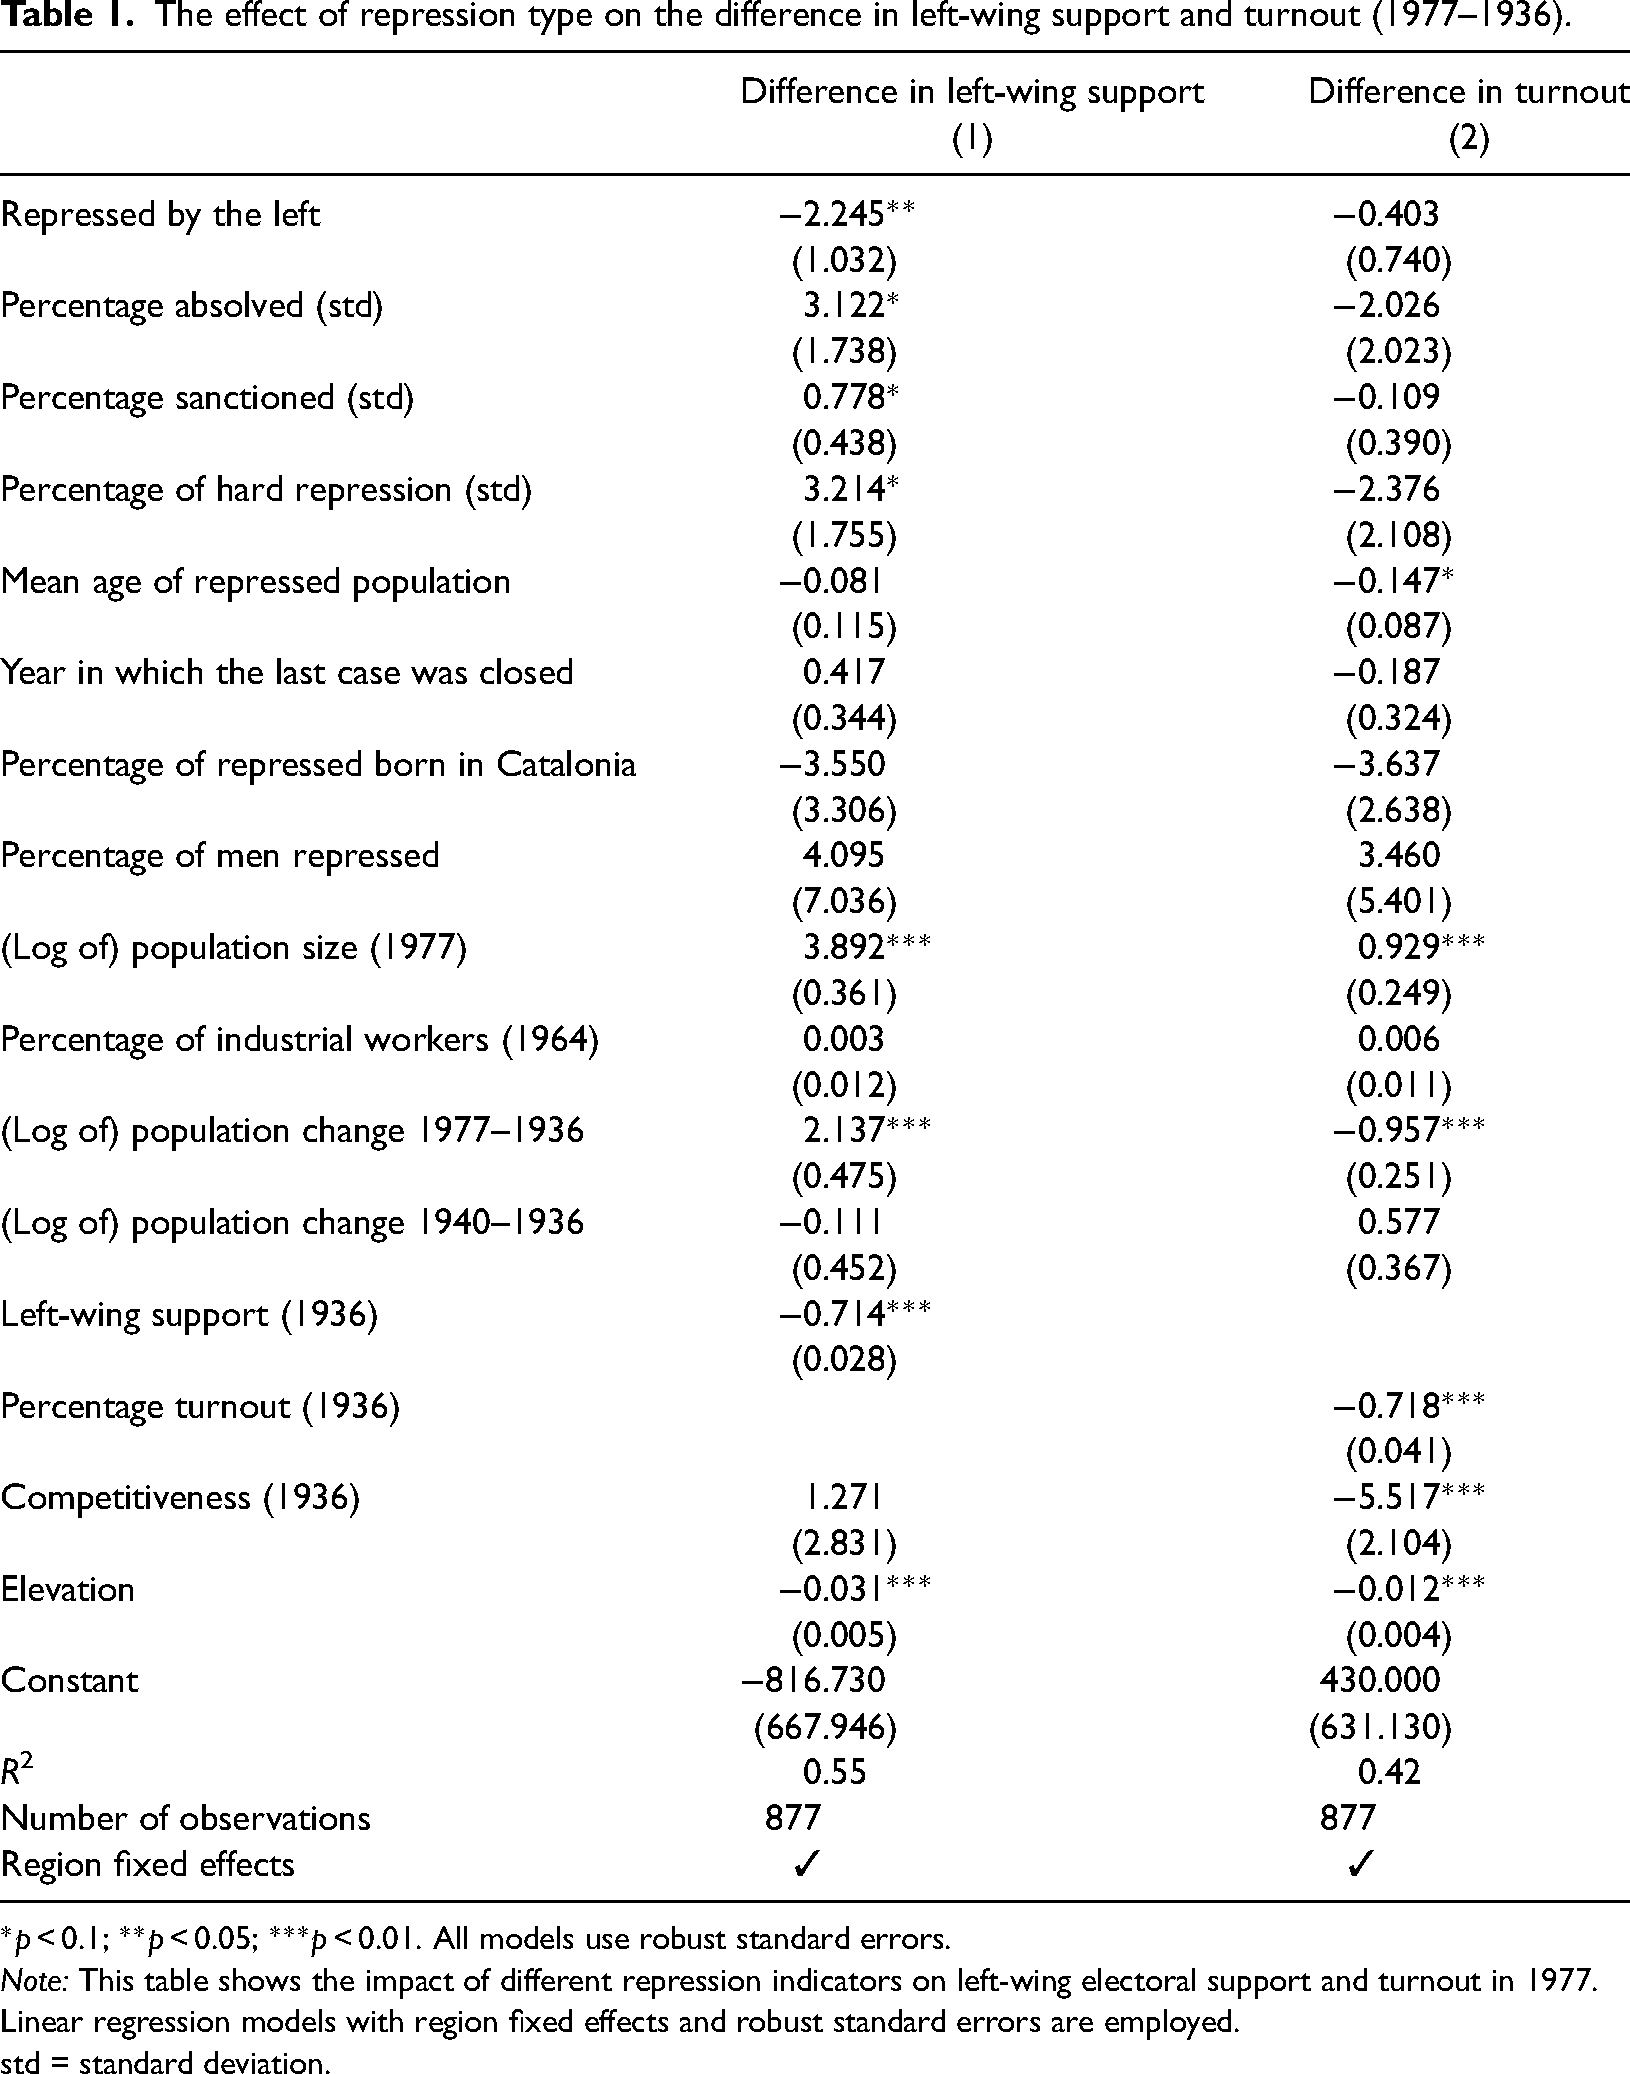
*p < 0.1; **p < 0.05; ***p < 0.01. All models use robust standard errors.
Note: This table shows the impact of different repression indicators on left-wing electoral support and turnout in 1977. Linear regression models with region fixed effects and robust standard errors are employed. std = standard deviation.
Interestingly, the results are consistent with this idea. Table 1 shows that the positive effect of the repression perpetrated by the dictatorship on left-wing support comes from two type of actions: sanctions and, especially, hard repressive measures. The effect on the same measures in political participation is not significant. Overall, these results show that the effect of hard repression is substantively larger than that of sanctions, suggesting that imposing sanctions leaves a smaller long-term mark on political behaviour – the coefficient is four times smaller for sanctions. This indicates that violence produced a long-term legacy of victimization that was greater at higher values of hard repressive measures.
Last but not least, I delve into an additional dimension of repression: the proximity to mass graves. Mass graves had a direct effect – the killing of the other ideological side – but also an indirect one: they constituted a reminder of the consequences of rebelling against the right-wing dictatorship. Interestingly for my argument, they also had the indirect consequence of reminding people of the identity of the perpetrator of such acts.
I employ information for a total of 340 mass graves, used between the beginning of the civil war and the immediate aftermath. 15 The majority of exhumed mass graves (317) contained Republican corpses and only a small number of mass graves were used by left-wing political actors during the civil war to bury Francoist loyalists (40).
I use the location of mass graves and examine the effect of being close to a mass grave on the difference in left-wing support and turnout between 1977 and 1936. I created an indicator that measures (the log of) the weighted distance to a mass grave used by Francoist forces to bury Republicans. For each municipality's centroid, I first calculated the distance to the closest mass grave (in kilometres) of this type. In the second step, I weighted the distance by the number of corpses exhumed in each mass grave. This captures the intensity of Francoist repression on its immediate surroundings. Finally, to account for the decreasing effect of distance, I calculated the log of the distance. Models also include a control identifying whether the municipality has a mass grave belonging to the Francoist side. Furthermore, to account for the exposure to mass graves, I include the number of mass graves in each municipality.
Figure 7 plots the predicted effect of distance to a mass grave used by the Francoist dictatorship on the difference in left-wing support in 1977 vs. 1936. As the figure illustrates, those municipalities close to a mass grave reported a similar share of left-wing support in 1977 vs. 1936. In substantive terms, moving away 10 km from a mass grave decreases left-wing support by 0.9 percentage points. This result is consistent with the analyses reported before and ultimately with the idea that being close to a mass grave serves as a reminder of the violence and the identity of the perpetrator, which in turn triggers greater support for the political left.
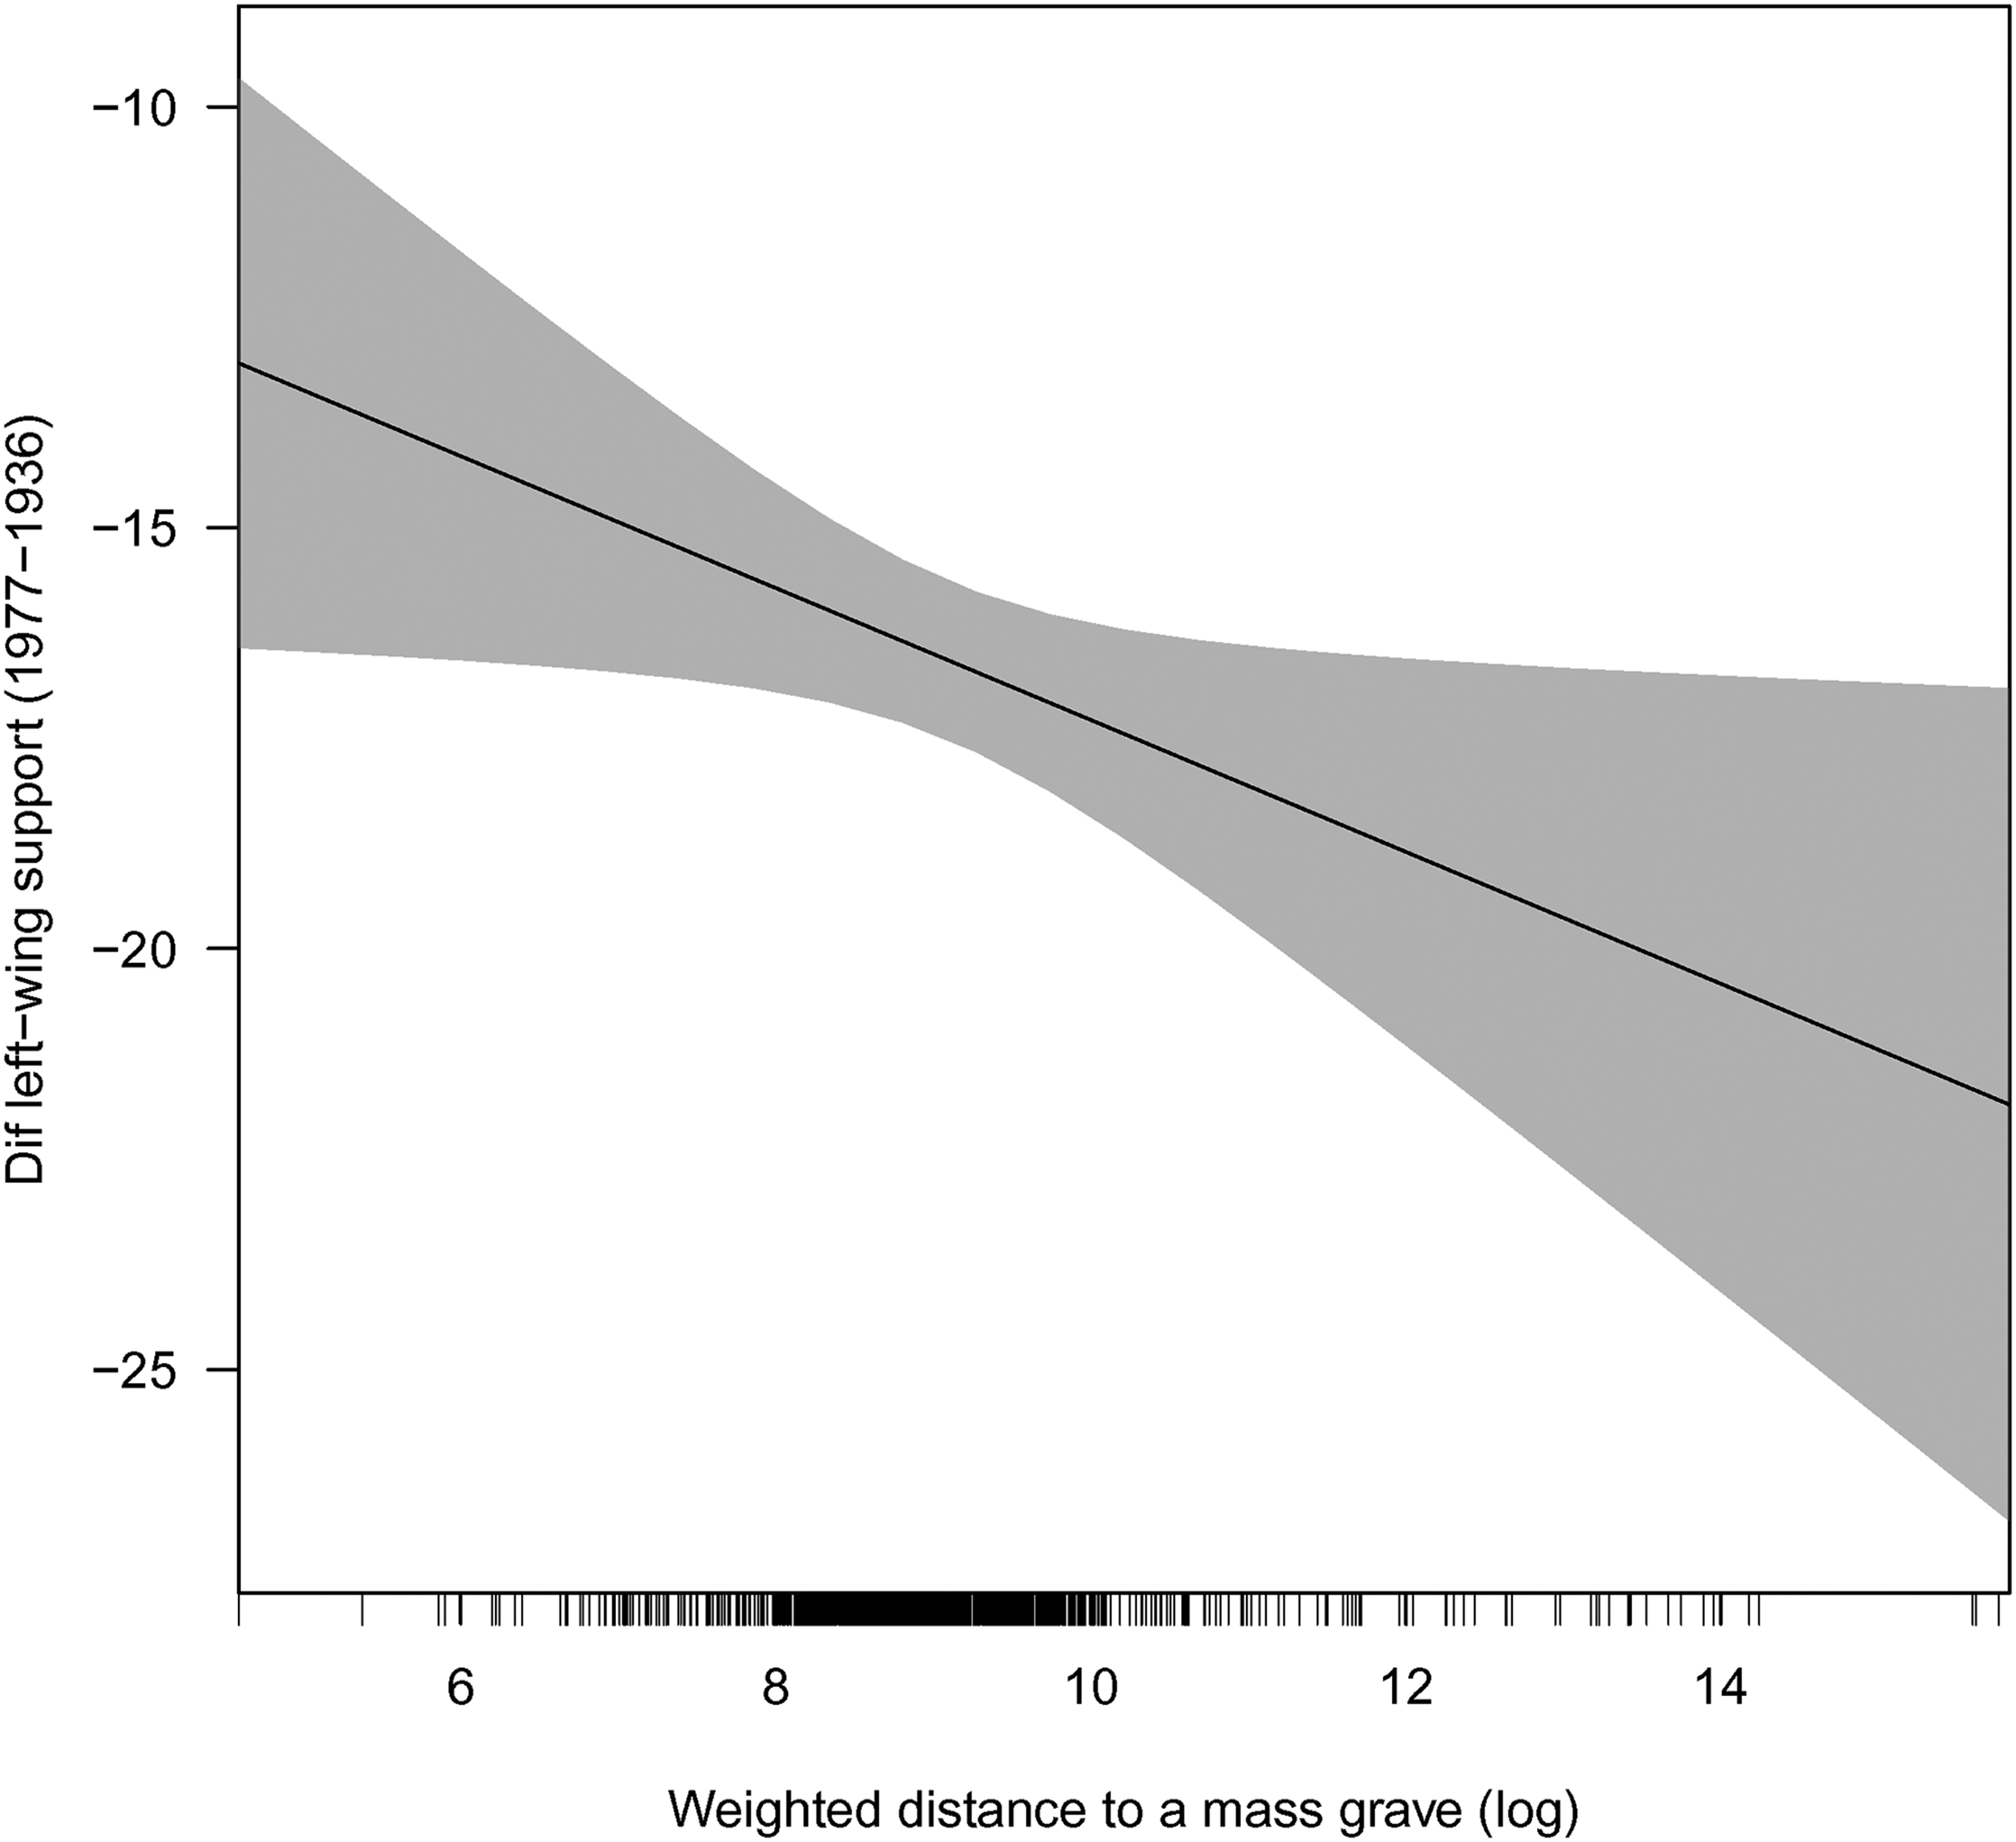
The effect of distance to Francoist mass graves on the difference in left-wing support (1977–1936). This plot shows the predicted left-wing electoral support in 1977 across different values of the (log of the) weighted distance to the closest Francoist mass grave. Estimates are based on Table B4 in the Online Appendix. The shades area represents the 95% CI.
The link between violence and vote along a front-line
Despite previous results being stable across different specifications and controlling for electoral competitiveness in 1936 (Balcells, 2017; Villamil, 2021), the endogenous nature of violence/repression may still cast doubts that I am capturing a real effect on political behaviour. To strengthen the confidence in the results, I take advantage of the intensity of repression that occurred along a battle front-line, known as the Lleida front-line, and apply a GRDD. In the early weeks of 1938, the Francoist army advanced into Catalonia until it was stopped by the Republican army. As a result, a front-line stabilized along the Ebre River in Tarragona and along the Lleida plain until the beginning of 1939. The important aspect for the analysis is that the intensity of repression varied on the two sides of the front-line. When the front-line was stable, the Francoist army concentrated a substantial amount of resources in the south, along the Ebre River, in order to prevent the advance of the Republican army, which launched one of the final attempts to win the war, the famous ‘Ebre battle’. When the Republicans lost the battle, the Francoist army took the opportunity to break the military standstill along the Lleida front-line. The advancement of the Francoist troops caught most of the Republican regiments off guard. When the front-line collapsed, repression east of the line was intense.
Figure 8 shows the location of the Lleida front-line and the spatial distribution of the mass graves where Republican corpses have been identified. As it can be seen, most of the mass graves are located east of the front-line – and spatially close to it. Contrary to what happened with the Gothic line in Italy (Fontana et al., 2017), it is important to note that, in this case, repression was more intense on the opposite side once the front-line disappeared. As mentioned, during the months when the front-line was stable, big military battles took place in other areas of the territory, away from the front-line. Thus, the front-line vanished rapidly, unleashing high levels of Francoist repression on the east side of the border.
Mass graves and the Lleida front-line in Catalonia. The map shows the spatial distribution of mass graves used by the pro-Francoist army and the Lleida front-line.
Before showing the results, there are different threats to validity that need to be addressed. First, pre-treatment observables east and west of the front-line should be balanced (the results are shown in the Online Appendix). As can be seen, no consistent pattern emerges, confirming that the pre-treatment characteristics of municipalities on both sides of the front-line do not systematically differ. Second, although less plausible, it could be that, after the civil war, left-wing supporters moved to municipalities east of the front-line, as opposed to the west. In addition, one might think that municipalities west of the front-line experienced a more intense industrialization recovery after the civil war than those in the east. If these two patterns are true, the analysis will overestimate the effect of repression. However, the data do not support this story. Finally, I conducted a placebo test to ensure that the regression discontinuity design is unable to uncover effects at a location that differs from the true front-line. Accordingly, I re-estimated treatment effects at various other cut-offs and compared them with the effect at the presumed cut-off. Overall, these tests confirmed that the Lleida front-line was seemingly blind to existing boundaries. 16 By taking advantage of the fact that similar municipalities were exposed to differential levels of Francoist repression, we can identify the effect of repression on electoral support for the left wing.
To make it more comparable, I restrict the analysis to municipalities that belong to the provinces of Lleida and Tarragona (the western provinces), the regions that the Francoist army invaded first – this excludes Girona and Barcelona municipalities, places where the invasion was largely anticipated.
Figure 9 plots the results using the total left-wing support (a) or the share of the votes received by the PSUC (b) as an outcome. In both cases, the effect is positive. The vote share of the left-wing parties in the 1977 elections is larger in municipalities just east of the line, as compared with the west (although significant at the 90% level). The effect is substantively important for the PSUC, the main opposition political party in Catalonia during the dictatorship. The PSUC share of the votes is about 5 percentage points higher in the 1977 elections just east of the line. On the other hand, the Online Appendix shows that the effect on turnout is not statistically significant.
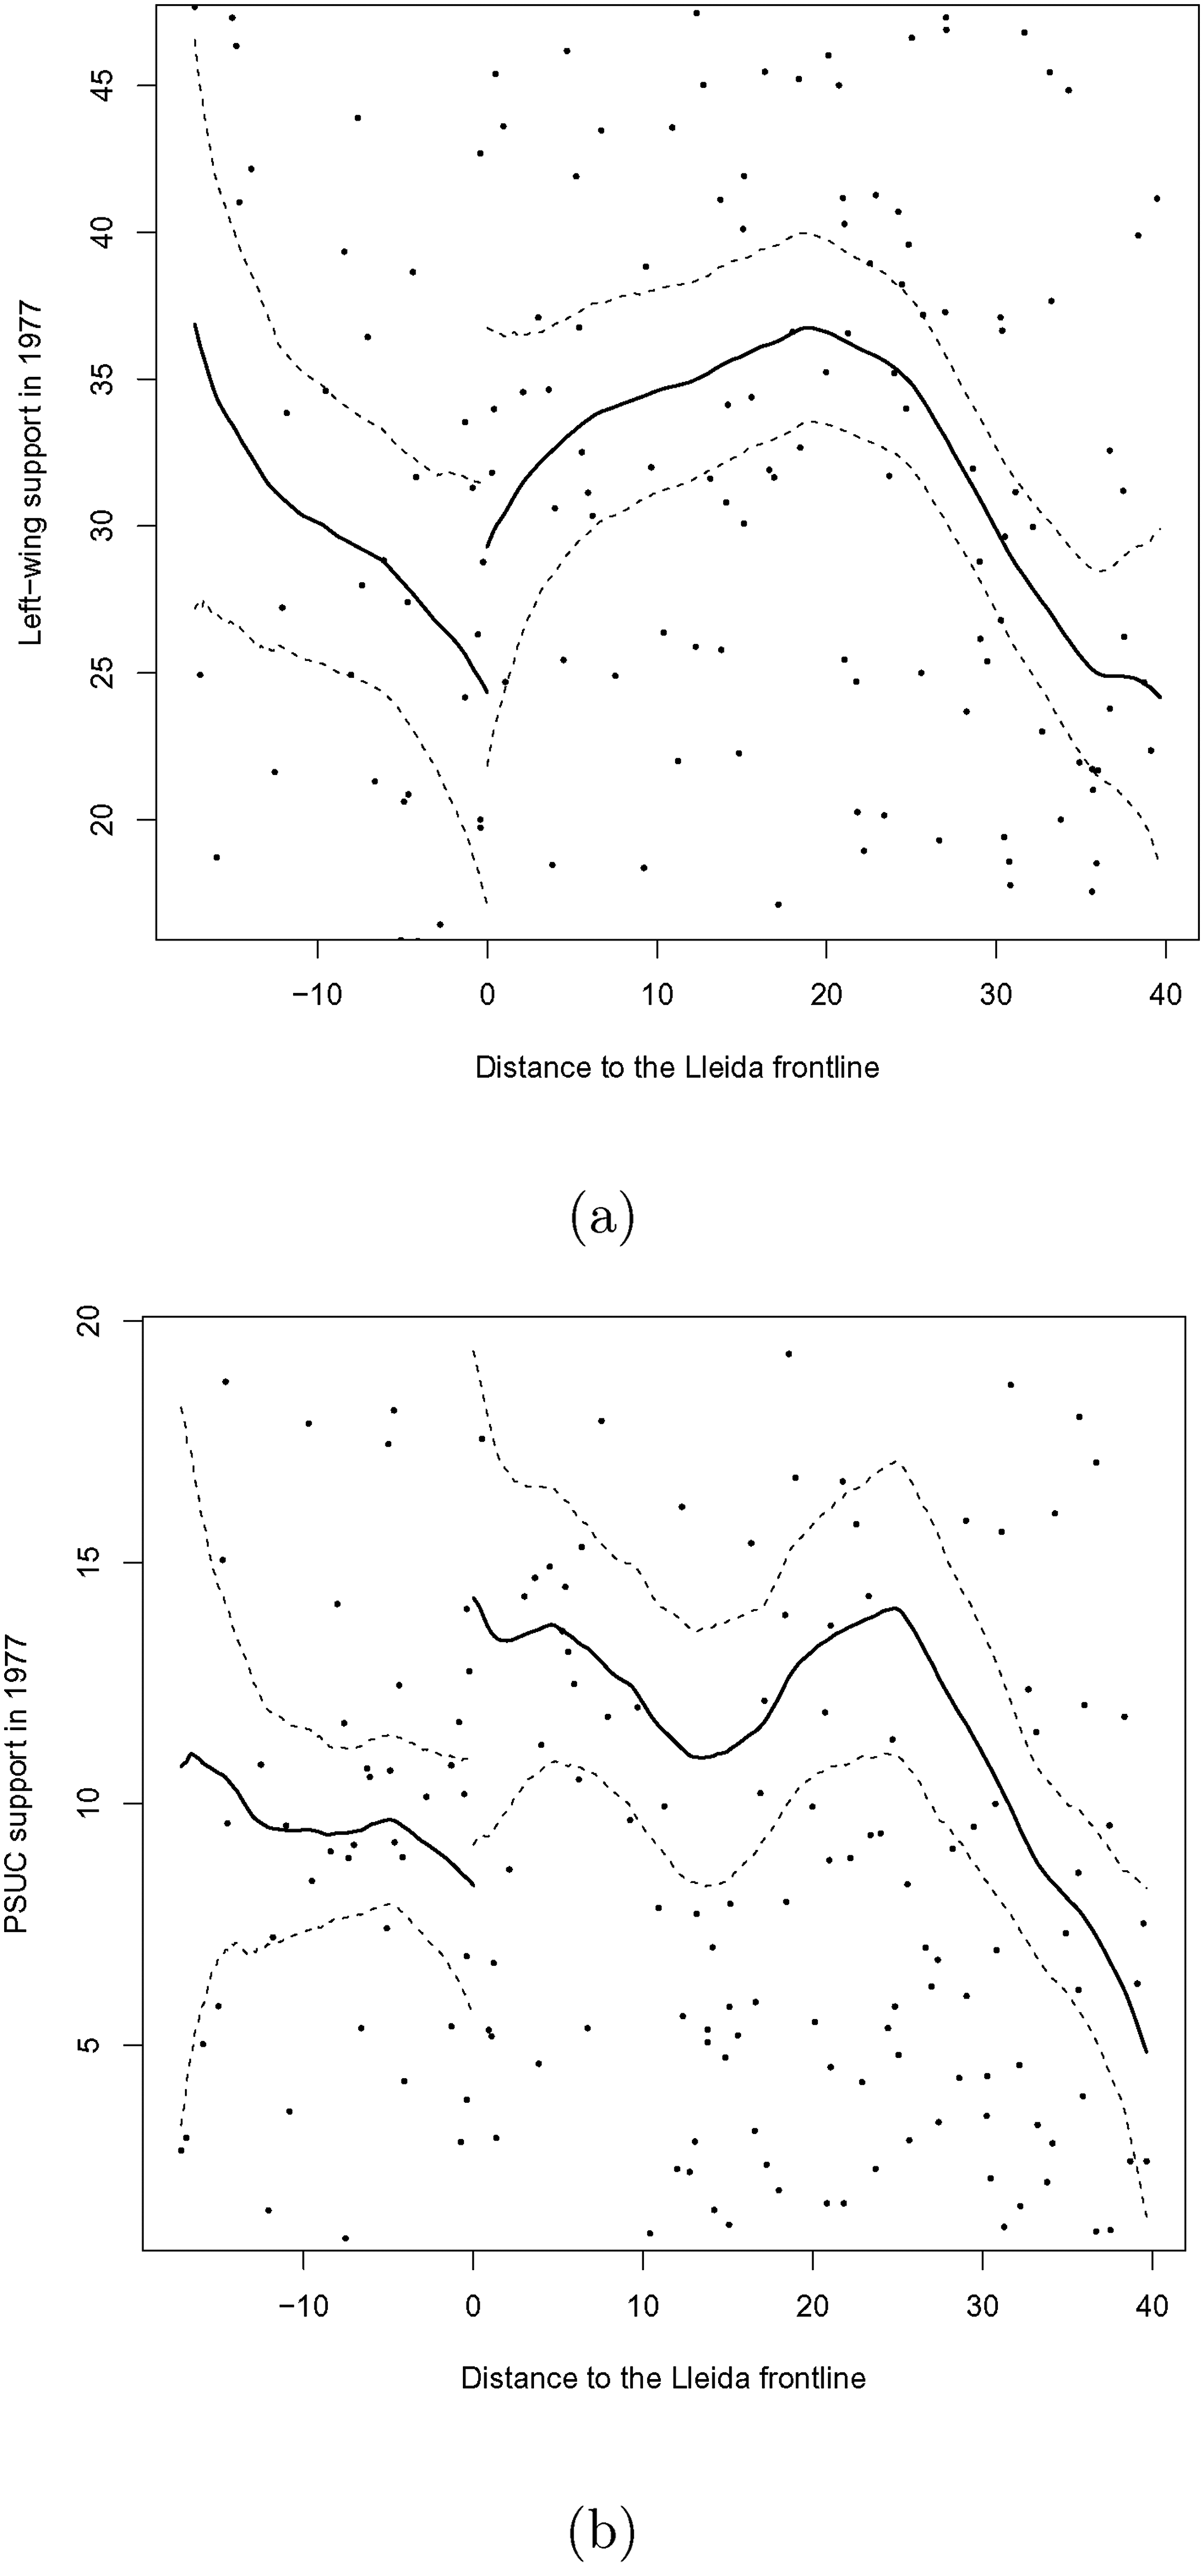
GRDD – voting for the left east and west of the Lleida front-line. (a) Left-wing support (1977). (b) PSUC (1977). Plots are based on a sharp GRDD. Second-order polynomials at a −20/+40 bandwidth have been employed. Bandwidth is calculated using the Imbens–Kalyanaraman optimal bandwidth procedure. Only municipalities corresponding to the provinces of Lleida and Tarragona are included.
Conclusion and discussion
Using Catalonia as a case study, this article has studied how the dynamics of violence between two opposite ideological groups (the left and the right) during and after a civil war fundamentally shaped vote choice and political participation 40 years later. Under what conditions, and in what direction, does violence by a particular side during a civil conflict have an effect on vote choice and political participation in the long run? The findings largely confirmed that violence and repression triggered greater support for anti-Francoist forces. That is, repression perpetrated by the dictatorship backlashed and generated an electoral bonus for opposition forces. More concretely, this study has shown that the Francoist repression fundamentally affected voting patters in the first free elections: the effect of leftist violence perpetrated during the civil war on the share of the votes received by the left 40 years later is negative, but overall left-wing opposition performed better in places where repression was more intense – and especially in places where the magnitude of repression was higher. The empirical analyses show no statistical relationship between repression and political participation. Overall, results are consistent with with the idea that the effect of violence and repression travels over time when these actions are perpetrated by clearly identifiable antagonistic actors, solidifying in-group and out-group loyalties. In a context where partisan competition largely reflected the poles of past victimization, violence turned voters against the side that committed it and more intense violence by one side or another tilted electoral behaviour against the more violent perpetrator.
The results of this article have several implications that are worth discussing in more detail.
First, findings help in our understanding of the first free election after an autocratic period. These elections are usually framed as a good opportunity to start a democratic regime on the right foot. If we take the article's findings as a starting point, we can interpret them in different ways: on the one hand, some might argue that, despite one of the purported goals of the transition to democracy being to heal wounds from the past, the effect of violence still persisted four decades later. On the other hand, the magnitude of the effect might be seen as small. The analysis also shows that in places with similar levels of violence on both sides, the effect of Francoist violence is comparatively smaller. One could also argue that the dictatorship was successful in keeping the link between left-wing violence during the civil war and left-wing political groups, diminishing the potential effect of their repressive actions. The rsults point to the idea that a violent past carries weight and shapes voting patterns in the founding election and, given certain conditions, may also travel to subsequent elections (Villamil, 2021). Thus, future scholars can study some conditions that remain largely unexplored, such as the role of political polarization, which may trigger dynamics potentially related to the violent past, having an impact on people's memory.
Second, results in this article do not give support to the idea that repression increases or decreases political participation, consistent with what Balcells (2012) finds. Although a large literature has linked higher levels of political apathy in third-wave democracies (such as Spain) with its authoritarian past, this article fails to prove this relationship at the municipality level. A plausible explanation for this pattern is that the the 1977 contest was the founding election, with high levels of political participation. Future works can complement the analysis by using individual data, for instance by turning to age–period–cohort models.
Finally, the findings in this article illustrate that traumatic events experienced at a critical juncture such as a civil war shaped vote choice in the founding election, a crucial event in any democratization period. Yet Catalonia is a particular case of study and differs from other regions in several characteristics, most notably the existence of a second orthogonal dimension of party competition, but also in terms of the strength of the left-wing actors before the civil war or different repressive dynamics after the conflict. Although the analysis was inconsistent when exploring the effect of violence/repression on Catalan nationalist mobilization, future research can further explore this question.
Supplemental Material
sj-pdf-1-cmp-10.1177_07388942221140872 - Supplemental material for The scars of violence and repression on founding elections: Evidence from Spain
Supplemental material, sj-pdf-1-cmp-10.1177_07388942221140872 for The scars of violence and repression on founding elections: Evidence from Spain by Toni Rodon in Conflict Management and Peace Science
Supplemental Material
sj-rar-2-cmp-10.1177_07388942221140872 - Supplemental material for The scars of violence and repression on founding elections: Evidence from Spain
Supplemental material, sj-rar-2-cmp-10.1177_07388942221140872 for The scars of violence and repression on founding elections: Evidence from Spain by Toni Rodon in Conflict Management and Peace Science
Footnotes
Acknowledgements
I would like to thank Mercedes Vilanova for facilitating the access and exploitation of the digital version of the Atles Electoral de la Segona República a Catalunya. I also thank Raimon Soler, for facilitating several datasets and excellent advice. I also thank Marc Guinjoan, Daniel Boschler, Anja Neundorf, Grigore Pop-Eleches, Ksenia Northmore-Ball seminar participants at the 2017 ECPR joint sessions, Copenhagen University, the London School of Economics and King’s College.
Funding
The author disclosed receipt of the following financial support for the research, authorship, and/or publication of this article: Research was supported by the project Political Competition, Infrastructures and Female Voting during the Second Republic (1931–1936): the case of Catalonia (CSO2014-59191-P). It was also supported by the Ministerio de Ciencia e Innovación (grant number CSO2014-59191-P).
Supplemental material
Supplemental material for this article is available online.
Notes
References
Supplementary Material
Please find the following supplemental material available below.
For Open Access articles published under a Creative Commons License, all supplemental material carries the same license as the article it is associated with.
For non-Open Access articles published, all supplemental material carries a non-exclusive license, and permission requests for re-use of supplemental material or any part of supplemental material shall be sent directly to the copyright owner as specified in the copyright notice associated with the article.