
Abstract
Do people from disadvantaged ethnic groups favor political violence over non-violent tactics? Studies of horizontal (between-group) inequality often concentrate on civil war. This article drills below the macro level and looks beyond civil war, to investigate individual participation in various types of conflict. Different types and combinations of ethnic disadvantage favor participation in different kinds of conflict, because of different opportunity structures. Political exclusion motivates leadership, which facilitates organized movements. Economic disadvantages restrict economic leverage, making non-violent tactics less likely to succeed. The article maps these components of groups’ opportunity structure onto different constellations of inequality. It uses Afrobarometer survey data (N = 29,727) to show that economic disadvantages increase participation in political violence short of civil war. When they coincide with political exclusion, they also make people steer actively away from demonstrations. The evidence is less conclusive for political disadvantages alone, but points toward increased participation in demonstrations.
Keywords
Introduction
No insurgency or protest movement can succeed unless a number of people take part in it. Conflict scholars therefore make assumptions about how grievances (Cederman et al., 2011; Gurr, 1970), greed or (lack of) opportunities (Collier and Hoeffler, 2004; Fearon and Laitin, 2003) make people susceptible to recruitment. Yet the micro foundations of prominent theories remain empirically underexplored. Existing micro level studies offer theoretical accounts (Gates, 2002) or investigate one or a few countries (Hillesund, 2015; Humphreys and Weinstein, 2008; Must, 2018; Rustad, 2016; Weinstein, 2007; Wood, 2003).
Inequality between ethnic groups (horizontal inequality) is the most prominent grievance explanation of civil war, but little attention has been paid to its implications for non-state actors’ opportunity to succeed with other forms of conflict. This article shows that different forms of inequality come with different opportunity structures, which facilitate different types of conflict. It moves beyond the study of civil war and below the macro level, to examine what incentives people in disadvantaged ethnic groups have to join lower-level and non-violent contentious action, and how group-level opportunity structures and elite preferences condition them.
Short-term, individual cost–benefit calculations tend to favor non-violent protest, but for disadvantaged ethnic groups, group-level opportunity structures usually do not. Existing studies show that when economic disadvantages coincide with political exclusion, they facilitate civil war (Cederman et al., 2013). This study argues that they also actively dissuade non-violent tactics. Exclusion gives group elites, who see their groups’ lack of leverage more clearly than ordinary group members do, an incentive to provide dissidents with leadership and organization. Meanwhile, economic disadvantage restricts their economic leverage. Leaders then steer people away from non-violent action, because it is less likely to succeed when economic leverage is limited.
Because they pay little attention to opportunity structures, existing studies overlook another important implication: when economic and political disadvantages do not overlap, they should spur other forms of conflict than civil war. Economic disadvantages alone favor lower-level violence, since group elites have few incentives to lead organized challenges against the status quo when they are not excluded from political power. Political disadvantages alone favor non-violent action, because they inspire leadership but come with fewer restrictions on economic leverage.
A conservative analysis of Afrobarometer survey data, across 25 countries and 92 ethnic groups, confirms that economic disadvantages increase participation in political violence short of civil war, and when accompanied by political exclusion, actively decrease participation in demonstrations. For political disadvantages alone, the evidence is less conclusive, but points towards increased participation in demonstrations.
The article makes important contributions. It shifts attention to the opportunity structures that condition different manifestations of ethnic conflict and bridges the group and individual levels of analysis. Importantly, while representative survey data tend not to capture participation in civil war, non-violent and lower-level forms of conflict merit investigation in their own right. Because many civil wars are preceded by these more common forms of conflict, we need to understand their causes. Moreover, social movement theories indicate that many mechanisms held to link inequality to civil war explain other forms of conflict equally well. Lumping together in a “no civil war” reference category cases with little agency and those where people’s agency takes a non-violent or lower-level form undermines our ability to disentangle explanations of mobilization from explanations of tactical choice. This article therefore accounts explicitly for non-violent tactics when investigating why so many members of ethnic groups like the Shona–Ndau in Mozambique take part in political violence (6% 1 ), to avoid conflating comparisons with groups like the Susu in Guinea, whose members rarely protest at all (0.7% in violence, less than 4% in demonstrations), and groups like the Kgalagadi in Botswana, who have protested extensively, but with non-violent means (13% participated in demonstrations, none in violence).
The article improves on previous micro-level studies of conflict mobilization (Humphreys and Weinstein, 2008) with more rigorous sampling procedures and broader geographical coverage. Its outcome variables record self-reported participation, where others measure attitudinal support (Hillesund, 2015; Rustad, 2016). 2 Finally, some alternative explanations can only be tested on the micro level. This analysis uses survey data to rule them out. It shows that the relationship between economic group disadvantage and political violence is not driven primarily by the poorest group members, whose individual opportunity cost is lowest, nor by people in rural areas in autocratic regimes, who are least likely to consider non-violent resistance a viable alternative.
Constellations of inequality and conflict: the opportunity structure
Inequality between ethnic groups is a prominent explanation of civil war, but can it explain why people join different forms of conflict? I define conflict broadly, as contentious collective action where ordinary people join forces to challenge elites, authorities and opponents outside conventional political channels (Tarrow, 2011: 6–9). This covers violent and non-violent, large- and small-scale, sustained and short-lived conflict, but not voting or interest group affiliation. 3 To determine whether and to what extent the mechanisms held to link horizontal inequality to civil war can explain lower-level violence and non-violent protest, I develop a framework that spans both individual and group (leader) incentives. I move beyond established grievance mechanisms to get at the opportunity structures that different constellations of group disadvantage come with and how they facilitate different forms of conflict. The core assumption is that individuals have agency and try to maximize expected benefits, but that their leaders influence their expectations.
The consensus: disadvantaged groups fight more civil wars
A comprehensive econometric literature shows that horizontal inequalities—unlike inequality between individuals or ethnic diversity alone—increase the risk of civil war (Cederman et al., 2011, 2013; Murshed and Gates, 2005; Østby et al., 2011; Østby, 2008; Vadlamannati, 2011), that is, internal armed conflict between a government and at least one organized nonstate actor (Gleditsch et al., 2002). Horizontal inequalities are differences in economic, social, political and cultural status between culturally defined (often ethnic) groups (Stewart, 2008). While both privileged and disadvantaged groups have an incentive to initiate armed conflict, the empirical evidence is strongest for group disadvantage. Both socioeconomic and political disadvantages spur civil war, but the effect is strongest when they overlap (Cederman et al., 2013).
Most explanations of civil war hinge on individual-level assumptions. Participation in armed insurgency is costly. It comes with a high risk of repression and forces people to give up benefits outside the movement, such as jobs, income and education opportunities. While rebels can expect to benefit if the insurgency succeeds, this is a long-term prospect. People have an incentive to free-ride, because the chance of success, and access to the benefits that come with it, change little if a single person decides not to participate (see Olson, 1965). 4
To explain why we see collective action at all, when everyone has an incentive to free-ride, traditional rational choice accounts argue that selective material incentives can outweigh expected costs (Collier, 2000). In armed insurgencies, material rewards range from money and valuables to shelter, food, drugs or alcohol, provided as wages or looting opportunities (Gates, 2002).
Horizontal inequality explanations highlight another class of selective incentives: non-material (emotional) and other-regarding rewards. Often overlooked in traditional rational choice accounts, they are central in qualitative studies (Petersen, 2001; Weinstein, 2007; Wood, 2003). Because people value their social attachments, social groups can encourage participation by threatening to withhold member benefits (McAdam, 2010). Conflict participation brings inter-personal and solidary rewards, like prestige and camaraderie (Gates, 2002; McAdam, 2010: 45). In addition, there are functional rewards. Acting on emotions like anger, resentment and frustration, and fighting for a just cause, bring people pleasure in agency (Gates, 2002; Gurr, 1970; Wood, 2003). Thus, the frustration-aggression hypothesis from early theories of relative deprivation (Gurr, 1970) is revived and updated in horizontal inequality theory.
Economically disadvantaged groups have fewer financial resources than other ethnic groups to spend on material rewards for rebel soldiers. They compensate with social endowments, such as shared norms, beliefs and expectations (Weinstein, 2007). This is easier in ethnically homogeneous movements with a strong sense of identity (Gates, 2002). First, people who identify strongly with a group are more likely to compare its situation to other groups, find its disadvantages unjust, and blame an external actor. These shared perceptions of grievance lower barriers to collective action (Cederman et al., 2013), especially if group leaders nourish them. Second, ethnic groups often come with pre-existing networks that aid mobilization, as nascent movements draw on established social trust, leadership, communication networks, and sanctioning mechanisms (Tarrow, 2011).
It is far from obvious that the above dynamics are bound to lead to civil war, rather than lower-level violence or non-violent protest. The horizontal inequality account draws on social movement theory, which covers various forms of contentious action (see Tarrow, 2011). It leaves open the question of whether horizontal inequalities just facilitate mobilization in general, or also the chance that it becomes organized and violent. To answer the question, this article bridges the micro and meso levels of analysis, asking whether the individual-level incentives discussed for civil war extend to other forms of conflict, and what incentives group leaders have to take the lead in challenging the status quo and steer group members toward violent or non-violent tactics. To answer the second part of the question, we must account for different constellations of inequality, and the opportunity structures they come with, which facilitate different types of conflict.
Lower-level political violence
Political violence can take many forms, from unorganized, sporadic riots to outright civil war. Beyond the established association between horizontal inequalities and civil war, can we expect group disadvantages to increase participation in less organized or severe violence? 5
The basic trade-offs that motivate individuals to take part in civil war extend to lower-level political violence: people need material or non-material rewards to offset the cost of participation. Historical examples from Eastern Europe (Commercio, 2018; Petersen, 2002) show that non-material rewards, from acting on the anger and resentment spurred by group disadvantage, can fuel ethnic riots, not just civil wars. In Niger, angry youth in the Zinder region reiterated long-standing narratives of Hausa/Zinder marginalization and Djerma/Niamey domination when they resorted to violent protest in November 2011, amid demands that a new oil refinery be accompanied by lower fuel prices, quotas for local workers, and redistributive policies (Schritt, 2018).
Other incentives differ between civil wars and lower-level violence, making lower-level violence potentially less appealing. First, it offers fewer material benefits. Some riots provide looting opportunities similar to those in civil war, however, and when armed insurgencies are motivated by group disadvantage, they typically rely more on non-material than material rewards. Second, lower-level violence gives less protection against repression than armed insurgency. Yet it comes with a lower opportunity cost, because rioters are less likely to go into hiding full-time. To the extent that these differences cancel out, individual group members have as much incentive to contest their disadvantage with lower-level violence as with civil war.
Individuals do not make decisions in a vacuum. What manifestation of conflict their leaders prefer—if they want overt conflict at all—should influence group members’ calculations, whether through subtle framing (Benford and Snow, 2000) and rhetoric, which gradually shift perceptions, or overt sanctions. 6 At first glance, group leader incentives pull in different directions. They may prefer civil war—because lower-level violence is unlikely to alter the status quo. Yet lower-level violence can provide more immediate advantages within conventional (electoral) politics. Riots and ethnic conflict sometimes make group members rally around their leaders (Wilkinson, 2006). The evidence is mixed on whether horizontal inequality does (Fjelde and Østby, 2014; Hillesund, 2019) or does not (Raleigh, 2014) spur communal conflict. A third option exists, which was long neglected in conflict research: people may opt for non-violent tactics.
Non-violent tactics
Non-violent conflict can take many forms, from sit-ins to demonstrations, strikes and boycotts. They either complement or replace conventional politics. The line between non-violent and violent movements or events becomes blurred if enough individuals in initially peaceful demonstrations resort to violence. This article concerns the individual’s choice between participation in violent and non-violent conflict.
Intuitively, individuals should be at least as willing to use non-violent as violent tactics. The physical and moral barriers are lower for non-violent action. Because it tends to be less covert, it creates fewer information and commitment problems (Chenoweth and Stephan, 2011). While non-violent movements offer less protection and material benefits than rebel armies—even less than lower-level violence—many countries also respond to non-violent resistance with less harsh measures than they would for armed insurgency or lower-level violence and practice higher thresholds for repressing non-violent action.
Anger could alter this calculation. Social psychologists tend to link it to aggressive action tendencies (Claassen, 2016: 128; Mackie et al., 2000; Roseman et al., 1994). Thus, the emotional rewards could be higher for people who respond to anger with violence. However, recent research shows that under certain conditions, the emotional force of anger can be channeled into non-aggressive strategies (Halperin et al., 2011). Inter-ethnic grievances may be inherently prone to violence, because they encourage an othering that can spill into outright dehumanization. Still, leaders’ framing of group narratives can affect whether people put outgroup actions down to innate and immutable characteristics. If they can be convinced that the outgroup is capable of change, non-violent tactics become possible (Halperin et al., 2011).
What incentives do group leaders have to steer people towards non-violent action? The opportunity structure that makes non-violent tactics most likely to succeed differs from that of civil war and other violence. Non-violent movements rely on other mechanisms of coercion. Because they coerce with persuasion, disruption and non-cooperation, rather than deaths and destruction, their prospects for success hinge more on leverage: the ability to create loyalty shifts in the networks the government relies on for its power—whether a narrow elite and the security forces or wider swaths of the population—to make them force the government to resign or make concessions (Schock, 2005: 144–145).
Movements have more leverage the more people and identity groups they span (Chenoweth and Stephan, 2011), but ethnic movements tend to be small and homogenous. On the one hand, homogeneity enhances cohesion, a precondition for the effective implementation of non-violent tactics (Pearlman, 2011). On the other hand, narrow ethnic claims that limit movement size and diversity mean limited leverage, which makes political violence more appealing. Because it takes relatively few people to bring about enough deaths and destruction to put pressure on the government, political violence (armed insurgency in particular) brings more coercive power per recruit than non-violent tactics (Dahl et al., forthcoming).
Thus, while individual incentives suggest that all disadvantages should increase non-violent action, group-level incentives imply the opposite relationship. The econometric evidence is mixed. Existing studies find positive, negative and null relationships between group disadvantages and non-violent conflict (Bartusevičius and Gleditsch, 2019; Butcher and Svensson, 2016; Chenoweth and Ulfelder, 2017; Cunningham, 2013; Dahl et al., forthcoming; Gurr, 1993; Miodownik and Nir, 2016; Østby, 2016; Regan and Norton, 2005; Thurber, 2018).
Constellations of inequality
To make more precise predictions about conflict participation, we need to distinguish between different types and constellations of inequality, which come with different opportunity structures: political disadvantages facilitate movement leadership, while economic disadvantages restrict economic leverage. How the two combine affects the viability of different forms of contentious action, and therefore the choice between them.
Economic disadvantages come with little economic leverage. Such leverage has many sources. It can derive from sheer size, or from being heavily represented in areas and occupations central to the economy, even among economically disadvantaged groups. Examples include Afro-Americans in the US and Blacks in South Africa. Comparing otherwise similar groups, however, economic leverage decreases with economic disadvantage. It means fewer co-ethnics to persuade in the economic elite. Strikes and boycotts hurt smaller sections of the elite and population.
Political disadvantages come with little political leverage, in the form of interpersonal relationships with people in state institutions (Thurber, 2018). They motivate movement leadership, however, which facilitates organized conflict. In politically disadvantaged and excluded groups, large parts of the elite lack access to political office. This gives them an incentive to lead challenges against the status quo. Stronger leadership means higher organizational cohesion. This leaves movements better able to channel people’s anger into the tactics they prefer, whether they prefer non-violent campaigns or organized violence (Pearlman, 2011). 7 In politically advantaged groups, groups whose disadvantage is economic only, a substantial share of the elite holds political power. This makes them reluctant to challenge the status quo (Langer, 2005). Since movement leaders often (although not always) originate from group elites (Gurr, 1970: 334–338), the absence of elites who are motivated to challenge the status quo makes for less organized and cohesive movements, on average, in politically more advantaged groups.
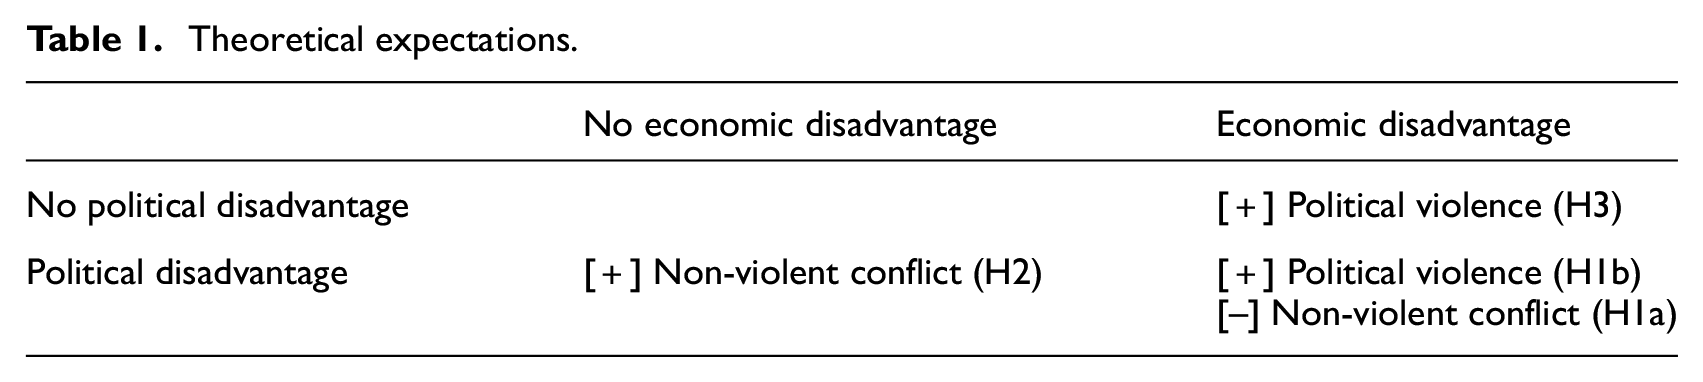
Group disadvantages can be economic only, political only or combined. These constellations come with different opportunity structures and different expectations about conflict. Because the latter two have a political component, they facilitate movement leadership. Group members’ choices between violent and non-violent action come to depend more on their leaders’ decisions. They face one important difference in opportunity structure, however: economic leverage. On average, groups with an exclusively political disadvantage are more likely to succeed with non-violent action, because they are more central to their countries’ economies. Three empirical implications follow. The leaders of politically excluded groups should want to steer group members away from non-violent action and towards political violence if their group is economically disadvantaged; and encourage non-violent action otherwise.
Hypothesis 1b extends the previous finding that combined disadvantages, in particular, increase the risk of civil war (Cederman et al., 2013) to organized political violence short of civil war.
The third constellation—exclusively economic disadvantage—makes for little economic leverage and leaders with little incentive to challenge the status quo. This could mean little or no mobilization. Indeed, Tilly (1998: 225) argues that people are difficult to mobilize over inequality, unless the structural position of the subordinated group changes (for example as the state responds to a crisis). On a smaller scale, however, ordinary group members could take matters into their own hands and lash out (cf. Gurr, 1970: 334–338)—in anger or to achieve localized redistribution—even in the absence of structural changes and motivated elites. Empirical evidence points in this direction. Among politically included groups in Africa, economic disadvantages have been linked to violence between loosely organized communal groups (Hillesund, 2019).
Hypothesis 3 predicts less organized violence than Hypothesis 1b. The Afrobarometer data cannot capture this distinction, so I leave it for future research to disentangle. Note further that the theory makes no clear prediction about exclusively economic disadvantage and non-violent tactics. The groups in question are politically included, so what they lack in economic leverage could be offset by political leverage, making non-violent action possible. Yet economic disadvantages are less likely to motivate strong leadership. And when a lack of leadership restricts movement cohesion, it is difficult to implement non-violent tactics (Pearlman, 2011).
Alternative explanations
Three alternative mechanisms need to be ruled out. First, members of economically disadvantaged groups may not consider non-violent tactics a viable alternative to violence because they live in rural and peripheral areas where they are not exposed to non-violent conflict, or in repressive regimes where non-violent action is as costly as political violence. To rule this out, I re-run the analysis on the respondents who are most likely to find non-violence a viable alternative.
Second, if most of the group members who use violence are severely deprived in absolute terms, the above expectations pull in the same direction as traditional opportunity cost explanations and the idea that individuals respond primarily to their personal material incentives. The horizontal inequality account revolves around solidarity with the group, however. Thus, better placed group members should join the most deprived, acting to improve the group’s situation. Micro-level data allow me to include individual-level variables to rule the alternative explanation out.
Finally, the theory rests on an assumption that expected costs and benefits remain constant over movements’ life span. Decisions to participate depend on at least two factors that evolve over time, however: others’ decisions to join and expectations about repression. The results of this analysis could be biased toward violence if the movements available to respondents saw more repression than usual. This could tip the scale away from non-violent action by increasing anger and decreasing faith in the efficacy of non-violence. 8 Data from the Social Conflict in Africa Database (SCAD v.3.1) (Salehyan et al., 2012) suggest that repression levels for the countries and years under study are representative for Africa, however. In the survey year and preceding year, 20% of the social conflict events initiated in the relevant countries saw non-lethal repression, and 7% lethal repression. The corresponding figures for the rest of Africa (1990–2013) are 19 and 9%.
Research design
The empirical analysis maps Afrobarometer survey data on conflict participation (Round 5, 2011–2013; Afrobarometer, 2015b) onto ethnic group-level data from the Ethnic Power Relations Project (EPR-ETH v.2014; Cederman et al., 2013: 66–67; Vogt et al., 2015). 9 It covers 29,727 respondents, 92 ethnic groups and 25 African countries. 10 Afrobarometer surveys use clustered, stratified, multistage, area probability samples designed to be nationally representative and avoid that distinctive languages or ethnic groups are left out (see Online Appendix). This approach is less likely to introduce biases than the partially random sampling used by Humphreys and Weinstein (2008) in Sierra Leone.
I measure self-reported participation in political violence and non-violent conflict in the past year with binary variables constructed from the following Afrobarometer question: Here is a list of actions that people sometimes take as citizens. For each of these, please tell me whether you, personally, have done any of these things during the past year. If not, would you do this if you had the chance: […] D) Attended a demonstration or protest march […] E) Used force or violence for a political cause. (Afrobarometer, 2015a: Q26)
I dichotomize the response items (No, would never do this; No, but would do if had the chance; Yes, once or twice; Yes, several times; Yes, often) into the categories “yes” and “no”. 1% of respondents report participating only in political violence, 7% only in demonstrations, 2% in both, and 90% in neither (Afrobarometer, 2015a). While we cannot be sure that all respondents interpret “demonstration and protest march” as conceptually distinct from “force or violence”, great care is taken in the translation of Afrobarometer questionnaires to ensure conceptual equivalence, in order to preserve the intent of each question (see Online Appendix).
Participants in highly organized armed insurgencies, who often live in hiding, are seldom captured in nationally representative samples. As a result, the violence question measures participation in lower-level violence, primarily. The demonstrations question captures one of many non-violent tactics. Arguably, the economic leverage mechanism would be better tested with variables that include strikes and boycotts, to capture economic coercion. Demonstrations, strikes and boycotts are often used in combination, however. Finally, the survey data does not tell us what event each respondent took part in. By way of an overview of available movements, SCAD records 584 demonstrations, 292 violent riots and 196 instances of anti-government violence in the relevant countries in the year of the survey and the preceding year, plus civil conflict in Mali.
I measure political disadvantage with a dummy (Political exclusion) that flags ethnic groups that did not hold executive power in the year preceding the survey (first introduced in Wimmer et al., 2009). The economic disadvantage variable (Relative economic deprivation) estimates how far below the national average a group’s income fell in 2009 (Cederman et al., 2015), dividing the former by the latter. Its main source is geocoded data on per capita GDP (Nordhaus, 2008), overlaid on group settlement areas. It is bolstered with nightlight emissions data where the data quality is low, and with survey data where settlement areas overlap (Cederman et al., 2015). To ease interpretation of the interaction between political and economic disadvantage, I subtract 1 from the economic variable, giving situations with no economic disadvantage the value zero. I add a corresponding variable for relative economic privilege (Cederman et al., 2015).
The empirical analyses are bivariate probit regressions with sampling weights, 11 group-clustered standard errors and country fixed effects. They estimate one probit equation for each dependent variable and allow the errors to correlate between equations. This accounts for the expectation that the decisions to take part in violent and non-violent forms of protest depend on each other. 12 The models should produce conservative estimates, since political violence is particularly likely to be underreported among the disadvantaged. I pay particular attention to the estimated probability of participating in political violence or demonstrations alone, rather than their combination. When people report participating in both in the past year, we cannot know whether they considered this combination superior to begin with, took part in a movement which escalated over the year, or left one and joined another because they changed their mind on tactics. Alternatively, they may have failed to grasp the conceptual distinction between “demonstrations and protest marches” and the “use of force or violence” when responding to the survey, because African protest marches frequently turn violent, and it is possible to be interpret the use of force as encompassing strikes. Either way, these observations obscure the link between disadvantages and tactical choice, because the data do not account for the sequence of events. To distinguish between people who took part in violence alone, non-violence alone, or both in the analysis, I pay particular attention to predicted probabilities. Unlike regression coefficients, they are calculated separately for each combination of outcomes.
The country dummies account for between-country heterogeneity that could otherwise confound the analysis. Factors that could influence both wealth and power differentials between groups, and the opportunity to use violent and non-violent protest, include differences in climatic and geological conditions, (pre-)colonial and more recent history, industrialization and conflict history. 13 Group fixed effects are not an alternative here, because the explanatory variables do not vary within groups, and protest participation is measured at only one point in time. While the multilevel structure of the data may call for group random intercepts, these cannot be combined with country fixed effects, because the analysis covers only two to five groups in most of the countries and the explanatory variable does not vary within groups. 14
I control for potential confounders on the group level: relative group size and urban settlement (Vogt et al., 2015); and, unlike most studies in this field, peripheral location, proxied by travel time from the groups’ settlement area to the nearest large city (Tollefsen et al., 2012; Uchida and Nelson, 2009). 15 Rural or peripheral location facilitates violent insurgency, and could affect socioeconomic position through the allocation of infrastructure projects to more central areas. Smaller groups should be easier to keep out of power without undermining regime legitimacy and face a mobilization disadvantage for non-violent protest. To account for conflict history, I include the cubic polynomial of years since large-scale violent or non-violent conflict. 16 To reduce concerns about endogeneity, I use explanatory variables that precede the outcome in time. 17 In addition, economic horizontal inequality is very durable. 18 I first restrict individual level controls to age and gender to avoid post-treatment controls. Then I add potential mediators to capture opportunity cost and grievance mechanisms: self-reported living conditions, education, unemployment, and perceptions of unfair treatment.
The empirical design is a conservative test, but it has certain limitations. First, the results may not apply outside Africa, because the countries surveyed do not cover the full range of institutions, regime types and economic conditions that could condition individual choices. Second, Afrobarometer does not cover all of Africa. Few Central African countries are included, probably owing to concerns over security and accessibility. Third, the most conflict-ridden and inaccessible regions within the Afrobarometer countries are not always surveyed. Since the poorly covered countries and regions tend to be peripheral and deprived, however, some plagued by violent conflict, their exclusion works against the expected relationship between relative group deprivation and political violence. They make the test more conservative. Fourth, relatively few Afrobarometer respondents belong to groups that are both politically excluded and face severe economic disadvantages. This increases estimation uncertainty. Finally, people who participate in the most organized and extreme forms of violence are unlikely to be captured, because they often live in hiding. Thus, I do not test the consensus expectation that combined disadvantages facilitate participation in full-blown civil war (Table 1).
Theoretical expectations.
Empirical analysis
Table 2 shows the results from bivariate probit regressions with country fixed effects. 19 Model 1 confirms the need to distinguish between types of inequality, as there is no blanket increase or decrease in non-violent action across all forms of disadvantage. Only the relationship between economic disadvantage and lower-level violence reaches statistical significance. The control variables show, as expected, that women participate less than men and that participation decreases with age. More surprising is the fact that members of large groups participate more in political violence, but not in demonstrations, and that time since non-violent protest influences both tactics, while time since violence does not (Table A16 in the Online Appendix). Relative economic privilege, urban settlement, and travel time fail to reach statistical significance.
Bivariate probit regressions of conflict participation.
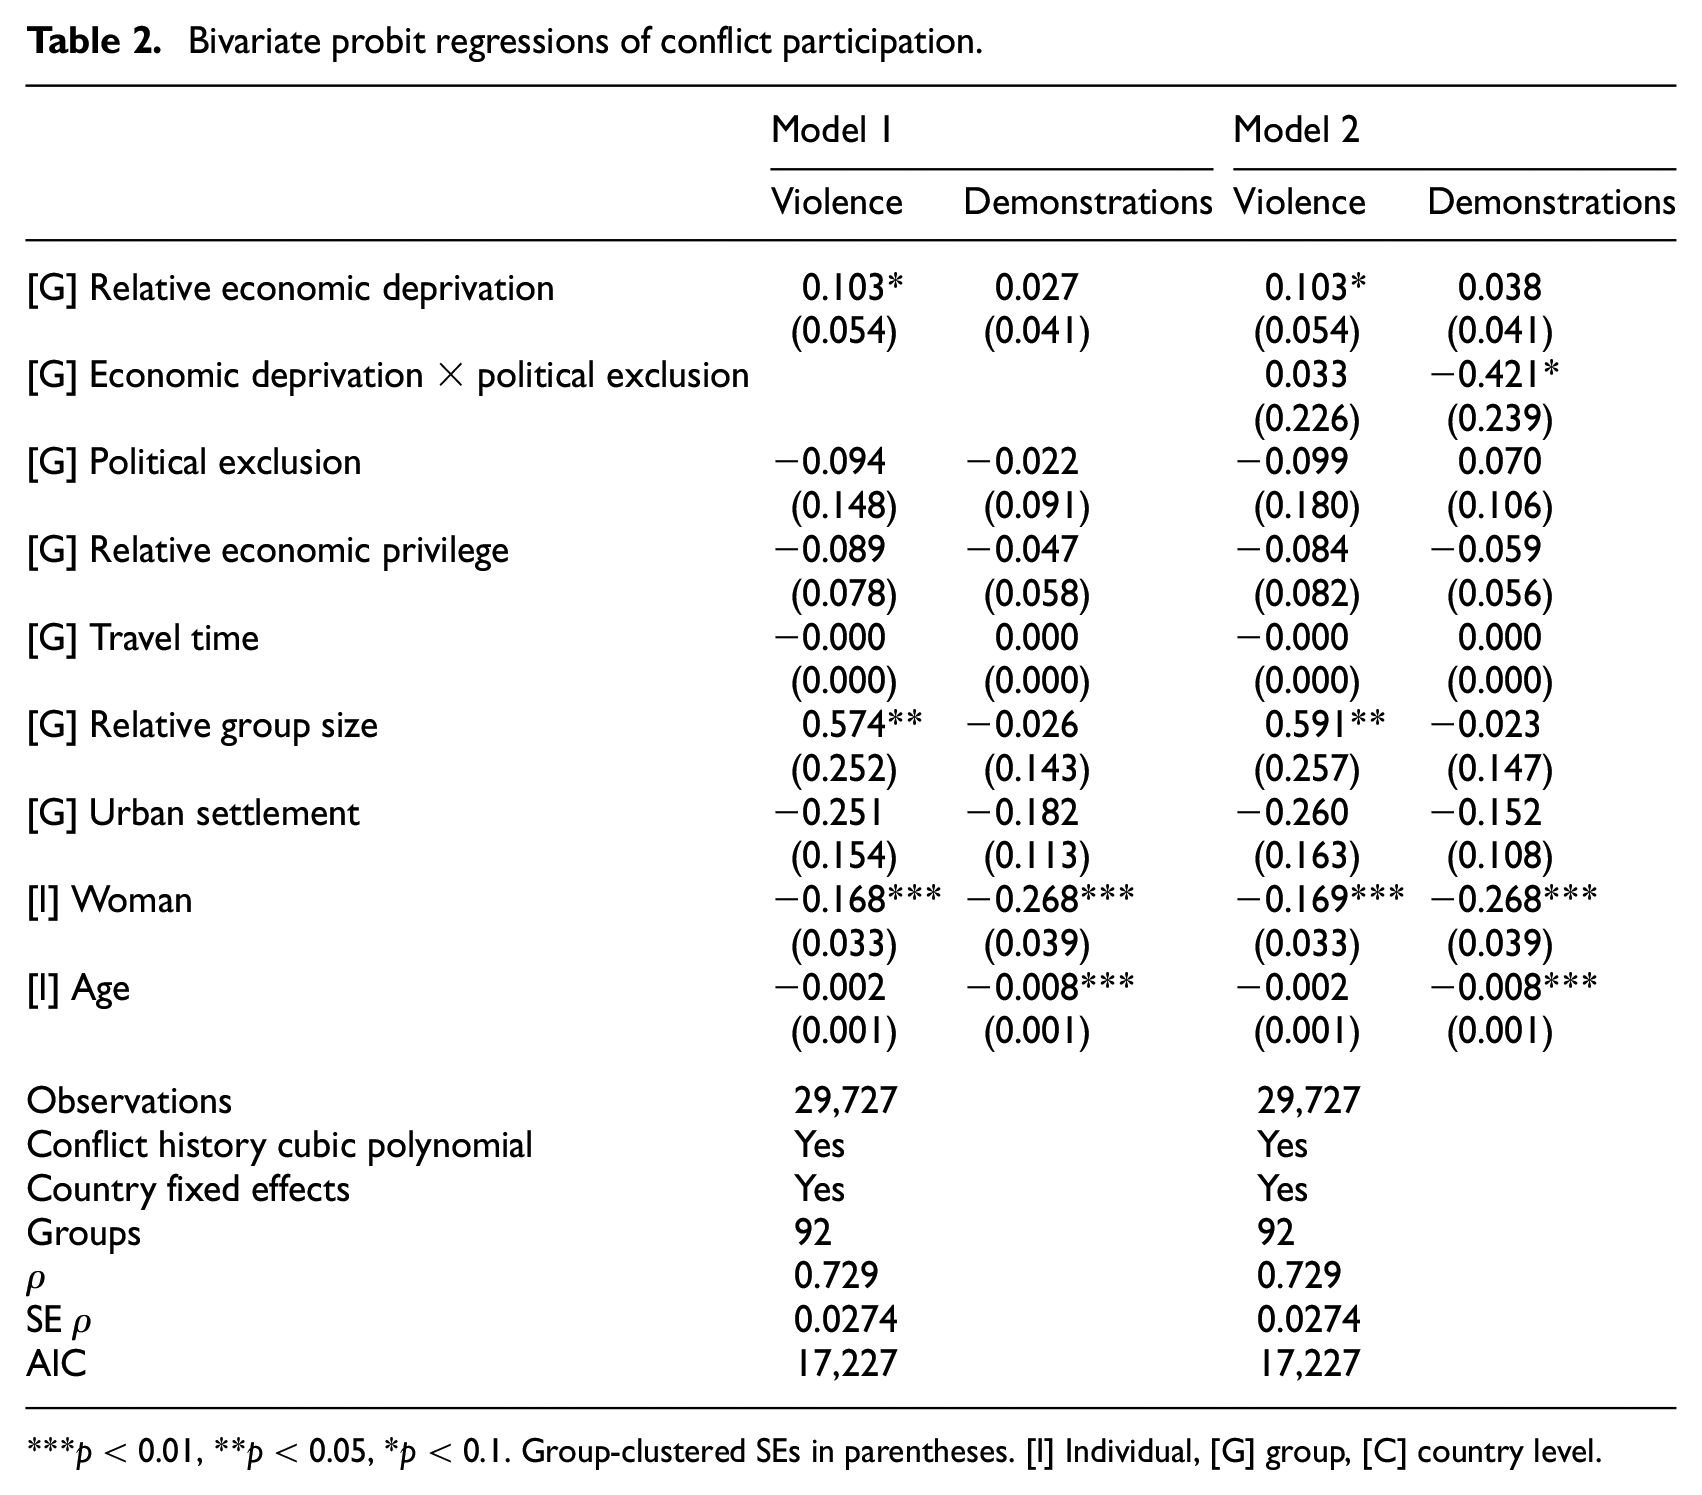
p < 0.01, **p < 0.05, *p < 0.1. Group-clustered SEs in parentheses. [I] Individual, [G] group, [C] country level.
Since each hypothesis corresponds to a constellation of disadvantage, I introduce an interaction term. Beginning with the third constellation—economic disadvantage alone—Model 2 supports the expectation that economic disadvantage increases participation in political violence among the politically included (H3). The 10% significance level might seem unimpressive, given how high-powered the test is on the individual level. However, the disadvantage variables vary only across the 92 groups covered, and the fixed effects mean the results are driven by within-country variation. Figure 1 shows predicted probabilities for three example countries. Comparing economic relative deprivation scores of 0 and 2, the predicted probability of participation in political violence, alone or in combination with demonstrations, increases between 40 and 70%. For demonstrations alone, there is practically no change.
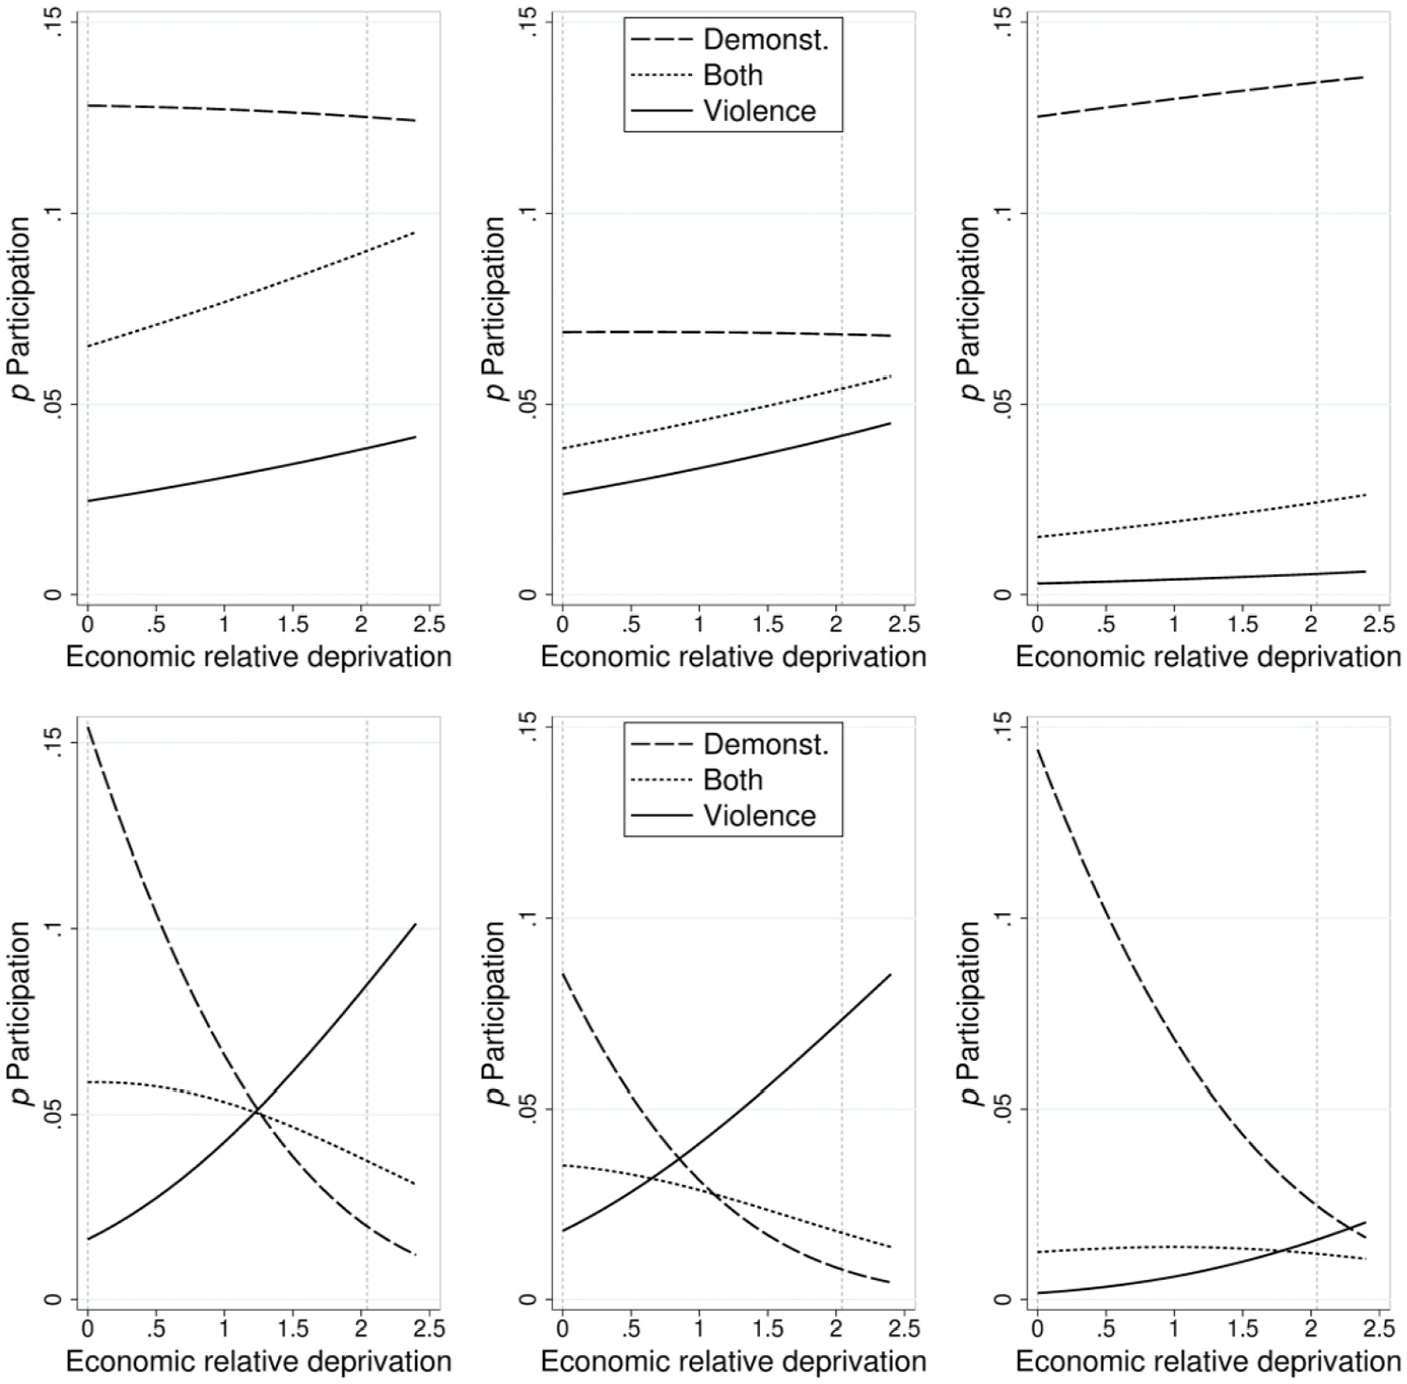
Predicted probability of participation by economic deprivation in politically included (top panel) and excluded (bottom panel) groups. Nigeria (left), Mozambique (middle) and Côte d’Ivoire (right). 20
Turning to H1—on combined disadvantages—Model 2 supports the expectation that economic disadvantage on top of political exclusion decreases participation in non-violent conflict (H1a). Figure 1 shows that when we compare economic relative group deprivation scores of 0 and 2 the predicted probability of participating in demonstrations alone drops between 80 and 90%. This aligns with the proposition that political exclusion facilitates leadership, while restricted economic leverage makes leaders steer group members away from non-violent protest.
Do they turn to political violence (H1b)? According to Model 2, they do. The small and non-significant interaction term tells us that the same relationship exists between economic disadvantage and violence in politically excluded groups as in politically included groups. Remember, however, that in the bivariate probit, regression coefficients can conceal important differences between individuals who took part in violence (or demonstrations) only and those who combined violence and demonstrations. Predicted probabilities reveal that the “both” category is driving the interaction term down. Looking at violence alone, its relationship to economic disadvantage appears particularly strong among the excluded: a difference between an economic disadvantage score of 0 and 2 corresponds to a four- to seven-fold increase in the predicted probability political violence (Figure 1). To some extent this is driven by a single influential observation, but analyses excluding this respondent (Table A8 and Figure A1 in the Online Appendix) confirm that the relationship between economic disadvantage and violence does extend to politically excluded groups.
Finally, I expect political disadvantages alone to increase participation in non-violent action (H2), as motivated leaders make use of the economic leverage of their group. At first glance, Model 2 shows little support for this proposition. While the coefficient for political exclusion and non-violence in the absence of economic disadvantage has the expected positive sign, and the coefficient for violence is negative, suggesting that leaders steer members away from violence, towards demonstrations, the coefficients are small and non-significant. However, again, the people who took part in both drive regression coefficients down. In line with H2, Figure 2 shows that in the absence of economic disadvantage, the estimated probability of having taken part only in demonstrations is about 15–20% higher among the politically excluded than the politically included; and that for violence 30–40% lower. Still, future research might want to measure participation in strikes and other economic non-cooperation as well, to get at the economic leverage mechanism more directly.
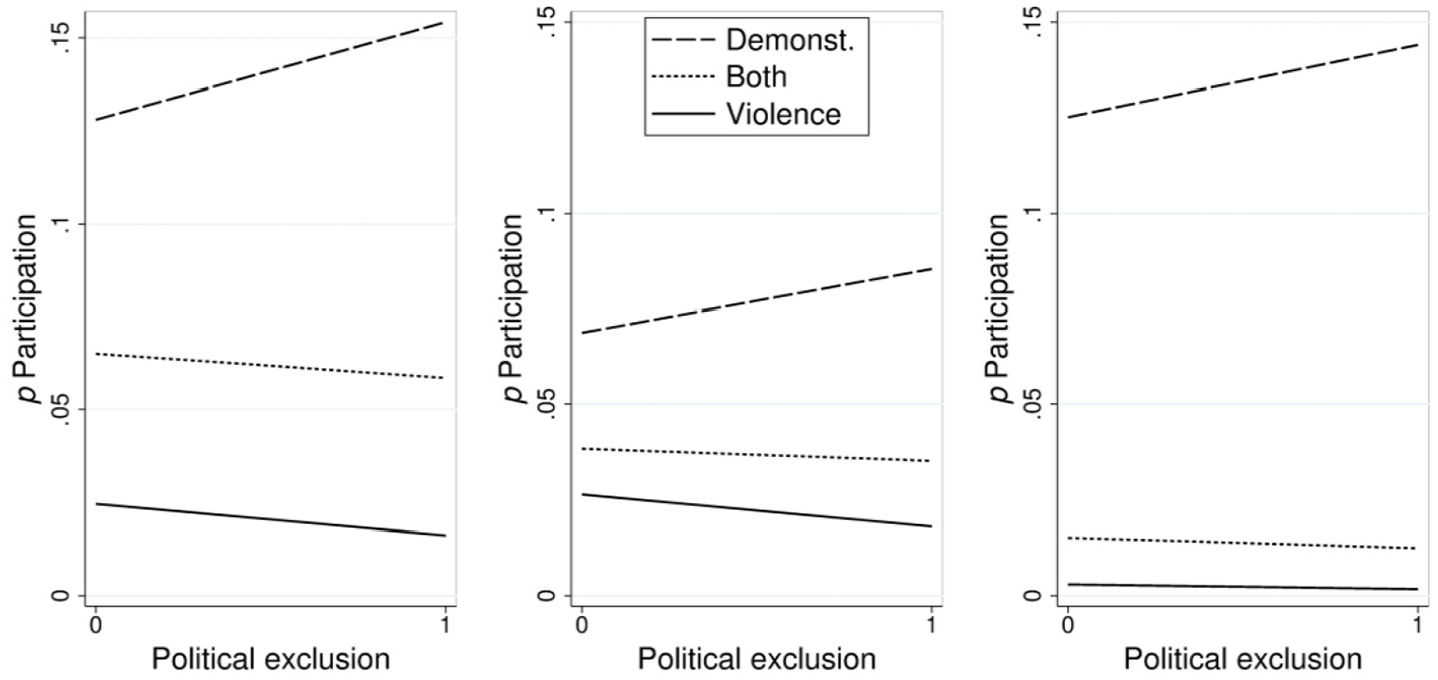
Predicted probability of participation by political exclusion, absent economic deprivation. Nigeria, Mozambique, Côte d’Ivoire.
Table 3 shows how our ability to predict participation changes when we account for group disadvantages. It confirms that economic disadvantages contribute moderately to predictions of political violence short of civil war, and that we need an interaction term for inequality to help predict demonstrations. The latter primarily holds for in-sample predictions.
Area under the receiver operating characteristic curve (AUC).
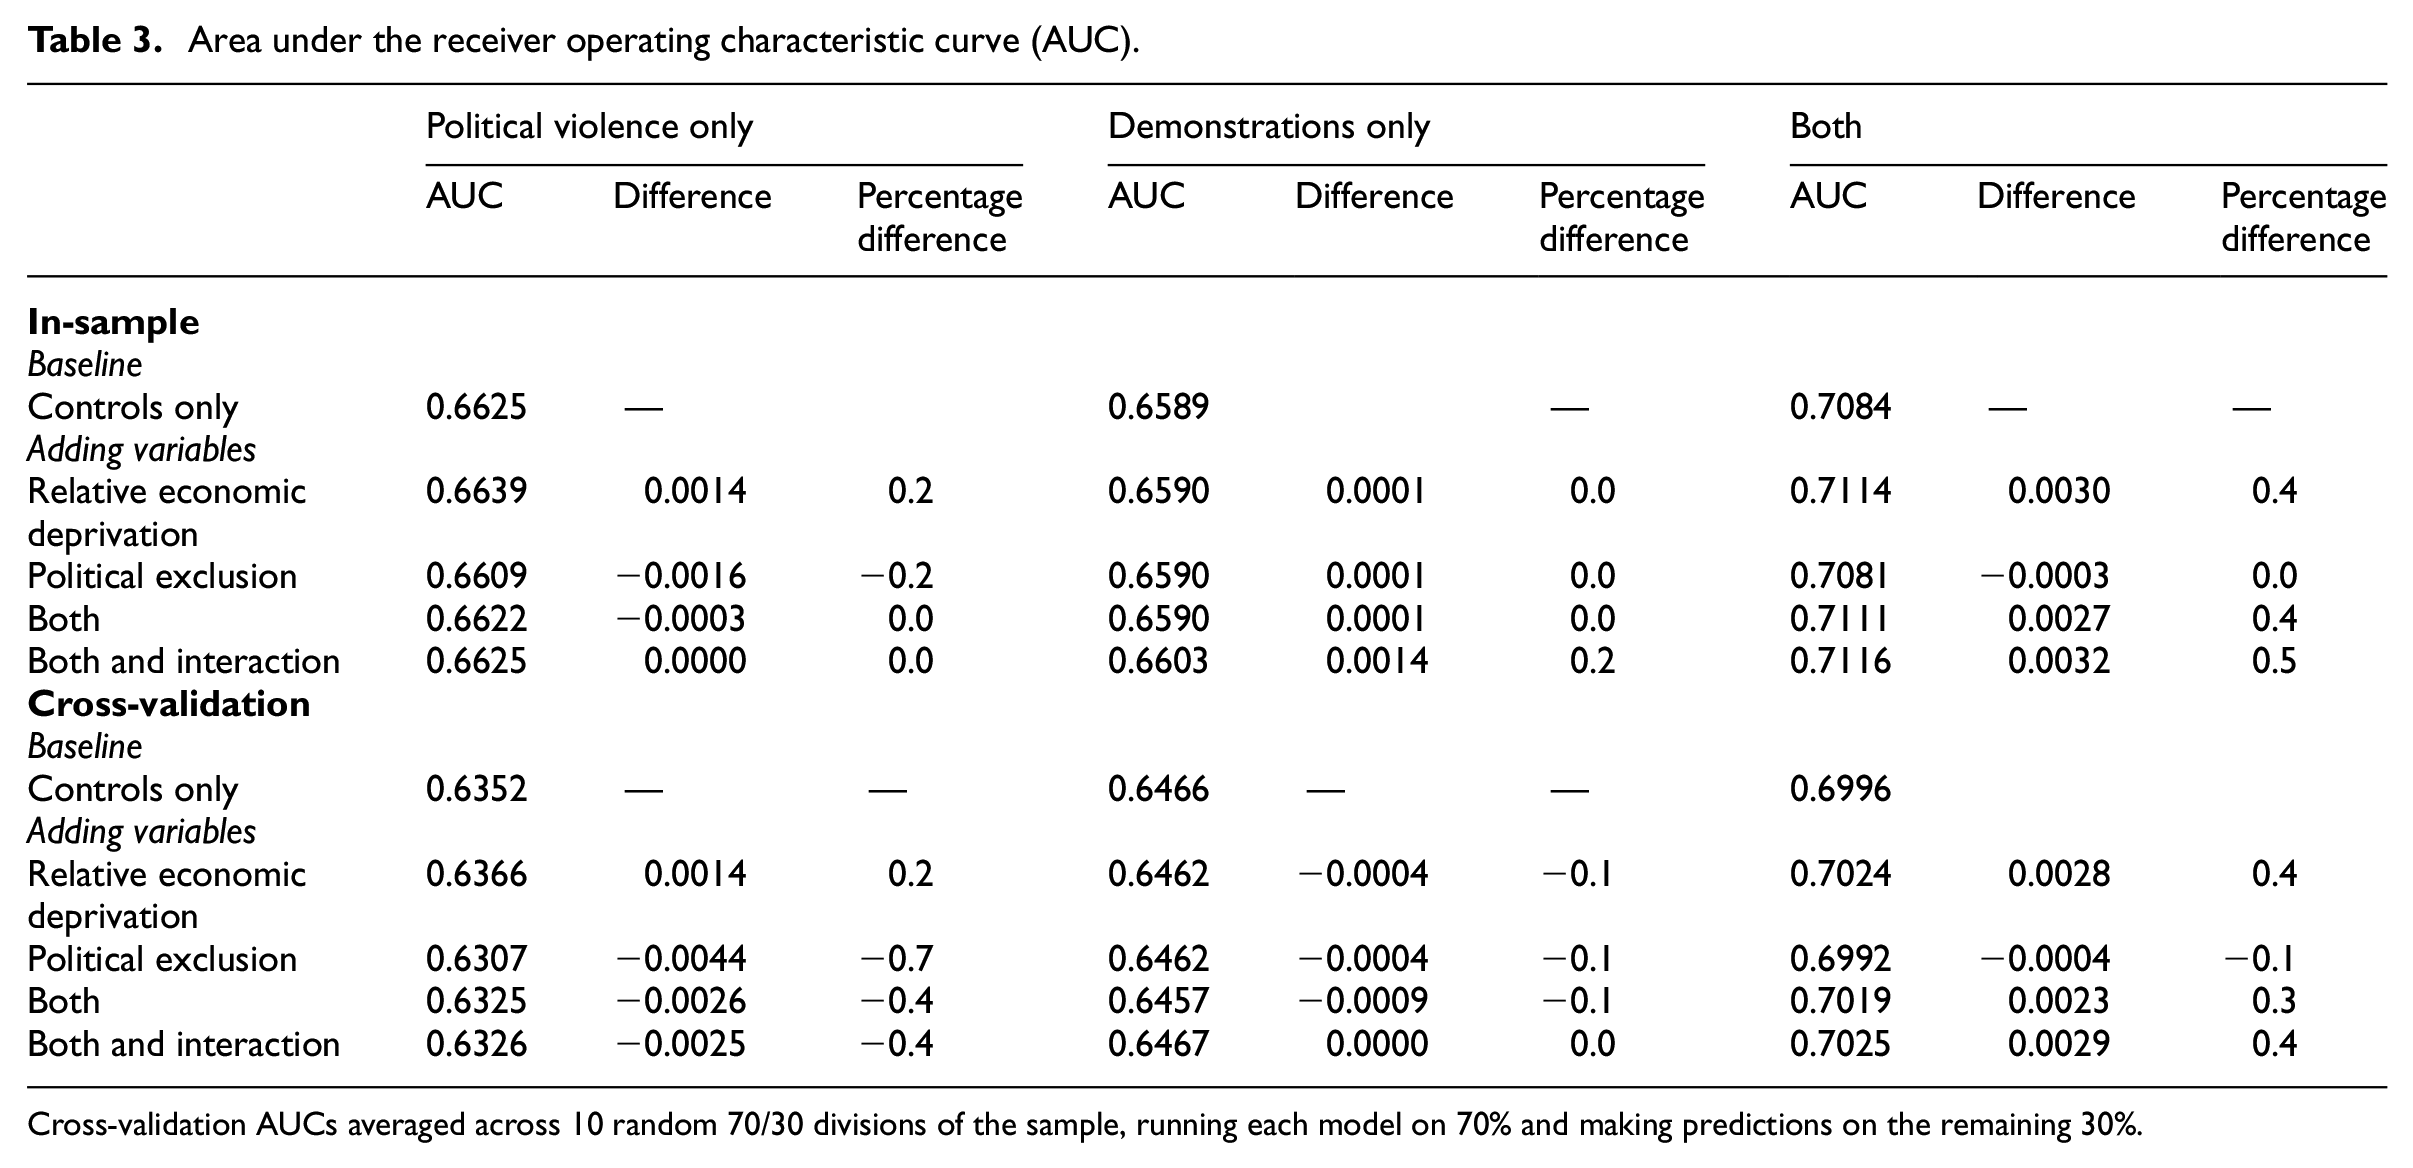
Cross-validation AUCs averaged across 10 random 70/30 divisions of the sample, running each model on 70% and making predictions on the remaining 30%.
An important challenge with survey data, especially in repressive countries, is that respondents could censor their answers if they think the interviewers were sent by the government. When I run the analysis without respondents who say this is the case, it returns stronger support for all hypotheses (Tables A10 and A11, Figure A2). Interestingly, there is clear support for the hypothesis on political exclusion and non-violent conflict (H2), which was weakly supported in the main analysis. It seems that respondents from disadvantaged groups underreport participation in both violence and demonstrations. Other analyses show that Kenya drives the relationship between economic deprivation and violence among the politically included to a disproportionate extent (Table A17). When I exclude respondents who think the government sent the interviewers, however, it is clear that the relationship exists outside Kenya as well (Figure A5).
These additional analyses raise another question: how different is the relationship between economic deprivation and conflict among the politically excluded really to that among the included? Figure 1 shows quite different patterns (top and bottom panels), but Figure A2 shows similarities: economic deprivation leads to the substitution of violence for demonstration in both included and excluded groups, although less clearly so in the former. It is possible, then, that the hypothesized difference in leadership and organization between politically included and excluded groups is overstated. Movements could draw leaders from other places than their group’s political elite. Competing elites (or others) who do not reap the benefits of political inclusion can have a motive to lead challenges of the status quo. Even in the absence of strong leadership, ordinary people may see (without their leaders telling them so) that their economically deprived group is unlikely to succeed with non-violent action, and steer away from it, towards violence. To begin to disentangle this empirically, future studies should look to distinguish between (relatively) organized violence and more spontaneous rioting.
To rule out alternative explanations, I add variables that capture individuals’ opportunity cost, which could mediate the relationship between inequality and protest (Table 4, Model 3): self-reported living conditions, education and unemployment. They all influence participation. Model 3 shows that the unemployed are more likely to take part in both forms of conflict, while the more educated choose demonstration. Interestingly, the relationship between living conditions and conflict is U-shaped, suggesting that the poor have little to lose from participation, while the rich can afford to take the cost. 21 However, the relationship between economic group disadvantage and political violence does not disappear when I control for opportunity cost. In support of horizontal inequality explanations, it is not driven primarily by individuals who are deprived in absolute, self-reported, terms, but also by others who act in solidarity with the group.
Bivariate probit regressions.
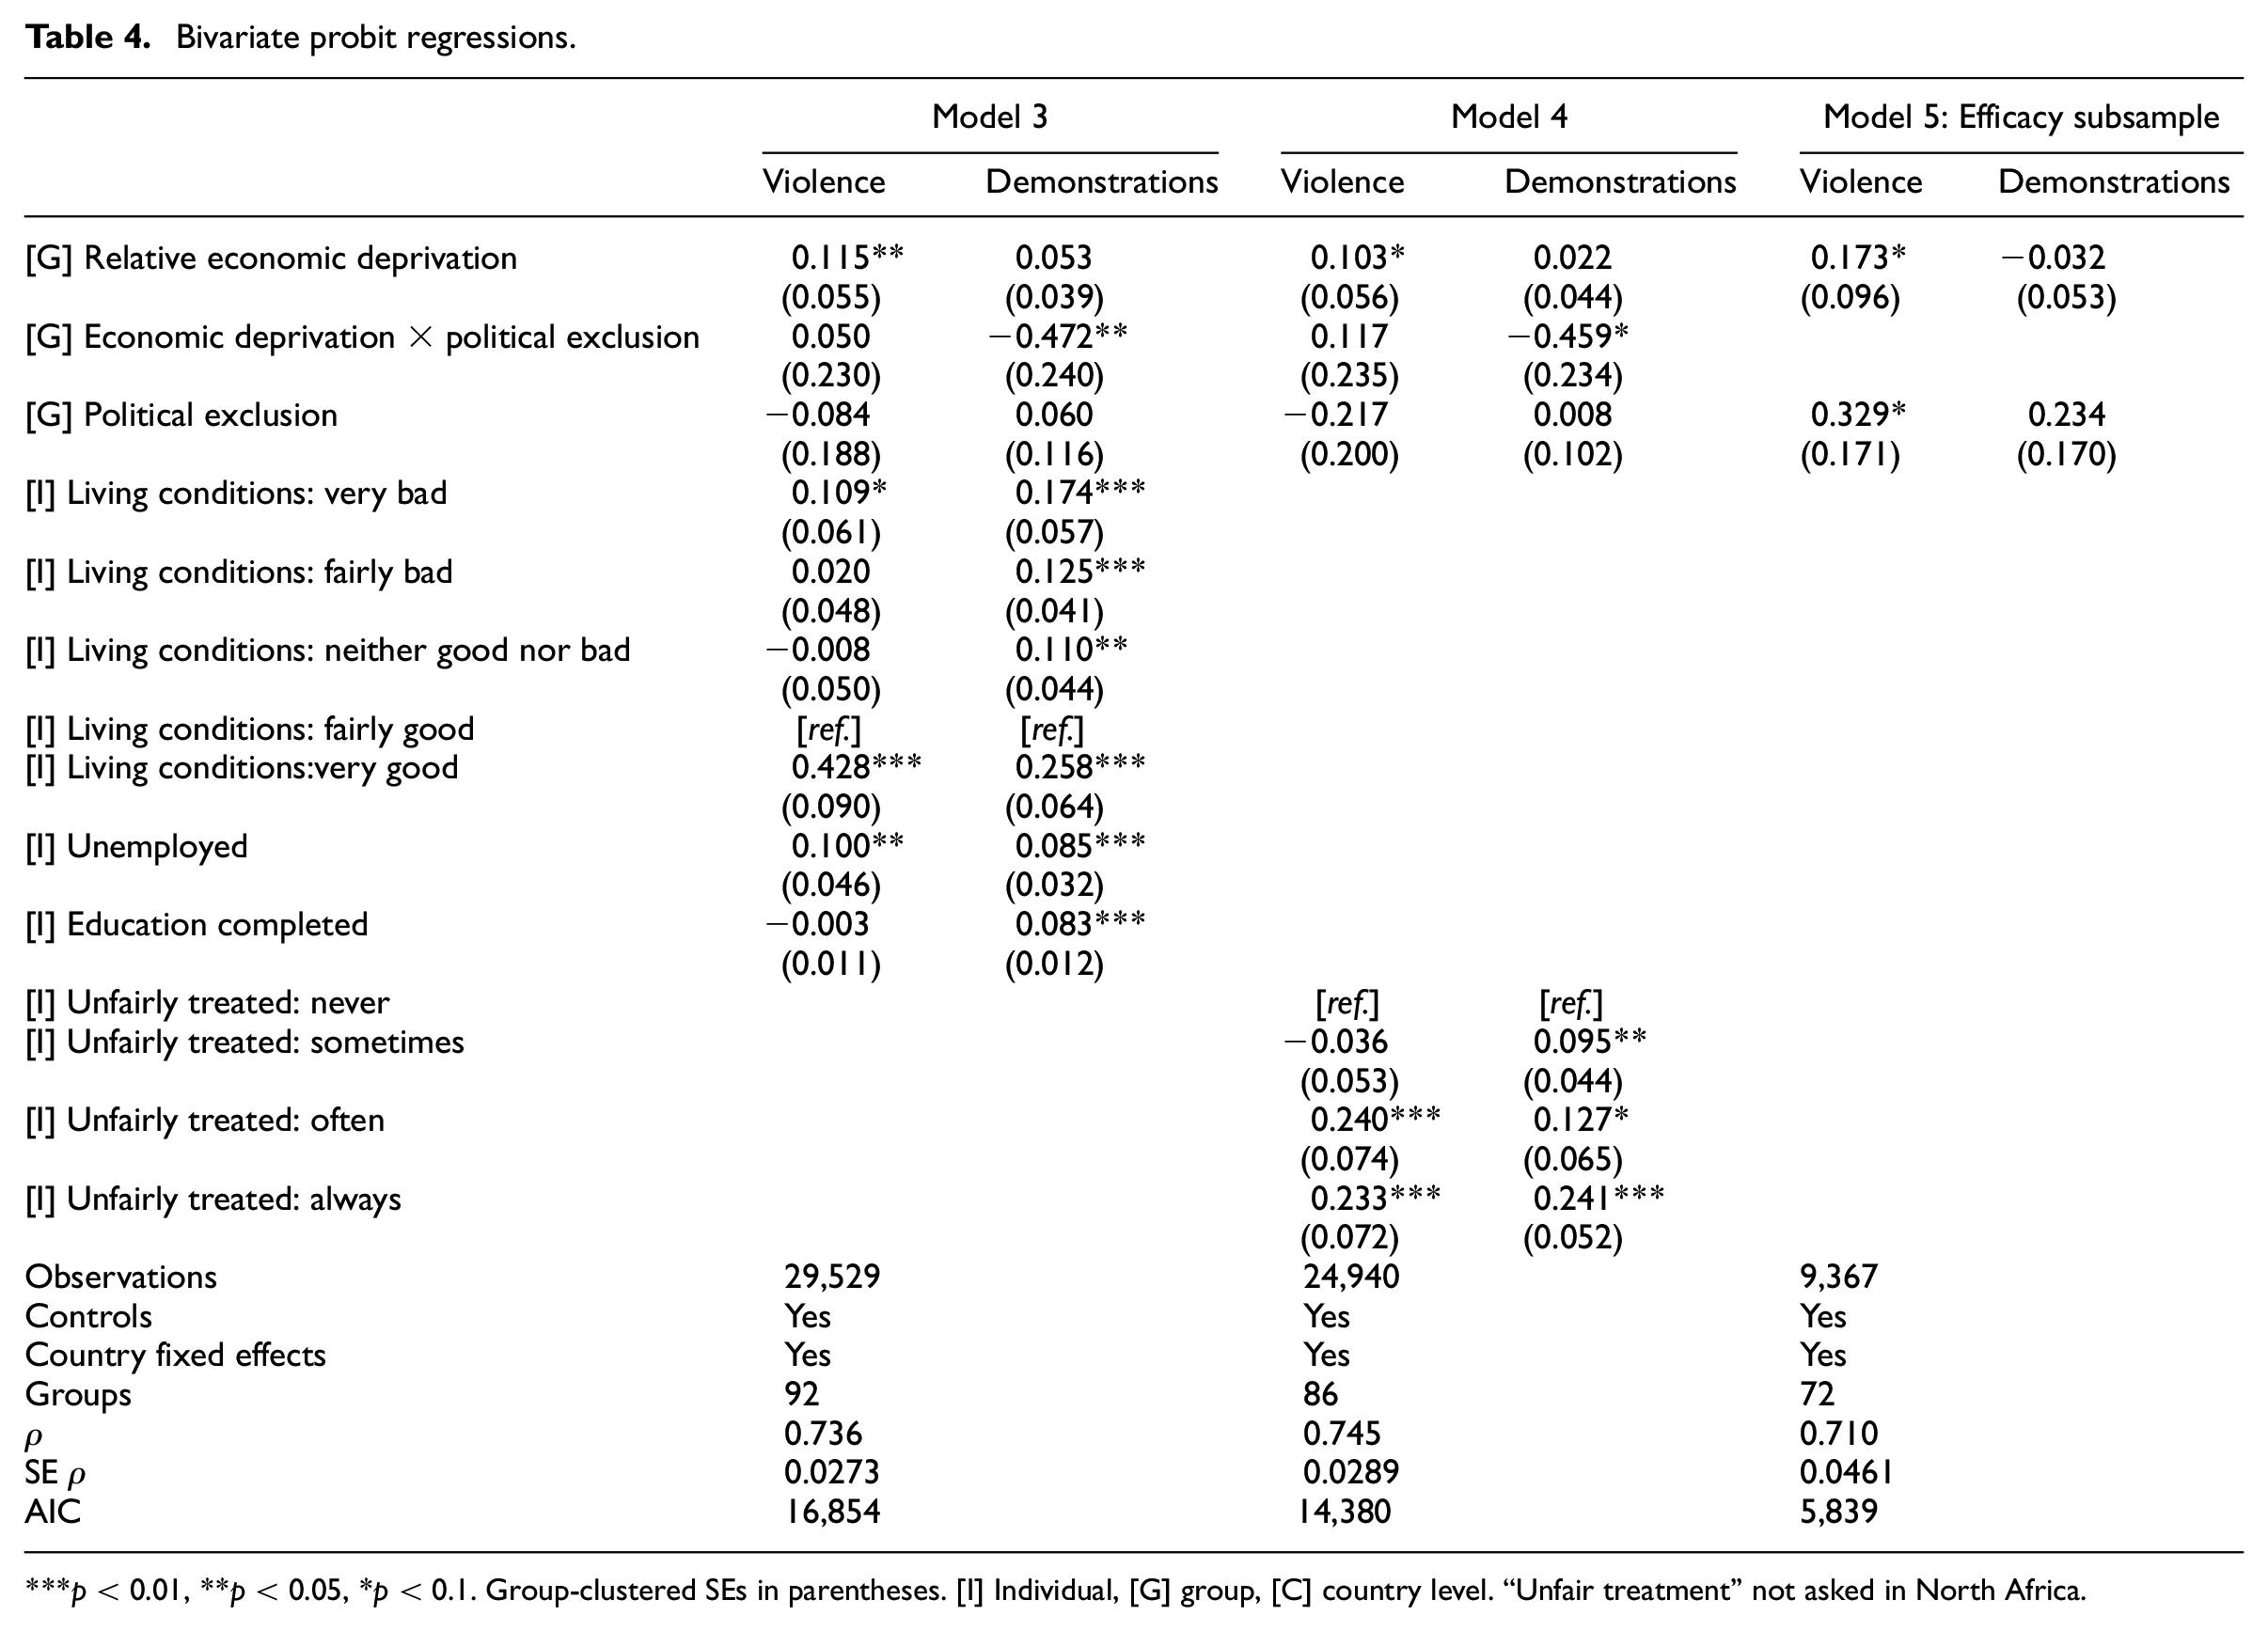
p < 0.01, **p < 0.05, *p < 0.1. Group-clustered SEs in parentheses. [I] Individual, [G] group, [C] country level. “Unfair treatment” not asked in North Africa.
Next, I restrict the analysis to the individuals who are most likely to consider non-violence a realistic option: respondents from urban areas in countries that are not extremely repressive (Model 5). 22 The relationship between economic disadvantage and political violence (not demonstrations) holds. Somewhat surprisingly, political exclusion increases participation in political violence in this subsample. The estimate for demonstrations increases too, but falls short of statistical significance. We should not read too much into this, however. There are few individuals from excluded groups in this subsample. Predicted probabilities (Figure A4) also suggest that the surprising result is driven primarily by individuals who participated in both violent and non-violent protest. As previously discussed, their motivations are hard to pin down.
A natural extension of inequality and participation analyses is to account for the grievances we expect to mediate the relationship: perceptions of unjust group disadvantage. I leave extensive investigation of this to future studies, but address it briefly with a set of dummy variables that denote how often respondents think their group is treated unfairly by the government (Model 4). Interestingly, while such grievance increases participation in both demonstrations and political violence, the effect of economic disadvantage does not seem to work through them. This is consistent with the argument that the link between objective and perceived inequality is far from automatic, but subject to misperceptions and manipulation (reviewed in Bahgat et al., 2017; Must, 2018). It could also suggest that the unfair treatment variable is conceptually unsuited for analyses of lower-level political violence. The variable is the best measure available for government-targeted grievances, because it gets at both injustice and state blame. Analyses of lower-level political violence should also account for grievances that do not target the government, however. Finally, the variable captures discontent with government policies of all kinds, not just deep structural inequalities, and unlike the theory, it does not distinguish between economic and political disadvantages.
The results hold across a range of sensitivity tests, 23 excluding groups with few respondents (Tables A6 and A7) and controlling for success in previous violent or non-violent campaigns with NAVCO data (Table A5). Excluding groups that multiple regression weights (Aronow and Samii, 2016) identify as particularly influential (Table A9) leaves the interaction in the demonstrations equation smaller and statistically non-significant, but fairly large. 24 Missing value analyses for the economic disadvantage variable, which has most missing information, show no statistically significant difference in participation between respondents missing this information and other respondents (Table A12).
To reduce social desirability bias, I include in the dependent variable all respondents who say that they would take part in demonstrations or violence “if they had the chance”. This lets me measure motivation to participate (Table A14). I find no relationship between relative deprivation and violence with this variable. Economic disadvantage increases the probability of actual participation, but not the probability that people who did not take part say they would have if they had the chance. This suggests that people whose group disadvantage motivated them to use violence tended to act on this motivation.
Illustrations
Anecdotal case evidence illustrates the results and some limitations. In Côte d’Ivoire, Northerners (Northern Mandé and Voltaic) have a long history of economic and political deprivation (Langer, 2005). In the years leading up to the 2013 Afrobarometer survey (after the 2010 election violence), however, the group was economically disadvantaged but included in government. In the survey, Northerners reported similar levels of demonstrations (15%) to the non-deprived Akan (14%, excluding the Baule), while their participation in political violence (3.1%) stood above the country average (2.0%). This is consistent with the finding that economic disadvantages lead to lower-level violence among members of included groups (H1).
In the same period, the Kru group was both economically and politically disadvantaged. Its members reported lower participation in demonstrations (11%) and violence (0.9%). Fewer demonstrations are expected (H2.1), as leaders discourage non-violent action when economic leverage is limited. Less lower-level violence could be consistent with the theory if it was accompanied by the kind of organized, covert violence that representative surveys are unlikely to capture. However, there is nothing to suggest the Kru have been engaged in organized violence against the state after their former leader Laurent Gbagbo lost the presidency and was arrested in 2011. There could be several reasons for this mismatch. The theory is not deterministic. And while the Kru fall below the national average in pure economic terms, they do better than the Northerners (and other groups) in education (Langer, 2005: 38). Future research should explore which mechanisms win out when different dimensions of socioeconomic inequality pull in different directions.
Mozambique’s civil war (1977–1992) is best known for its ideological and geopolitical dimensions, but ethnicity and region were important too. The Renamo rebels, whose main support base was among the Shona-Ndau in the center region, were able to capitalize on the region’s relative underdevelopment and political domination by the south (Manning, 2002; Stewart, 2005), where the Frelimo party, in power since independence in 1975, has its main support base among the Tsonga–Chopi.
Horizontal inequalities persist in post-war Mozambique. Expenditures and infrastructural benefits have consistently favored the south, at the expense of the center region (Stewart, 2005). The demography ensures that the current political system, where a directly elected president appoints the cabinet, will be dominated by Frelimo as long as people keep voting along ethnic and regional lines (Stewart, 2005). Within the Frelimo government, Tsonga–Chopi southerners still dominate, and the Makonde–Yao from the north hold important positions. The Shona–Ndau, on the other hand, mainly vote for the Renamo party. In a highly centralized and binarized system dominated by Frelimo, this leaves them practically powerless as well as economically disadvantaged (EPR, 2018).
Because the Shona–Ndau are both economically deprived and politically excluded, the theory predicts their leaders’ evaluation of limited economic leverage will make them steer people away from demonstrations, towards relatively organized violence. Low participation in demonstrations and heightened violence both show up in the Mozambique survey data. In 2012, the Shona–Ndau reported resorting to violence (6.0%) more often than the Tsonga–Chopi (2.6%), and to demonstrations (7.7%) to a lesser extent than the Makonde–Yao (9.0%). The next year, Mozambique saw a return to civil conflict as Renamo took to arms to demand a new electoral law (UCDP, 2018). The case suggests that organized violence, such as a build-up to civil conflict, can be captured in survey data. It is also possible that the reported violence was unorganized, however, but that the discontent it signaled was picked up by organized rebels the following year. 25
Discussion and conclusions
Do people from disadvantaged ethnic groups favor political violence or non-violent resistance? This article shows that economic group disadvantage increases individuals’ participation in political violence short of civil war, but not in demonstrations. People steer most actively away from demonstrations when their group’s economic disadvantage is accompanied by political exclusion. The evidence for political disadvantages alone is not conclusive, but suggests increased participation in demonstrations.
The article’s overarching finding that horizontal inequality matters for conflict aligns with a burgeoning horizontal inequality literature. It looks beyond civil war and drills beyond the macro level, however, to get at individual-level participation in lower-level violence and non-violent protest. In particular, it expands on Cederman and colleagues’ finding that the combination of economic and political disadvantage is a particularly potent facilitator of civil war (Cederman et al., 2013), to show that this extends to political violence short of war, and that constellations of inequality (economic disadvantage alone, political disadvantage alone and their combination) matter for strategic choices more broadly, such as the choice between violent and non-violent tactics.
The analysis captures differences in groups’ opportunity structure, in the form of leadership and economic leverage, because it distinguishes between forms and constellations of disadvantage. The opportunity structure determines what kind of conflict groups can expect to succeed with, and what tactics their leaders encourage group members to use. To explain ethnic conflict in its various manifestations, we need more analyses that make this distinction, and analyses that span the individual and group level. They help us understand how group disadvantages motivate individuals to challenge the status quo, but also how the forms of action they use are conditioned by groups’ opportunity structure, and their leaders’ evaluation of it. By linking inequality to participation, and accounting for non-violent as well as violent contentious action, this article moves beyond extant micro-level studies of perceived inequality and support for violence (e.g. Hillesund, 2015; Rustad, 2016).
Given the conservative nature of the test, the empirical evidence is strong. Several design features serve to bias the estimated effects down. First, because the analyses use country fixed effects, the results are driven by within-country variation. Second, it takes only a few dedicated individuals to initiate and sustain a violent movement. Participation rates affect the chance of success, but most protest events involve only a fraction of a country’s total population. As a result, the relationship between inequality and protest is difficult to discern on the individual level, and we need larger country samples than the Afrobarometer can offer to establish a relationship with certainty. The flip side is that even weak correlations between inequality and participation can have large real-world implications. Third, the most remote and violent parts of the African continent are less likely to be surveyed in Afrobarometer, and groups that face both severe economic disadvantage and political exclusion seem to be underrepresented.
One set of assumptions merits further testing. If it is correct that included groups lack movement leadership, and ordinary group members tend not to see their group’s opportunity structure unless their leaders show it to them, then why does participation in non-violent conflict—the least costly tactic for the individual—not increase with economic disadvantage in included groups? Is the assumption that included groups lack leadership wrong, do ordinary people notice opportunity structures even if they don’t have leaders to point them out, or is aggression the default response to anger in the absence of leaders who encourage non-violence? Future studies should disentangle and test these mechanism, and their implications for theory and policy. This includes investigating whether groups with exclusively economic disadvantages use less organized violence than groups with combined disadvantages, as the theory implies.
An important implication of the findings is that policies that aim to curtail the use of violence by improving the economic situation of disadvantaged groups need not come with the less desirable side effect of curtailing peaceful protest. Instead, they could increase such peaceful efforts among politically excluded groups as their economic leverage grows. An interesting extension of the theory, in line with Tilly (1998: 225), is that such increases in leverage over time should be particularly potent for large-scale non-violent mobilization. Changes over time thus provide a promising avenue for future studies of constellations of inequality and conflict.
Future surveys on conflict participation should aim to capture more respondents from the most disadvantaged and peripheral groups—especially the politically excluded—to reduce estimation uncertainty, and investigate further how regime type and repression condition individual participation. More generally, conflict surveys should include questions that tie participation to specific events, or ask respondents about the magnitude of the movement and its experience with repression just before they joined it, to get at expectations that vary over movements’ life span. Finally, the article’s brief investigation of perceived grievances and opportunity cost points to a largely untapped potential for studies that compare group-level disadvantages with conflict determinants that vary within the ethnic group, to get at their relative significance.
Supplemental Material
sj-pdf-2-cmp-10.1177_07388942211017881 – Supplemental material for To fight or demonstrate? Micro foundations of inequality and conflict
Supplemental material, sj-pdf-2-cmp-10.1177_07388942211017881 for To fight or demonstrate? Micro foundations of inequality and conflict by Solveig Hillesund in Conflict Management and Peace Science
Research Data
sj-zip-1-cmp-10.1177_07388942211017881 – for To fight or demonstrate? Micro foundations of inequality and conflict
sj-zip-1-cmp-10.1177_07388942211017881 for To fight or demonstrate? Micro foundations of inequality and conflict by Solveig Hillesund in Conflict Management and Peace Science
Footnotes
Acknowledgements
I would like to thank Scott Gates and Håvard M. Nygård for valuable discussions, and Nils-Christian Bormann for providing the list matching the languages in Afrobarometer Rounds 1–4 to EPR groups.
Funding
The author received no financial support for the research, authorship, and/or publication of this article.
Supplementary material
Notes
References
Supplementary Material
Please find the following supplemental material available below.
For Open Access articles published under a Creative Commons License, all supplemental material carries the same license as the article it is associated with.
For non-Open Access articles published, all supplemental material carries a non-exclusive license, and permission requests for re-use of supplemental material or any part of supplemental material shall be sent directly to the copyright owner as specified in the copyright notice associated with the article.