
Abstract
Sharing the same philosophy of “relations matter” with computer-supported collaborative learning (CSCL), social network analysis (SNA) has become a common methodology in the CSCL research. In this research, I use SNA methods from relational ties, network modes, and integrated methods perspectives to understand attributes of relations in CSCL. I design, conduct, and evaluate three SNA analytics on the same dataset from an online course to understand CSCL entities, relations, and processes. This online collaborative discussion in this course stresses students’ knowledge inquiry, construction, and building through peer interactions. Results show that compared to traditional SNA methods, these three SNA approaches can reveal more detailed, richer picture of the collaborative learning processes, particularly, the interactional, multi-modal, and temporal aspects. Moreover, these SNA approaches are generalizable for understanding similar CSCL settings. Based on the results, this research proposes methodological implications to further apply and develop SNA in the CSCL field.
Keywords
Learning is a socio-cognitive process completed by learners in social contexts, supported by purposeful instructions and technologies, and formed through emergent interactions and dialogues (Brown et al., 1989). Such attributes of learning especially manifest during computer-supported collaborative learning (CSCL), where learners interact and collaborate to achieve shared goals with instructional and technological supports (O’Donnell & Hmelo-Silver, 2013). For example, in online or blended learning, instructors adopt CSCL, such as knowledge building, as a pedagogy to improve students’ peer interactions, knowledge constructions, and problem-solving quality (Scardamalia & Bereiter, 2014). During the process, students share, construct, and build knowledge with peers through social interaction, communication, and collaboration (van Aalst, 2009). Diverse types of “actors” are involved in, such as learners, technologies, and activities; relations are built between these “actors”, which have critical influences on CSCL processes. Therefore, an underlying philosophy of CSCL is “relations matter” (Dado & Bodemer, 2017; Saqr et al., 2020; Wu & Nian, 2021). To understand CSCL, it is necessary to analyze characteristics of CSCL entities, the relations between them, and the mediating effect of these relations on CSCL processes and outcomes.
Social network analysis (SNA) is a widely-used research method to analyze attributes of entities, relations between entities, and influences of relations in the CSCL research (Cohen et al., 2013). SNA research in CSCL usually fall into two categories namely, exploratory analysis and inferential analysis (Sweet, 2017). Here, in this research, I particularly focus on the use of SNA under the exploratory analysis category to understand and describe CSCL from three main perspectives: relational ties, network modes, and integrated methods. First, SNA node-level and network-level metrics—grounded upon the measurements of relational ties—is a main SNA method used to understand attributes of entities and groups (e.g., Ouyang & Scharber, 2017; Saqr et al., 2020). Since relational ties can be built and measured through varied ways, it is necessary to explicitly elaborate definitions and measurements of relational ties (Ouyang & Scharber, 2017; Saqr et al., 2020; Wise & Cui, 2018). Second, two-mode and multi-mode network analyses are used to examine relations between entities, and mediating effects of these relations (e.g., Gao et al., 2017; Hecking et al., 2014; Malzahn et al., 2005). Most SNA research primarily focuses on one-mode network analysis of human (e.g., communication-based interactions between students), which may miss the diversity of CSCL entities during collaborative learning (Dado & Bodemer, 2017). Third, SNA is usually combined with other research methods (e.g., content analysis, sequential analysis) to understand social and cognitive aspects of learning (e.g., Ouyang & Chang, 2019; Wu & Nian, 2021). Recent research has promoted the uncovering of the process-oriented, temporal nature, which is an important dimension of CSCL processes (Kapur, 2011). In summary, SNA is used in CSCL research from multiple perspectives to analyze attributes of relations, such as relations between entities, mediating effects of relations, or influences of relations on learning (Cress & Hesse, 2013; Saqr et al., 2020; Wise & Schwarz, 2017).
Main returning questions reflect within the CSCL community include: How can social learning analytics methods be used to understand interaction and participation? How to unpack the complexity of collaborative learning and instruction processes that involved diverse entities and relations? Do current analyses, technologies, and their deployment align well with collaborative learning processes (Kay & Luckin, 2018; Lund et al., 2019; Smith et al., 2017)? The primary purpose of this research is to raise awareness of the consequences that different SNA methods may have on CSCL research and emphasize the importance of transparency in the choice of SNA methods in CSCL research. Particularly, I first propose three SNA approaches to understand CSCL in terms of relevant literature, then empirically use these SNA methods to investigate CSCL, and finally evaluate the use of the three SNA approaches for understanding CSCL. Based on the results, I propose methodological implications to further develop SNA in the CSCL field.
Literature Review
Basic SNA Concepts: Nodes, Ties, and Network Types
A social network is represented in graphics with entities as nodes, and connections between two entities as ties, with(out) weights and directions (Cohen et al., 2013). From a conceptual perspective, a node is any entity involved in CSCL processes: human (e.g., instructors, students, groups) and non-human (e.g., ideas, artifacts). From a methodological perspective, a node can also represent a type of online learning behavior (e.g., a content analysis code that represents a knowledge building behavior).
A tie is the link between two entities in a network, which has its own weights and directions. A tie can connect the same type of entity (e.g., a tie between learners indicates a learner interacts with the other one) or different types of entities (e.g., a tie between a learner and an activity indicates that the learner participates in the activity). A tie can also link two non-human entities. For example, a tie between two concepts can represent semantic relations between two concepts; a tie links two code categories can represent the sequential relation between them. A tie has its own weight (also called strength), which needs to be defined in terms of the nature of research contexts. For example, in an interaction network, tie weight can represent the number of people a participant interacts with or the interaction frequency a participant initiates to others. A tie also has directions: when the network data can flow between entities, the network is a directional network; otherwise, it is a non-directional network.
Based on the types of entities involved in, a network can be categorized into three types: one-mode, two-mode, and multi-mode network. A one-mode network involves only one type of entity, such as people (e.g., a student interaction network), or information (e.g., a reference citation network). A two-mode network (also called a bipartite or an affiliation network) involves two types of entities, and ties exist only between nodes belonging to different entity sets (e.g., a student-resource network or a student-topic network) (Borgatti & Everett, 1997; Opsahl, 2013). A multi-mode network involves more than two different types of entities, ties exist between nodes belonging to different sets. For example, a three-mode student-topic-knowledge network includes three types of data: student, discussion topic, knowledge term; ties exist between two different sets: student-topic, topic-knowledge, and student-knowledge.
Taking collaborative online discussions for example, a one-mode student-student interaction network shows how a student interacts with others with different frequencies (see Figure 1a). A two-mode student-topic participation network shows how frequently students participate in discussion topics (see Figure 1b). By adding concept or knowledge networks into this two-mode network, a multi-mode student-topic-knowledge (or concept) network is formed (see Figure 1c). A “concept map” demonstrates hierarchical relationships between concepts in a domain from an ontology perspective, while a “knowledge map” represents more flexible relationships between knowledge or information of specific topics.
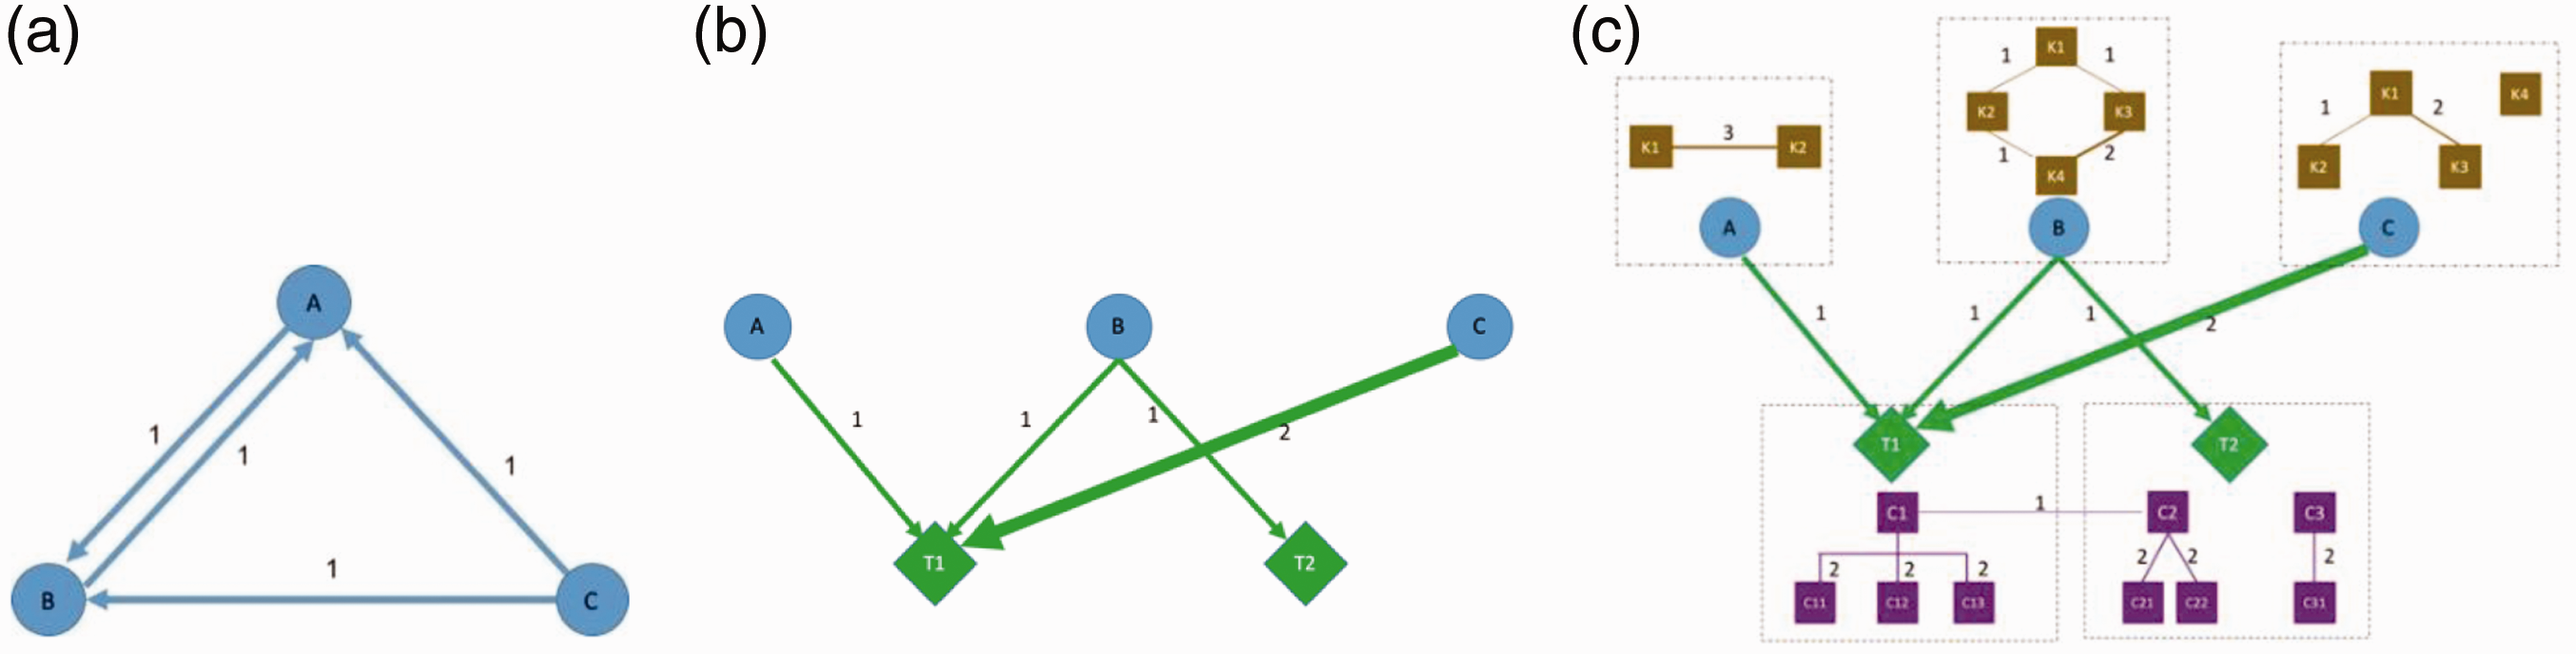
(a) a one-mode student-student interaction network: nodes in blue circles represent students, ties represent replies, and tie weights represent interaction frequency; (b) a two-mode student-topic participation network, where nodes in blue circles represent students, nodes in green diamonds represent topics, ties represent students’ participation in topics, and tie weights represent participation frequency; (c) a multi-mode learner-topic-knowledge network, formed by adding concept maps and knowledge maps to the two-mode network. Brown squares represent knowledge domains, ties represent relations between two domains, and tie weights represent strength of the relation. Purple squares represent concepts involved in topics, ties represent hierarchical relations between two concepts, and tie weight represents strength of relations.
Basic Rationale of Using SNA in CSCL
The basic rationale for using SNA in CSCL is threefold: relational ties, network modes, and integrated methods. First, grounded upon measurements of relational ties, SNA node-level and network-level metrics have been used to demonstrate attributes of CSCL entities and groups formed through CSCL processes. For example, basic SNA node-level metrics, namely outdegree, indegree, betweenness, and closeness, are used to reflect CSCL entities’ engagement or involvement levels in a network (Ouyang et al., 2020; Saqr et al., 2020). Basic SNA network-level metrics, such as average degree, density, average path length, reciprocity, centralization, connectedness, are used to describe the attributes of groups (see Ouyang & Scharber, 2017). Both node-level and network-level metrics are grounded upon the ways relational ties are built and attributes the relation ties have during CSCL processes. For example, degree represents the number of relational ties pointing to or away from a node; average path length is the average number of steps along the shortest paths, comprised of multiple relational ties. In summary, SNA metrics reflect how an entity (e.g., student, activity, resource) is involved and what attributes the groups develop during CSCL processes.
Moreover, two-mode and multi-mode network analyses can help understand relations between CSCL entities and mediating effect of the relations on CSCL (Cela et al., 2015; Cress & Hesse, 2013; Dado & Bodemer, 2017). For example, a two-mode student-topic network can represent students’ participatory relations within topics; it can be projected into one-mode student-student network based on students’ co-participation behaviors in the same topics. The relations between a student and a topic are therefore transferred to relations between students by the mediating effect of co-participation behaviors. Similarly, multi-mode network analyses, such as three-mode networks can also be first projected into a two-mode network based on the relations between two entities, and then analyzed by using two-mode network analysis approach abovementioned. In summary, two-mode and multi-mode network analyses can reveal relations between CSCL entities and their mediating effect on collaborative learning, which are unlikely to be captured by one-mode network analysis methods.
Finally, in contrast to merely demonstrating social relations, SNA is usually combined with other research methods to capture more characteristics of CSCL, such as social, cognitive, temporal aspects. For example, SNA is combined with content analysis and statistical analysis to investigate students’ interaction, participation, and cognitive quality (e.g., Wise & Cui, 2018), the relationships between social participatory roles and cognitive engagement (e.g., Ouyang & Chang, 2019), and influences of social relationships on knowledge construction (e.g., Kellogg et al., 2014). Furthermore, SNA approaches are used to visually demonstrate CSCL, including student social-cognitive engagement changes (e.g., Ouyang & Chang, 2019), co-occurrence of codes that represent collaborative learning (e.g., Zhu & Todd, 2019), and relations of epistemic or semantic objects (e.g., Shaffer et al., 2016). Therefore, integrated methods can reveal a richer, more detailed picture of CSCL that SNA method alone is unlikely to achieve. In summary, SNA methods are primarily used to understand CSCL from relational ties, network modes, and integrated methods perspectives: (a) analyzing characteristics of CSCL entities and groups formed during CSCL, (b) investigating mediating effects that relations have on CSCL, and (c) integrating SNA with other methods to understand varied aspects of CSCL.
Using Three SNA Approaches to Understand CSCL
From Relational Ties Perspective
Because the definition of relational ties plays an important role in the analytical results (Fincham et al., 2018), it is necessary to explicitly elaborate what constitutes a relational tie, why choose a particular measurement, and what consequences that has on the CSCL research. Although it is impossible to simply establish ties without defining what the ties are, most SNA research ignores to explicitly elaborate definitions and measurements of relational ties, which carry different assumptions about the nature of the relations and have critical influences on research results (Chiu et al., 2014; Ouyang & Scharber, 2017; Wise & Cui, 2018). From a conceptual perspective, the ways of defining a tie between two entities imply specific nature of the relations between them. For example, a tie between learners can represent different relations between them: a learner’s direct replies or comments to other learners (e.g., Ouyang & Scharber, 2017), a learner’s potential interactions with others by participating in the same discussion (e.g., Jiang et al., 2014), or a combination of direct reply to others and indirect reply within a discussion thread (e.g., Wise & Cui, 2018). From an analytical perspective, SNA measurement principles of relational ties significantly influence SNA results. There are three measurement principles of relational ties: (1) Freeman’s (1978) binary network measurement, that only considers the effect of number of ties and ignores the weights of ties; (2) Newman’s (2001) measurement for weighted networks that only consider the effect of tie weights; and (3) Opsahl’s measurement that considers both the effect of number of ties and tie weights and offers flexibility to set tuning parameter in terms of the relative importance (Opsahl, 2009).
Taken together, definitions of relational ties and measurements chosen to analyze relational ties should be explicitly described, which may result in different SNA node-level and network-level results (Chiu et al., 2014; Fincham et al., 2018; Ouyang & Scharber, 2017). For example, if a collaborative learning research emphasizes the equally-distributed attribute, the SNA measurement should consider the presence of many connections with any interaction frequency is more important than the interaction frequency. In contrast, if an investigation emphasizes learners’ reciprocity, researchers may consider interaction frequency between two learners as more important than the number of peers a learner interacted with. If an investigation focuses on collaborative learning community that emphasizes both the number of participants and the interaction frequency between participants, the measurement that set equal value to both factors is more appropriate, such as Opsahl’s measurement of the value 0.5 (e.g., Ouyang & Scharber, 2017).
However, definitions, strengths, and measurements of relational ties that have critical influences on CSCL but many studies simply establish ties without considering what measurements are appropriate for calculating and explaining relational ties (Fincham et al., 2018; Ouyang & Scharber, 2017; Saqr et al., 2020). Recently, there is a research trend to specifically investigate how definitions and measurements of relational ties influence CSCL results. For example, Wise and Cui (2018) examined how tie definition influenced the resultant network structures and properties; their results showed robust differences of network properties by using different tie definitions. Fincham et al. (2018) used different social tie extraction methods and examined the influences on the structural and statistical properties of the networks; the results confirmed that social tie definitions play an important role in shaping the results. Saqr et al. (2020) examined how different network configurations influence the reproducibility and robustness of centrality measures as indicators of CSCL learning. Therefore, researchers should be aware that relational ties can be built in varied ways, and the choices of measurements can influence results.
From Network Modes Perspective
SNA methods can be used from the network modes perspective to understand relations between CSCL entities and mediating effect of these relations on CSCL. While most SNA research focuses on one-mode network analysis of human entities (e.g., participants’ communication-based interactions) (Cela et al., 2015), two-mode and multi-mode network analyses can better reveal relations between multiple types of entities, as well as mediating effects of relations on collaborative learning. Recently, there is an ongoing trend to analyze two-mode networks with a goal to gain a fuller picture of relations between students and activities or resources. For example, Hecking et al. (2014) analyzed student-resource networks to investigate patterns of learners’ resource usage in online courses. Rodríguez et al. (2011) proposed a two-mode learner-topic network models that used blockmodeling and m-slices techniques to analyze structural patterns of students’ interest on learning topics. Casquero et al. (2016) proposed a new integrated SNA method that combined two-mode network analysis with clustered graph methods to show variation of students’ network composition and structure.
However, although other fields use multi-mode network analysis (e.g., Gao et al., 2017), few CSCL studies used multi-mode network analysis methods to understand collaboration, which can be beneficial to reveal more details of the relations between varied types of CSCL entities. Only a few three-mode network analysis studies conducted by the same research team were located. Malzahn et al. (2005) proposed a network analysis algorithm to analyze how two-mode participant-topic networks were mediated by a third ontology-based semantic network; this three-mode network analysis connected two participants who had no explicit relations in terms of their potential common interests mediated by the ontology network. Using Malzahn et al.’s (2005) algorithm, Harrer et al. (2007) demonstrated additional links of interests between two teams in a scientific community mediated by the knowledge maps. Harrer et al. (2009) further proposed a schema for multi-mode network transformations and presented a multi-mode network visualization to show temporal changes. In summary, since CSCL usually involves diverse types of entities and relations can develop in various ways, it is necessary to further use multi-mode network analyses to capture relations between entities and the mediating effects (Cela et al., 2015; Dado & Bodemer, 2017; Ouyang & Scharber, 2017).
From Integrated Methods Perspective
SNA methods can be used from the integrated methods perspective by integrating SNA approaches with traditional methods to reveal temporal, transitional aspect of CSCL. Because collaborative learning is constituted through progressive dialogues over time (Chen et al., 2017), it is critical to investigate process-oriented aspects of CSCL (Kapur, 2011). To unpack the trajectory of collaborative knowledge building, it is necessary to examine temporal, sequential relations between social and cognitive dimensions of students’ knowledge advancement (e.g., Csanadi et al., 2018). However, previous studies usually quantified students’ social and cognitive engagement in a summative, aggregated fashion (e.g., Kellogg et al., 2014; Ouyang & Chang, 2019; Tawfik et al., 2017). Therefore, these studies fall short in uncovering process-oriented, temporal aspects of CSCL processes.
An integrated method—combining content analysis (CA), sequential analysis (SA), and SNA approaches—can better capture temporality of collaborative learning processes. Proved by previous empirical studies (Chen et al., 2017; Csanadi et al., 2018; Ouyang & Chang, 2019), SNA visualized representations can be used to demonstrate traditional, quantifiable CA and SA results to provide temporality insights into social-cognitive aspects of CSCL. For example, in contrast to statistical or aggregated ways of data representation, SNA’s visualization attributes can be used to represent the sequences of students’ online learning behaviors and the strength of the relations between different learning behaviors. Therefore, integrated methods of CA, SA, and SNA approaches have potentials to better demonstrate temporality of CSCL processes that are often overshadowed by quantifiable, summative fashion of data analytics and representations.
Research Question, Context, and Dataset
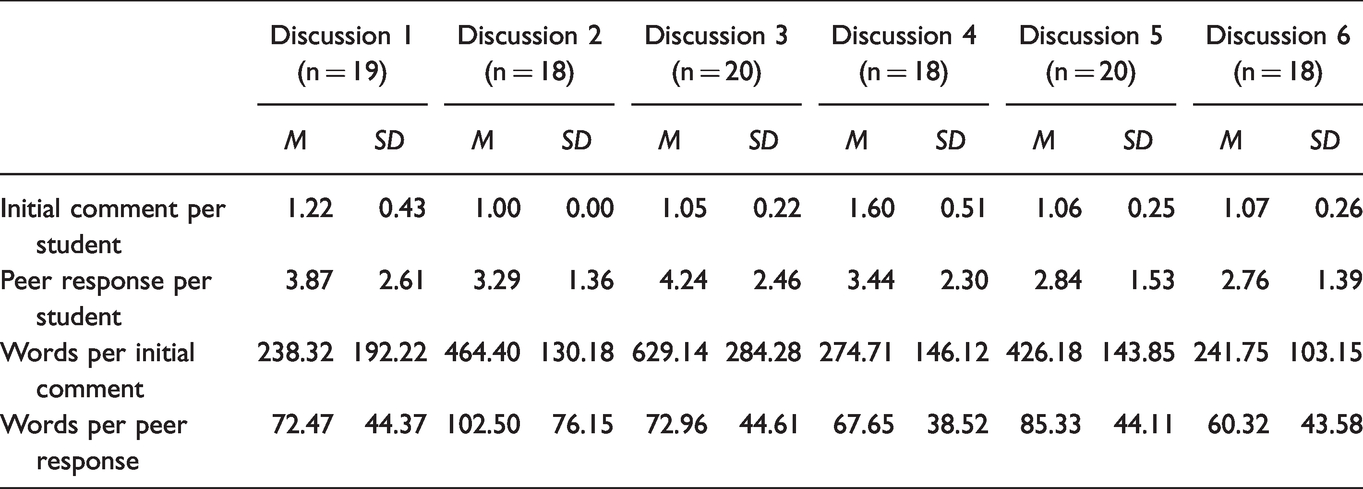
The research question is: In what ways and how can SNA be used in CSCL to understand relations from different perspectives? To answer this research question, I empirically conducted three SNA analyses on the same dataset to evaluate the use of SNA methods in an authentic CSCL setting. The dataset originated from a graduate-level semester-long online course offered at a midwestern research university in the United States. This course—Online Learning Communities—focused on theories and practices of online learning communities (see Figure 2). Twenty graduate students enrolled in this course during a 14-week semester in spring 2014. This course was primarily comprised of inquiry-based online asynchronous discussions; discussion topics focused on theories, practices, and applications of online learning communities. Each discussion was framed within one week; topics were independent to each other. In discussions, students put forth ideas, proposed and answered questions, and built on, critiqued, and reflected on others’ ideas. Keeping the same scale, the dataset in this research was comprised of all class-level discussions (see Table 1 for statistic descriptions).

Screenshots of the online course platform, hosted in Ning.
Statistic Descriptions of Six Discussions.
Three SNA Analyses
I conducted three post hoc analyses of the same dataset to show how SNA can be used from three different perspectives. From the relational ties perspective, the first analysis uses a SNA measurement that consider both the effect of number of students and interaction frequencies to analyze centralities and compares the results with centrality results analyzed from traditional SNA measurements. From the network modes perspective, the second analysis performs a three-mode network analysis to reveal student relations mediated by their knowledge co-construction processes and compares the results with student relations resulted from one-mode network analysis. From the integrated methods perspective, the third analysis integrates CA, SA, with SNA visualization to demonstrate transitional, sequential patterns of students’ knowledge advancement and compares the results with traditional “coding and counting” CA results. All analyses are conducted in R programming by using relevant R packages.
The First Analysis: From Relational Ties Perspective
Analysis Procedures and Methods
In the one-mode student-student interaction network, a node represents a student, and a relational tie between two students represented their replies (i.e., replying to others directly) and mentions (i.e., referring to others’ ideas). To calculate students’ centralities, I use Opsahl’s relational tie measurement that consider both the effect of number of students (i.e., number of ties) and number of interaction frequencies (i.e., tie weights) (Opsahl, 2009; Opsahl et al., 2010; Opsahl & Panzarasa, 2009). Through setting different Opsahl’s tuning parameter α values, the SNA measures can adjust to different measurement principles (Opsahl et al., 2010). R packages tnet (Opsahl, 2015) is used.
The node-level metrics include outdegree (
Closeness and betweenness are also calculated by using Opsahl’s tuning parameter α values of 0, 0.5, 1, and 1.5. Because closeness and betweenness centralities rely on the length of the shortest paths among nodes, it is critical to define how shortest paths are identified and measured. To achieve this goal, Opsahl’s tuning parameter α values that correspond to different measurements of the shortest paths are used (Opsahl et al., 2010). When α is set to 0, it produces the same outcome as the binary network (Freeman, 1978), calculating the shortest paths as the minimum number of ties linking two nodes, either directly or indirectly; when α is set to 1, it produces the same outcome as the Dijkstra shortest paths, resulting in the same shortest distance for paths that have different number of intermediary nodes (see Newman, 2001). When α is set to 0.5, a shorter path composed of lower interaction frequency (e.g.,
Analysis Results
Analysis results show that the use of different measurements of relational ties have critical influences on SNA centrality results. Taking the outdegree (
Student Outdegree and Indegree Scores and Ranks When Different Values of α Are Used.
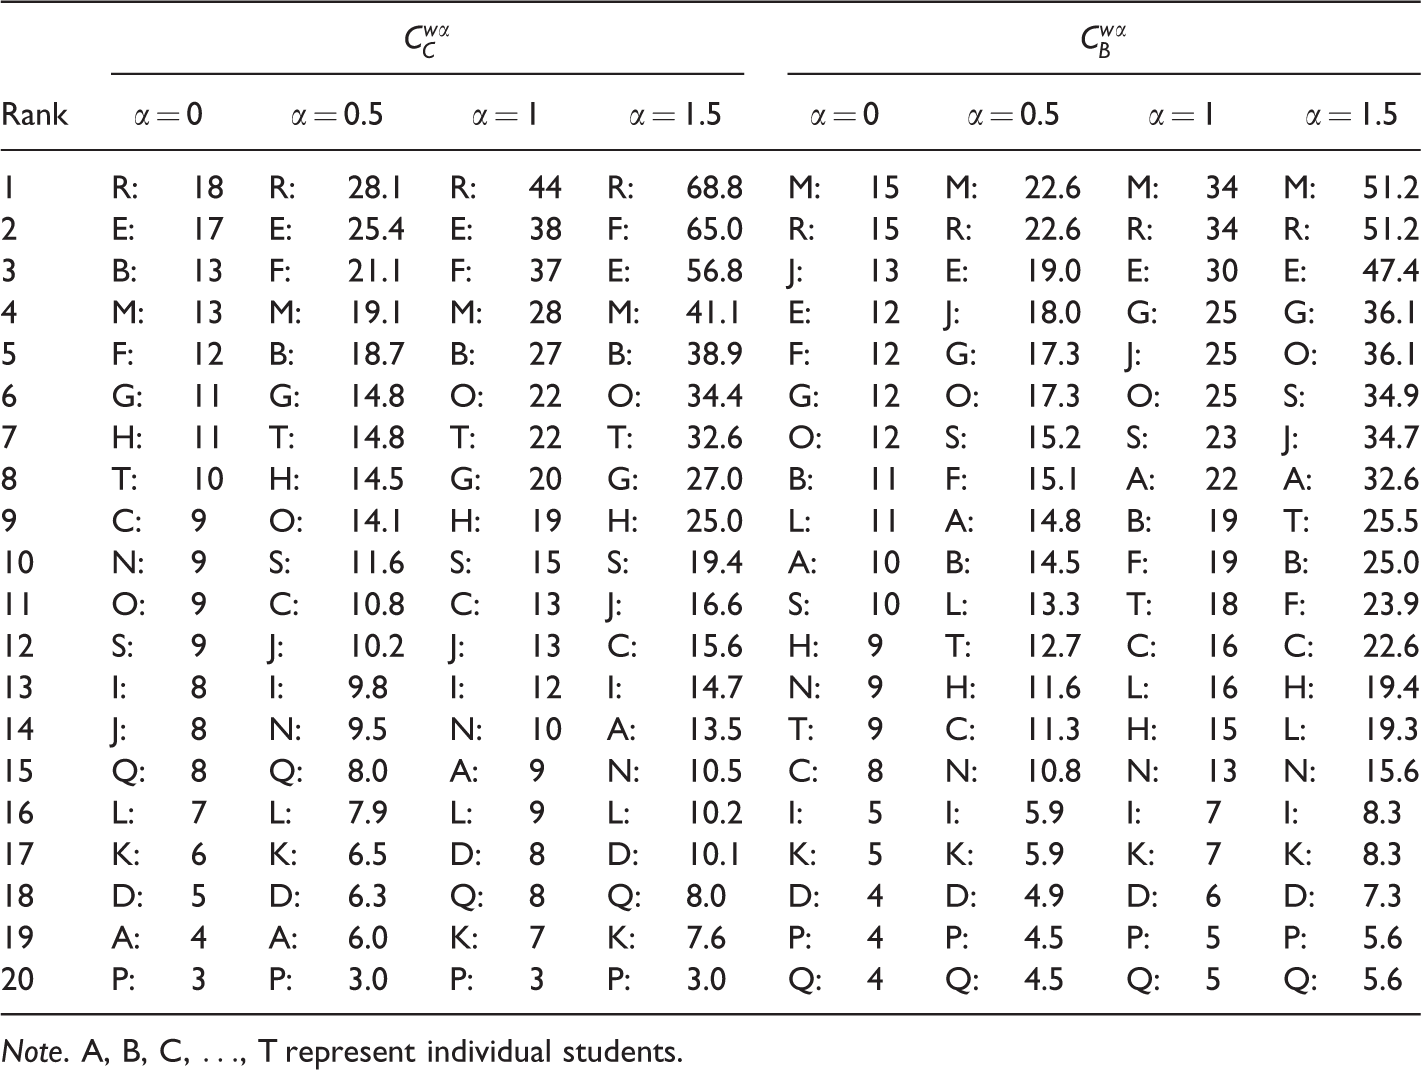
Note. A, B, C, …, T represent individual students.
Similar patterns are observed for indegree (
Regarding closeness (
Student Closeness and Betweenness Scores and Ranks When Different Values of α Are Used.
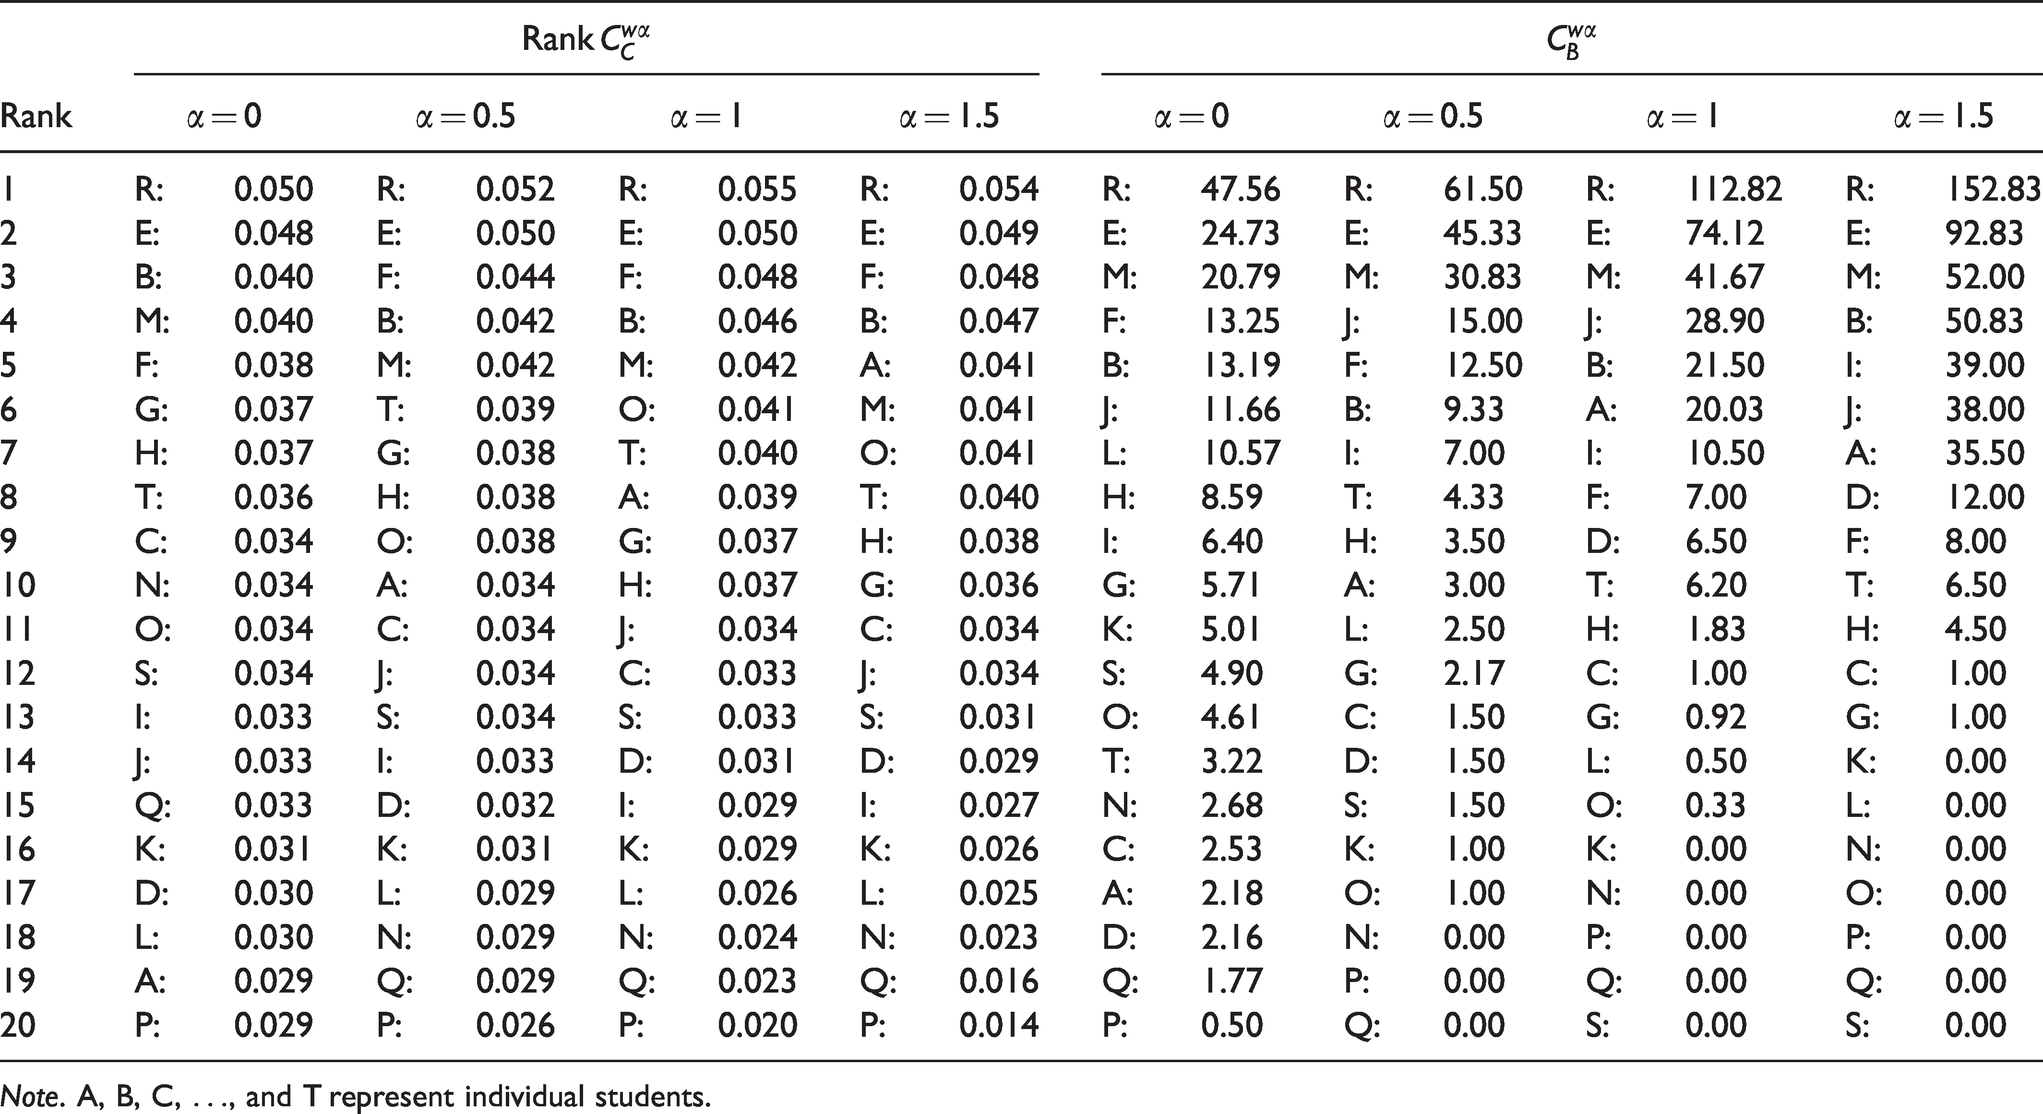
Note. A, B, C, …, and T represent individual students.
In addition, when α is set from 0.5 to 1.5, F’s betweenness rank decreases while B’s rank increases. This result indicates different interaction patterns: F has more direct interaction of low frequency with peers, while B has more indirect interactions with peers. This result is verified by the difference between B’s and F’s degree results. Moreover, J has higher betweenness score when α is set to 0 and 0.5, than he has when α is set to 1 and 1.5; this difference results from the fact that J does not have a high interaction frequency with peers (see Table 2). Therefore, when the measurement favors a shorter path composed of lower interaction frequency (α is set to 0 and 0.5), it results in higher scores on betweenness. Overall, the use of different measurements result in different centralities.
The Second Analysis: From Network Modes Perspective
Analysis Procedures and Methods
A three-mode student-discussion-term network is analyzed to investigate students’ relations mediated by their knowledge co-construction processes during discussions. First, a three-mode student-discussion-term network is created by adding a knowledge map into a two-mode student-discussion participation network. In the two-mode student-discussion network, a tie connects a student and a discussion, and tie weight represents the frequency a student participates in a discussion (see Figure 3a). Then, an overall knowledge map is generated in three steps to show the relations of topic-related, frequently-used terms within six discussions (see Figure 3b): (1) identifying frequently-used (frequency >= 10) one-, two- and three-word terms for each discussion; (2) choosing 15 overlapped, frequently-used terms among identified terms and calculating two terms’ co-occurrence frequency in the same discussions; (3) visualizing the term-term network (i.e., overall knowledge map), where a node represents a term and a tie represents co-occurrence of two terms in the same discussions. Combining the two-mode network with the knowledge map, a three-mode student-discussion-term network is created (see Figure 3a and 3b).
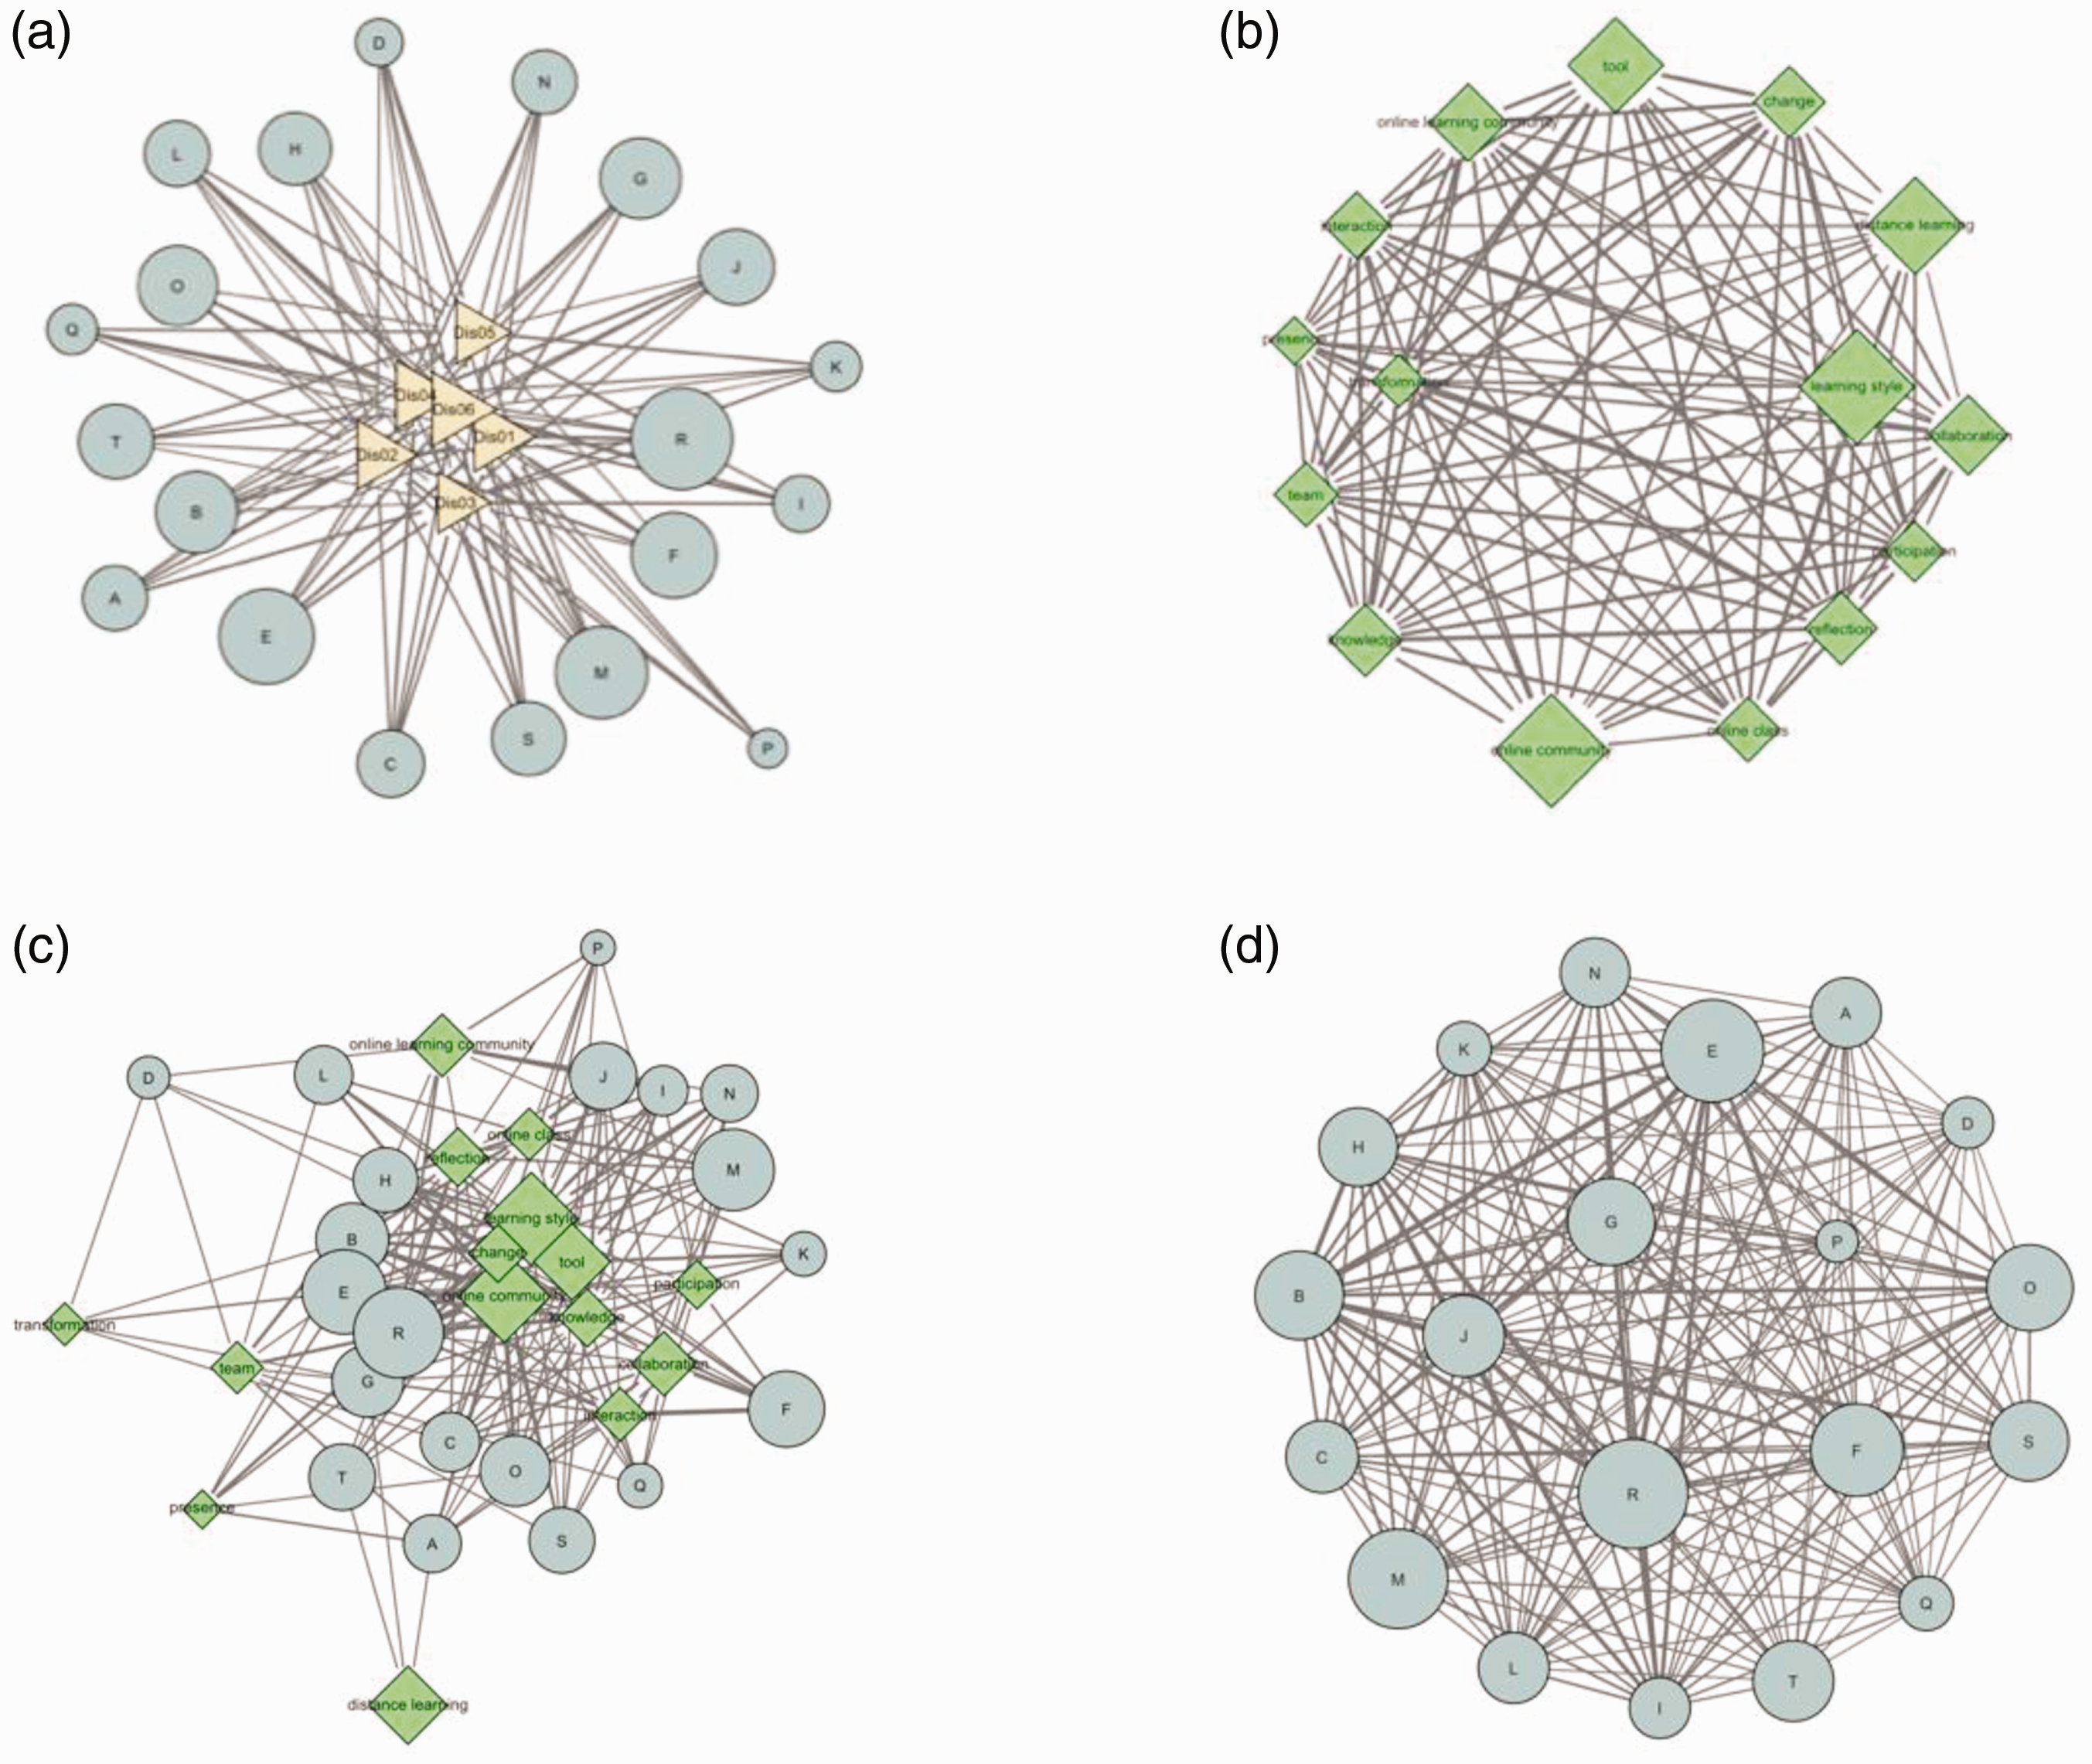
(a) The original two-mode network, (b) a knowledge map, (c) a two-mode student-term network, and (d) the projected one-mode student-student network.
Second, this three-mode student-discussion-term network is processed onto a two-mode student-term network, where a tie connects a student with a term, and tie width represents the total frequency a student contributes to a term during six discussions (see Figure 3c). A network projection (i.e., matrix multiplication) approach (Borgatti & Everett, 1997) is used to transfer this two-mode student-term network into a one-mode student-student network. By multiplying the two-mode student-term network with the transposed two-mode term-student network, a projected one-mode student-student network is generated (see Figure 3d). In this network, the relations between two students indicate their co-contribution to knowledge topics reflected by frequently-used terms, including direct knowledge co-construction as well as potential knowledge co-construction. Direct knowledge co-construction means that two students use the same terms directly. Potential knowledge co-construction relations imply students A and B had a potential relation mediated by the knowledge map. For example, if A and B use term 1 and 2 separately and term 1 and 2 have a strong relation according to the overall knowledge map, then A and B have a potential, indirect relation.
Finally, social network visualization is used to demonstrate the projected network. R packages tidyr (Wickham et al., 2018), tidytext (De Queiroz et al., 2018), and dplyr (Wickham et al., 2018) are used to identify frequently-used terms; R packages sna (Butts, 2014), network (Butts et al., 2015), and tnet (Opsahl, 2015) are used to project, process and visualize three-mode, two-mode and projected one-mode networks.
Analysis Results
The three-mode network analysis results reveal an interactive, cohesive, equally-distributed student relation network. After projecting the three-mode network, results show that 20 students are connected as a whole group through knowledge co-construction processes (see Figure 3d). Taking students E and R for example, they both participate in six discussions and they have a direct interaction frequency (i.e., replies and comments) of 11. In addition, they co-contribute to 10 frequently-used terms: E uses those 10 terms with a total frequency of 27 and R uses them with a frequency of 34. After three-mode network projection analysis, the interaction frequency between E and R changes to 118 (unscaled, weighted value), which is much higher than the directed interaction frequency between them (i.e., 11). The results indicate that some students who have no direct, interactive relations become connected, because they contribute to some common, frequently-used terms; some students’ relations become stronger after taking into consideration of the mediating effect of knowledge co-construction. The results reveal how students’ knowledge co-construction behavior serves as a mediating effect on their relations during CSCL processes. Moreover, the analysis results indicate a difference between using one-mode and multi-mode network analysis to analyze students’ interactional relations.
The Third Analysis: From Integrated Methods Perspective
Analysis Procedures and Methods
First, CA is used to code “knowledge inquiry” within students’ initial comments in the individual level, and “knowledge construction” within students’ peer responses in the group level. The “knowledge inquiry” category includes superficial-level, medium-level, deep-level knowledge inquiry (i.e., SKI, MKI, DKI). SKI represents a student’s exploration of information without elaboration, MKI represents a student’s statement of ideas without detailed elaboration, and DKI represents a student’s statement of ideas with elaboration. “Knowledge construction” category includes superficial-level, medium-level, deep-level knowledge construction (i.e., SKC, MKC, DKC). SKC represents a student’s (dis)agreement with peers’ ideas without elaboration, MKC represents a student’s extension of peers’ ideas with elaboration, and DKC represents a student’s connection of multiple peers’ ideas with elaboration (Ouyang & Chang, 2019).
Second, lag-sequential analysis (LsA) is used to examine the transitional relations among these six code categories. LsA is a statistical method for identifying sequential contingencies of behaviors or events (O’Connor, 1999). Complementary to “coding and counting” measures in CA, LsA can examine transitional relations between different code categories and reveal temporal relations of those categories. An R package LagSeq (Chen, 2015) is used to examine immediate transitions between two code categories based on three measures: transitional frequencies, Yule’s Q scores and adjusted residuals—Z scores. Transitional frequencies among six code categories represent the number of times a code category transitions immediately to another code category (e.g.,
Finally, social network visualization is used to represent the transitional, sequential relation between code categories. In the networks, the node size represents the frequency of code categories, tie strength represents the relation strength, and tie direction represents the transitional directions between code categories.
Analysis Results
Except the sequences between the same code category, the highest transitional frequency of sequences occurs between MKI to DKI (transitional frequencies = 83), followed by DKI to MKI (transitional frequencies = 58), and DKI to MKC (transitional frequencies = 55). The highest Yule’s Q scores occur between MKC to DKC (Yule’s Q = 0.68), followed by SKI to MKI (Yule’s Q = 0.61), and MKI to DKI (Yule’s Q = 0.50). The highest Z scores occur between MKI to DKI (Z score = 6.14), followed by MKC to DKC (Z score = 5.03), and SKC to MKC (Z score = 4.68). Transitional sequence networks demonstrate both the strength and direction of the relations between code categories, based on transitional frequencies, Yule’s Q scores as well as adjusted residuals—Z scores (see Figure 4). Overall, three transitional sequence networks visually demonstrate significant transitions from MKI to DKI, MKC to DKC and SKC to MKC.
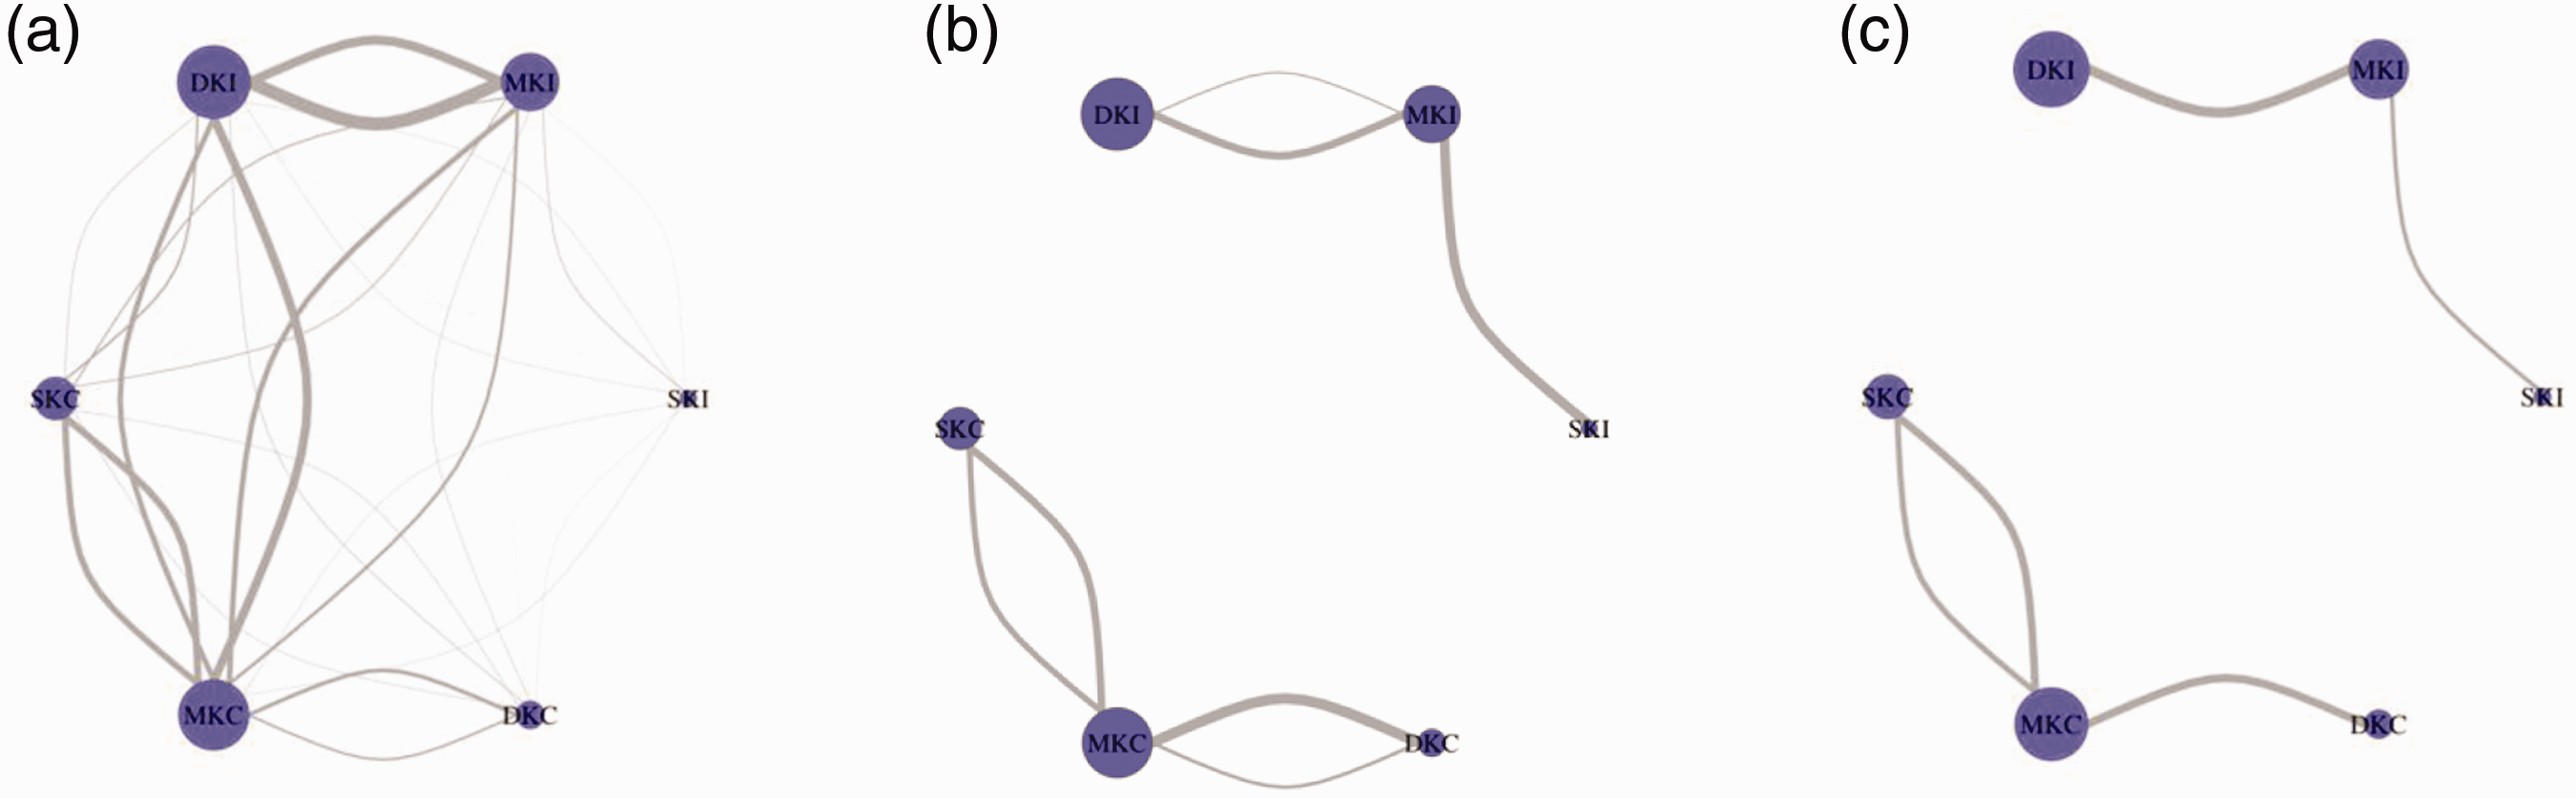
Transitional sequence networks based on (a) transitional frequencies, (b) Yule’s Q scores, and (c) adjusted residuals—Z scores.
The third analysis integrates SNA visualization with CA and SA to reveal the temporal, transitional sequences of students’ knowledge advancement. Results indicate transitional, sequential patterns, moving from the lower-level to higher-level knowledge advancement in both the individual and group levels. Moreover, results also indicate a sequential relation from the deep-level individual knowledge inquiry to the group knowledge construction. The third analysis indicates that, compared to traditional summative methods, integrated CA, SA, and SNA method can capture a richer picture—temporal, transitional aspect—of CSCL processes.
Discussion and Implication
Sharing the same philosophy of “relations matter” with CSCL (Dado & Bodemer, 2017; Saqr et al., 2020), SNA has become a common methodology for understanding CSCL entities, relations, and processes. From the descriptive, exploratory perspective, SNA has been used to understand CSCL from relational ties (Wise & Schwarz, 2017), network modes (Wu & Nian, 2021), and integrated methods (Chen et al., 2017). Responding to this research trend, I conduct three SNA analyses on the same dataset from an authentic collaborative learning setting to show how SNA can be used to better reveal interactional, multi-modal, and temporal aspects of CSCL. The general purpose of this research is to raise awareness of the consequences that different SNA methodological choices may have, and to promote transparency of the use of SNA in CSCL in future research. Based on the results, I propose methodological implications of using SNA to understand CSCL entities, relations, and processes.
Consistent with previous studies (e.g., Chiu et al., 2014; Saqr et al., 2020; Wise & Cui, 2018), the first analysis example shows that conceptual definitions and analytical measurements of relational ties have critical influences on SNA results. On the one hand, from the conceptual perspective, different tie definitions for the networks resulted in different conclusions. For example, Wise and Cui (2018) found participants in content networks interacted with more people and developed stronger ties than in the non-content network; therefore, the definition of ties should consider cognitive engagement and social connection together, rather than separately. Likewise, in the first analysis of this research, I concluded that the definition of a relational tie should integrate numbers of participants and interaction frequencies to better fit the philosophy of collaborative learning. Therefore, the definition of relational ties should be explicitly described, since it carries different assumptions about the nature of the relations (Saqr et al., 2020). On the other hand, from the analytical perspective, Opsahl’s measurement—using the alpha value of 0.5—specifically analyzes the effect of both participant number and interaction frequency, which is more appropriate for collaborative learning research than using SNA measurements that merely consider one factor. If a collaboration emphasizes the equally-distributed attribute, Opsahl’s alpha value of 0 is more appropriate, while a collaboration emphasizes learners’ reciprocity, Opsahl’s alpha value of 1 is more appropriate. Since CSCL research heavily relies on using SNA metrics to explain social roles (e.g., Ouyang & Scharber, 2017), learning behaviors (e.g., Joksimović et al., 2018), and academic performances (e.g., Reychav et al., 2018), researchers must explicitly explain how relational ties are defined and built, and elaborate measurements they are grounded upon. In addition, definitions and measurements of relational ties should also be grounded upon research contexts, purposes, and questions. Overall, because relational ties carry different assumptions about the nature of relations, researchers should carefully and explicitly elaborated definitions and measurements of relational ties in CSCL research.
The second analysis, from the network modes perspective, uses a three-mode network analysis to reveal relations between students mediated by their knowledge co-construction processes. Consistent with previous research results (e.g., Hernández-García et al., 2015; Wu & Nian, 2021), the second analysis indicates that, compared to student interactional relations in one-mode networks, students’ relations become more interactive and stronger after taking into consideration of the mediating effect of knowledge co-construction. Although adding one more dimension of information will certainly lead to different results, it is critical for researchers to be aware that student relations are usually mediated by different entities involved in the CSCL processes, rather than merely formed from interactions and connections between students themselves. More importantly, because many CSCL researchers are particularly interested in investigating the relations between entities, student relations mediated by multiple entities, and the influences of relations on CSCL behaviors (e.g., Doleck et al., 2021; Ouyang & Scharber, 2017; Wu & Nian, 2021), they should be equipped with the multi-mode network analysis approach to analyze the characteristics of different CSCL entities, the relations between them, and the influence of relations on collaborative learning. In this research, I merely use a network projection technique to transfer the multi-mode network; in the future, the development of algorithms that can better support multi-mode network analysis are needed to investigate complicated relations (e.g., Doleck et al., 2021). The multi-mode network analysis can understand more details about meditating influences in the networks that one-mode network analysis may not be able to reveal.
Similar with the integrated methods used in previous studies (e.g., Chen et al., 2017; Csanadi et al., 2018; Joksimović et al., 2018), the third analysis uses CA, SA, and SNA visualization to reveal temporal, transitional patterns of knowledge inquiry and construction processes, which are usually overshadowed from descriptive, summative ways of analyses and representations. Consistent with previous research results (Cress & Hesse, 2013; Ouyang & Chang, 2019; Saqr et al., 2020), this study not only demonstrates aggregated results from more traditional quantitative approach (i.e., “coding and counting”), but also shows a progressive development process between individual knowledge inquiry and group knowledge construction. The progressive development process is an important dimension of collaborative knowledge building formed over time during students’ interactive, dynamic, and sustained dialogues (Chen et al., 2017). Future CSCL research can use this integrated method to show sequences of sematic-related information that reflects students’ knowledge flow and to show temporal information of CSCL learning and instruction. Overall, considering the complexity of collaborative learning, researchers can use an integrated social, cognitive, and sequential analysis method to reveal more details of the CSCL processes.
Taken together, this research reveals how SNA can be used to understand CSCL entities, relations, and processes. Although the three SNA methods are only applied into a small dataset generated from an online course that emphasizes student interactivity within communities, SNA processes and methods demonstrated in this work are generalizable. Moreover, it is worth mentioning that although I use three SNA methods to understand CSCL entities, relations, and processes, the choice of SNA methods and the interpretation of SNA results depend on specific research contexts, questions, and purposes. It is worth mention that I do not claim that these specific SNA methods are preferred than others for understanding CSCL. But, I argue that researchers should become aware of the consequences that different SNA methods may have on research results. Future work can use SNA from an inferential, statistical analysis perspective to address larger size of data from different learning contexts (e.g., Doleck et al., 2021). Additional qualitative explanations would be helpful for complementing SNA quantitative results to better justify the conclusions (e.g., Ouyang et al., 2020). In conclusion, this research emphasizes the importance of transparency in the choice of SNA methods, the importance of providing a justification for that choice, and the awareness of different results it may cause.
Footnotes
Declaration of Conflicting Interests
The authors declared no potential conflicts of interest with respect to the research, authorship, and/or publication of this article.
Funding
The authors disclosed receipt of the following financial support for the research, authorship, and/or publication of this article: The authors acknowledge the financial support from the National Natural Science Foundation of China (61907038) and the Fundamental Research Funds for the Central Universities, China (2020QNA241).