
Abstract
Computerized game-based assessment (GBA) system for screening reading difficulties may provide substantial time and cost benefits over traditional paper-and-pencil assessment while providing means also to individually adapt learning content in educational games. To study the reliability and validity of a GBA system to identify struggling readers performing below a standard deviation from mean in paper-and-pencil test either in raw scores and grade-normative scores, a large-scale study with first to fourth grade students (N = 723) was conducted, where GBA was administrated as a group test by tablet devices. Overall, the results indicated that the GBA can be successfully used to identify students with reading difficulties with acceptable reliability. Although the reliability of the results were at a very good level overall, the identification was even better in the reading fluency than in reading accuracy and in terms of raw scores than in grade-normative scores. These findings are the first to demonstrate the promise of GBA in assessing reading skills reliably and in a cost-efficient manner in classrooms. Furthermore, the developed GBA is directly applicable to an educational game for successfully supporting reading development of learners with varying levels of reading skill.
Keywords
Introduction
It is estimated that 5% to 15% (performing below a standard deviation < 15.8%) of school-aged children experience specific difficulties in learning to read (see, e.g., American Psychiatric Association, 2013). For the important early identification of these students, regular clinical reading assessments starting from the first stages at school are recommended (American Psychiatric Association, 2013). The challenge with standardized reading assessments is that they have to be administrated by a trained person following the standardized assessment procedure, scoring, and data interpretation, which is often laborious and therefore not cost-effective. Computer-based assessment (CBA) can simplify the assessment routines in many ways and facilitate a quicker identification of students requiring extra support in learning to read (Virinkoski, Lerkkanen, Holopainen, Eklund, & Aro, 2018). This is due to the fact that CBA helps to automatize the assessment procedures; standardizes the presentation of spoken assessment material, scoring, and interpretation of the test results (see, e.g., Kingston, 2009; Wang, Jiao, Young, Brooks, & Olson, 2008); and enables the maintenance of the assessment instrument over Internet. Recently, CBA has been designed to include dynamic assessment for the use of computerized adaptive testing (Navarro et al., 2018), which has already shown to work among primary school children in mathematical skills (Martin & Lazendic, 2018). Furthermore, such CBA shows potential for using log files to investigate learning process and gaining detailed data to increase the validity and reliability of the assessment (Ramalingam & Adams, 2018) and in interpreting the individual responses (Greiff, Wüstenberg, & Avvisati, 2015). If a CBA is designed so that it functions as an integrated part of a digital game, assessments in a game environment can keep young students more engaged and motivated than traditional assessments encouraging students to demonstrate their full potential (e.g., Perrotta, Featherstone, Aston, & Houghton, 2013). Furthermore, different gaming features together with instant feedback can be embedded in the game-based assessment (GBA) tasks, therefore providing dynamic learning opportunities instead of making learners complete the tasks merely for the purpose of providing information on their skills for the assessors, and possibly delayed information of the assessed skills to the learners themselves. Moreover, when assessment are skillfully embedded into a computerized reading program, they do not interrupt the game flow as the tasks do not stand out as different from the general game levels, and players (learners) can stay engaged in the tasks uninterruptedly and without any additional stress element. Importantly, the information on learners skills gained from such GBA can be used immediately to provide optimal, individualized training for each individual learner, thus providing an efficient way to support learning. For instance, a recent study showed that when the contents of computerized intervention were tailored based on the assessed level of the player, the results of the intervention seem to improve, especially among the players with lower initial level (Hooshyar, Yousefi, & Lim, 2018). For these reasons, we developed a GBA task usable also in a classroom situation for effectively assessing reading skills. The GBA system’s ability to detect learners with reading difficulties is the focus of the present paper.
Previous research on computerized reading assessment has mostly been conducted in the English language known for its inconsistent relationships between written and spoken language units (letters and sounds), significantly slowing down the process of learning to read accurately, for instance, in relation to most of the other European languages having more transparent orthography (Seymour, Aro, & Erskine, 2003). In transparent orthographies in which letter–sound correspondences are relatively consistent, reading difficulties typically manifest in reading fluency problems (Eklund, Torppa, Aro, Leppänen, & Lyytinen, 2015; Seymour et al., 2003). Only a small number of children continue to make errors when reading complex words (Kairaluoma, Torppa, Westerholm, Ahonen, & Aro 2013), or due to the adoption of a hasty reading style (Leinonen et al., 2001), for which reason assessing reading accuracy is also justified. Due to the simplicity of letter–sound mappings, reading instruction in transparent orthographies, such as the Finnish orthography, can be based on the synthetic phonics method. This entails that simply by teaching letter–sound connections and how to assemble them to make up words is all you need for learning to decode, and due to this simplicity, basic reading skills can be trained efficiently even just with playing dedicated computer games. Indeed, web-based games are popular tools used in the reading instruction of Finnish schools. The evidence-based serious game GraphoLearn (Richardson & Lyytinen, 2014) in particular is being used nationwide by tens of thousands of players. However, this game lacks a proper reading assessment module, for which we decided to develop a GBA and investigate its validity and reliability.
Traditionally, reading assessments rely on grade norms for detecting those children in school classes who would benefit from extra support. However, the reading skill scores in terms of raw scores are actually more decisive on what learning content would support the child’s learning progression the most. As our aim was to develop an assessment instrument both for practitioners and for individual adaptation of learning content within a web-based reading game system, both grade-normative (relative scores) and raw scores were focused on in this study. To make the assessment as prompt as possible, we also studied whether reliable identification of reading difficulty could be achieved by just single or as few as possible multiple GBA measures of end skills. That is, for example, just a reading comprehension or word reading task, or whether a more comprehensive assessment of reading and its subskills should be administrated, including word and pseudoword reading and spelling assessments.
Previous Research on Comparing Reading Assessment Methods (CBA/GBA, PPT)
Psychometric test developers have been concerned with the issue whether people would score similarly in both new, closely corresponding CBA versions of the traditional paper-and-pencil test (PPT) and the PPT themselves. Meta-analyses suggest no or insignificant effects of the test mode per se (computerized or paper-and-pencil) for assessing the same basic scholastic (Kingston, 2009) and reading skills (Wang et al., 2008), which is a positive finding for CBA as well as GBA developers. At this point, it should be noted that the approach aiming for maximal correspondence between CBA and PPT can easily undermine the usefulness and added value of using CBA in many circumstances (Bennett, 2015). For example, technical reading skill is most reliably assessed with oral reading tasks, requiring individual administration. To design a similar GBA as the PPT for technical reading skill assessment would require using a combination of advanced speech recognition and noise-cancelling headsets technologies for successful testing in classroom settings. Since this is not feasible, oral reading tasks are typically replaced in group test settings by a carefully designed multiple-choice test formats allowing the test takers to read silently.
The convergence between a new (here GBA) and reference (PPT) measure is typically investigated by receiver operating characteristic (ROC) curve analyses (e.g., Fawcett, 2006) derived from the results of logistic regression analyses. However, evidence from previous studies using ROC curve for measuring a GBA’s fit in terms of the assessment’s sensitivity and specificity to detect learners with reading difficulty hardly exists, and even those investigating the convergence between CBA and PPT are rather scarce. To our knowledge, there are only six original research articles in which the sensitivity and specificity performance of CBA was validated against an external diagnostic criterion (either a clinical diagnosis or a test score achieved in PPT). Out of these, five studies were conducted on children and one with an adult population. Other related publications also exist, but these do not investigate how well computerized measures predict external reading measures or clinical diagnosis (e.g., Auphan, Ecalle, & Magnan, 2019; Elhassan, Crewther, Bavin, & Crewther, 2015; Isa et al., 2017; Merrell & Tymms, 2007; Piza, de Macedo, Miranda, & Bueno, 2014; Rello, Williams, Ali, White, & Bigham, 2016; Sprenger-Charolles, Colé, Béchennec, & Kipffer-Piquard, 2005).
Singleton, Thomas, and Horne (2000) assessed English-speaking children longitudinally at 5 and 8 years of age to study how reliably future reading problems can be predicted by computerized assessment methods. The children were assessed with a GBA battery at 5 years of age, and these data were compared with PPT data when the children were 6 and 8 years of age. Remarkably, Singleton et al. (2000) report perfect classification results with no false positives (i.e., incorrectly identifying children to be struggling readers although their performance in PPT shows that they actually are typically reading children) or false negatives (i.e., incorrectly identifying children to be typical readers although their performance in PPT shows that they can be classified as struggling readers). However, there is a methodological explanation for this outstanding result, as the dyslexia group performing below one standard deviation was compared against students performing above mean. Instead in an actual meaningful screening practice, one cannot exclude a priori subjects to be screened, especially the borderline ones. An interesting finding in their study was the game-like computerized measures that tapped children’s visuospatial, auditory, associative learning, working memory, and phonological awareness skills were as good as conventional PPT reading and related assessment measures in predicting later reading problems.
The highly promising results of Singleton et al. (2000) were questioned by independent replication studies. Marks and Burden (2005) tested how well a computerized test developed by Singleton et al. (2000) predicted reading skill development from first to third grade (N = 66). Although significant correlations were obtained, the assessments did not seem to be specific to literacy kills but predicted numeracy development equally well. Brookes, Ng, Lim, Tan, and Lukito (2011) studied the validity of the Singleton et al.’s (2000) dyslexia screening battery with 6- to 12-year-old children in Singapore where English is the language of instruction at schools, yet children are often multilingual and English might not be their strongest language. Their assessment data reached sensitivity of 81.9% but poor specificity of 45.5%. In effect, these values indicate that even when almost half of the students were categorized as poor readers, still 18% of actual poor readers were falsely categorized as normal readers.
Protopapas, Skaloumbakas, and Bali (2008) studied in a sample of 300 children aged 8 to 10 years old (3rd to 4th grade) whether reading disability could be detected in the transparent Greek orthography by four group-administrated computerized tasks including sentence reading with speed and comprehension measures, letter span memory, pseudoword spelling, and word identification. Their nongame-like CBA system reached 75% accuracy on the sensitivity level and 82% on specificity. Notably, also these researchers excluded borderline students (10%) performing just above the diagnostic criteria.
DeGraff (2005) reports on a nongame-like CBA system assessing phonological awareness, letter knowledge, decoding, spelling, vocabulary, and reading fluency and comprehension tests in English of Grade K-3 learners in the United States (N = 468). Their system is grounded on item test theory (Lord, 1980), attempting to minimize the assessment time by providing most informative items based on the user’s previous responses. This kind of computer adaptation relies on a large number of standardized test items or a theoretical reasoning by which to order the items by difficulty. DeGraff (2005) reported almost ceiling values for sensitivity and specificity, which, however, was partly due to a small number of dyslexic children included in their discriminative analysis. Moreover, DeGraff (2005) noted that the CBA system used was almost as fast to use as Dynamic Indicators of Basic Early Literacy Skills (Good & Kaminski, 2002), which is a highly time-efficient paper-and-pencil screening measure of reading.
In a promising study by Carson, Boustead, and Gillon (2014), the authors report 92% accuracy in predicting formal reading outcomes of children aged 5 years by phonological awareness GBA tasks from school entry to a year later (N = 95). Without excluding any borderline readers, they reached the sensitivity of 80% and the specificity of 94.7%. In an another study in which investigation focused on using GBA assessments of preschoolers to determine how well these reading skill-related assessments predicted the reading status of below 40 percentile according the PPT assessments conducted at the end of first grade, a specificity of 70% was reported for 90% sensitivity (Clemens et al., 2015). Finally, a study predicting reading fluency difficulties (N = 11) from preschool GBA to first grade PPT assessment results (N = 57), Puolakanaho and Latvala (2017) obtained the sensitivity of 95.7% with the specificity of 81.8% by using only a single test of letter–sound knowledge. Importantly, their study was conducted in the same transparent orthography (Finnish) as in the present study, suggesting that reading fluency can be reliably assessed by GBA in Finnish. The identification accuracy of the studies by Carson et al. (2014) and Puolakanaho and Latvala (2017) qualify for a diagnostic test (Spitalnic, 2004) and, thus, represent clearly the state of the art of GBA technology for predicting reading difficulties in children.
The Present Study
In our study, we wanted to investigate whether the GBA we developed specifically for the present study would be able to provide a good indicator/cutoff value for determining struggling readers. The previous studies on CBA/GBAs were mostly concerned with risk prediction for future reading difficulties in preschool children. However, there is also an urgent need to develop evidence-based GBA tools for assessing reading skill development during primary school years. Therefore, this study reports on large-scale data of game-based identification of reading difficulties in Grades 1 to 4, conducted in Finnish. The following procedures were applied to address the methodological challenges encountered in the previous studies: (a) To ensure time and cost efficiency, the specifically developed computerized assessments in a digital game environment were delivered by tablets in group settings; (b) to make the assessment child-friendly and dynamic, we designed the assessments so that they would be quick to complete by employing the cutoff criterion to discontinue each task after four errors within the previous last six trials; (c) to make the assessments attractive and engaging to children, we created many graphically different contexts for the assessments, included typical gaming elements such as speaking animated game characters and progress bars, virtual rewards in the form of collectable coins that could be used for buying virtual animal stickers for the sticker book, and we also included both reactive and interactive tasks in our GBA; (d) to keep children motivated, engaged as well as to facilitate them to show their full potential, we used a dynamic assessment approach by providing immediate feedback on accuracy: green graphics for correct and red graphics for incorrect responses with both type of responses also accompanied with a corresponding gentle sound indicator (see, e.g., Bridges & Catts, 2011, for evidence that dynamic assessment with instant feedback for accuracy can predict future reading ability more accurately than static measures, and Fuchs, Compton, Fuchs, Bouton, and Caffrey’s (2011) study for evidence on the construct and the predictive utility of dynamic assessment on first grade children’s decoding skills); (e) to ensure high interpretability of what a specific GBA task measures, each GBA task was validated against a PPT task designed to assess the same reading subskill; (f) finally, to attain high ecological validity, no borderline group of students was excluded.
Using the previously mentioned principles, we attempted to answer the research question, to what extent can our GBA tasks identify reading difficulties similarly to PPT measures in Finnish speaking children in Grades 1 to 4.
Methods
Participants
The participants were 741 monolingual 1st to 4th grade children (aged 6 to 11 years, 327 males, 401 females). Students who consented to the study and whose guardians gave written consent were included. The Ethics Committee of the University of Jyväskylä approved the study protocol. Various classes from several elementary state schools located in cities and rural areas of Central Finland participated. The assessments were administrated in the spring term about two thirds to the school year. Fifteen students were not able to participate in the individually administrated PPT assessments, and additional three students did not complete all the GBA assessments. The size of our analyzed sample (N = 723) included 178, 199, 177, and 169 participants from Grades 1 to 4, respectively. Finnish children attend almost exclusively schools run by municipalities instead of private schools; therefore, our sample is highly inclusive and representative of Finnish students. Typically, reading difficulty is not officially diagnosed in Finland, partly because such diagnosis is not a prerequisite for receiving special education. In the present study, for determining reading difficulty, we opted for a conventional criterion used in international studies that is defined as performance falling below a standard deviation in reading skill-related measures.
Tasks and Measures
The decision to use different types of tasks and measures for assessing basic reading skills specifically for the purpose of detecting struggling readers was based on the well-established research findings on reading difficulties. Therefore, we decided to use the following five task types: word reading, pseudoword reading, sentence reading comprehension, word spelling, and pseudoword spelling.
For the assessment measures, the accuracy percentage and response fluency (i.e., the amount of correct responses per minute) were used as the outcome scores, except in the spelling and sentence reading comprehension measure: In the spelling measure, only the accuracy percentage was used due to the fact that PPT spelling task did not include fluency measure; the accuracy scores were at the ceiling in the sentence reading comprehension tasks, and therefore, only fluency measures were used. All of the GBAs except the sentence reading comprehension measure included a cutoff point, that is, the task was automatically discontinued after four incorrect selections were made in the previous six trials. For the calculation of test–retest reliability of the GBA tasks, the tests were administered for a second time about 4 to 6 weeks later to a group (N = 35) of 3rd grade students. No retest reliability analysis was conducted for paper-and-pencil tasks, as most of them were standardized measures. The within and between correlations of the GBA and PPT measures and the test–retest correlation for GBA measures are provided in Appendices A and B.
The widely used reading skill measures in PPT format were used, and for all of these, we designed and developed our own GBA counterparts that we considered to measure similar skills to the PPT tasks. As an example of the GBA tasks, Figure 1 shows a screenshot taken from the sentence reading comprehension task in the GBA mode. The validity of our GBA measures in relation to the PPT measures has been comprehensively investigated and reported in a separate article submitted to publication elsewhere (Heikkilä et al., 2019). Importantly, their findings of correlational and explanatory factor analyses show that the corresponding GBA and PPT measures loaded consistently on the same factors of either reading fluency (sentence reading fluency, word and pseudoword reading fluency) or general accuracy factors (word and pseudoword reading accuracy, word and pseudoword spelling), indicating that the different modes of assessments were assessing the same constructs. In the following, we will provide a summarized description of the used tasks in both PPT and GBA domains including information on the factor loadings for each measure.
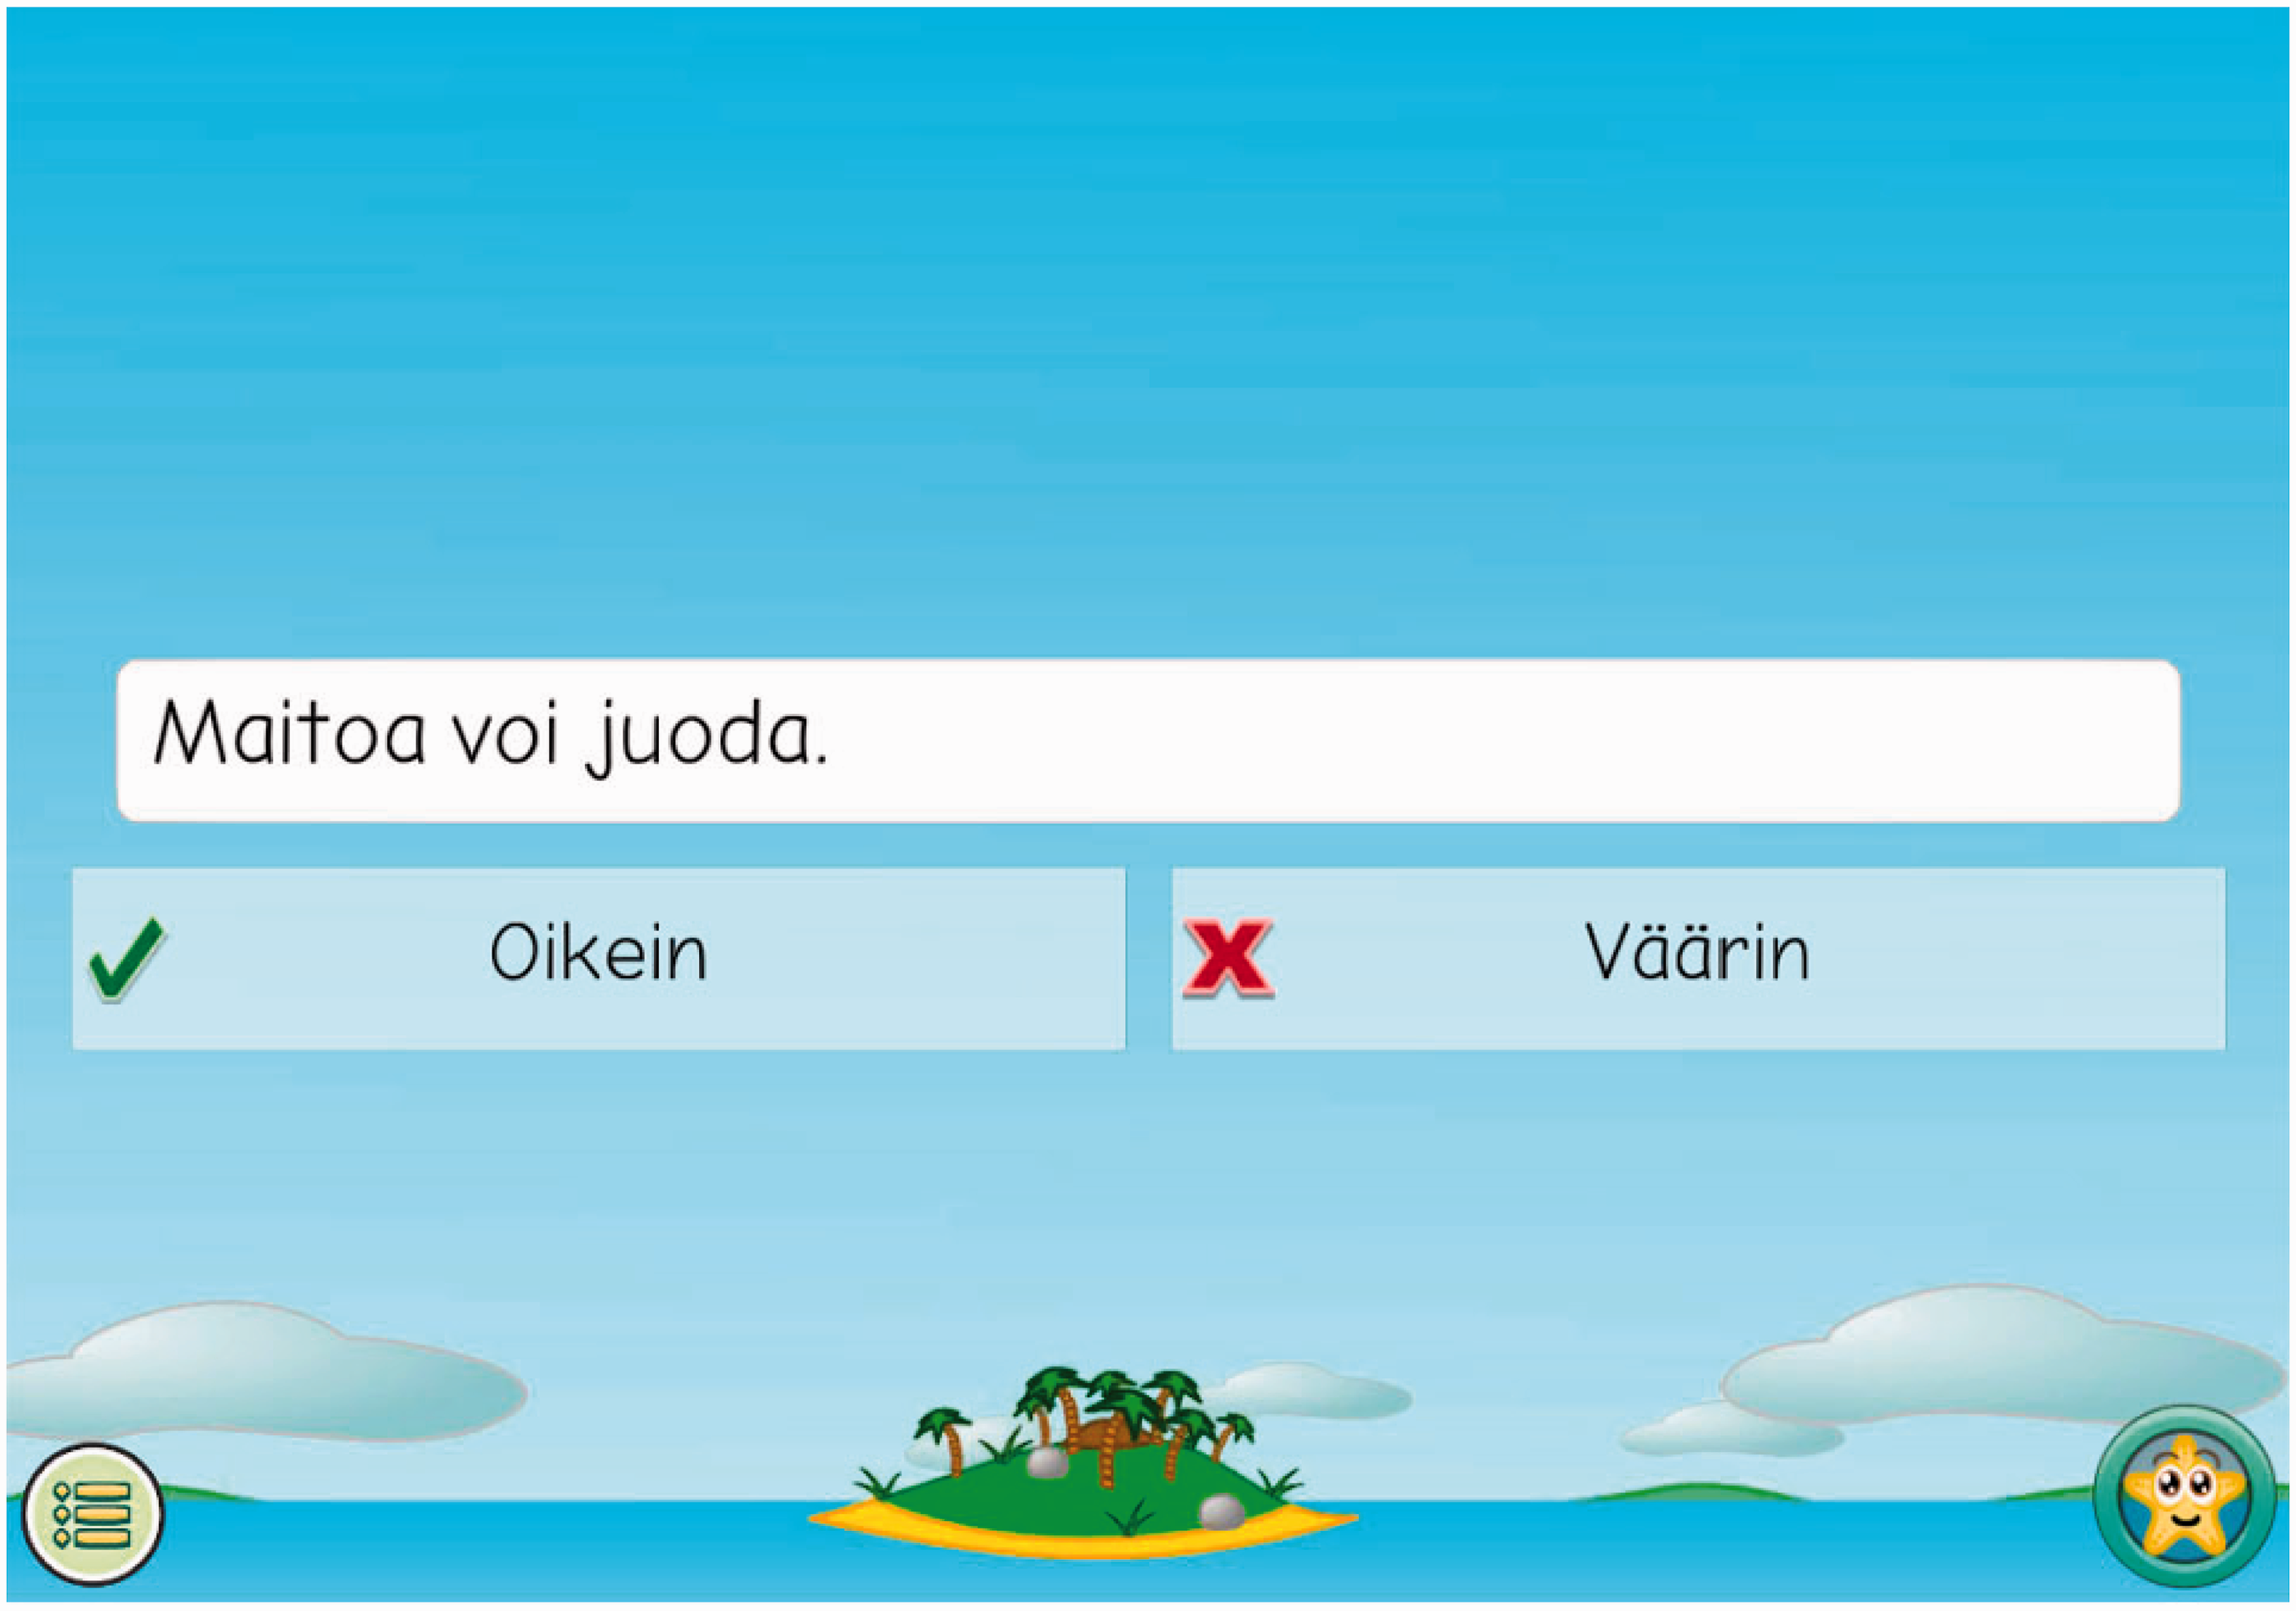
A screen capture from the GBA sentence comprehension task. The sentence translates “Milk can be drunk” and the answer choices “True” and “False.”
Paper-and-pencil assessment tasks
Sentence reading comprehension
The Luksu sentence reading comprehension task (Eklund, Salmi, Polet, & Aro, 2013) is the Finnish adaptation of the Woodcock–Johnson reading fluency task (Woodcock, McGrew, & Mather, 2001). In the task, the student is instructed to read a sentence as quickly as possible and to decide and mark whether a written statement is true or false (e.g., Ketuilla on pitkä häntä. [Foxes have a long tail.]). The outcome score is the amount of correct responses given within a 2-minute time limit (maximum = 70). Cronbach’s alpha for the test has been reported to be .94 (Eklund et al., 2013). The mean factor loading across grades 1 to 4 for fluency factor was .67. Students completed two parallel versions of the task (with different sentences), one being presented with a typically used letter spacing and the other with a sparser letter spacing.
Word reading
Lukilasse 2 Graded Word-Level Reading Fluency Test (Häyrinen, Serenius-Sirve, & Korkman, 2013) was used to measure word reading skills. The test progresses from monosyllabic to multisyllabic words. The student was instructed to read the words aloud as quickly and accurately as possible within a 2-minute time limit. The number of correctly read words (maximum 90 for Grades 1–2 and 105 for Grades 3–4) was used as the outcome score. If the student was able to complete the test in less than 2 minutes, the score was imputed to complete the 2-minute time according to the rate on correctly read words within 1 minute. According to the test manual, Cronbach’s alpha of the test is .97. The mean factor loading was .74 for fluency, whereas word reading accuracy was not subject to factor analysis due to the ceiling effect.
Pseudoword reading
For this study, a pseudoword reading task was created based on the second-grade reading assessment materials previously developed for the nationwide web service LukiMat (Salmi, Eklund, Järvisalo, & Aro, 2011). Thirty stimuli were selected from the LukiMat material based on the following selection criteria: (a) Monosyllabic items were excluded except one four letter monosyllable, (b) the selected items had been constructed so that they had permissible forms according to the phonotactics of Finnish, and (c) the syllable structures had to match those in the computerized version, and the pseudowords were required to contain similar phonemes to the corresponding GBA task. The student was instructed to read the list of pseudowords as quickly and accurately as possible. The number of correctly read pseudowords (maximum = 30) and reading fluency (i.e., the amount of pseudowords read correctly within a minute) were used as outcome scores. The mean factor loading was .59 for accuracy and .68 for fluency.
Word spelling
In the word spelling task from the Lukilasse 2 test battery (Häyrinen et al., 2013), the student was asked to spell words presented via an audio track. Each of the 20 words was repeated once. The amount of points gained was used as the outcome score (maximum = 40; two points for each word spelled correctly). According to the manual, Cronbach’s alpha is from .86, .74, .61, and .60 for Grades 1 to 4, respectively. The mean factor loading for accuracy factor was .71.
Pseudoword spelling
For the purpose of the present study, we created a pseudoword spelling task. All items included followed the phonotactic rules of the Finnish language. Participants were asked to spell the pseudowords with increasing difficulty (from 4 to 15 letters, e.g., /penke/, /vyönytoiska/) after they listened to auditory stimuli. Each pseudoword was repeated once. The task was interrupted if none of the four first pseudowords was spelled correctly. The number of correct answers (maximum = 10) was used as the outcome score. The mean factor loading for accuracy factor was .63.
GBA tasks
Sentence reading comprehension
The task used here was the same Luksu sentence reading task as in the corresponding PPT mode except a different set of sentences from the PPT Luksu was used here. In the task, the student was told via spoken instruction to read a sentence as quickly as possible and to select either the “true” or “false” option to reflect whether the given statement on the screen was true or false (e.g., Mansikat ovat keltaisia. [Strawberries are yellow.]). The amount of correct responses (maximum = 70) given within a 2-minute time limit was used as the outcome score. The correlation between test–retest scores was r = .89. The mean factor loading for fluency factor was .75. The students completed two parallel versions (with different sentences) of the task, one being presented with a typically used letter spacing and the other with a sparser letter spacing.
Word reading
The student was presented an auditory stimulus and instructed to select the corresponding item from four written alternatives on the screen. The word length increased gradually from short, bisyllabic words to words with six syllables (max. 16 letters). The task was automatically discontinued after four errors in the previous six trials. The target words, and their three distractors, were presented in the same order for each student. The number of correct responses (maximum = 40) and response fluency (i.e., the amount of correct responses per minute) were used as the outcome scores. The correlation between test–retest scores was r = . 74. The mean factor loading was .76 for fluency, whereas word reading accuracy was not subject to factor analysis due to the ceiling effect of the PPT task.
Pseudoword reading
A task similar to the word reading task was presented with pseudowords. The task began with monosyllabic pseudowords (e.g., sien), and gradually multisyllabic pseudowords (the maximum of four syllables and 13 letters, e.g., souraannuttaa) were presented. The number of correct responses (maximum = 40) and response fluency (i.e., the amount of correct responses per minute) were used as the outcome scores. The correlation between test–retest scores was r = .66. The mean factor loading was .61 for accuracy and .74 for fluency.
Word spelling
A set of sublexical items (single letters or syllables) was presented on the screen. The student was instructed to form the word presented via headphones by selecting the correct items in the correct order. The length of the target words and the size of the sublexical items increased progressively (e.g., from items such as ei (no) to geenimuunneltu (gene-manipulated)) and the pool of sublexical items available also included distractor items. The number of correctly formed words (maximum = 20) and response fluency (i.e., the amount of correctly formed words per minute) were used as the outcome scores. The correlation between test–retest scores was r = . 60. The mean factor score for the accuracy factor was .58.
Pseudoword spelling
A task similar to the word spelling task was presented for pseudowords (e.g., from items such as ri to laannusvastikko). The number of correctly formed pseudowords (maximum = 24) and response fluency (i.e., the amount of correctly formed pseudowords per minute) were used as the outcome scores. The correlation between test–retest scores was r = . 69. The mean factor loading for the accuracy factor was .61.
Composite Measures
The reliability of reading assessments can be increased by using several different assessment tasks or measures (e.g., Valencia et al., 2010). To gain further understanding of the usefulness of reading skill assessments, we also made composite measures derived from the same aspects available from the different task types and assessment modes (GBA, PPT) employed here. The following is the description of the four composite measures used here.
Reading fluency
The composite measure for reading fluency included the word reading, pseudoword reading, and sentence reading comprehension tasks from both PPT and GBA modes. The averages of standardized variables were used, and the average was then subject to another standardization. Reliability analyses indicated Cronbach’s alpha .94 for the composite fluency measure for PPT and .93 for the corresponding measure for GBA tasks.
Sentence reading comprehension
To study if mere assessment of functional reading skill, that is, reading for meaning is sufficient and a time-efficient way to identify poor readers, the average between the two parallel versions of the sentence reading comprehension tasks on both PPT and GBA domains was first calculated after which their average was standardized.
Accuracy
The composite measure for accuracy included word reading, pseudoword reading, word spelling, and pseudoword spelling tasks. The average of accuracy percentages was first calculated, and this average was then standardized. Reliability analyses indicated Cronbach’s alpha .833 for the PPT and .866 for the GBA tasks.
Spelling
Spelling was studied separately as it is the domain where many poor readers continue to make errors even after having attained a good reading accuracy. To study if mere assessment of spelling accuracy is sufficient and a time-efficient way to identify inaccurate readers, the averages of the accuracy percentage in word and pseudoword spelling tasks were first calculated, and this average was then standardized.
Procedure
The data collection was conducted in two separate assessment sessions. During the first session, the students played a set of assessments in a game environment (GBA) with tablets within a group test situation in their classroom. The session was supervised by the students’ own class teacher as well as two researcher assistants. The students wore headphones while doing the tasks to hear the stimuli clearly and to avoid getting distracted by other students in the classroom. Furthermore, typically for games, the assessment tasks provided immediate auditory and visual feedback for accuracy after each response on top of which the game indicated what would have been the correct response in case the student gave an incorrect response. The students completed the GBA tasks within 25 to 60 minutes. Once a student completed the complete set of assessment tasks, she or he was instructed to continue playing other educational games available on the device until all students had completed the tasks. During the second, individually administrated assessment session, PPT assessments were conducted with one-to-one interaction with a research assistant in a designated testing space. The PPT session took longer to complete than the GBA session, ranging from 40 to 90 minutes per student. To control possible task order effects, both GBA and PPT tasks were presented in a different order, counterbalanced across students.
Data Analysis
Apart from the descriptive analysis of the assessment data, logistic regression analyses were conducted to compare the data in the GBA and PPT modes: The data from each PPT assessment task were used as a dependent variable, and the data from the corresponding GBA measure were used as an independent variable.
Post hoc analyses were also conducted to pursue ways to reduce the number of false-positive identifications. An ROC curve analyses were conducted since the convergence between a new (here GBA) and reference (PPT) measure is typically investigated by ROCs (e.g., Fawcett, 2006) derived from the results of logistic regression analyses. A sensitivity value for our investigation purposes indicates how many students score below the cutoff value (struggling vs. typical readers) in PPT as well as in the GBA. As our main goal was to identify all children with a reading difficulty with GBA, that is, to minimize the number of false-positive identifications (incorrectly identifying children to be struggling readers although their performance in PPT shows that that they actually are typically reading children), we set the sensitivity to the high value of 95%. By using the high sensitivity value, the ROC’s curve then shows the test specificity value, that is, the rate of children not having a reading difficulty performing below the threshold value in the GBA (false-negative identifications). In other words, the ROC’s curve indicates the specificity for a given sensitivity. Generally, a diagnostic measure should attain sensitivity approaching the ceiling level and specificity of 80% to 90% (Spitalnic, 2004). This ensures that almost all individuals in need of reading support can be identified and thus be targeted.
Apart from the ROC curve analyses, a decision tree analysis was also conducted. The reason why we also used decision tree analyses is that it has been used similarly previously (Compton, Fuchs, Fuchs, & Bryant, 2006; Myles, Feudale, Liu, Woody, & Brown, 2004) for predicting a dichotomous dependent variable with two or more predictors each providing an independent cutoff value: While logistic regression sets a single cutoff line for identification, a decision tree analysis sets two independent cutoff values, one for each independent variable, similarly when setting a diagnosis based on < 1 SD performance either in fluency or accuracy in PPT assessments (for more information, see Myles et al., 2004 for an introduction to the decision tree method and Compton et al., 2006 for its application in identification of dyslexia). A decision tree analysis with a tree depth of two, classification and regression trees, the growing method with a twoing impurity measure, were conducted for selected criteria for detecting struggling readers. Finally, scatter plots were inspected to investigate further the specificity level of our GBA assessments.
Results
The descriptive analysis shows that the struggling readers differed from typical readers in fluency and accuracy measures in all of the assessment tasks (Table 1). The correlational analysis of the data indicated a strong correlation between the GBA and PPT measures (Appendix A), and even stronger correlation was found when composite measures were compared (Appendix B). Given that also the reliability analyses favored composite measures over individual test scores, only composite measures were included in further data analyses.
Means and Standard Deviations in Parenthesis for a Categorization of Reading Level Based on Reading Fluency or Accuracy Criteria in Grade-Normative Scores.
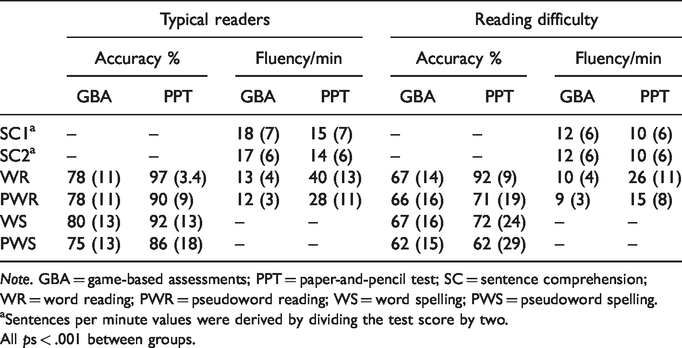
Note. GBA = game-based assessments; PPT = paper-and-pencil test; SC = sentence comprehension; WR = word reading; PWR = pseudoword reading; WS = word spelling; PWS = pseudoword spelling.
aSentences per minute values were derived by dividing the test score by two.
All ps < .001 between groups.
The results of logistic regression analyses presented in Table 2 indicate that the GBA tasks worked very well for identification of reading difficulties as measured in performance raw scores especially in terms of (a) reading fluency and (b) reading fluency or accuracy criteria, resulting in less than 10% of false positives even when the false-negative rate was kept constant at 5%. However, for grade-normative skill, 25.8% rate of false positives was obtained for reading fluency, whereas in reading accuracy, the false-positive rate increased drastically (Table 2). Scatterplots in Figure 2 show the individual spread between PPT and GBA measures of reading fluency for groups of correctly and falsely identified students.
Results of the Logistic Regression Analyses.
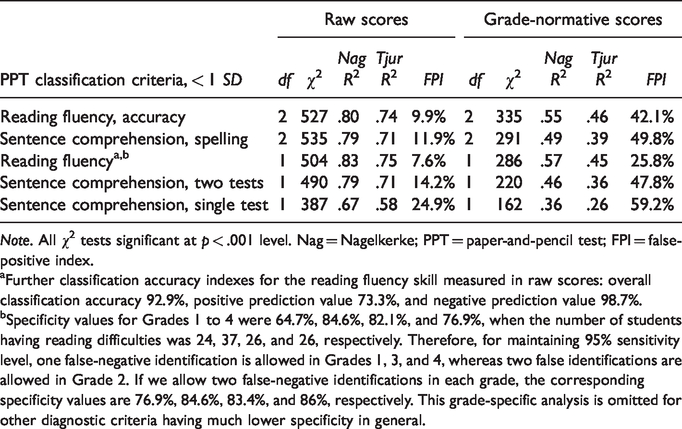
Note. All χ2 tests significant at p < .001 level. Nag = Nagelkerke; PPT = paper-and-pencil test; FPI = false-positive index.
aFurther classification accuracy indexes for the reading fluency skill measured in raw scores: overall classification accuracy 92.9%, positive prediction value 73.3%, and negative prediction value 98.7%.
bSpecificity values for Grades 1 to 4 were 64.7%, 84.6%, 82.1%, and 76.9%, when the number of students having reading difficulties was 24, 37, 26, and 26, respectively. Therefore, for maintaining 95% sensitivity level, one false-negative identification is allowed in Grades 1, 3, and 4, whereas two false identifications are allowed in Grade 2. If we allow two false-negative identifications in each grade, the corresponding specificity values are 76.9%, 84.6%, 83.4%, and 86%, respectively. This grade-specific analysis is omitted for other diagnostic criteria having much lower specificity in general.
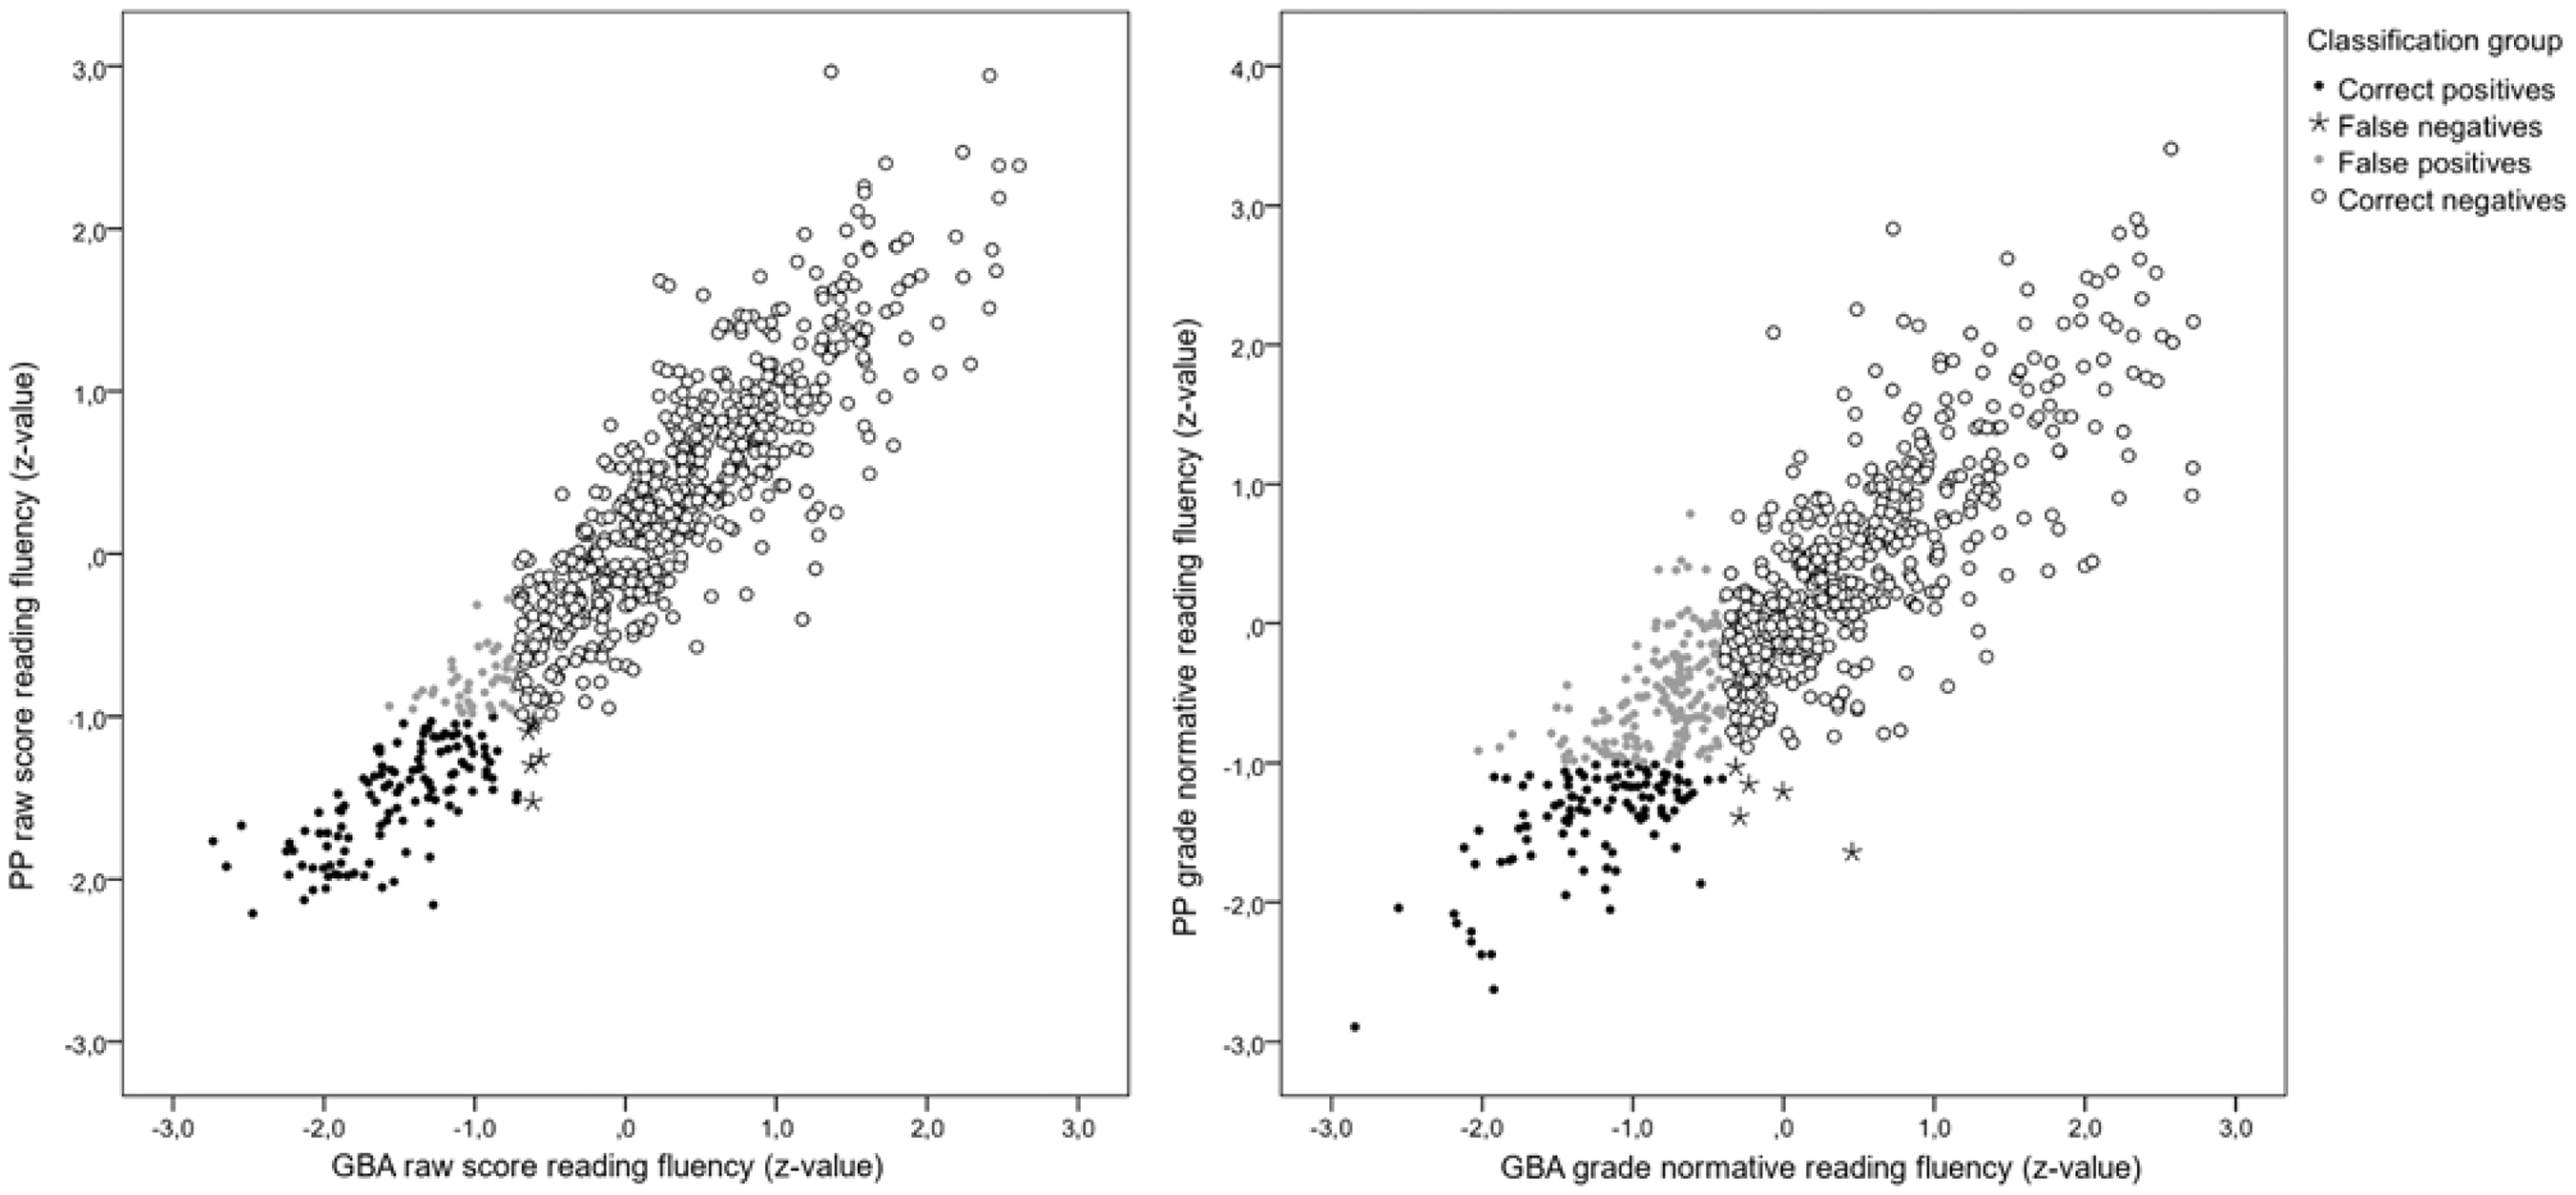
A scatterplot of raw scores (left panel) and grade-normative scores (right panel) reading fluency as assessed by PPT (vertical axis) and GBA (horizontal axis). The black dots represent dysfluent readers accurately identified by GBA, black stars false-negative dysfluent readers, gray dots false-positive typical readers, and circles typical readers correctly identified by GBA.
Post Hoc Question 1: Can the Number of False-Positive Identifications be Reduced When Assessing Grade-Normative Skills?
In the logistic regression analyses presented earlier, we compared the extent to which the closely corresponding measures of the GBA mode were able to match the struggling readers identified by the PPT measures, for example, fluency problems identified by the PPT measures were predicted with the GBA fluency measures. To gain a better understanding of the GBA measures’ usefulness, we investigated whether including noncorresponding independent variables into the analyses would have an effect on the identification accuracy of struggling readers: For instance, we investigated if the identification of reading fluency problems (as indicated by the PPT measures) can be improved by taking into account both fluency and accuracy in the GBA measures. The logistic regression analyses including the noncorresponding independent variables revealed that the rate of false positives in identifying reading fluency problems could indeed be reduced further from 25.8% to 21.6%, by including both GBA fluency and accuracy scores as independent variables.
Apart from logistic regression analyses, we also used a decision tree analyses approach to investigate our data. By using a decision tree approach, which seeks optimal cutoff criteria separately for both independent variables, that is, for GBA fluency and GBA accuracy, we tested whether better identification accuracy could be achieved than with the logistic regression analyses. As one cannot fix the sensitivity level of a decision tree solution, we adjusted the sensitivity level of corresponding logistic regression analysis to match the sensitivity level obtained in a decision tree analysis (Table 3). It appears that the number of false positives can be reduced from 31% to 25.3% with the decision tree analysis, but only when a full set of measures were included for detecting struggling readers.
Comparison of Logistic Regression and Decision Tree Methods for Identifying Struggling Readers in Grade-Normative Scores by GBA.
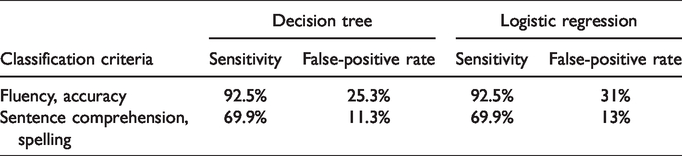
In summary, for the grade-normative identification of reading difficulties, we have two good options: either to (a) identify only reading fluency problems with 95% sensitivity and 78.4% specificity or (b) identify reading fluency or accuracy problems with 92.5% sensitivity and 74.7% specificity. Both options require measuring the skill in question with as many assessment tasks as are available in our test battery.
Post Hoc Question 2: Why It Seems to be More Challenging to Identify Accuracy Problems Than Fluency Problems With Our GBA?
The scatterplots of the data (Figure 3) reveal the absence of false negatives, that is, students who score poorly in PPT but well in GBA, and a relatively large number of false positives, that is a group of students who perform accurately in PPT but inaccurately in GBA. With further investigation, this finding seems to be more evident in terms of grade-normative scores than in raw scores, indicating that raw score data are more in line with the PPT data. Thus, our GBA seems to prompt even skilled readers to make some errors, and this could be due to the fact that the tasks in our GBA were designed so that the correct target and its distractors were quite similar requiring attention to details. This demonstrates that our GBA manages to find differences in the skill levels of developing readers more than the traditional assessments with PPT.
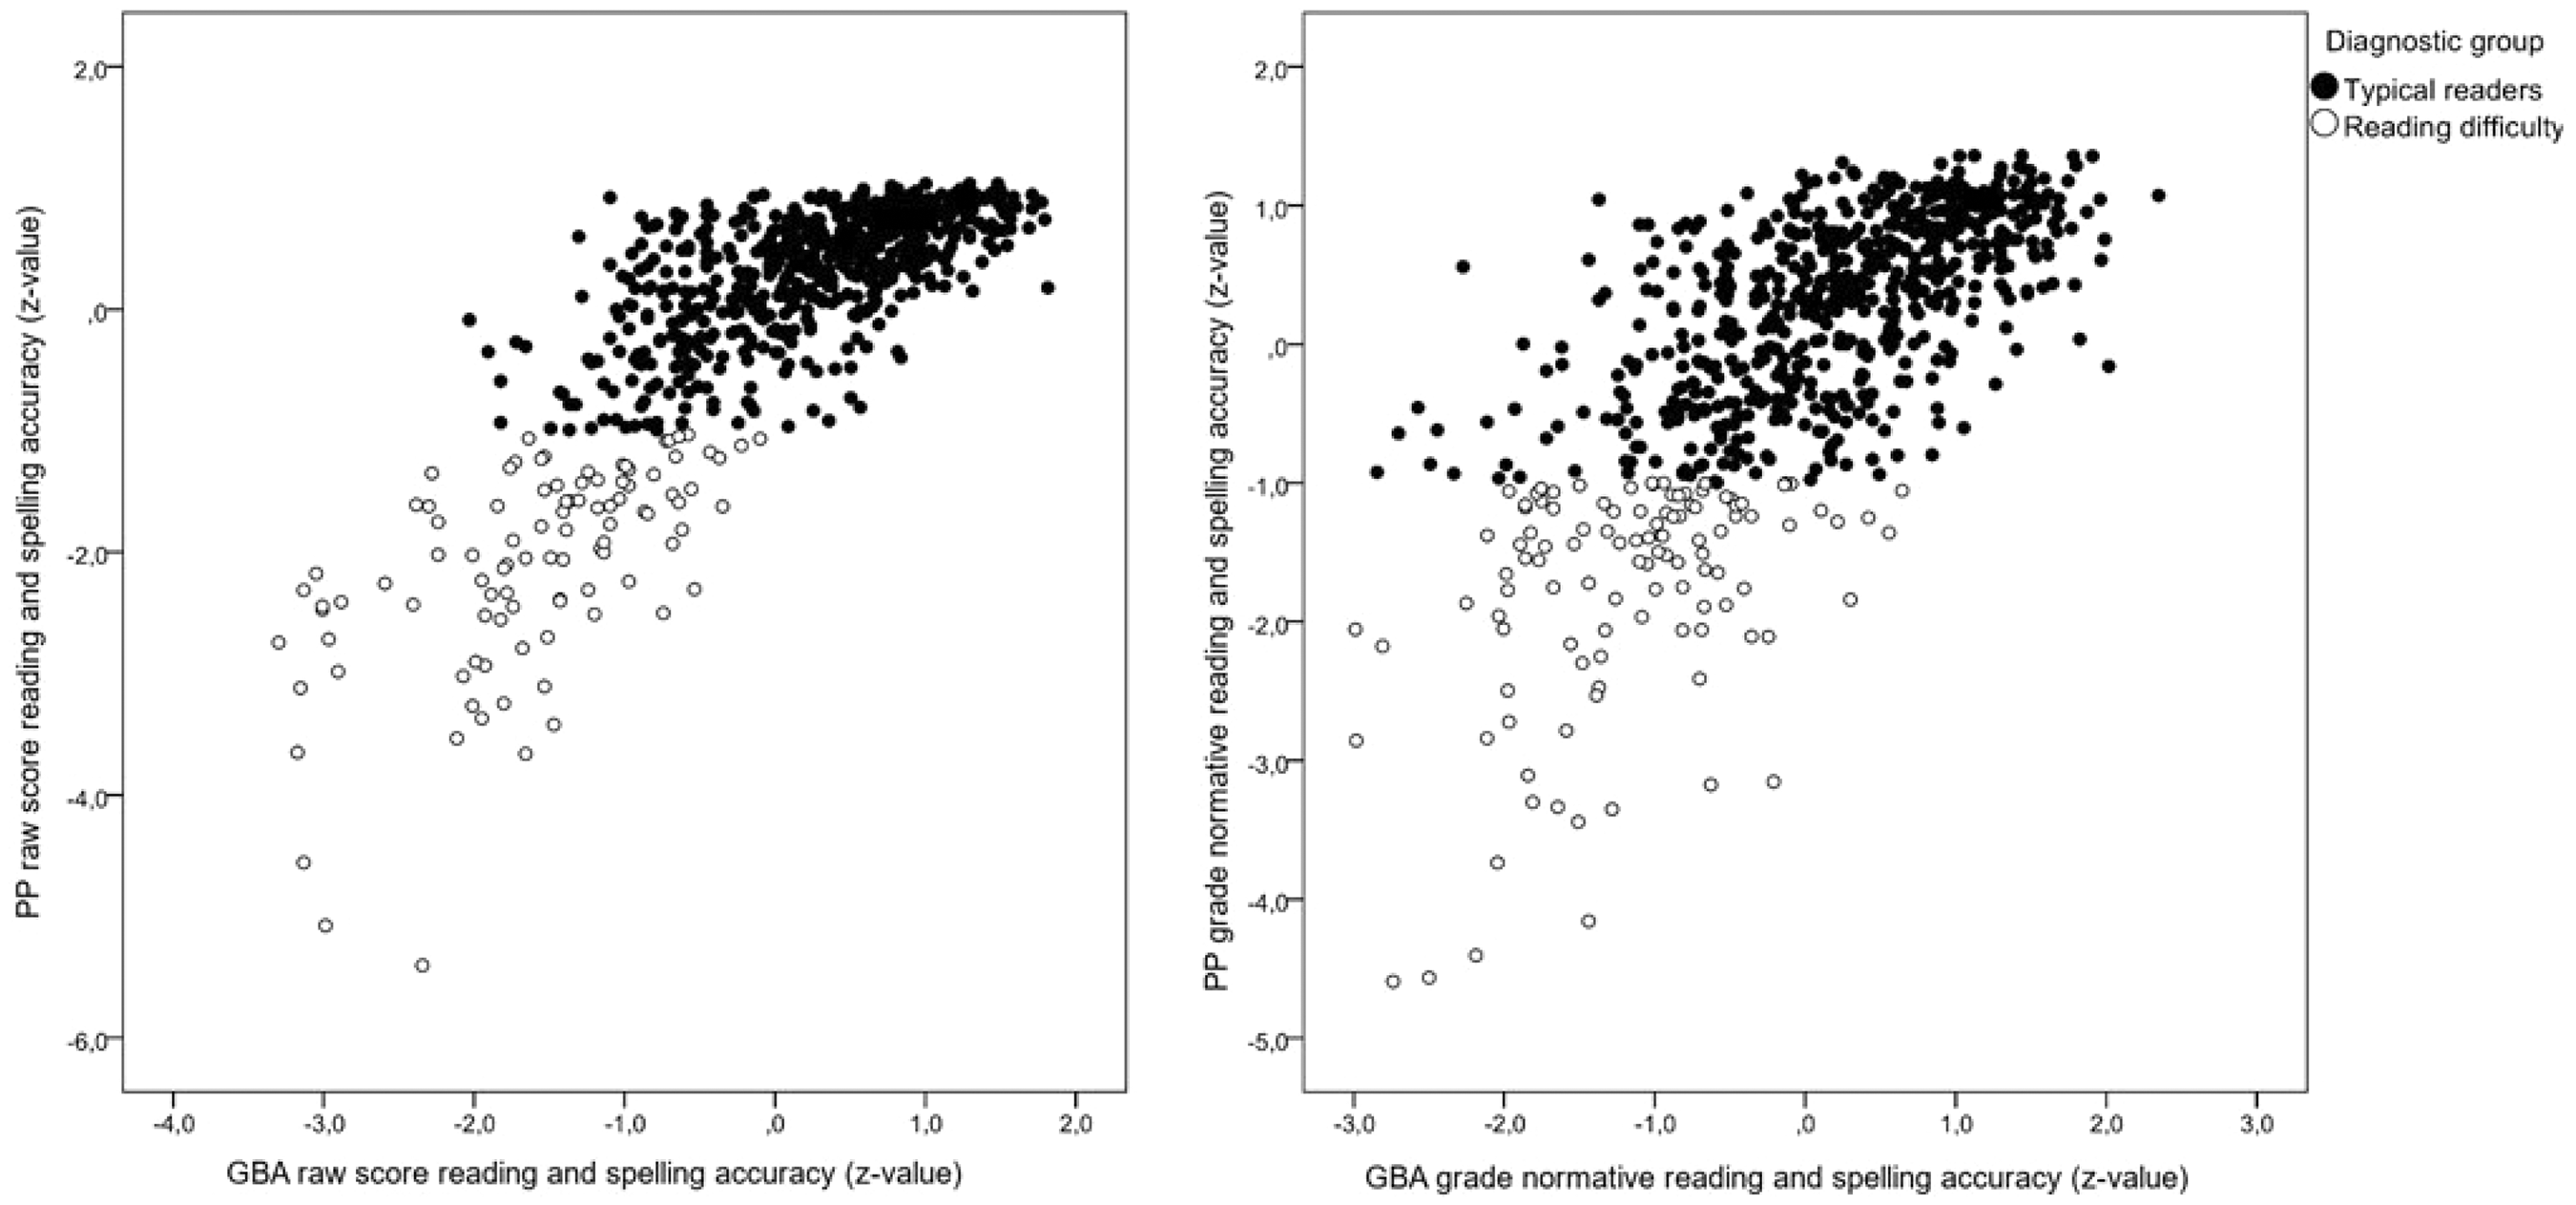
A scatterplot of raw scores (left panel) and grade-normative scores (right panel) accuracy in PPT (vertical axis) and GBA (horizontal axis). Black dots represent readers performing above –1 SD and circles below 1 SD in terms of accuracy in PPT assessment.
Discussion
This study demonstrates that reading difficulties of primary school students, traditionally identified by individually administrated reading skill assessment in the paper-and-pencil form, can be reliably identified by corresponding GBA tasks, aligning with previous findings with highly matching PPT and CBA assessments (Kingston, 2009; Wang et al., 2008), group-delivered computerized assessments (DeGraff, 2005; Protopapas et al., 2008), and a predictive screening for dyslexia risk with GBA assessments (Carson et al., 2014; Puolakanaho & Latvala, 2017). Our results were especially encouraging for identifying reading difficulty in terms of performance measured in raw scores: With the predefined 95% sensitivity level, we maintained the high specificity value of 91% even when including both reading fluency and accuracy criteria for reading difficulty. The identification was less successful in terms of grade-normative skill, in which specificity of 78.4% was obtained for reading fluency problems with the logistic regression method and 74.7% with 92.5% sensitivity level for reading fluency or accuracy diagnosis with the decision tree classification method. These findings indicate that our GBA measures in terms of performance raw scores can reliably be used to assess reading and spelling skills. Furthermore, the GBA raw scores can be used to guide reading instruction as such and especially within educational computer games for reading. On the other hand, our GBA grade-normative measures by themselves are useful for initial screening of reading difficulties, but supplementary clinical assessments may be required for confirming possible reading difficulties.
Our data analyses revealed that typical readers made relatively more errors in GBA tasks in comparison with PPT tasks, possibly due to following reasons: (a) Selections via tablets’ touch screens are somewhat error-prone, (b) word and pseudoword recognitions tasks in multiple-choice format in GBA may require slightly different, proofreading type of attentional processing relative to reading aloud word lists in the PPT format, and (c) our distractors in GBA tasks were generally difficult ones based on small linguistically defined differences between the target and distractors, for example, distractor words differing from the target by a single letter. Nevertheless, most of the inaccurate readers were also slow readers and were, therefore, identified by the reading fluency criteria in GBA. It could also be argued that the skill assessments with our GBA provide more information than the assessments with the traditional PPT (Greiff et al., 2015; Ramalingam & Adams, 2018). Therefore, although the grade-normative data from GBA was less sensitive when compared with PPT data, it could be that our GBA was more sensitive in finding subtle differences in students’ skills, and this kind of information could be useful for picking out students who seemingly are typically developing readers but who might in fact be borderline cases and might benefit from some extra attention and instruction to improve their reading skills further. Obviously, this factor should be investigated further in the future studies.
Generally, the identification was improved if performance in several tasks (two sentence comprehension tasks, word and pseudoword reading, word and pseudoword spelling tasks) was used to identify reading difficulties. This is most likely due to increased reliability of the assessment, knowing the considerable test–retest variability of any psychometric tests (for a discussion of reliability of reading assessments, see Fletcher, Francis, Morris, & Lyon, 2005; Valencia et al., 2010). Based on our results in terms of performance raw scores, a well-working option is to present two sentence comprehension tasks to assess reading fluency, and word and pseudoword spelling tasks to assess accuracy. However, if one is interested in assessing grade-normative skill, one should present all of the GBA tasks for reliable identification of reading difficulties. As the grade-specific analysis showed, the specificity level obtained is dependent on the performance of few individual students. For this end, it may be more reasonable to loosen the sensitivity criteria, as it may be unrealistic for any test to cover all possible forms of underperformance in a given test situation.
Our findings of discrepancies between PPT and GBA assessment performances align with validation studies of computerized psychometric tests (Kingston, 2009; Wang et al., 2008). When developing GBA assessment tasks, it is a good idea to try to match the cognitive requirements with the reference task as much as feasible. However, standard diagnostic PPT reading tests are typically not designed to tap the specific cognitive and linguistic problems a student experiences in reading (for a review of oral reading fluency tests, see Hudson, Lane, & Pullen, 2005). Such information would be especially important for adapting instruction both within special education and reading game contexts; therefore, there seems to be a need to develop more specific assessment instruments for both PPT and GBA domains. Such measures could be used when reading difficulties are first detected with more global reading assessments like those presented in this study.
Implications for Practice
The presented results are in line with previous encouraging findings of screening reading difficulties predictively by preliteracy CBA/GBA measures of phonological awareness, letter knowledge, and related cognitive skills (Carson et al., 2014; Puolakanaho & Latvala, 2017). Thus, we conclude that assessing reading skills and screening reading difficulties is possible with rather simple and short online game-based tasks and an immediate and automatic scoring system, providing, therefore, a great opportunity to develop, update, and facilitate reading assessment globally.
However, the results presented in this study reflect a supervised group assessment in a classroom environment in which the teacher provided the devices and instructed students to play the assessment games. For future research, similar investigation should be conducted in informal settings to see whether GBA would be successful also in unsupervised playing situations, thus, facilitating reading skills assessments even further. Although the reliability of GBA assessment may require supervision, the benefits of GBA over PPT assessments include easy administration, automatic scoring and reporting, and the maintenance of the system including updating of normative data. Research and development efforts are encouraged to validate GBA reading assessment instruments in informal settings and other language environments.
Importantly, the type of GBA designed for this study can be directly applied to a digital reading intervention game environment. The GBA can be used to provide the conventional information regarding reading skill level, but it can also provide detailed (quality and quantity) information about any progress in reading skill development during and after the gamified intervention. Furthermore, the data gathered from various types of tasks of the GBA can be directly used for providing appropriate skill level and individual adaptive training content for learners. This kind of usage of GBA could have significant impact on improving reading skills of learners with different types of learning skills.
Appendix A
Task-Specific Correlation Matrix Measured in Raw Scores within GBA (below diagonal) and within PPT (above diagonal).
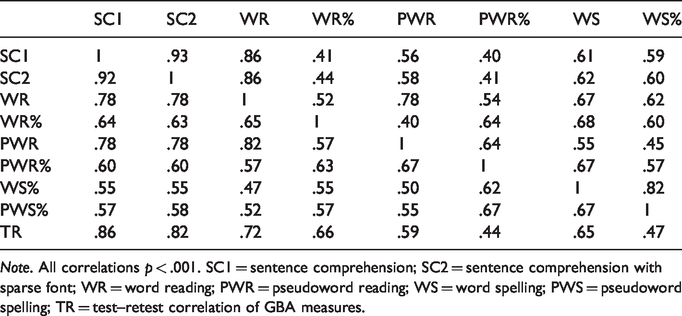
Note. All correlations p < .001. SC1 = sentence comprehension; SC2 = sentence comprehension with sparse font; WR = word reading; PWR = pseudoword reading; WS = word spelling; PWS = pseudoword spelling; TR = test–retest correlation of GBA measures.
Task-Specific Correlation Matrix Between Paper-and-Pencil (Columns) and Game-Based Assessment (Rows) Measures.
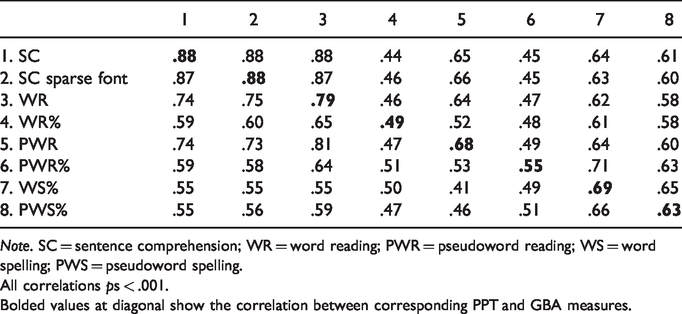
Note. SC = sentence comprehension; WR = word reading; PWR = pseudoword reading; WS = word spelling; PWS = pseudoword spelling.
All correlations ps < .001.Bolded values at diagonal show the correlation between corresponding PPT and GBA measures.
Appendix B
Correlations Between Game-Based and Paper-and-Pencil Composite Measures for Grade-Normative (Left Column) and Raw Scores (Right Column).
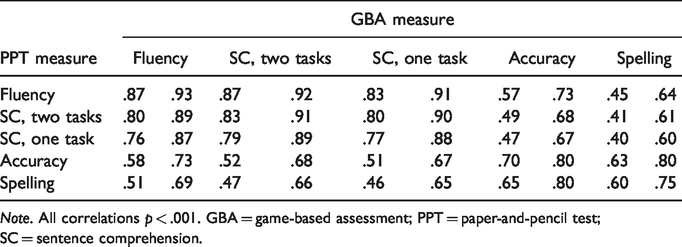
Note. All correlations p < .001. GBA = game-based assessment; PPT = paper-and-pencil test; SC = sentence comprehension.
Footnotes
Acknowledgments
The authors thank Katja Korhonen and Maija Pocknell for working as research coordinators in the project, the numerous research assistants taking part in data gathering at schools, and the teachers and students taking part in our study.
Declaration of Conflicting Interests
The authors declared no potential conflicts of interest with respect to the research, authorship, and/or publication of this article.
Funding
The authors disclosed receipt of the following financial support for the research, authorship, and/or publication of this article: This research was funded by the Academy of Finland’s Future Knowledge and Skills funding program for the project “Technology-enhanced environment for supporting reading development in all learners (ReadAll)” with grants 274050 and 274190 for the years 2014–2017. In addition, this research has been funded by Fondation Botnar, and working of J. H. for years 2018–2023 was supported by the grant 319911 from Academy of Finland; working of R. H. for years 2016–2018 was supported by the grant 277340 from Academy of Finland.