
Abstract
Despite extensive international research on economies of scale in municipal service delivery, the topic remains underexplored in South Africa and Africa. This study aims to address this gap by examining the relationship between municipality size—measured by population size and staff numbers—and economies of scale in the municipal service delivery. Drawing on data from district and metropolitan municipalities between 2016/17 and 2019/20 and employing regression analysis, the results show a significant U-shaped relationship between both population size and total expenditure and staff numbers and total expenditure. Importantly, these effects vary between metropolitan and district municipalities. For example, expenditure tends to decrease with increasing population size up to a threshold of approximately 158,000 residents, beyond which diseconomies of scale emerge. These insights offer practical implications for regional planning and service delivery strategies, particularly in guiding decisions on municipal consolidation and resource allocation.
Introduction
Municipal size, whether defined by population, geography, or political representation, influences the efficiency of public service delivery. As a result, determining the optimal size of municipalities is of interest to both policymakers and researchers (Bikker & van der Linde, 2016; G. Boyne, 1995). The concept of ‘optimal size’ refers to the point at which a municipality’s population or organisational scale achieves economies of scale or maximum cost efficiency.
Several studies indicate that larger municipalities are generally more efficient in delivering services compared to their smaller counterparts (G. Boyne, 1995; Dollery & Johnson, 2005; Gómez-Reino et al., 2023). This efficiency is attributed to their capacity to leverage economies of scale and scope, deliver a wider and higher-quality range of public services, maintain enhanced administrative and technical capabilities, and engage more effectively in lobbying efforts (Andrews & Boyne, 2008; Gómez-Reino et al., 2023; Reingewertz & Serritzlew, 2019). In contrast, smaller municipalities—while fostering closer relationships between politicians and citizens—often encounter inefficiencies stemming from fragmented structures, as well as elevated average and fixed costs (Ncube & Monnakgotla, 2017; Reingewertz & Serritzlew, 2019). These challenges have prompted numerous governments globally to pursue municipal mergers as a strategy for enhancing efficiency and achieving economies of scale (Dollery & Johnson, 2005; Gómez-Reino et al., 2023; Tavares, 2018).
Despite strong a priori arguments both for and against larger municipalities and mergers, the empirical evidence remains mixed (Aiello & Bonanno, 2019; Dollery & Johnson, 2005; Gómez-Reino et al., 2023; Tavares, 2018). For instance, Andrews and Boyne (2009) found that larger municipalities in England incurred lower administrative costs, thus supporting the notion that mergers can yield economies of scale. Conversely, research conducted by Drew et al. (2016) in Australia and Allers and Geertsema (2016) in the Netherlands reported no significant cost savings or fiscal improvements resulting from mergers. Similarly, Kunizaki (2019) found only marginal cost savings in merged municipalities in Japan when compared to those that chose to remain independent. In South Africa, Tshabalala and Gunter (2023) determined that municipal mergers in Ekurhuleni did not significantly enhance service delivery or reduce costs. Consequently, these studies indicate that the relationship between municipal size and efficiency varies by national context and the type of service provided (G. Boyne, 1995; Gómez-Reino et al., 2023; Tavares, 2018). This finding underscores the necessity for more context-specific empirical research, particularly in South Africa, where existing evidence is scarce (Tshabalala & Gunter, 2023).
This study contributes to the ongoing debate by examining the existence of economies of scale in South African local government, with a particular emphasis on public service delivery, using panel data from 2016/17 to 2019/20. South Africa presents a compelling case due to its complex history of racial and spatial inequalities in local governance, which are rooted in the legacy of apartheid (Krugell et al., 2010; Rhodes & McKenzie, 2018). Thus, municipal amalgamations in South Africa are driven not only by considerations of efficiency but also by broader socio-political goals, such as deracialising local governments, promoting equity between historically disadvantaged and advantaged municipalities, and integrating rural and urban areas (Ncube & Monnakgotla, 2017). These objectives underscore the importance of examining whether economies of scale are realised and how they may contribute to addressing historical imbalances.
Furthermore, the local government structure in South Africa is characterised by unusually large municipalities, which have fewer administrative units, larger populations, and higher citizen-to-councillor ratios compared to many other countries (Ncube & Monnakgotla, 2017; OECD/UCLG, 2022). These features raise concerns regarding efficiency. Thus, we investigate the relationship between municipal size and cost efficiency to determine the optimal scale for efficient municipal operations.
The second objective of this study is to determine whether contextual factors, such as municipal type, population density and revenue sources, influence economies of scale. These factors have been found to affect municipal performance in other countries (Narbón-Perpiñá & De Witte, 2018a, 2018b; C. T. T. Tran & Dollery, 2021; Yarram et al., 2022). Accordingly, they need to be considered when estimating and comparing municipal performance, since ignoring them can bias economies of scale and efficiency measures (Aiello & Bonanno, 2019; Milán-García et al., 2022).
From a policy perspective, understanding the impact of these factors can aid policymakers in identifying key determinants of economies of scale to enhance efficiency. For instance, municipalities characterised by higher population densities are expected to deliver services more efficiently due to economies of scale, whereas those with lower densities may face inefficiencies (Krugell et al., 2010). Additionally, the type of municipality can significantly influence performance (Monkam, 2014). In our analysis, we accounted for these variations by including Category A (Metropolitan Municipalities), which are single-tier entities that possess both legislative and executive authority and govern large, densely populated urban areas with complex economies (G. Dube & Radikonyana, 2020). We also included Category C (District Municipalities), which share authority with local municipalities, cover larger, often rural regions, and coordinate development and service delivery across multiple local municipalities (G. Dube & Radikonyana, 2020).
The remainder of the paper is structured as follows: Section 2 reviews the literature on economies of scale and outlines the research hypotheses. Section 3 provides institutional context on South African local government. Section 4 describes the methodology, followed by empirical results in Section 5. Section 6 discusses the findings and Section 7 concludes with policy implications.
Economies of Scale in Local Government: Literature Review and Hypothesis
Determining the optimal size of municipal governments involves considering whether cost savings could be achieved by making jurisdictions larger or smaller (Oates, 1972). This concept pertains to economies of scale, which arise when all inputs increase by a given factor X, yet output expands by more than that factor (Panzar & Willig, 1977). More broadly, they occur when jurisdictions can produce a greater quantity of goods or services without a proportional increase in production costs (Gómez-Reino et al., 2023). Most governments around the world face administrative constraints, prompting municipal amalgamations as a solution to governance problems, eliminating dysfunction, and fostering optimal financial performance, autonomy and sustainability (Ncube & Monnakgotla, 2017).
However, the empirical evidence on whether large or smaller local governments are better is mixed. For example, whilst in their systematic review they found a substantial number of studies on public service efficiency generally improving with scale (Gómez-Reino et al., 2023), they also note that this is not linear, as gains tend to plateau for jurisdictions with populations exceeding 10,000 residents. They also noted that economies of scale vary by service type, with education showing the greatest potential and garbage collection the least. In one of the earliest studies on this topic, Hirsch (1959) found that economies of scale in public service provision often diminish beyond certain population thresholds, for example, firefighting services tend to be more cost-efficient in municipalities with fewer than 100,000 residents, while average costs increase above that level.
Several studies, particularly in advanced economies, have reported mixed results. In Australia, C. Tran et al. (2019) found that categorising municipalities based on population density eliminated the evidence for economies of scale. Yarram et al. (2022) indicated that the size of local government councils, in terms of population, follows a ‘U’-shaped relationship with the administrative costs of local councils in urban areas. Conversely, C. T. T. D. Tran and Dollery (2022) identified an inverted U-shaped relationship between population size and administrative costs for local government in Victoria, suggesting the presence of diseconomies of scale.
In Europe, Bikker and van der Linde (2016) identified the diseconomies of scale among Dutch municipalities, estimating an average inefficiency of approximately 17%. Their analysis suggests that the optimal municipal size lies between 49,000 and 66,260 inhabitants. Solé-Ollé and Bosch (2005) found that Spanish municipalities with fewer than 5,000 residents experienced significant economies of scale. However, their study also noted that service delivery costs began to rise once municipal populations exceeded approximately 50,000. In the UK, Andrews and Boyne (2009) found that larger local governments generally incurred lower administrative costs compared to smaller, lower-tier municipalities. Their findings support the notion that merging smaller municipalities, counties and districts into unitary authorities could yield economies of scale.
In developing economies, research on this topic remains relatively scarce compared to advanced economies, despite the substantial challenges these countries face. Rapid urban growth has intensified the demand for expanded public services, new infrastructure and ongoing maintenance, widening the gap between municipal spending needs and available financial resources (OECD/UCLG, 2022; South African Cities Network [SACN], 2020). In Malaysia, Ting et al. (2014) found that administrative efficiency peaks within a population range of 150,000 to 200,000. In Brazil, Bernardelli et al. (2020) observed that larger municipalities tend to spend less per capita, indicating greater efficiency, while smaller municipalities often operate below optimal scale, highlighting the need for structural reforms or amalgamations. These efficiency gains remained significant even after controlling for population density and other variables. In China, Liu et al. (2017) identified scale efficiency as the dominant factor influencing municipal infrastructure performance, particularly in larger jurisdictions. Collectively, these studies suggest that while larger municipalities can achieve efficiency gains, outcomes are highly contingent on governance quality, infrastructure capacity and broader socio-economic conditions.
In South Africa, evidence on the optimal size of municipalities and the presence of economies of scale remains complex and inconclusive. Compared to international benchmarks, local government performance is generally poor, with efficiency scores ranging from 0.17 to 0.64 (Mahabir, 2014; Monkam, 2014; Narbón-Perpiñá & De Witte, 2018a; Temoso et al., 2025; Van der Westhuizen & Dollery, 2009). This underperformance persists despite repeated policy interventions, including municipal amalgamations aimed at improving service delivery and financial management. Tshabalala and Gunter (2023) argue that amalgamations, often justified by presumed economies of scale, have not consistently led to improved outcomes. Unlike in European contexts, where optimal size thresholds are more clearly defined, South African municipalities face structural and contextual constraints that limit the realisation of scale efficiencies. As a result, blanket amalgamation strategies are insufficient and call for more tailored, context-sensitive reforms. Cameron and Milne (2013) note that while larger entities may perform better in certain domains, they often suffer from administrative remoteness and diminished democratic accountability. B. Dube (2021) critiques the uncritical adoption of international models, emphasising that such approaches frequently overlook local governance weaknesses and socio-cultural dynamics. For instance, in the Vhembe District, boundary changes disregarded ethnic identities and failed to deliver fiscal benefits, with some municipalities becoming increasingly dependent on central government transfers.
These findings highlight that while economies of scale may present theoretical benefits, their practical application in South Africa is hampered by limitations in governance capacity, political dynamics and socio-economic conditions. Municipalities are tasked with meeting the fundamental needs of disadvantaged communities while operating under constrained budgets and limited technical resources (SACN, 2020). Furthermore, public scrutiny adds a layer of complexity to the evaluation of potential efficiency gains (Tshabalala & Gunter, 2023). Drawing on the literature on the non-linear relationship between population and costs, we hypothesise that the size of municipalities in South Africa will affect scale economies and efficiency in a similar non-linear way:
One factor to consider when deciding on the optimal size of municipal governments is whether cost savings can be realised by expanding or contracting jurisdictions. Municipalities in South Africa vary greatly, ranging from metro to district level. For example, the Central Karoo District Municipality in the Western Cape has only 74,000 residents, equating to a population density of about two persons per square kilometre. By contrast, the City of Cape Town Metropolitan Municipality in the same province has consolidated its city and municipal governments so that a single local government serves its more than 4 million residents, which equates to 1,638 persons per square kilometre (South African Local Government Association [SALGA], 2023).
Given the varying population sizes and densities of South African municipalities, the relationship between municipal size and cost savings may be nonlinear. While population size can initially result in economies of scale in coordination, these benefits are eventually replaced by diseconomies of scale as populations grow larger, implying a non-linear form (Andrews et al., 2003; Williamson, 1967). Large metro municipalities, such as Cape Town and the City of Johannesburg, may experience diseconomies of scale due to inter alia to increased complexity and coordination costs.
Local Government in South Africa
Historical Context, Structure, and Municipal Governance
South Africa (SA) is a federal state with three levels of government: national, provincial and local (OECD/UCLG, 2022). Local government is guided by Section 155 of the Constitution, which requires municipalities to promote social and economic development of their citizens by providing essential services such as water, sanitation, electricity, waste management and infrastructure maintenance (Auditors General South Africa [AGSA], 2022; South African Government, 1998). This requires municipalities to be inclusive, democratic, and accountable—promoting transparency, performance and the institutional integrity to improve quality of life (AGSA, 2022). These goals aim to address the legacy of apartheid (1948–1994), where municipal boundaries were racially defined, resulting in duplicated administrations and unequal resource distribution (Ncube & Monnakgotla, 2017; Reddy, 2016). Municipalities are also guided by Section 229 of the Constitution, which gives them financial autonomy to generate their revenue through taxes, property rates, service charges, levies and charges (South African Government, 1998).
In 1998, the Municipal Demarcation Board (MDB) was established to redraw municipal boundaries and unify local governance, aiming to address disparities inherited from apartheid and strengthen governance while expanding the tax base (SALGA, 2015). This process involved merging affluent, predominantly white municipalities—characterised by large tax bases and low populations—with poorer, predominantly black municipalities serving densely populated townships with limited resources (Ncube & Monnakgotla, 2017; Rhodes & McKenzie, 2018). The MDB used criteria such as economic viability, geography and population size when determining whether these mergers would improve governance, service delivery and sustainability (SALGA, 2015).
Since 2000, South Africa has reduced its number of municipalities from over 800 to 257 by 2016 through a series of amalgamations, resulting in significantly larger municipal units (G. Dube & Radikonyana, 2020; Ncube & Monnakgotla, 2017). These 257 municipalities can be divided into three categories: A, B, and C (Adedeji Amusa & Fadiran, 2024). Category A comprises eight metropolitan serving large urban areas with populations exceeding 1 million, such as Johannesburg, Cape Town, Durban and Pretoria. Metropolitan municipalities have exclusive executive and legislative authority in their respective areas (South African Government, 1998). They generally have larger budgets, more resources and account for the largest share of local government spending in the country (AGSA, 2022). Their greater administrative capacity and ability to attract skilled professional staff is expected to contribute to improved service delivery than non-metropolitan counterparts (Temoso et al., 2025).
Non-metropolitan areas including secondary cities, towns and rural areas are primarily served by 44 districts (Category C) municipalities and 205 local (Category B) municipalities (South African Government, 1998). District municipalities can be further broken down into C1 and C2 districts. C2 districts have a stronger service delivery role, including water and sanitation, while C1 districts do not provide water and sanitation, but focus on coordination and supporting local municipalities offering these services (South African Government, 1998). Similarly, local municipalities can be divided into several categories: B1, mostly serving secondary cities, B2 serving large towns, B3 serving small towns and B4 serving mostly rural areas.
Unlike metropolitan municipalities where they are solely responsible for the affairs in their area, district municipalities share authority with local municipalities. Districts typically comprise of several local municipalities, and they are responsible for providing integrated development planning, bulk infrastructure, and shared services, whilst local municipalities are primarily responsible for delivering essential services such as water and sanitation directly to the citizens (Temoso et al., 2025). The Constitution requires district municipalities to promote economies of scale by pooling resources and ensuring an equitable distribution of services across local municipalities.
The Constitution grants municipalities several revenue raising powers, which enables them to fund their service delivery. The main source for their budget about 65% comes from property rates and service user fees (Amusa & Fadiran, 2024). However, disparities in the population size, level of development and resource endowments, implies that the ability to raise revenue differs widely across municipalities. To address this, the Constitution guarantees them an equitable share of nationally collected revenue (AGSA, 2022).
Given these differences, we expect district and metropolitan economies of scale to vary. Metropolitan municipalities often benefit from centralised services, which reduce duplication and improve efficiency. In contrast, districts, particularly Category C1, may struggle to achieve economies of scale due to limited direct service provision, leading to fragmented investment and higher costs (Temoso et al., 2025).
Basic Service Delivery, Inefficiency, and Inequity
Since 1994, South Africa has introduced various reforms to address inequalities and redistribute resources, notably through its Reconstruction and Development Programme (RDP), with the objective of providing basic needs (housing, sanitation, water and other services) and correcting historical inequalities in municipal service delivery (Krugell et al., 2010; SALGA, 2023). The 1998 Local Government White Paper further mandates that municipalities ensure service accessibility, affordability and quality (South African Government, 1998).
Municipal amalgamations in South Africa have not consistently resulted in cost savings or improved service delivery (Krugell et al., 2010). As highlighted in the Auditor General’s report (AGSA, 2022), decades of service delivery failures, coupled with council and administrative instability, financial mismanagement, weak institutional capacity, and a disregard for the law, have placed this sphere of government under immense pressure to restore public trust. These challenges stem from various factors, including municipal capacity constraints characterised by poor accountability and governance, cadre employment and pervasive corruption (Kanyane, 2014; Levy et al., 2021; Reddy, 2016).
According to the AGSA (2022) report, the overall state of municipal finances remains troubling, with only 34 (13%) municipalities achieving satisfactory audit results. While 45 municipalities have shown improvement in their audit outcomes since 2020–21, 36 have experienced a decline. Municipalities are grappling with significant challenges in legislative compliance, with 86% receiving material compliance findings, as well as issues related to poor financial management and infrastructure neglect (AGSA, 2022). Moreover, prolonged creditor payment periods, particularly to Eskom and Water Boards, have exacerbated these challenges (National Treasury, 2022). Consequently, these issues have led to revenue losses and elevated unauthorised expenditures, stemming from weak financial planning and inefficient procurement practices (AGSA, 2022).
A stable, well-resourced and competent municipal administration is essential for progress. However, in South Africa, cadre employment, where individuals are appointed to key positions based on political connections rather than qualifications, is a major factor in spawning municipal financial problems (Parliamentary Monitoring Group, 2019). Another significant factor, especially in rural district municipalities, is the high vacancy rate in senior management and technical positions. This hinders the implementation of basic financial and performance management, planning, budgeting and project monitoring (AGSA, 2022). To bridge these gaps, many municipalities rely on consultants or appoint acting managers. The state of local government finance and financial management report highlights an increase in acting municipal managers from 50 in 2020 to 70 in 2021 (National Treasury, 2022). However, the use of acting managers and consultants may lead to inefficiencies, as they often focus on short-term fixes rather than sustainable solutions. This results in decision-making challenges and lower-quality service delivery. Frequent leadership changes decrease employee morale and productivity, while the lack of long-term strategic planning hinders the municipality’s ability to address future challenges. These issues are likely to vary by municipality, affecting economies of scale and efficiency in service delivery differently.
Method of Analysis
Empirical Models
To investigate whether economies of scale exist in South African local government and to determine if there are differences by municipality type, we used a multiple regression model with pooled data from the fiscal years 2016/17 to 2018/19. Our sample includes 52 municipalities: 8 metropolitan and 44 district municipalities, totalling 156 observations over 3 years. A dummy variable is included to represent municipality type, where a value of 1 indicates a metropolitan council and 0 indicates a district council. The 3-year study period was chosen since it was the most recent with consistent data across municipalities and through time, including audited financial information. This period also follows significant changes after the 2016 South African elections, where several municipalities merged, demerged and underwent name changes. To ensure consistency in the municipalities and variables analysed, we focussed exclusively on this period. We excluded Local Municipalities (Category B) because some key variables—such as service delivery information—were missing or inconsistent at the time of data collection. As a result, we opted to compare District Municipalities directly to Metropolitan Municipalities. While not all districts provide services directing to residents, we used the net population of the residents (i.e., combined population of all the local municipalities in each district) to ensure the population served, either directly by the district or through its coordination of local municipalities, is captured. We also included dummy variables indicating whether a district provides services directly in our models, which should help minimise potential bias in our analysis. However, considering local municipalities in future analyses might be worthwhile, as their inclusion could provide a more granular analysis of service delivery patterns and their impact on efficiency.
Our empirical model estimates the impact of municipal size, measured by population andjhhh employment, on total expenditure. This estimation controls for population density, municipality type, and other exogenous factors. To enhance robustness, a variance method was employed to filter out unobserved disturbances. The resulting regression equation system is expressed as follows: Lnexp = α + β1Time + β2lnpop + β3(lnpop)2 + β4ln(popdensity) + β5Municipaltype + β6sZ + ε Lnexp = α + β1Time + β2lnstaffsize + β3(lnstaffsize)2 + β4ln(popdensity) + β5 Municipaltype + β6sZ + ε Lnexp = α + β1Time + β2lnpop + β3(lnpop)2 + β4lnstaffsize + β5(lnstaffsize)2 + β6ln(popdensity) + β7Municipal type + β8sZ + ε
In these equations, the dependent variable is total expenditure (lnexp) which is measured by total annual expenditure by each local municipality.
For independent variables, we employed the following variables:
(a) Population measures (lnpop, lnpop2 and lnpopdensity): The relationship between municipality size as measured by population, population density, and total expenditure has been extensively studied in empirical literature (Ting et al., 2014; Yarram et al., 2022). These interactions can be either positive or negative (Andrews & Boyne, 2014). Population size can initially result in scale economies in coordination, but as population size increases, these are replaced by scale diseconomies (Andrews & Boyne, 2003; Williamson, 1967). To investigate the non-linear relationship between population size and expenditure, a quadratic term for population size was added to the model. Furthermore, population density is included in the regression models to investigate its effect on the annual expenditure of municipalities.
(b) Staff size (lnstaffsize, lnstaffsize2): Staff size refers to the number of full-time equivalent (FTE) employees working at local municipalities. Empirical literature has established a positive association between organisational size and municipal expenditure (G. A. Boyne & Meier, 2013; Ford & Slocum, 1977; Kimberly, 1976). To investigate whether the relationship between staff size and expenditure is curvilinear, likely U-shaped, the quadratic term of staff size is included in the model (G. A. Boyne & Meier, 2013; Rutherford, 2016). This relationship may vary based on a proxied variable of employee size and the individual characteristics of local municipalities.
(c) Municipal type: The dummy variable represents the type of municipality, with a value of 1 indicating a metropolitan municipality and a value of 0 indicating a district municipality. In the South African local government system, district municipalities are composed of local municipalities, whereas metropolitan municipalities are stand alone. This paper focuses specifically on these two primary types of municipalities. Regression models incorporate this dummy variable to capture the differences in expenditure between metropolitan and district municipalities. We anticipate that metropolitan municipalities allocate a larger portion of their budget to operational activities compared to their district counterparts. The local government literature supports the use of a dummy variable for municipality type (Yarram et al., 2022).
(d) Contextual variables: The empirical literature has identified relationships between environmental factors and municipal performance (C. T. T. Tran & Dollery, 2021; Yarram et al., 2022). Z is a vector of exogenous variables expected to affect municipal expenditure that includes (1) the responsibility of municipality to provide water, electricity and waste collection to its community is captured through three dummy variables (1 = Yes, 0 = Otherwise); (2) total households and non-domestic customers that receive local public services from local municipalities such as water, electricity, and waste collection; (3) Transfers recognised operating income and (4) other own revenue of local municipalities. The impact of these factors depends on the local circumstances (da Cruz & Marques, 2014; Drew et al., 2016). Cognisant of the extant empirical literature on South African local government (Rhodes & McKenzie, 2018; Van der Westhuizen & Dollery, 2009), we used all these control variables in our empirical analysis.
(e) Time trend: Time is added to the regression models to capture a technological change of municipal expenditure over the reported period of 2016/17 to 2018/19.
(f) Error term: ε is added to the equation to capture the variability of unobserved disturbances.
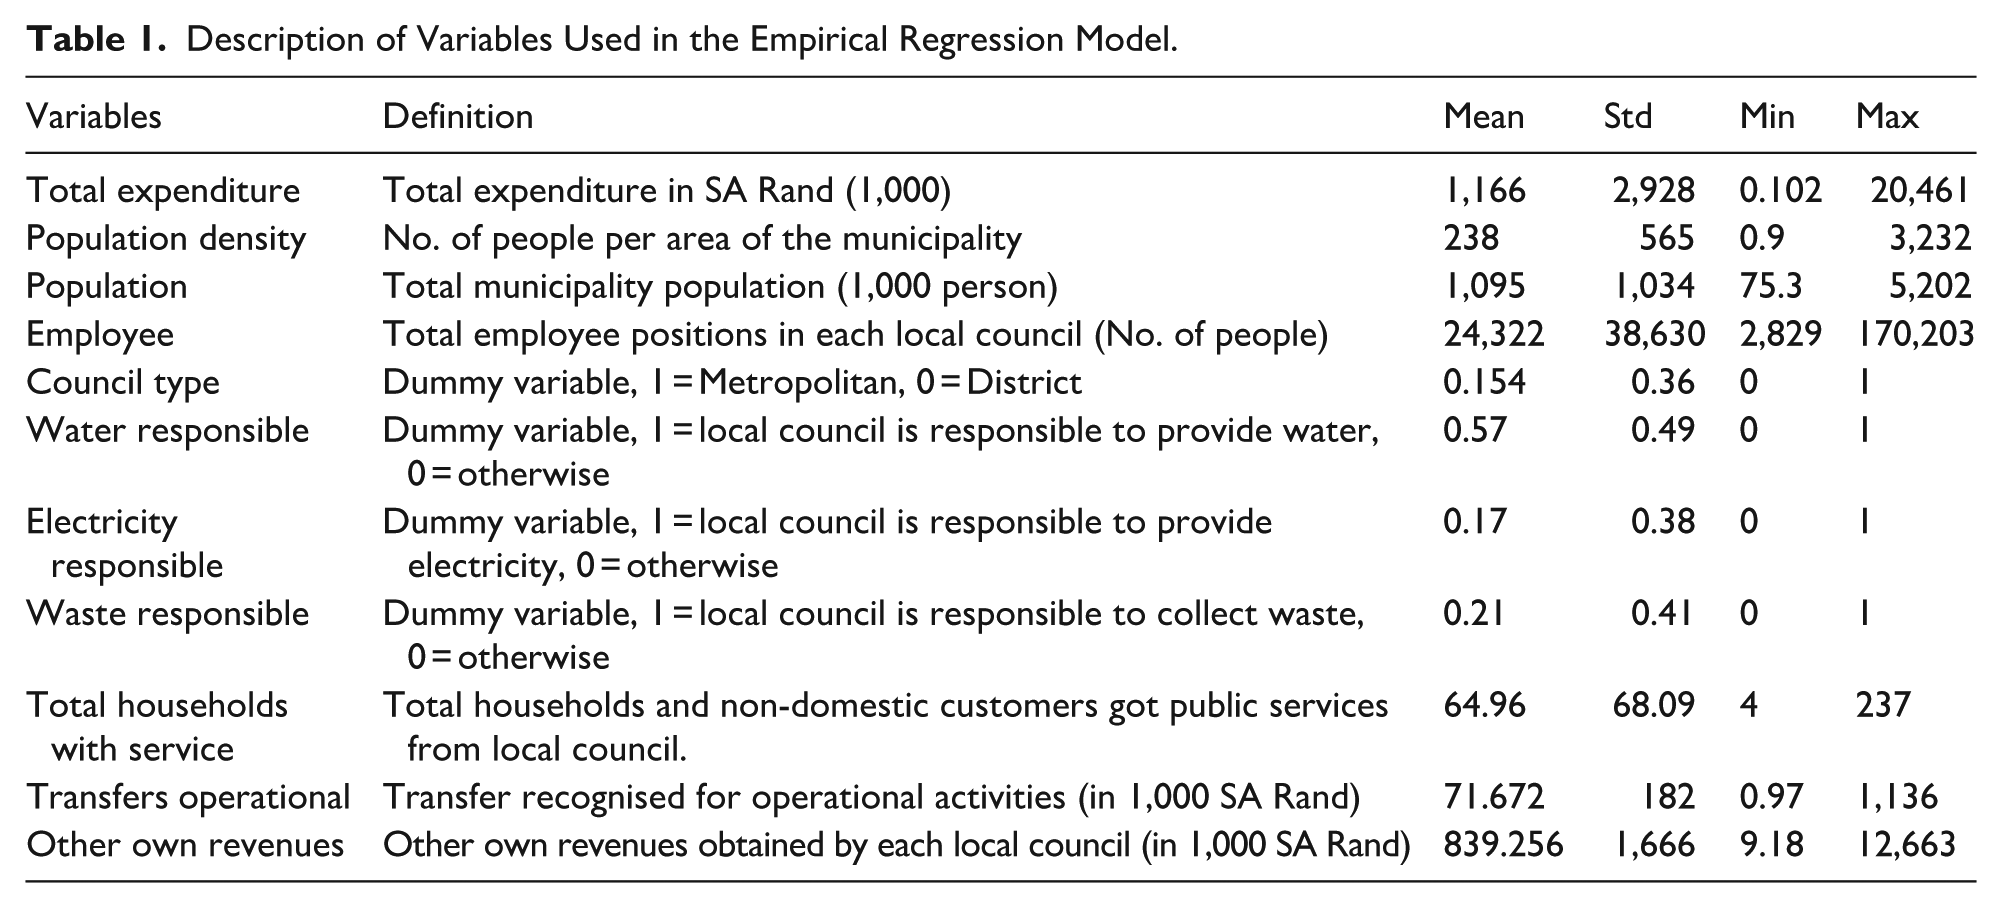
A description of the variables used in the regression models is presented in Table 1.
On average, SA municipalities spend 1.17 million Rand, with significant variation based on population size (0.75 to 5.2 million people). Similarly, staff size averages 24,332, ranging from 2,829 to 170,203. Investigating economies of scale in local government operations, considering the variability in municipality and staff size, is necessary.
Description of Variables Used in the Empirical Regression Model.
Data Sources
The dataset used in this study was obtained from two primary sources: the Municipalities of South Africa website (www.municipalities.co.za) and the Treasury Municipal Data (www.municipalmoney.gov.za). The Municipalities of South Africa website ensures data accuracy by cross-referencing and regularly updating its information. It offers a searchable platform with direct links to relevant source reports. Data is organised into tables for each municipality, covering the last five financial years, and includes factors such as financial management, demographics and service delivery.
Financial data, including audit outcomes, is drawn from the Consolidated General Report on the Audit Outcomes of Local Government, published annually by the Auditor-General South Africa (AGSA). These reports, available at www.agsa.co.za, categorise financial results into various outcomes like clean, qualified, and unqualified audits. Demographic data is sourced from municipalities.co.za, which compiles information from Statistics South Africa (Stats SA), including the 2011 Census and the 2016 Community Survey. Employment statistics come from Stats SA’s non-financial census of municipalities, specifically from the Statistical Release P9115 Unit Data, accessible at statssa.gov.za. Additionally, comprehensive service delivery statistics are available on municipalities.co.za, also sourced from the non-financial census published by Stats SA.
Validity and Robustness
To ensure that multicollinearity was not present, we conducted a variance inflation factor (VIF) test for each model. The VIF is a commonly used method to assess multicollinearity in regression analysis, as it indicates how much the variance (or standard error) of an estimated regression coefficient is inflated due to collinearity. The results revealed that all VIF values were below 5, which adheres to the accepted threshold for confirming the absence of multicollinearity (C. T. T. Tran & Dollery, 2021).
Empirical Findings
As we have noted earlier, the primary aim of this paper is to determine whether scale economies exist in the SA local government system. Additionally, we seek to investigate the association between expenditure and municipality type, considering the impact of population size, staff size and municipal type.
Table 2 presents the estimated regression results for the whole sample, showing two models for the relationship between total expenditure and population size, considering contextual factors. Table 3 shows the association between total expenditure and staff size based on the empirical models detailed earlier in Section 4. All models are statistically significant at the 1% level, with R2 values ranging from .921 to .934. This indicates that the independent variables in the model explain over 90% of the variation in total expenditure, suggesting that population size and related control variables effectively account for expenditure differences among South Australian councils during the study period.
The Influence of Population Size on Total Expenditure of South African Local Government for the Period 2017 to 2019.
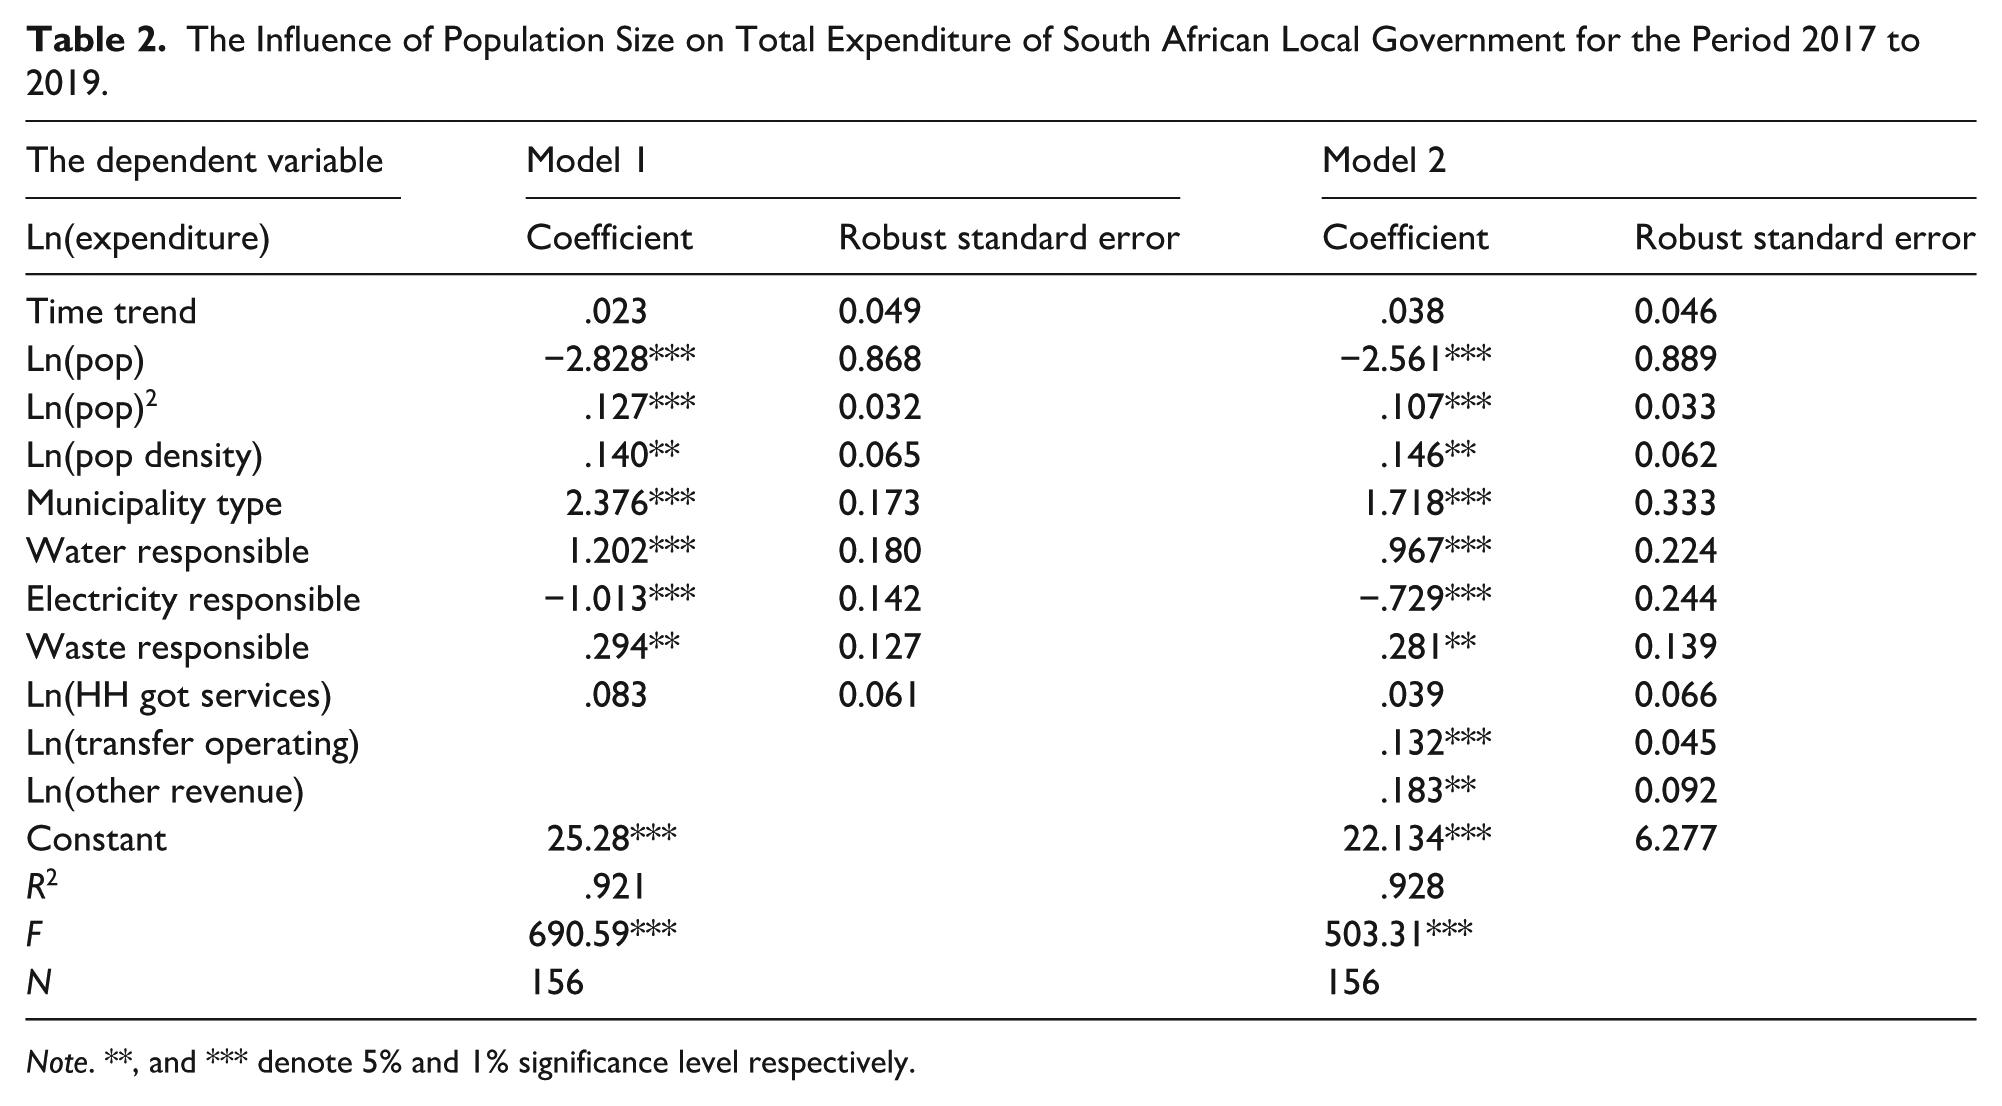
Note. **, and *** denote 5% and 1% significance level respectively.
The Influence of Staff Size on Total Expenditure of South African Local Government for the Period 2017 to 2019.
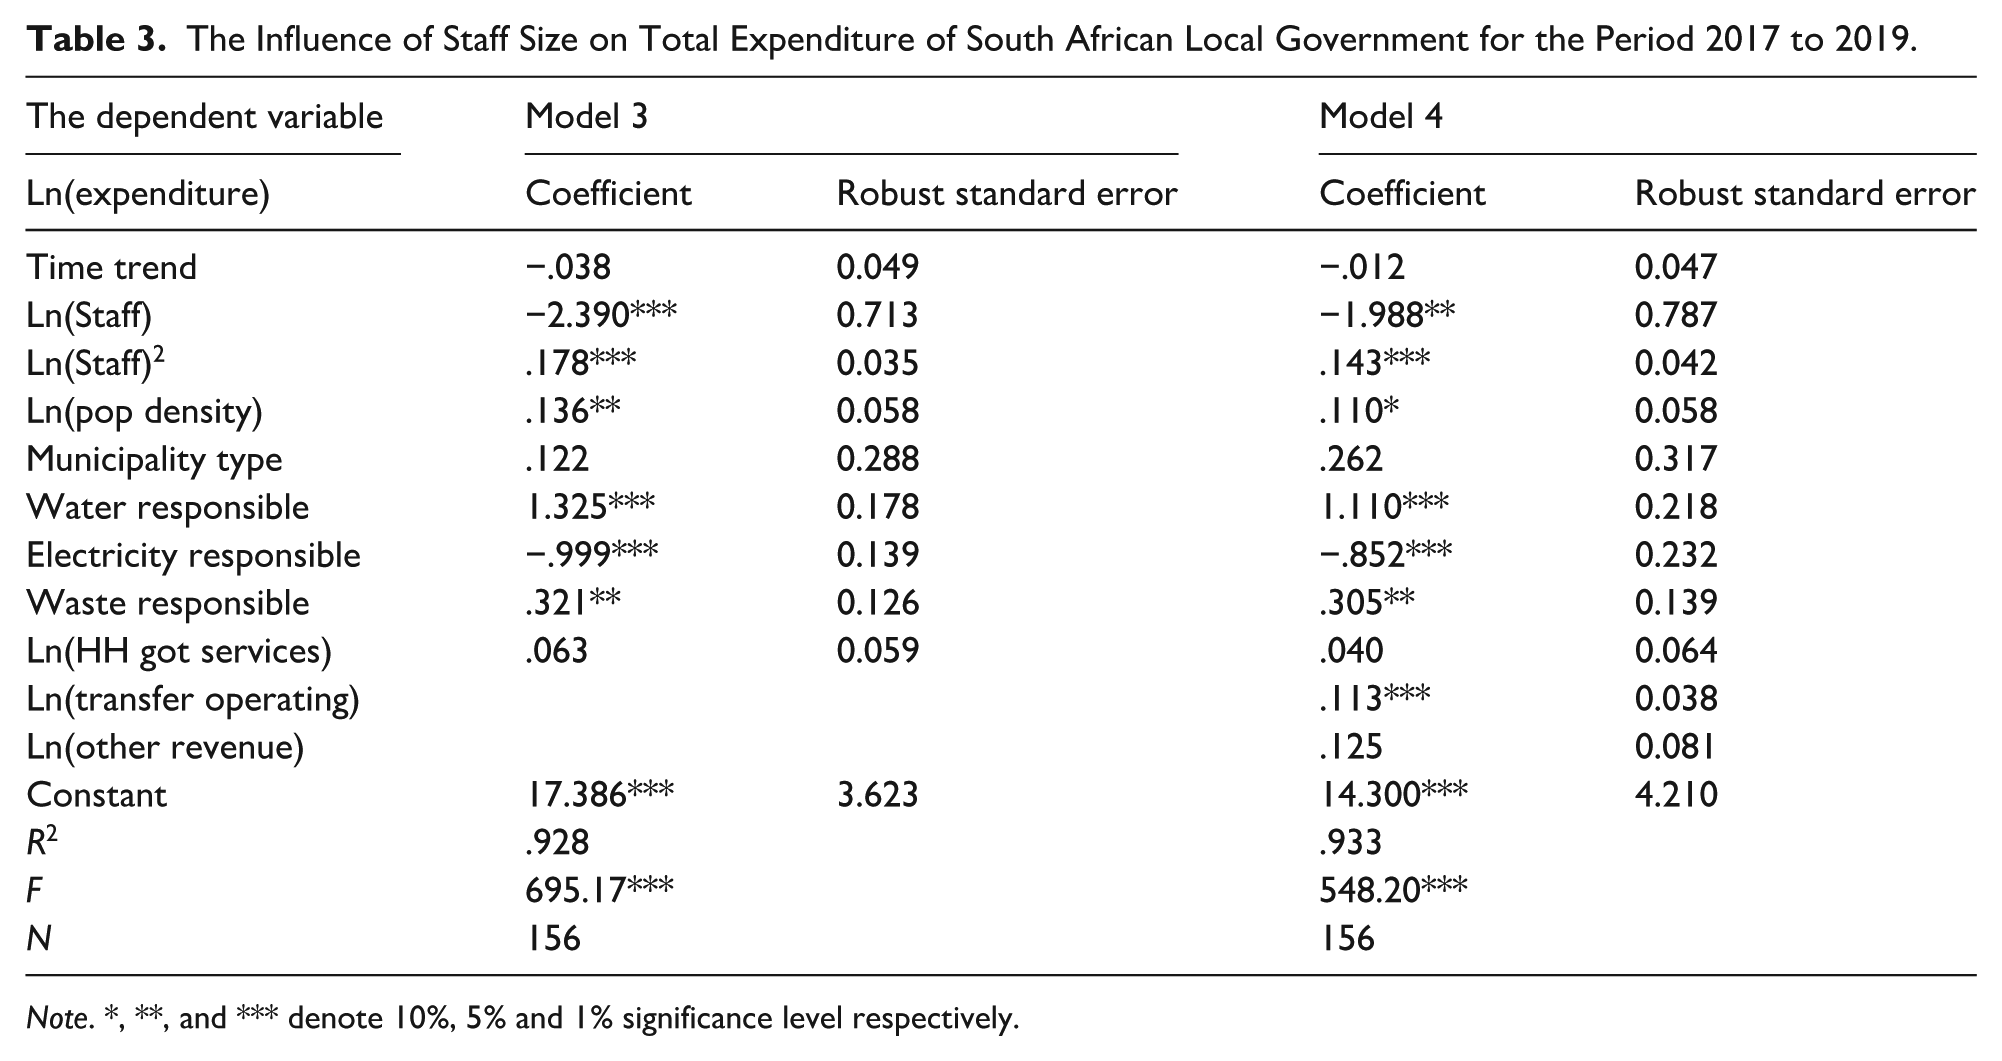
Note. *, **, and *** denote 10%, 5% and 1% significance level respectively.
Table 2 presents the results of Model 1 and Model 2, both with and without financial factors, such as transfer operating and other revenue. These models show that population size (β1) is negatively associated with total expenditure at the 1% level of significance, indicating the presence of economies of scale in South African municipal expenditure, as reflected by the negative elasticity in the log-log model. In other words, larger the municipalities by population have smaller total expenditures. Specifically, Model 1 shows an elasticity of β1 = −2.83 in the log-log model, indicating that a 1% increase in average population is associated with a 2.83% decrease in total expenditure, ceteris paribus. Table 2 shows that the coefficient of the quadratic term of population size (β2) is significantly positive at the 1% level. This indicates a U-shaped relationship between total expenditure and population size, suggesting economies of scale in SA local municipalities. Thus, H1 is confirmed, as population size affects local authority expenditure in a non-linear manner. As observed in Table 2, the estimated coefficient of ln(pop) is negative, while that of ln(pop)2 is positive in both Models 1 and 2. This implies a U-shaped relationship between population and municipal expenditure (Levy et al., 2021), indicating the presence of economies of scale. For example, in Model 2, total expenditure decreases as municipality size increases, demonstrating scale economies. However, once municipality size reaches 157,957 residents (2.7183^11.97), 1 total expenditure begins to increase. This result aligns with the previous studies (see, e.g., Drew et al., 2014; Holcombe & Williams, 2009; Ladd, 1992). Table 1 reveals that the average population of municipalities is currently 1,095,000 residents. This implies that total expenditure exhibits an increasing trend, on the right side of the U shape shown in Figure 1, while holding other variables constant. Additionally, population density has a significantly positive impact on total expenditure, with similar effects observed in both Model 1 and Model 2.
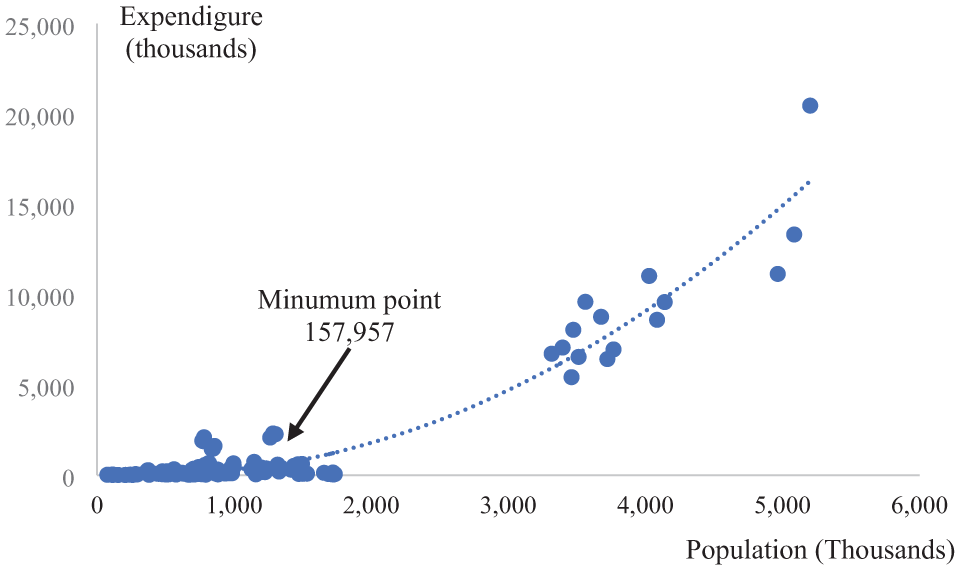
The relationship between population and total expenditure.
The findings for Models 1 and 2 indicate that municipality type is significantly positively related to total expenditure at the 1% level, highlighting a significant difference in expenditure by municipalities type. This confirms H3, which posits that the effect of municipal size on local government expenditure varies by municipality type. For instance, Model 1 shows that metropolitan municipalities have 2.38% higher total expenditure than their district counterparts.
We estimated a separate model for district municipalities, the results of which are presented in Appendix Table A1. Due to the limited number of metropolitan councils, only 24 observations across 3 years, we were unable to estimate a separate model for this group, as it would not meet robustness standards. The results in Appendix Table A1, Model 8 for district municipalities show that the effects of net population and staff size are consistent with those found in the full model. This suggests that these factors in district municipalities may be driving the overall patterns observed in the full sample. As shown in Models 1 and 2, the significantly positive coefficient for municipality type indicates that metropolitan councils spend more than their district counterparts. However, economies of scale appear to originate from the district municipalities. This aligns with findings by Amusa and Fadiran (2024) that non-metro municipalities, especially those centred around small urban towns, are more efficient than larger municipalities, challenging the widely held view that larger municipalities are better equipped for efficient service delivery. The results may also reflect the distinct responsibilities of the two municipal groups in terms of service delivery. Districts share some responsibilities of delivering services with local municipalities. Apart from C2 districts that directly deliver services such as water and sanitation, the key role for most of districts is coordination. This includes integrated development planning, bulk infrastructure, technical support and shared services for local municipalities. These functions enable districts to pool resources and thence reduce costs.
Similarly, as shown in Table 3, Models 3 and 4, both with and without financial factors such as operating and other revenue, indicate that staff size is negatively related to total expenditure at the 1% level of significance. Other studies found similar results. For example, Drew et al. (2014) found a U-shaped relationship between population size and total expenditure for municipalities in New South Wales, Australia. Similarly, Perez-Lopez et al. (2023) demonstrated that cooperation in waste collection led to significant cost savings for Spanish local governments. Their analysis highlighted that inter-municipal cooperation is a viable policy option for municipal services that benefit from a multi-production approach and exhibit economies of scale. Thus, H2 is accepted: staff size influences total expenditure. The positive coefficient of the quadratic term for staff size indicates a U-shaped relationship between staff size and total expenditure. This finding aligns with Yarram et al. (2022), who found administrative economies of scale in New South Wales local government. However, C. T. T. D. Tran and Dollery (2022) found no such benefits in Victorian state local government in Australia. As shown in Model 4, total expenditure declines as employee size increases, indicating economies of scale in SA municipal activities. However, when staff size reaches 1,043 employees (e^6.95), total expenditure begins to increase again. Figure 2 illustrates this relationship while keeping other factors constant.
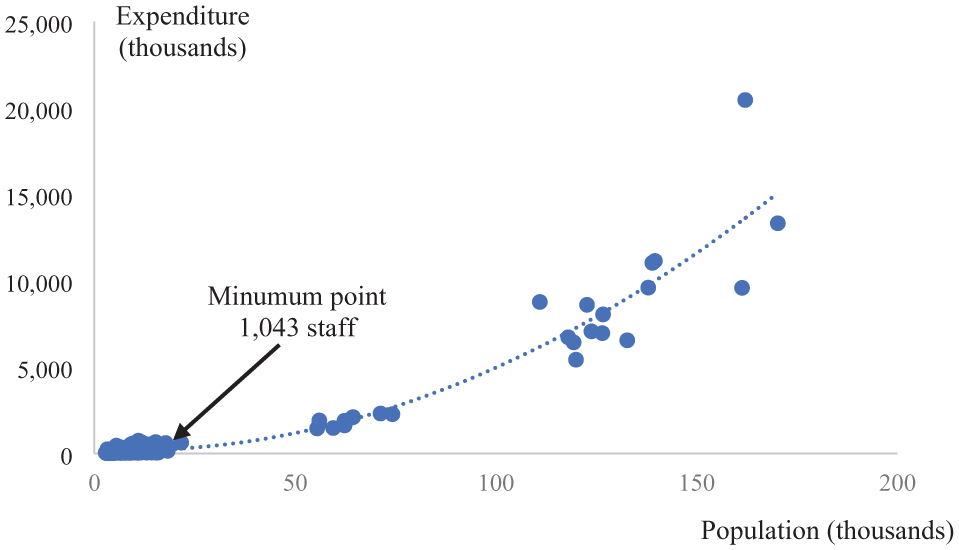
The relationship between total expenditure and staff size.
Table 1 shows that the average staff size in SA local municipalities was 24,322, showing an increasing trend in total expenditure in SA municipalities. As can be seen from Table 3, there is a significant relationship between population density and total expenditure. However, its effect on total expenditure is relatively smaller than in Models 1 and 2. On the other hand, the results in Models 3 and 4 show that the estimated coefficient for municipality type is positive but not statistically significant. This suggests that there is no meaningful difference in total expenditure between metropolitan and district municipalities, although the former tends to spend more overall. Additionally, the results from Model 9 in Appendix Table A1 indicate a U-shaped relationship between staff size and total expenditure among district municipalities. This pattern suggests that district councils have begun to experience economies of scale.
To closely examine the impact of municipality size on total expenditure, we estimated both net population and staff size in the models. Net population excludes staff size to avoid double counting. Model 5 includes the quadratic term for population, Model 6 includes the quadratic term for staff size, and Model 7 includes quadratic terms for both population and staff size. The results of Models 5 and 6 in Table 4 show that staff size and net population have a U-shaped relationship with total expenditure at the 1% significance level. However, the estimated coefficient of net population in Model 6 and Model 7 is not significant, while the estimated coefficient of staff size in these models is significantly negative at the 1% level. This implies that staff size is a significant driver of total expenditure. When running a separate model for district councils, Model 10 in Appendix Table A1 shows that the sign and significance of the estimated variables are consistent with those in Model 7. This suggests that the effect of staff size on municipal expenditure in district councils may be driving the results observed in the full sample. This finding highlights a promising direction for future research: examining the impact of employee size specifically on administrative costs, rather than total expenditure, particularly within district councils. Such analysis could offer valuable empirical insights into how cadre employment influences the performance of local municipalities (B. Rapanyane et al., 2022; D. N. Mlambo, 2023; V. H. Mlambo et al., 2022).
The Influence of Council Size and Staff Size on Total Expenditure of South African Local Government for the Period 2017 to 2019.
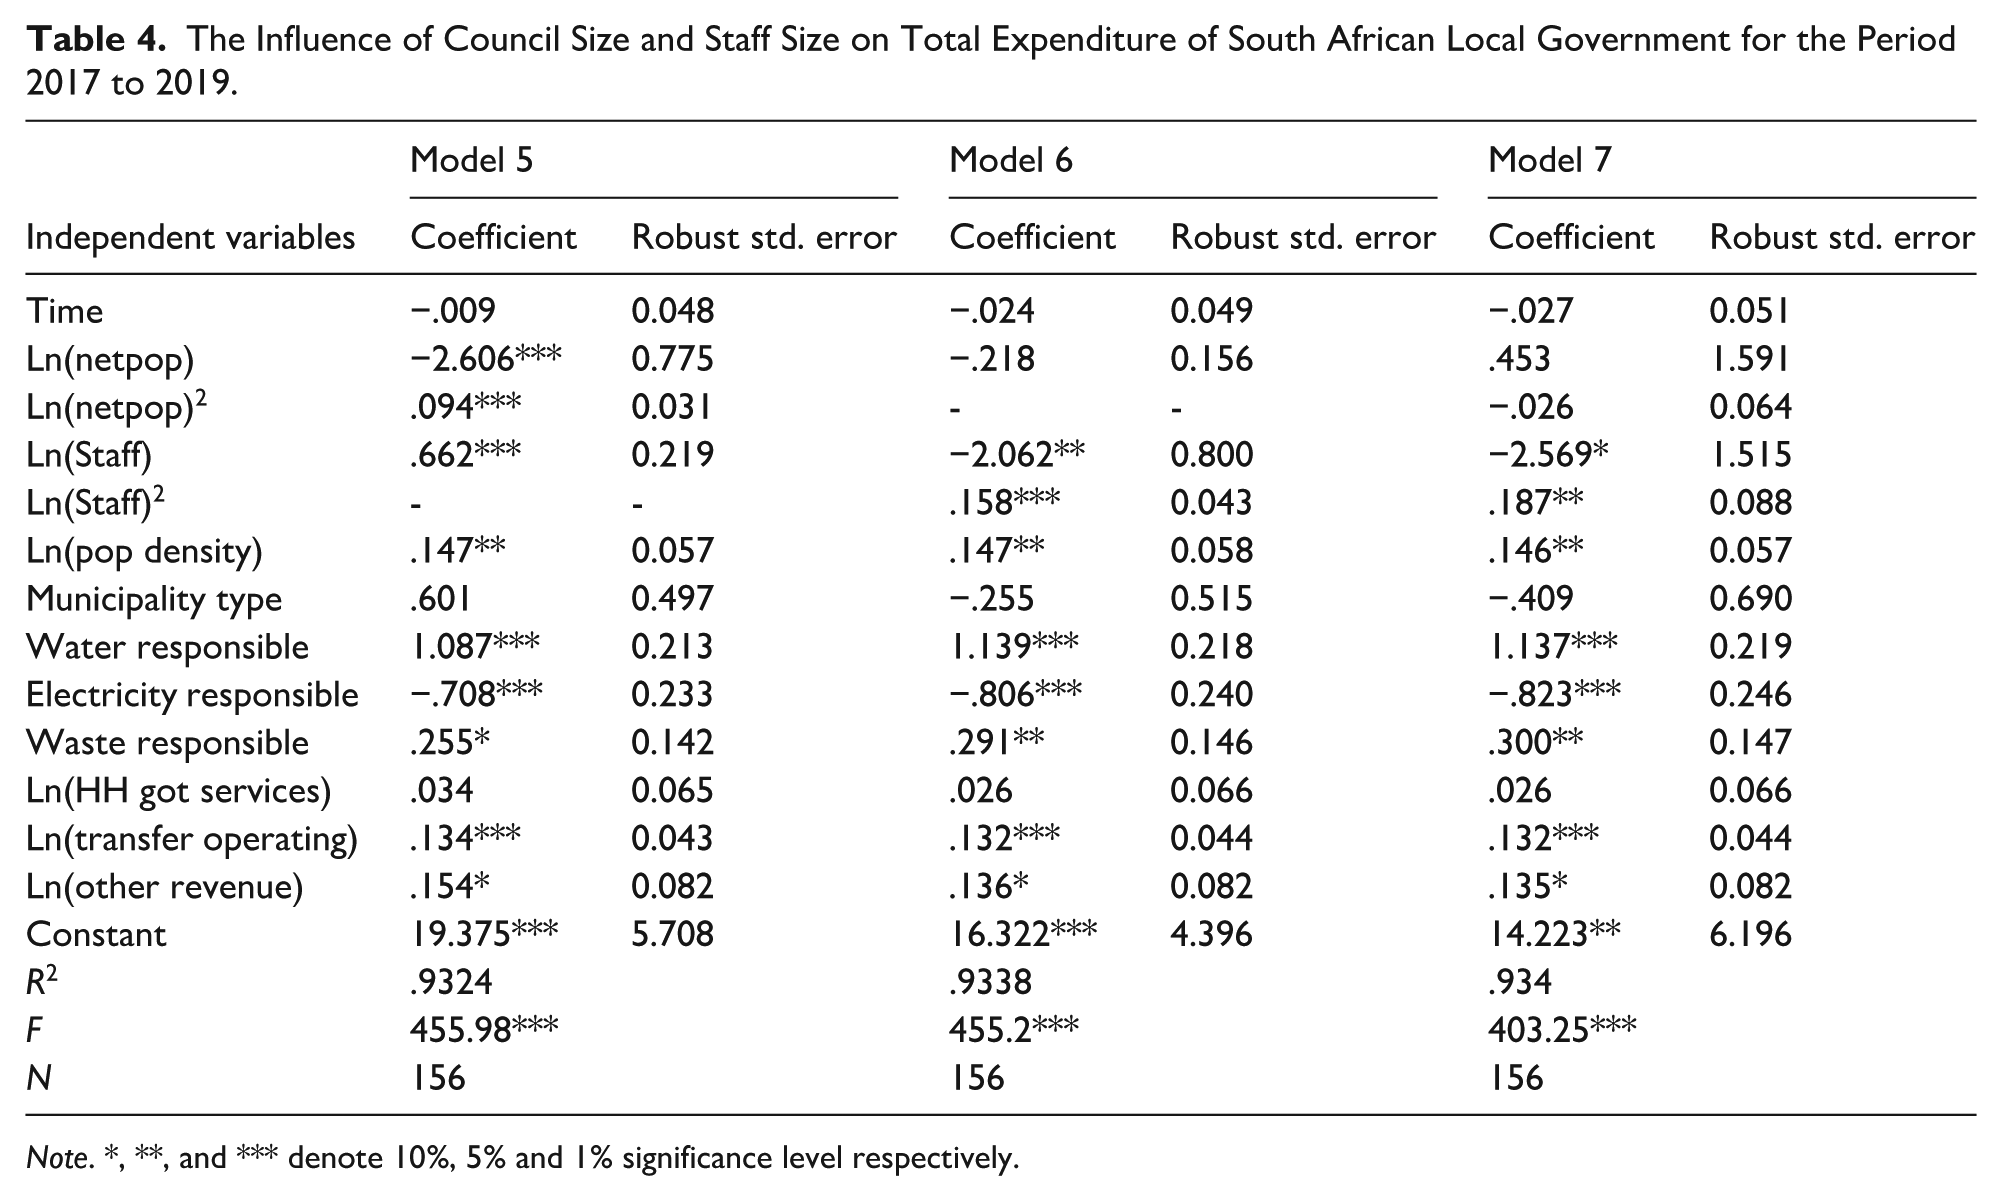
Note. *, **, and *** denote 10%, 5% and 1% significance level respectively.
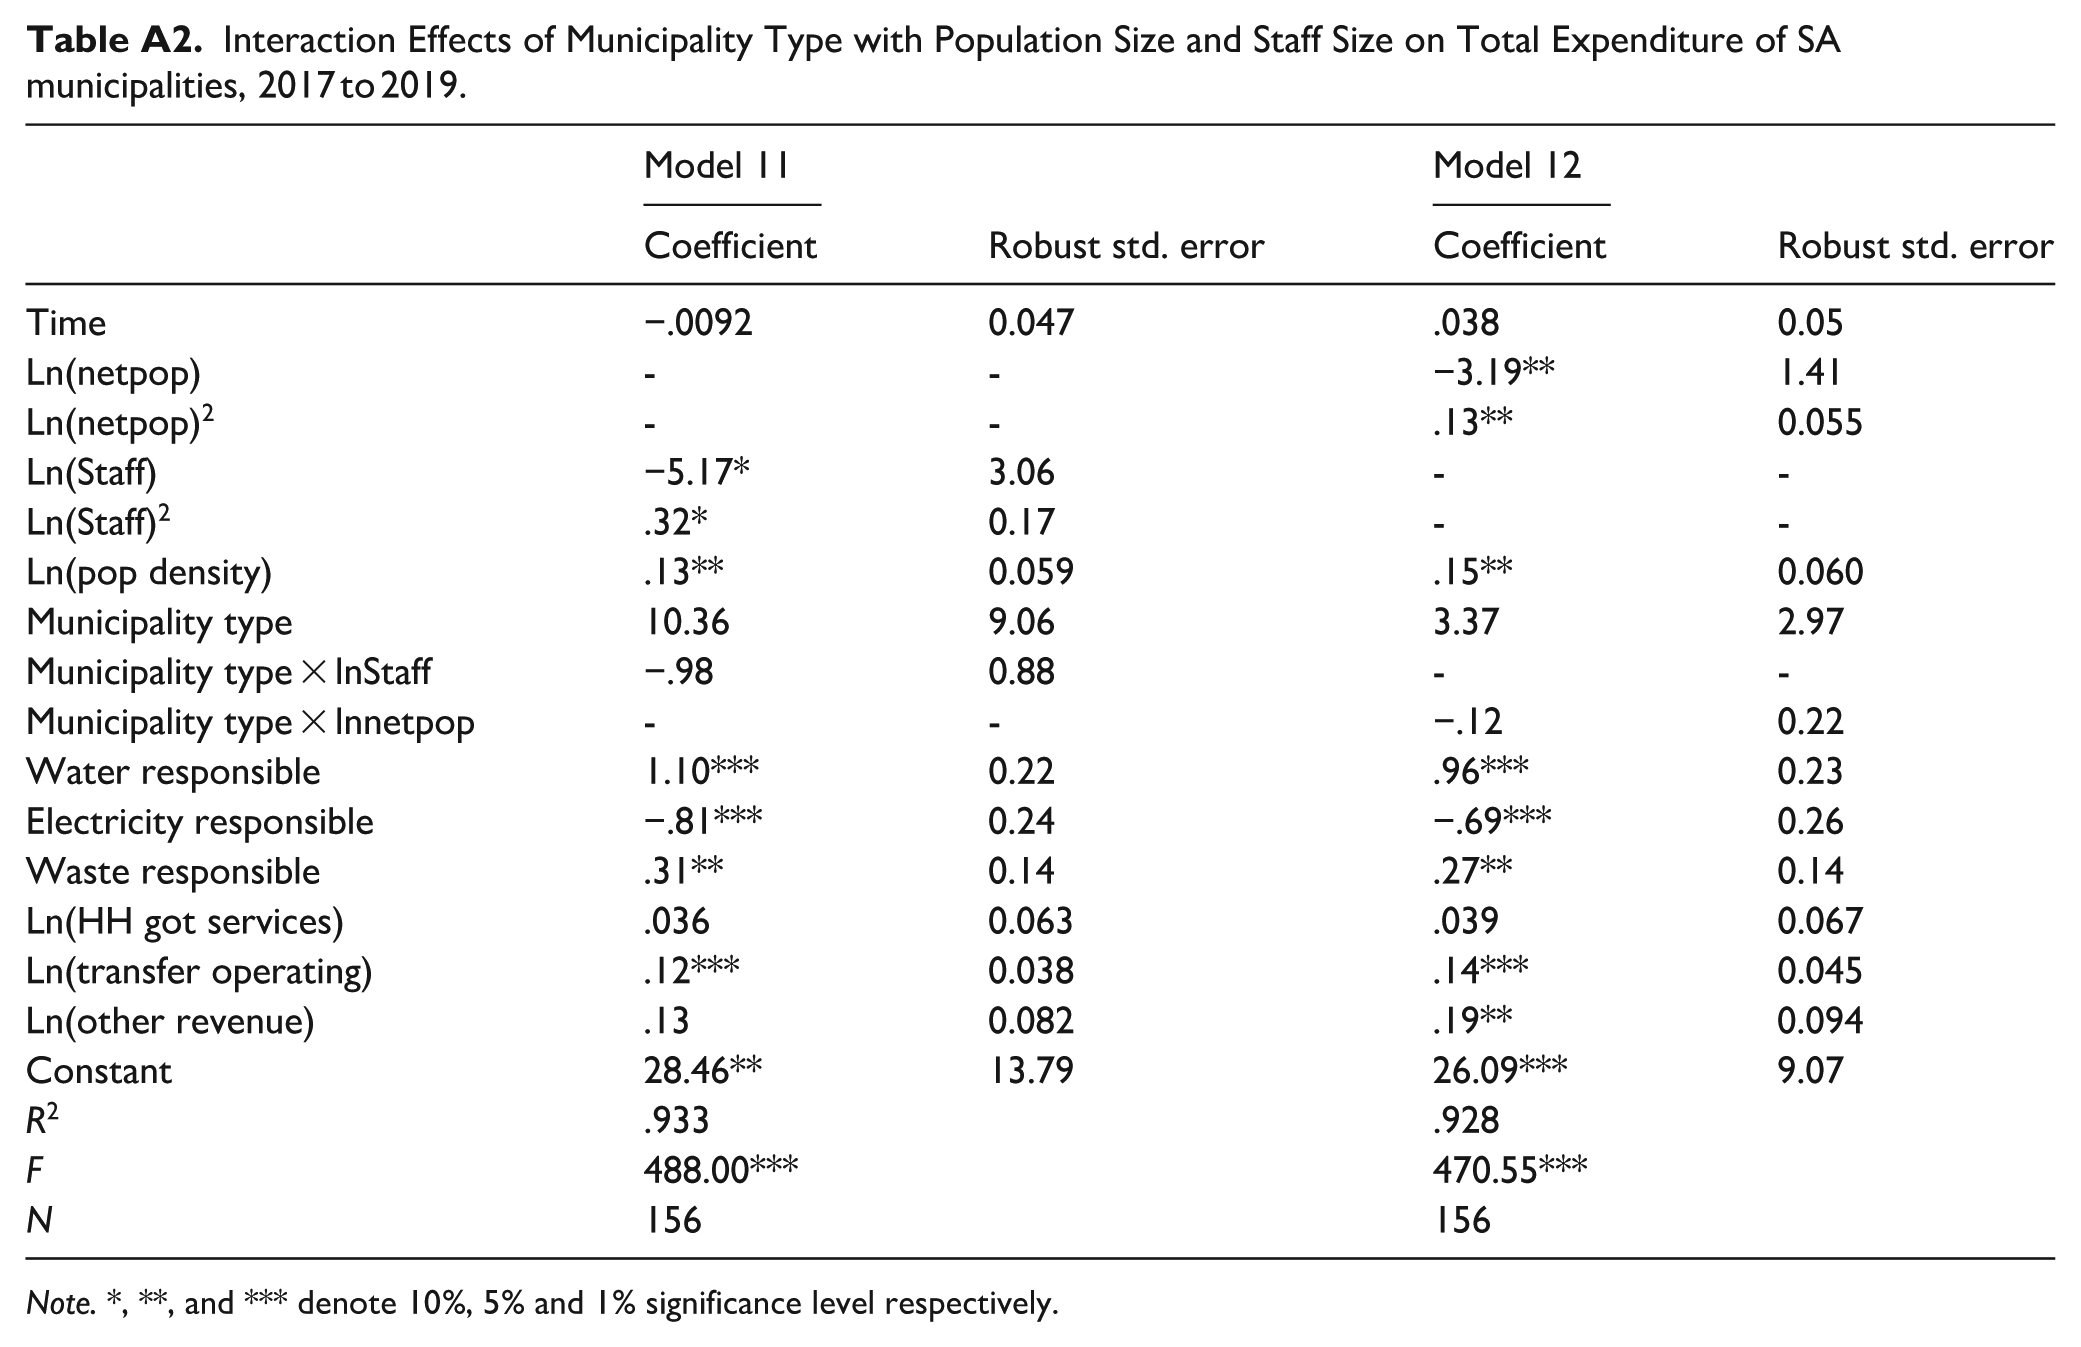
Municipality type is not statistically significant in Models 5, 6, and 7, suggesting that there is no meaningful difference in spending between metropolitan and district municipalities within the non-linear relationships between population size and expenditure, and staff size and expenditure. To further investigate potential interaction effects, we estimated two additional models that include interaction terms: one between municipality type and staff size, and another between municipality type and population size. The results, presented in Appendix Table A2 (Models 11 and 12), indicate that both interaction terms are statistically insignificant. This confirms that municipality type, when interacted with either staff size or population size, does not influence the U-shaped relationships between population size and expenditure (Model 5), or between staff size and expenditure (Models 6 and 7), in South African municipalities.
In our estimated models, control variables were added to capture their impact on total expenditure, and their effects are consistent across all seven models. While households with services do not affect total expenditure, electricity responsibility, waste responsibility, transfer operating, and other revenues significantly affect total expenditure at the 5% significance level. Waste responsibility and transfer operating revenues positively influence total expenditure because they typically involve substantial funding allocations for service delivery and infrastructure. The presence of other revenues further supports the municipality’s budget, enabling greater expenditure on public services. Conversely, electricity responsibility negatively affects total expenditure at the 5% significance level across the models, possibly due to the higher operational costs or subsidies associated with electricity provision, which could limit the funds available for other areas. These variables collectively shape how municipalities allocate resources and manage their budgets, thereby influencing overall expenditure patterns.
Our analysis is observational in nature and does not allow for definitive conclusions about causality. However, population size is largely exogenous to short-term municipal spending decisions. To help address potential omitted variable bias, we include control variables such as revenue and council responsibilities. We acknowledge that other factors—such as municipal income levels or governance quality, which are not fully captured in our model—may also influence expenditure. Therefore, our findings should be interpreted as associations that are consistent with the theory of economies of scale.
Discussion
Empirical linkages between population size and staff size, and total expenditure have been identified in public administration literature (Rutherford, 2016). Larger municipalities with bigger populations benefit from saving input resources, such as lower administrative costs and more effective utilisation of equipment (Andrews & Boyne, 2009; Drew et al., 2014). However, empirical studies on the relationship between population size, staff size and total expenditure have yielded mixed results (Dollery et al., 2012; Rutherford, 2016). In this paper, we find that this relationship is negative, indicating that total expenditure is negatively influenced by population size in a U-shaped relationship. This U-shaped relationship is significantly greater in metropolitan municipalities compared to district municipalities. Overall, South African local municipalities exhibit economies of scale in their expenditure. However, further economies of scale are unlikely if population size continues to increase.
Recent studies revealed that a high proportion of municipalities in South Africa are severely indebted and unable to meet their financial responsibilities, thereby affecting their financial performance in terms of providing better service delivery to residents (D. N. Mlambo, 2023; Reddy, 2016). This highlights the importance of assessing the operational efficiency of SA local municipalities in service provision and can provide insights for policymakers to design appropriate policies for improving their performance.
We found a U-shaped relationship between organisational size by employees and total expenditure, consistent with Yarram et al. (2022), who found a significant link between staff size and administrative intensity. Our regression analysis reveals that organisational size negatively affects total expenditure in a U-shaped manner, aligning with previous studies (e.g., Drew et al., 2014; Holcombe & Williams, 2009). However, if the size of the organisation continues to increase, this will lead to higher total expenditure. We suspect that not only the number of staff, but also their capacity and the appointment process, play a critical role, an observation that aligns with ongoing concerns about cadre deployment in South Africa. This is a hypothesis that future studies should explore in more depth.
Empirical studies have highlighted that cadre employment contributes to poor performance and service delivery in South African municipalities due to low productivity, administrative inefficiency and limited development capacity (B. Rapanyane et al., 2022; D. N. Mlambo, 2023; V. H. Mlambo et al., 2022; Reddy, 2016). To address these matters, municipalities should adopt strategies to improve administrative efficiency, such as implementing merit-based recruitment systems to ensure that staff are hired based on qualifications and competencies rather than political affiliation. Additionally, introducing performance-based staff evaluations would help align employee output with organisational goals, incentivising higher productivity and accountability. These strategies can reduce inefficiencies, optimise resource allocation and improve service delivery, ultimately mitigating the negative impact of cadre employment on municipal finances (V. H. Mlambo et al., 2022).
We found metropolitan municipalities have higher total expenditure than district municipalities, but this difference does apply to the relationship between staff size and total expenditure. Additionally, exogenous factors have mixed influences, suggesting that different characteristics of municipalities may lead to varied impacts on their total expenditure.
In sum, municipalities should aim to improve operational efficiency to enhance local government performance sustainably (C. T. T. Tran & Dollery, 2020). Specifically, to maximise economies of scale in the South African local government system, municipalities should optimise their population and organisational sizes to avoid inefficiencies. Empirical evidence suggests that as municipality size and population grow beyond certain thresholds, the relationship between size and total expenditure becomes negative, with diminishing returns. Municipalities should assess these thresholds, particularly in metropolitan areas, and restructure or consolidate services where possible to achieve cost savings. Regional cooperation can also be a key strategy, enabling municipalities to share resources, infrastructure and staff, thereby lowering operational costs and improving service delivery efficiency across districts and metropolitan municipalities.
Furthermore, municipalities should adopt lean management practices to streamline operations, reduce administrative overheads, and improve service quality without increasing costs. Excessive staffing levels can escalate administrative expenses and create financial pressures.
To mitigate this, municipalities should focus on controlling staff growth, promoting merit-based hiring, and ensure that every employee adds value to service delivery, thus enhancing effectiveness of the entire local government system. By leveraging data analytics for informed decision-making, municipalities can better track expenditures and operational performance, making necessary adjustments to enhance efficiency and reduce waste. These combined strategies will help local governments manage resources more effectively, address financial constraints and improve service outcomes for their communities.
Conclusion
This paper has examined whether scale economies exist in the South African local government system in terms of population size and employee size, using a pooled data set covering the fiscal period 2016/17 to 2019/20. Our paper contributes to the empirical literature on local government in several respects. Firstly, our findings indicate that significant relationships between municipalities size by population and total expenditure, as well as between municipal employee size and total expenditure, both exhibiting a U-shaped relationship. These results suggest that scale economies exist in SA local government. However, we found that total expenditure is minimised at approximately 158,000 residents, significantly below the current average municipal population of around 1.1 million. Similarly, the lowest expenditure levels were associated with a staffing level of approximately 1,000 employees. Beyond these thresholds, South African municipalities are likely to experience diseconomies of scale. Moreover, the effect of municipal size on total expenditure varied between metropolitan and district municipalities, while the exogenous variables produced mixed effects.
In terms of public policy, we find a significant difference in total expenditure between metropolitan and district regions in South African local government. Thus, a ‘one-size-fits-all’ policy intervention seems inappropriate. This is because the determinants of municipal expenditure differ between categories of local authority. For example, total expenditure is associated with population size differently between metropolitan and district municipalities. By contrast, the relationship between organisational size and total expenditure is not affected by municipality type. This disparity suggests that the ‘non-discretionary’ environmental factors, such as demographics, may be significant determinants of total expenditure in municipalities.
Future research on scale economies in municipal expenditure should focus on several key areas to enhance understanding of administrative efficiency in South African local governments. First, more empirical studies are needed to examine the differences in administrative costs across types of municipalities, particularly in relation to population size and staff numbers. Research could explore how administrative efficiency varies between metropolitan and district municipalities, highlighting the specific cost structures of larger versus smaller municipalities. This analysis could include comparisons of administrative expenditure, staff productivity and resource utilisation, helping to identify the most cost-effective organisational models and staffing levels.
Finally, future empirical research could investigate the impact of South Africa’s cadre policy on administrative costs and financial efficiency. This would involve analysing whether political appointments contribute to inefficiencies, such as low productivity, high administrative costs, and poor service delivery outcomes. By using administrative cost data, researchers could assess the extent to which the cadre policy influences expenditure patterns and whether it leads to biased resource allocation. To expand the scope of these findings, comparative studies could be conducted in the context of local government systems in other countries, considering how differing demographic and socioeconomic characteristics impact expenditure patterns and administrative efficiency. This would help determine whether the observed relationships in South Africa are unique or reflect broader global trends in municipal governance.
Footnotes
Appendix
Interaction Effects of Municipality Type with Population Size and Staff Size on Total Expenditure of SA municipalities, 2017 to 2019.
| Model 11 | Model 12 | |||
|---|---|---|---|---|
| Coefficient | Robust std. error | Coefficient | Robust std. error | |
| Time | −.0092 | 0.047 | .038 | 0.05 |
| Ln(netpop) | - | - | −3.19** | 1.41 |
| Ln(netpop)2 | - | - | .13** | 0.055 |
| Ln(Staff) | −5.17* | 3.06 | - | - |
| Ln(Staff)2 | .32* | 0.17 | - | - |
| Ln(pop density) | .13** | 0.059 | .15** | 0.060 |
| Municipality type | 10.36 | 9.06 | 3.37 | 2.97 |
| Municipality type × lnStaff | −.98 | 0.88 | - | - |
| Municipality type × lnnetpop | - | - | −.12 | 0.22 |
| Water responsible | 1.10*** | 0.22 | .96*** | 0.23 |
| Electricity responsible | −.81*** | 0.24 | −.69*** | 0.26 |
| Waste responsible | .31** | 0.14 | .27** | 0.14 |
| Ln(HH got services) | .036 | 0.063 | .039 | 0.067 |
| Ln(transfer operating) | .12*** | 0.038 | .14*** | 0.045 |
| Ln(other revenue) | .13 | 0.082 | .19** | 0.094 |
| Constant | 28.46** | 13.79 | 26.09*** | 9.07 |
| R 2 | .933 | .928 | ||
| F | 488.00*** | 470.55*** | ||
| N | 156 | 156 |
Note. *, **, and *** denote 10%, 5% and 1% significance level respectively.
Declaration of Conflicting Interests
The authors declared no potential conflicts of interest with respect to the research, authorship, and/or publication of this article.
Funding
The authors received no financial support for the research, authorship, and/or publication of this article.