
Abstract
A series of experiments was conducted to develop a method to estimate the convective heat transfer in vegetative fuels with a complex geometry through the measurement of liquid water evaporation. A water mist was sprayed onto vegetative test specimens, coating their entire surface with a thin water layer. The water evaporation rate was measured using a load cell in a wind tunnel under controlled conditions while an infrared camera tracked the surface temperatures. Convective heat transfer was calculated by the difference between the free stream and surface temperatures and the measured evaporation rate, considering the energy balance of the water layer at steady state. The method was verified through evaporation tests using a wood cylinder array. Experiments were conducted using nominally 30 cm branches of a typical conifer, Norway Spruce (Picea abies), yielding the conventional form of the Nusselt number–Reynolds number power–law relationship: Nu=C Ren Pr1/3 with coefficients C = 0.69 ± 0.25 and n = 0.34 ± 0.06.
Introduction
Many complex processes, such as mass, momentum, and energy exchange through convective and radiative heating and cooling, combustion, and turbulence, influence wildland fire behavior. These interactions depend heavily on turbulent flow fields (convection) that connect fire to its environment, including the local climate, weather, topography, and fuels (dead and live vegetation). For example, variation in fuel loading and structure is known to impact fire behavior owing to the impact of this structure on mass, momentum, and energy exchanges. Therefore, characterization of these exchanges is important for developing physics-based tools that might help in predicting fire growth, devising and assessing fuel treatments, determining the fire intensity of a prescribed fire, understanding the processes involved in the transition from surface to crown fires, or assessing fire risk in the wildland–urban interface (WUI). 1
One such process known to play a key role in wildland fire behavior is convective heat transfer. Heating a vegetative element involves heat transfer to the solid from the gas phase, moisture evaporation, and pyrolysis, leading to ignition. As fire spread can be considered a series of ignitions, this heating process drives spread. 1 Particularly under wind-driven conditions, and for thin fuels, convection can significantly contribute to this heating process.2,3 Thus, characterizing this convective heating becomes a critical component of a generalized physical description of wildland fire behavior. Water evaporation from wet fuels produces dry fuels, while at the same time, dry fuels are subject to pyrolysis and combustion. Heat transfer between a free stream and vegetation is complex. It can be viewed as a summation of the heat transfer processes at the surface of many smaller vegetative elements composing the larger structure.
Application of computational fire modeling to wildland fuels on a parcel scale requires basic information on key input parameters. In the case of convection, this includes effective local heat transfer coefficients for vegetation of varying geometries roughly on the scale of 0.001–1 m, a scale commensurate with computational model grid sizes. 4 Although it may be theoretically possible to resolve velocity and temperature boundary layers around individual elements of vegetation (such as foliage), this is currently outside the realm of practicality for the modeling scales relevant to fire spread. This dictates the requirement for effective coefficients, which provide a summation of the heat transfer processes at the surface of many smaller vegetative elements composing the larger structure. A current modeling approach is a dispersed multi-phase formulation, which uses subgrid particles to represent the unresolved vegetative elements. 5
The porous nature of vegetative fuels plays a key role in convective heat transfer and thus fire spread. The characteristic length scales of the solid elements, the bulk density, and the magnitude of the local (interstitial) velocity can influence heat transfer and fire spread rates. In practice, the canopy of vegetative fuels can also be compressed by the free-stream flow, leading to changes in the effective bulk density of the fuels. Modeling this bulk convective process is important in predicting ignition 6 and fire spread. 7
Much research has been conducted to estimate convective heat transfer to different objects; however, relatively little has focused on vegetative structures. Experiments determining the convective heat transfer coefficient have involved complex instruments and challenging measurements. Tibbals et al. 8 and Gates et al. 9 used silver castings of coniferous vegetation to study free and forced convection. The method allowed determination of wetted surface area through conductance measurements. The casting was heated, exposed to airflow, and the thermal response of the cast was measured with thermocouples. The results demonstrate the importance of structure as the convection depended on both the type of vegetation and the orientation of the flow. Both the works of Mendes-Lopes et al. 10 and Mueller et al. 11 estimated the heating of pine needle litter beds under forced convection conditions, using a heated wind tunnel, and proposed a new Nusselt number–Reynolds number power–law correlation. In both studies, the new model was lower than predicted for a single cylinder in crossflow. Michaletz and Johnson 12 investigated forced convective heat transfer in conifers (Pinus contorta and Picea glauca) and estimated the heat transfer coefficient by measuring the temperature change of cold vegetative fuels in an ambient temperature-free stream, using thermocouples inside only stems. They found that needles increase the convective resistance of branches and buds and that the Nusselt number of the conifers is smaller than that of cylinders. In addition to these experiments, 13 presented an analytical analysis of an idealized fractal tree and found that both the distribution of element orientation and the interaction from multiple elements were important for parameterizing a convective coefficient.
These previous studies have used significant temperature differences between air and vegetation to produce measurable convection. This can be difficult to manage in a controlled and repeatable manner for high-volume flows with larger vegetation samples. The experimental method used in this study measures the rate of water evaporation over the entire surface of a representative vegetative target to estimate the convective heat transfer. The concept of linking heat and mass transfer has been established previously. Goldstein and Cho 14 used the naphthalene sublimation method to obtain the convective heat transfer coefficient based on the analogy between heat and mass transfer. The results showed that the method is particularly useful for complex flows and geometries in a low-velocity region (≈1.2 m/s).
Water has a major advantage over naphthalene sublimation studies as it is non-toxic and the rate of evaporation at room temperature is relatively large compared to naphthalene, which provides a significant amount of mass evaporation in a relatively short period, and water mist is an easy way to coat vegetation. Water evaporation has also been used previously to measure mass transfer in vegetation. Landsberg and Powell 15 carried out water evaporation experiments using an artificial apple tree to determine the dimensionless mass transfer coefficient as a function of the free-stream speed. The disadvantage of this approach is that, unlike naphthalene, water vapor is present in the ambient air and the evaporation rate is very sensitive to its presence. This can lead to relatively large uncertainties in the determination of the mass transfer coefficient and thereby the heat transfer coefficient, using this method. Instead, in this study, an energy balance at the surface of the vegetation is considered.
An energy balance approach requires direct measurement of the vegetation’s thermal response, which is challenging for several reasons. Thermocouples can detach from a surface, particularly when exposed to high-speed airflow, and influence the local flow and temperature conditions, depending on the size. In addition, many thermocouples are needed to obtain a meaningful average over a surface. As an alternative, non-contact radiometric surface thermometers commonly referred to as infrared (IR) thermometers have been employed in many studies of plant–environment interaction. IR thermometers with a bandpass filter from 8 to 13 μm allow measurement of the real temperature of plant surfaces with errors in the range of 0.1°C–0.3°C. 16 The advantages of this method include the lack of physical contact with the plant, simple automation of data collection, and non-point measurements that accommodate inherent spatial variability. 17
In this study, heat transfer to the complex geometries of a vegetative target was characterized by measuring the mass and surface temperature changes during water evaporation of its wetted surfaces. A fresh branch of a conifer was placed in a wind tunnel with speeds from 1 to 9 m/s. Water mist was sprayed onto the branch, coating its surface with a water film. The surface temperature was measured using an IR camera. The evaporation rate is a function of environmental conditions, including tunnel wind speed, free-stream temperature, and humidity. Fire conditions can lead to temperatures in vegetation as large as the order of 1200 K and velocities as high as 15 m/s near ground level. 18 The flow conditions considered in this work are consistent with conditions that may occur during wildfire-driven convection (considering the various combinations of flow speeds, temperatures, and length scales present in a fire).
The basis of the approach developed here relies on the underlying assumption that spatial and temporal gradients of temperature do not play a significant role (as seen in Supplemental Material A). In this case, it is the net energy sink that is significant. Details of exactly where the evaporation of water is taking place are not necessary to evaluate, nor is it important how water may be internally transported within the vegetation. As such, it does not particularly matter if some of the applied water is absorbed in the vegetation, or even if some of the evaporation is associated with pre-existing moisture within the plant, as long as the evaporation rate (mass loss rate) is accurately measured.
This article is broken into several parts. In section “Theoretical considerations,” heat transfer phenomena in vegetation are described and the energy balance of an evaporating water layer is presented theoretically. In section “Experimental methods,” the experimental method and apparatus are described. The characteristic size of vegetative components is determined by image analysis. The results are summarized in section “Results and discussion.” The experimental method was verified using a wood cylinder array. The Nusselt number (Nu)–Reynolds number (Re) power–law relationship for vegetation is calculated and compared with literature correlations for conifers and geometries commonly used to approximate conifers. Supplemental Material A uses the fire dynamics simulator (FDS) to create a simple 1D model of the 5-mm diameter wood cylinder experiment. Supplemental Material B presents an uncertainty analysis. The effect of blowing on the heat transfer analysis is addressed in Supplemental Material C.
Theoretical considerations
Among other important properties, liquid water has a relatively large heat of evaporation. This enables observation of a significant temperature change associated with an evaporating water layer. At the onset of water evaporation from a surface, the temperature of the water film on the surface decreases due to the latent heat of evaporation. The temperature decrease slows evaporation as the water vapor pressure decreases. To sustain the evaporation, the latent enthalpy loss in the water film must be replenished by energy transfer to the film from its surroundings. Steady-state conditions will develop when the heat gains and losses balance the enthalpy required for evaporation. This is the same concept used to measure wet-bulb temperature in meteorology.
At steady state, the energy balance of a water film on a surface can be expressed as

where
The convective heat transfer coefficient,
where the characteristic length

where
Experimental methods
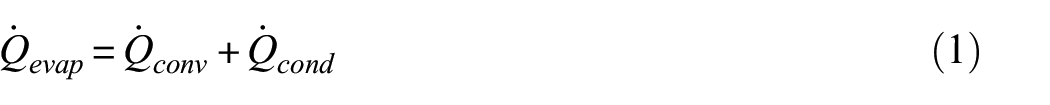
Evaporation experiments were conducted in a stainless steel wind tunnel consisting of a settling chamber with a honeycomb airflow straightener, a contraction section, and a test section with dimensions of 0.5 × 0.5 × 2 m3 (width × height × length). Figure 1 shows a schematic of the experimental setup. The airflow was provided by a 0.91-m diameter axial fan controlled by a variable frequency drive. The mass loss of the branch sample was measured at the sampling rate of 1 Hz using a single-point load cell (ATO.co., Model: ATO-LC-SP01) placed underneath the wind tunnel. (Certain commercial entities, equipment, or materials may be identified in this document to describe an experimental procedure or concept adequately. Such identification is not intended to imply recommendation or endorsement by the National Institute of Standards and Technology, nor is it intended to imply that the entities, materials, or equipment are necessarily the best available for the purpose.) A 9-mm diameter steel rod was mounted on the load cell below the test section and passed up through a 3-cm diameter hole on the floor of the wind tunnel test section. The base of the branch sample was mounted to the rod with a clamp.
Schematic diagram of the experimental setup (right). A close-up photo shows the pitot probe array-oriented upstream inside the wind tunnel (left).
A rake of L-shaped pitot probes measured the free-stream speed. The pitot probes (Dwyer, Model: DS160-24) were aligned vertically at 6-cm intervals by a guide plate. The rake moved horizontally on an aluminum rail (direction into the paper), enabling measurement of the 2D velocity field upstream of the target. The test section had nearly uniform flow speeds, which could be controlled from about 1 to 9 m/s. In the middle 80% of the wind tunnel, the mean wind speed in the streamwise direction was measured to be uniform to better than 2%. The upstream air temperature and relative humidity were measured with a high-accuracy thermo-hygrometer (Vaisala Model: HMPX Humidity and Temperature probe) located 0.5 m upstream of the wind tunnel test section. (Manufacturer stated accuracy equal to 1% of reading.)
An IR camera (Teledyne FLIR, Model: FLIR E30) with a spectral range from 7.5 to 13 µm was mounted above the tunnel with its lens peering through a hole in the ceiling of the tunnel test section, about 0.5 m upstream of the branch sample. The IR camera was used to record a video of the foliage and stem surface temperatures
Branches were collected from four mature Norway Spruce trees to consider variation in the structure of the foliage and stems. Branch stems were kept in a water reservoir, and the foliage was wrapped in plastic to reduce moisture loss. Immediately before experimentation, the branches were trimmed to an appropriate size (nominally 30 cm × 30 cm × 30 cm). Experiments were completed within about 2 weeks after harvesting. Figure 2 shows photographs of various specimens mounted in the tunnel, taken by a webcam mounted about 2 m upstream of the specimens in the wind tunnel.
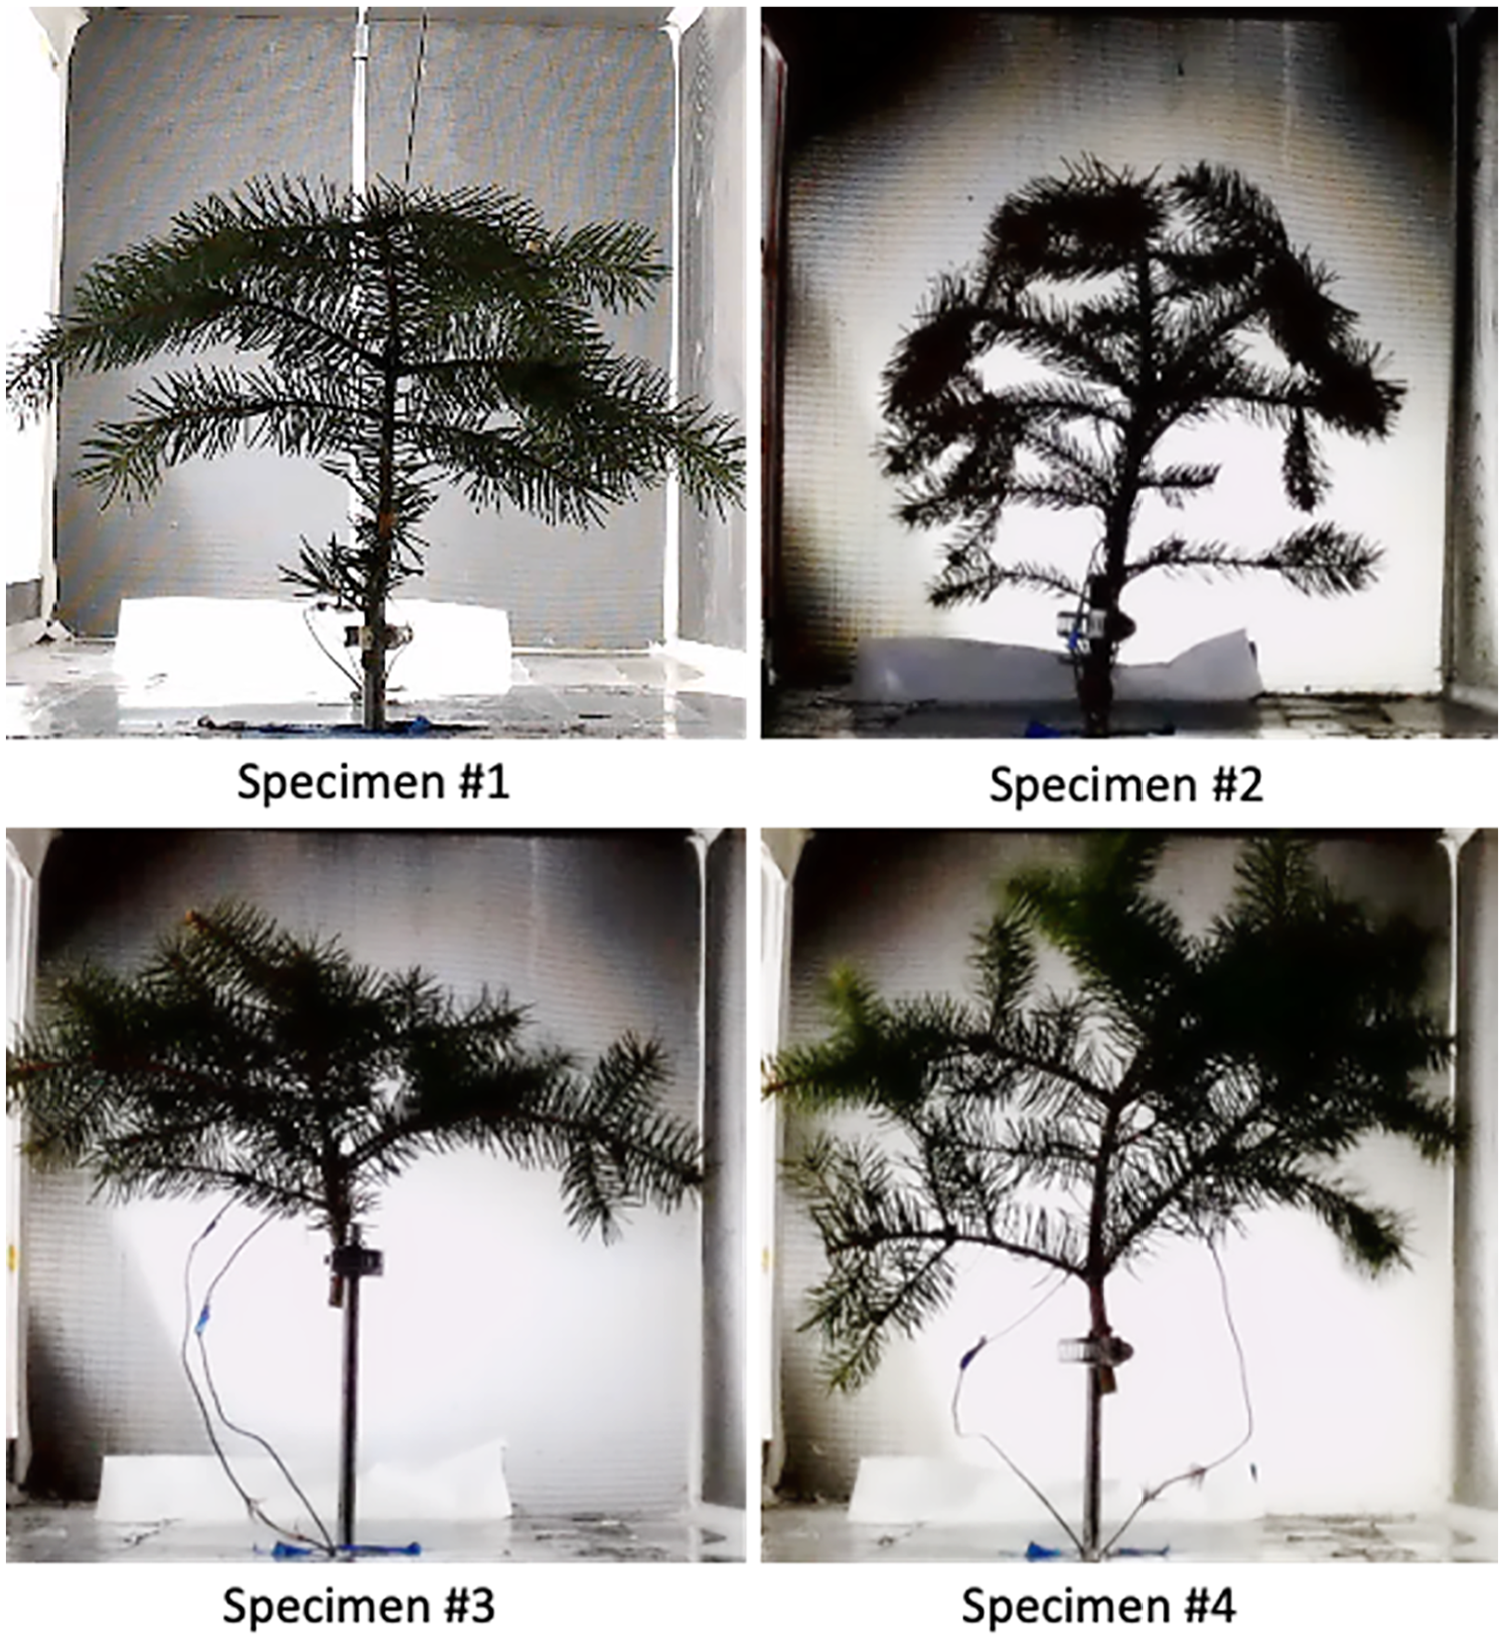
Photographs of specimens mounted in the tunnel, taken by a webcam about 2 m upstream of the specimens.
The characteristic size of vegetative components was determined by image analysis. After testing, branches were dissected and divided into two classes: foliage (or needles) and stems. Images were taken of all stems and a large representative subset of the foliage (
The surface area of each class was estimated by calculating an average particle surface-to-volume ratio
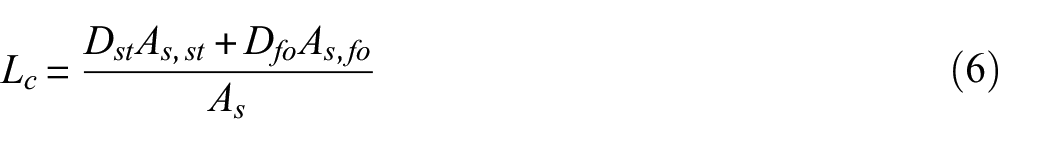
The measured diameter and volume of foliage and stem are listed in Table 1 for the four specimens tested. The table also shows the expanded combined (95% confidence level) uncertainty based on the image processing uncertainty and the reading uncertainty of the measured volume. The variance of the foliage diameter
The measured weight, diameter, volume, surface area ratio of stem and foliage, and characteristic length of Norway Spruce specimens.
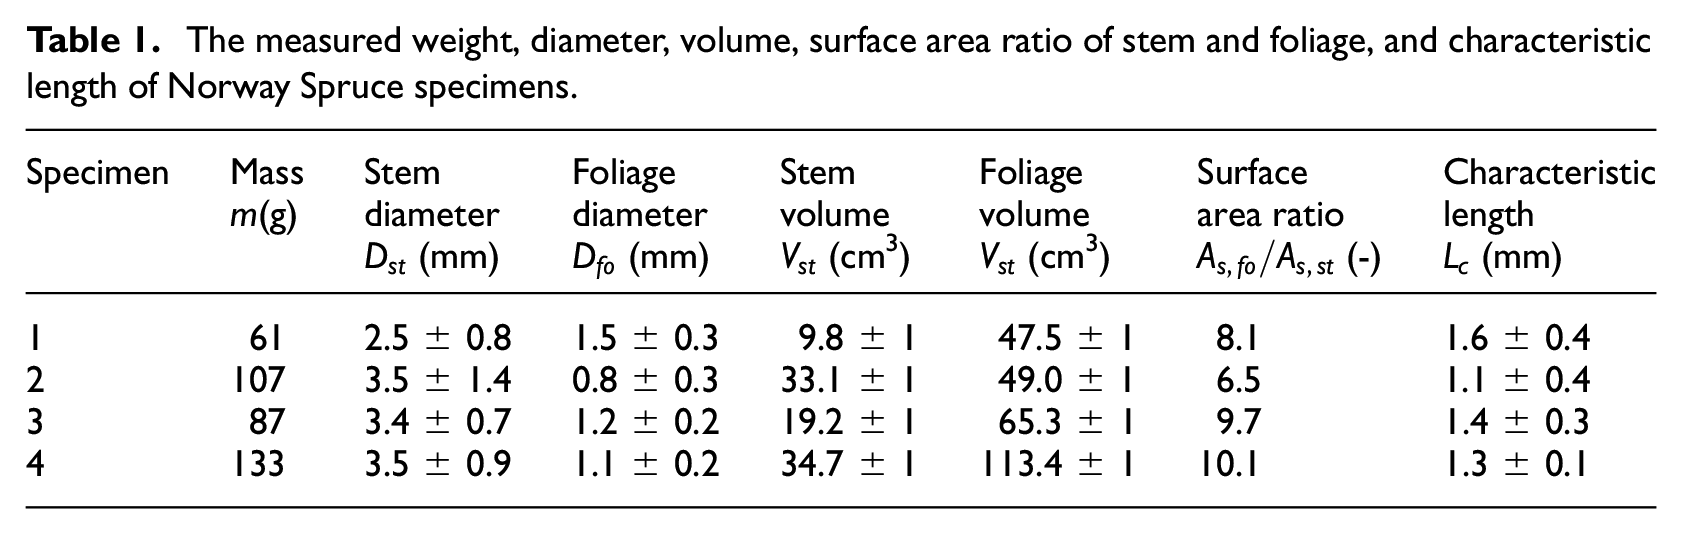
The branch surface was divided into about 80–170 monitoring zones ranging in size from 5 to 10 mm. Figure 3 shows the monitoring zones in a thermal image of Norway Spruce Specimen 4. The minimum temperature in each zone was extracted for every thermal image frame and was taken as representative of the cooled evaporative surfaces of the specimen and avoiding the inclusion of the tunnel floor and walls that were at near ambient temperature and appeared as whitish in the figure. A representative surface temperature of the branch sample was estimated by averaging the minimum temperatures from all the monitoring zones. Figure 4 shows an optical photograph and thermal image of Norway Spruce Specimen 2 in the wind tunnel. Two thermocouples were inserted halfway (about 3 mm) inside the main stem of the specimen. Temperature measurements using the IR camera and thermocouples were conducted and typical results are shown in Figure 5. The initial temperatures in the plot are sub-ambient due to evaporative cooling of the wetted surfaces before the fan was turned on—as the specimen was prepared and the side wall of the test section was secured. The temperatures obtained minima and then increased, eventually reaching the free-stream temperature. The measured temperature inside the stem changed due to the conductive heat transfer from the surface to the inside of the stem. The change was relatively slow compared to the change in the surface temperature.
Monitoring zones in a thermal image of Norway Spruce Specimen 4. The blue (right-side up) triangle symbol in each monitoring zone (white circles) indicates its minimum temperature location.
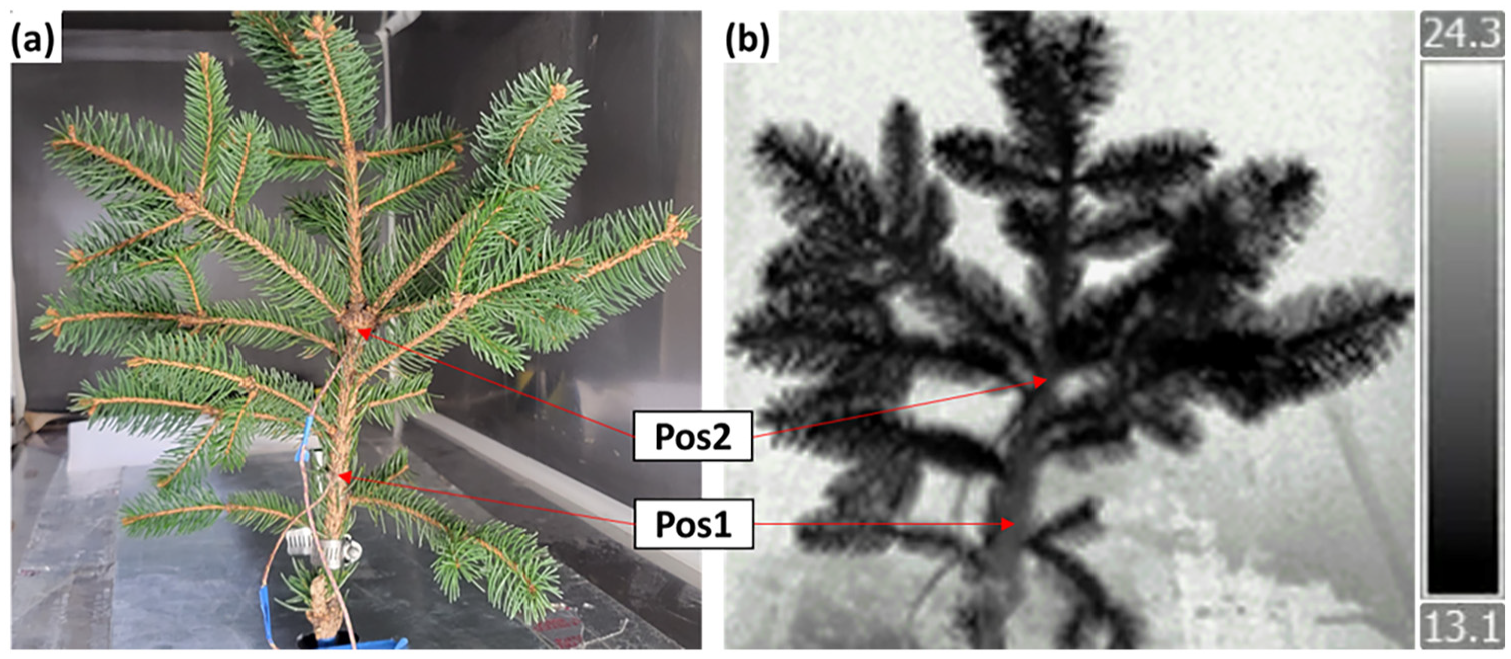
Norway Spruce Specimen 2 in the wind tunnel with (two) thermocouples embedded in its main stem; (a) photograph and (b) thermal image immediately after the fan was on. The dark color indicates a sub-ambient temperature, with pixel temperature associated with the color bar on the right.
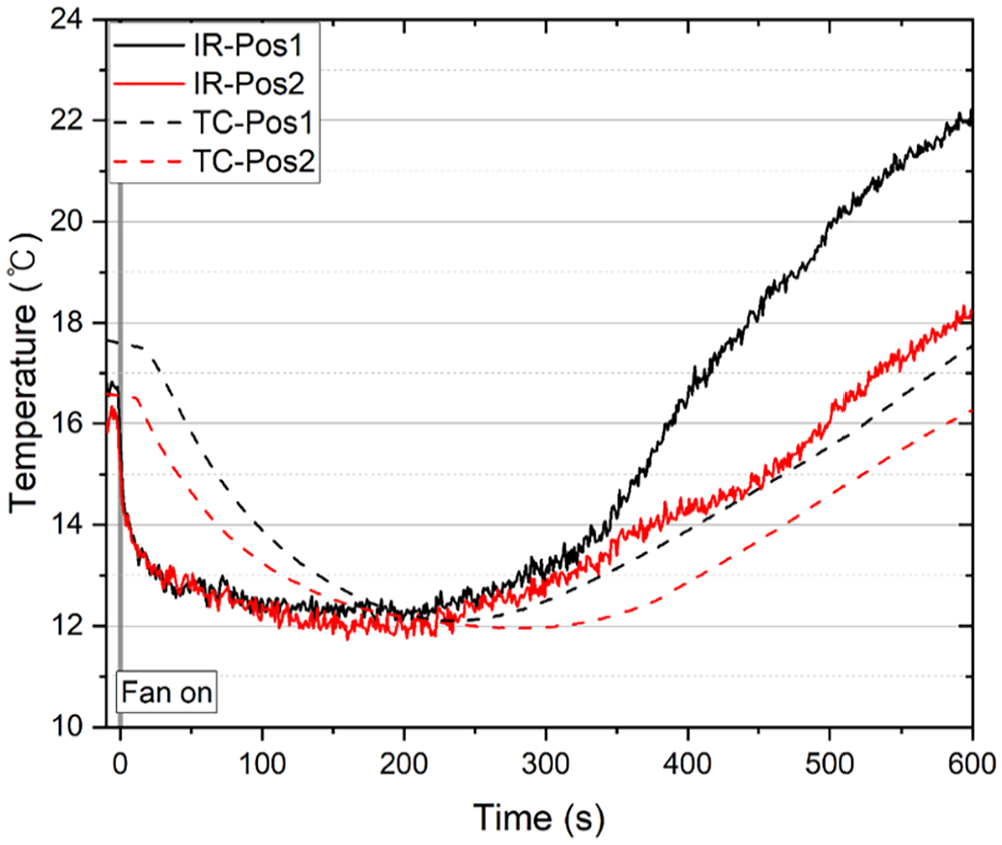
Temperature measured using the IR camera and thermocouples at two positions (presented in Figure 4) on the main stem of Norway Spruce Specimen 2 (test 2A) as a function of time after the wind tunnel fan was started. The mean free-stream speed,
Results and discussion
Wood cylinder array
To verify the method developed here, evaporation experiments were conducted with an array of wood cylinders and compared to the well-known empirical heat transfer correlation between the Nusselt number and Reynolds number for cylinders in a crossflow. An array of six wood cylinders (in the middle of the wind tunnel, aligned in a vertical plane normal to the flow) was used to verify the method and quantify the uncertainty of the measured evaporation rate. Experiments were conducted using two arrays of 20-cm long wood cylinders with each array composed of either 5.0- or 9.5-mm diameter cylinders. Figure 6 shows the wood cylinder array consisting of six, 5-mm diameter wood cylinders and its orientation to the tunnel air flow. The cylinders, except the base of the wood array, were immersed in a room-temperature water reservoir (with a small amount, ≈ 0.01% by volume, of liquid soap which acted as a surfactant) for several minutes before the experiments commenced.
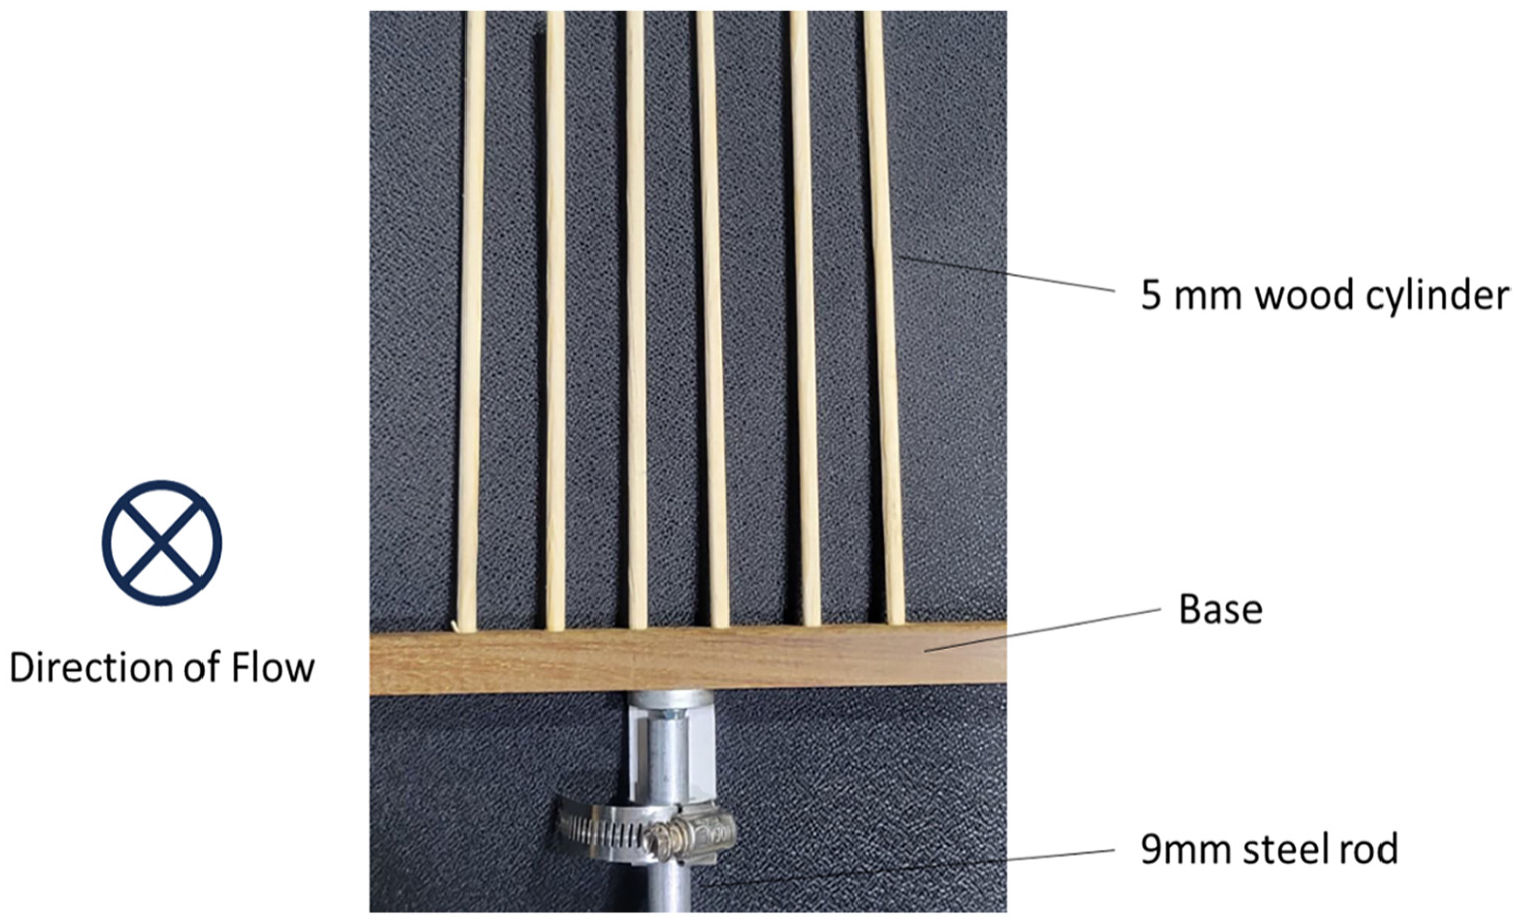
Photograph of the wood array consisting of six, 5-mm diameter, wood cylinders. The direction of wind tunnel airflow was into the page as indicated by the diagram on the left.
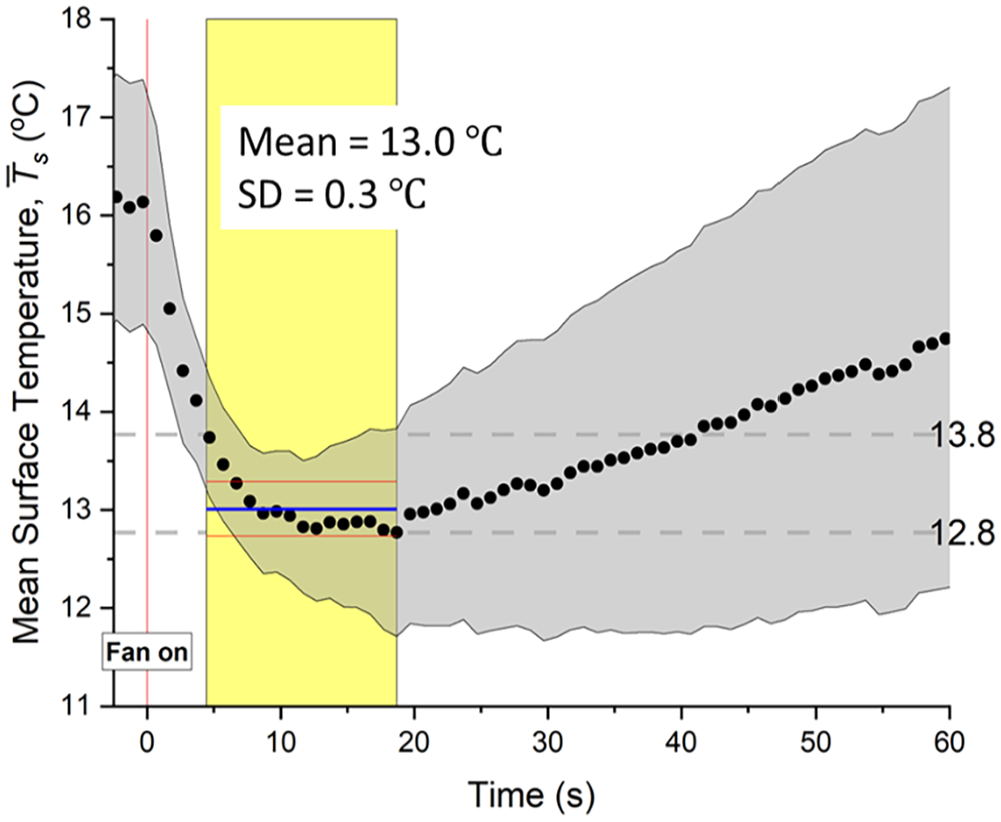
Figure 7 shows the time series of mean surface temperature
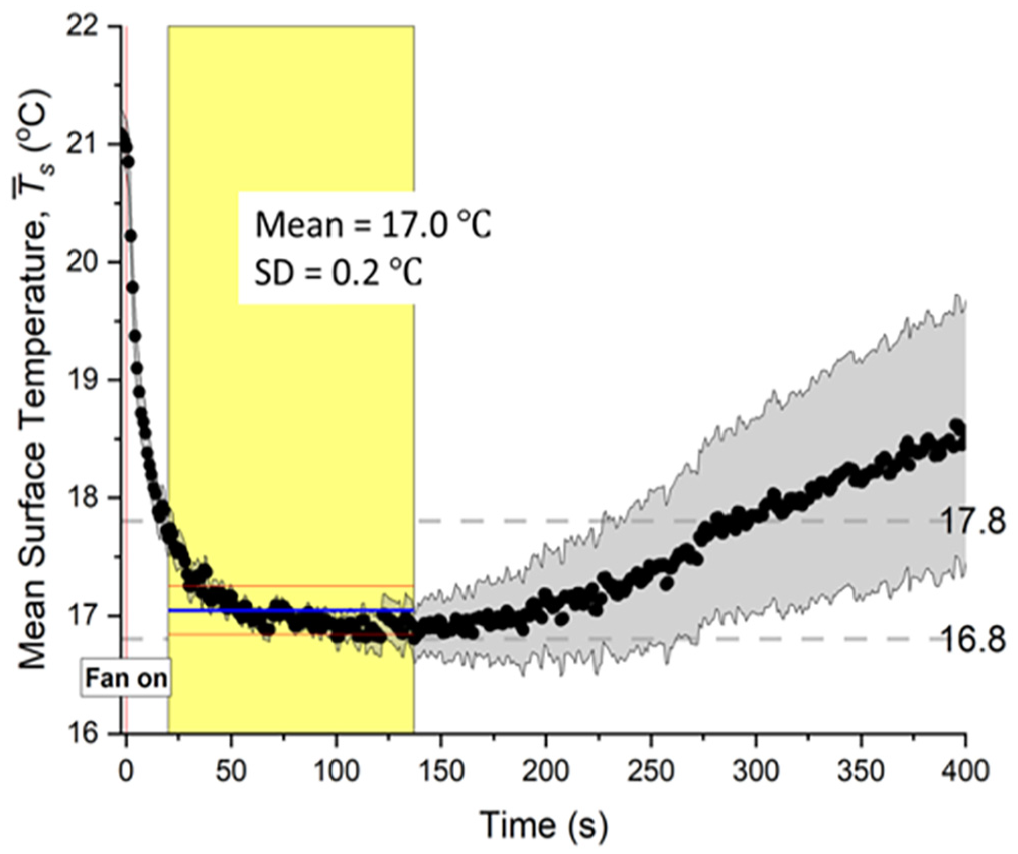
The mean surface temperature (black line) averaged along the centerlines of each of the 5-mm diameter wood cylinders as a function of time after the fan was turned on. The free steam speed (
Evaporative, Conductive and convective heat fluxes and dimensionless numbers related to heat transfer are listed in Table 2. The average heat flux (
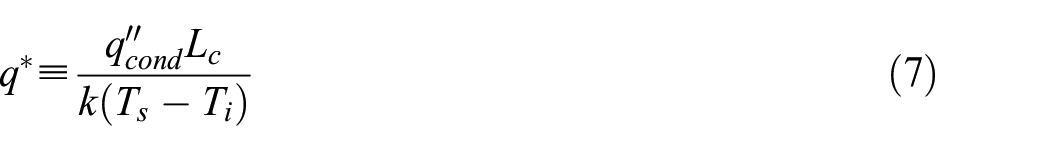
where

where
Summary of evaporative, conductive and convective heat fluxes for the 5.0 and 9.5 mm wood cylinder array in the wind tunnel. The mean free-stream speed
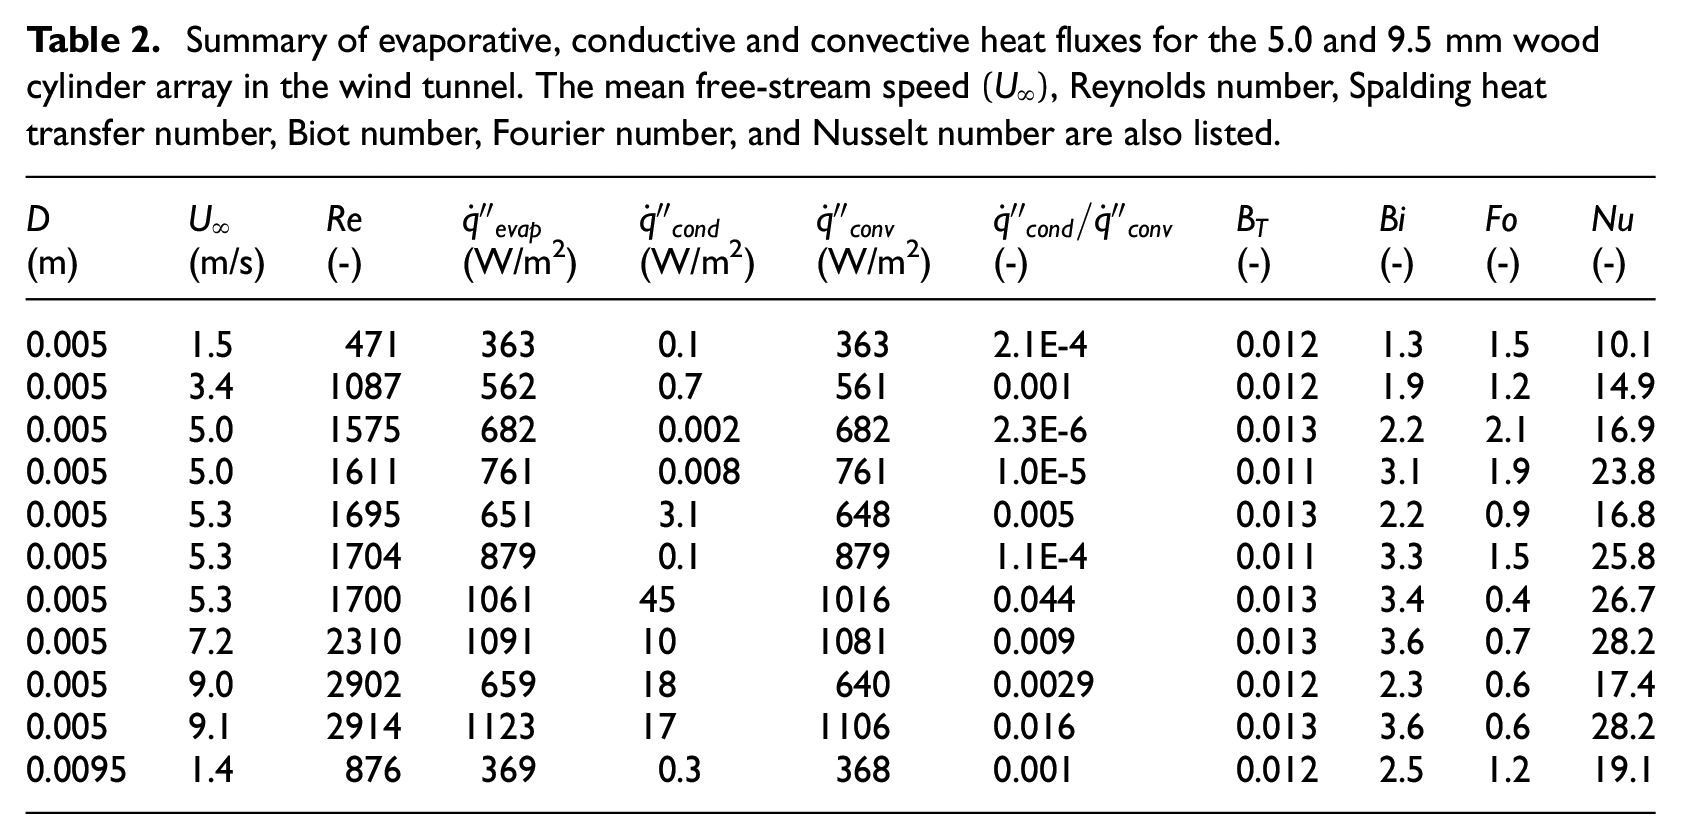
Figure 8 shows the Nusselt number for the wood cylinder array as a function of the Reynolds number with the results compared to the empirical relationship for a cylinder in crossflow. 25 The Nusselt number was fit as a power–law function of the Reynolds number using the form seen in equation (5). The error bars in Figure 8 represent the expanded combined uncertainty (95% confidence level) with an average value of ±13% for the Reynolds number and ±17% for the Nusselt number. The uncertainty of each data point was considered in the power–law curve fit as described in the work by Heckert et al. 26
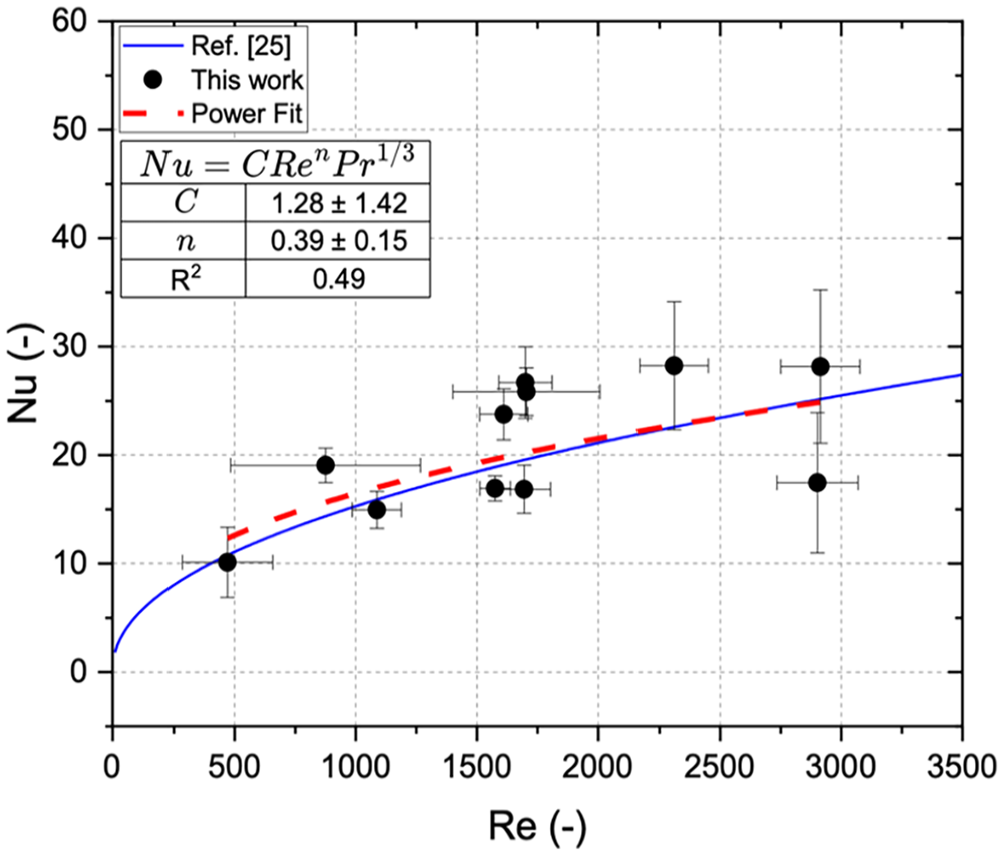
The Nusselt number as a function of the Reynolds number for the wood cylinder array in the wind tunnel. The dashed red line shows the power–law fit for the Reynolds number and the solid blue line shows the literature correlation. 25 Error bars represent the expanded combined uncertainty denoting a 95% confidence interval.
The relationship between the Nusselt number and the Reynolds number for the wood cylinder array is generally consistent with the general empirical relationship. The ratio of the conductive heat transfer rate to the convective heat transfer rate,
Vegetation
Figure 9 shows the mean surface temperature
Mean surface temperature of Norway Spruce Specimen 4 (test 4A) and free-stream temperature as a function of time after the fan was turned on. The free steam speed (
Evaporative, conductive, and convective heat transfer rates of the Norway Spruce specimens are listed in Table 3. The Reynolds number and Nusselt number are also listed. Assuming the same functional form of the Nusselt number as that of equation (5), the power-fit coefficients of the Nusselt number

Summary of evaporative, conductive, and convective heat fluxes
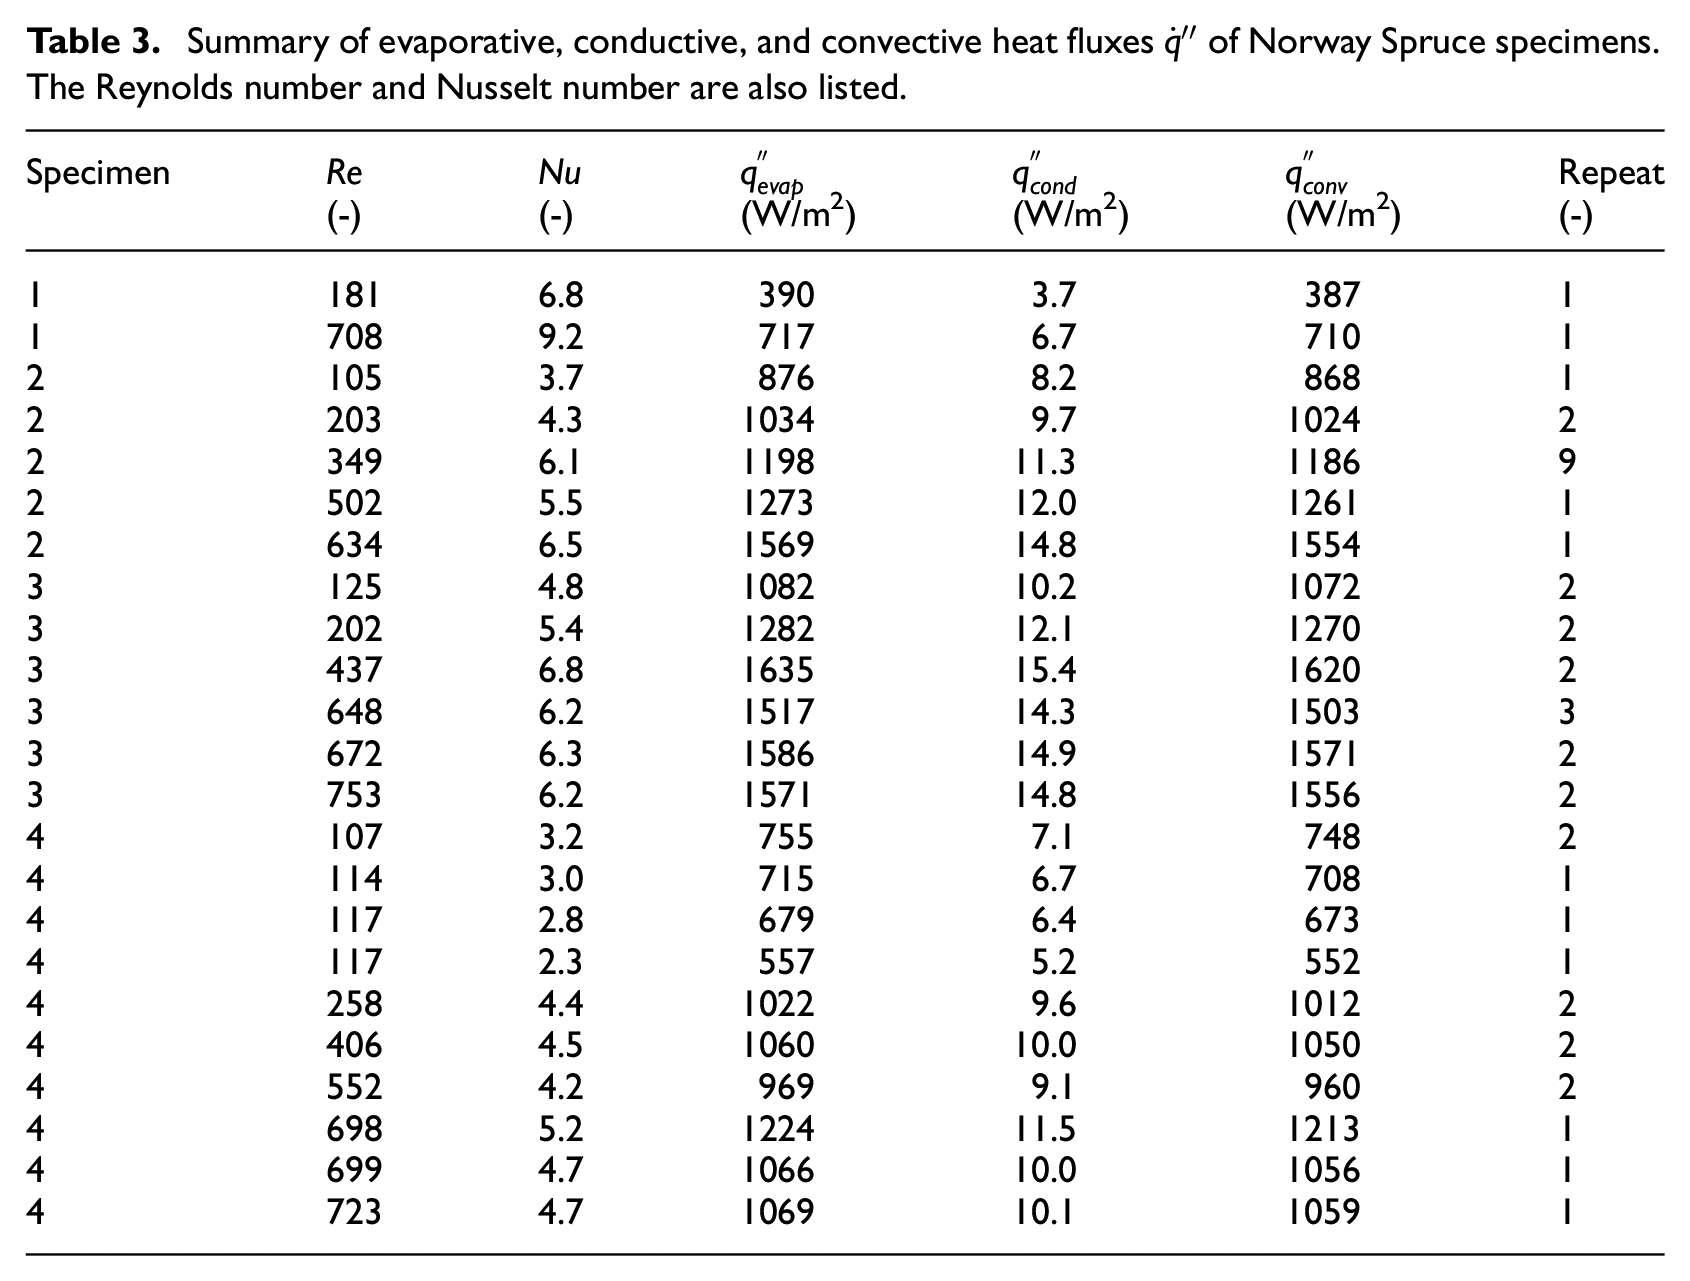
Figure 10 compares the Nusselt number data and best-fit curve for the Norway Spruce data to literature reports for conifers, pine needle beds, and a geometry commonly used to approximate conifers (cylinders). The error bars represent the expanded combined uncertainty, denoting a 95% confidence interval. The measured coefficients of the empirical Nusselt number–Reynolds number power–law relationship shown in Figure 10 are summarized in Table 4. For a similar Reynolds number, the Nusselt number of the Norway Spruce is lower than the Nusselt number of a cylinder, agreeing with the trends of previous studies10,12 as shown in Figure 10.
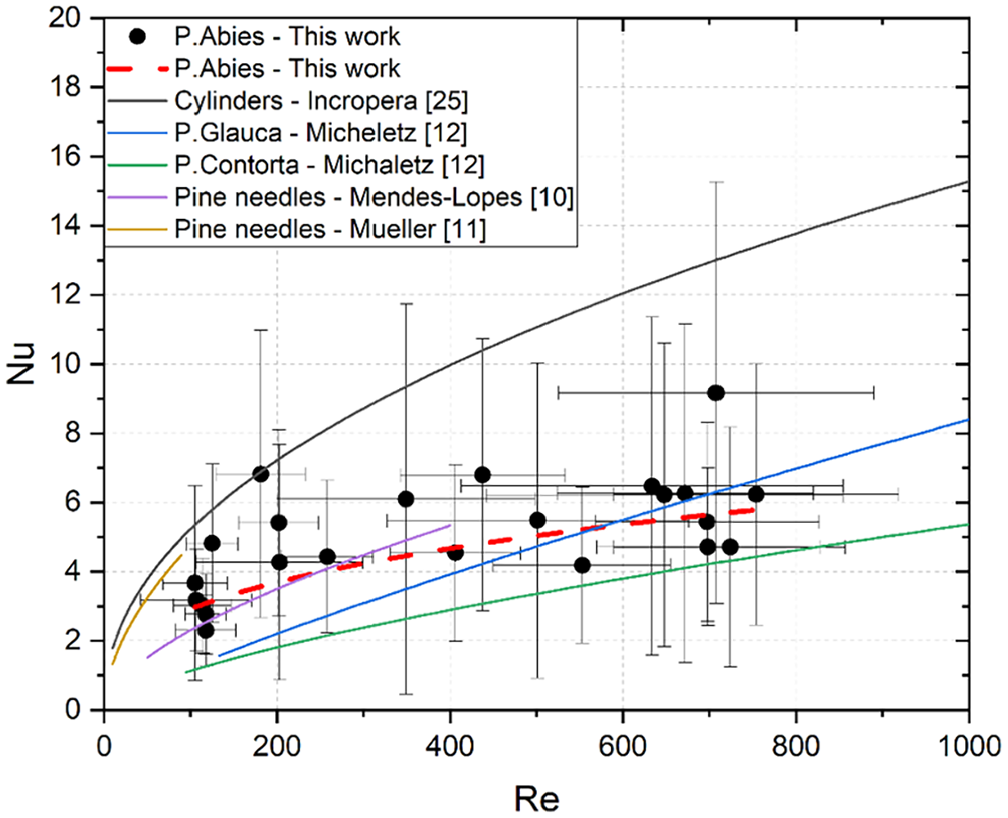
Comparison of the Nusselt number as a function of the Reynolds number in this work and the Nusselt number–Reynolds number power–law fits for conifers, pine needles beds, and a representative geometry (cylinders) from previous studies listed in Table 4. The error bars represent the expanded combined uncertainty, denoting a 95% confidence interval.
Summary of the normalization constant (
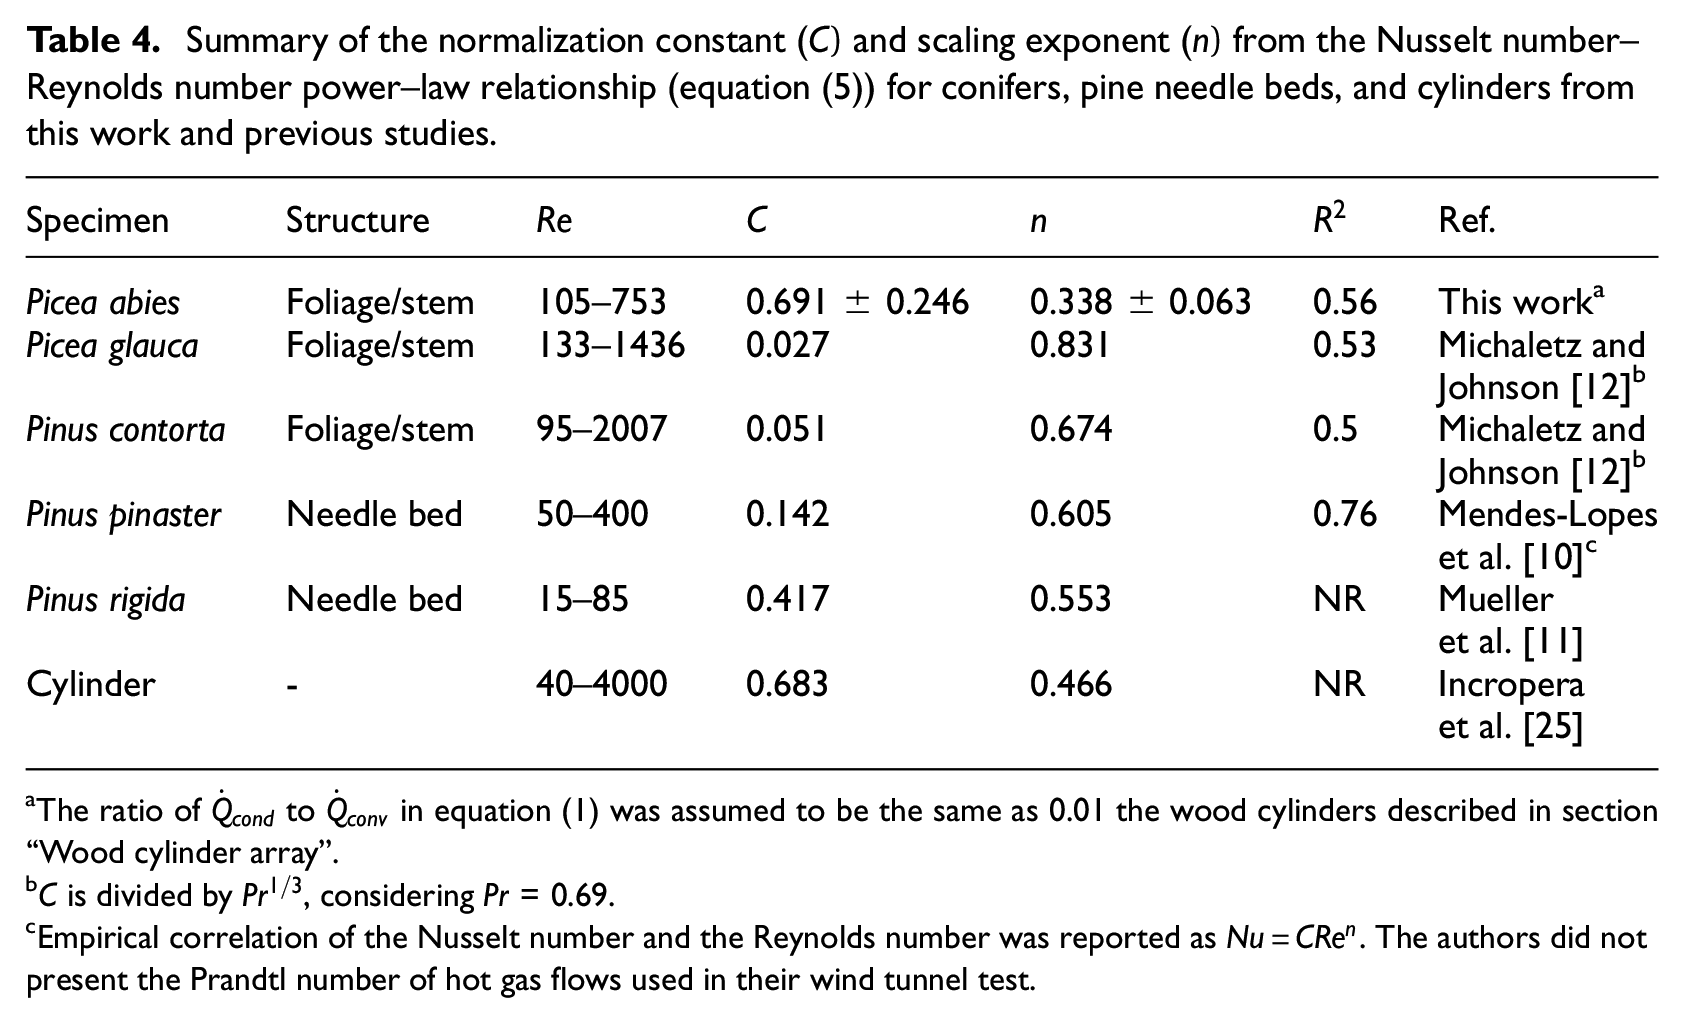
The ratio of
Empirical correlation of the Nusselt number and the Reynolds number was reported as
Vegetative components (foliage and stems) in the wind affect the convective flows about each other. Conifer foliage can significantly reduce the flow velocity around downstream stems and can affect boundary layer development, leading to increased convective resistance (1/
The Nusselt number slightly increased with increasing Reynolds number as seen in Figure 10. As the free-stream speed was increased, the Norway Spruce was compressed and its frontal area decreased, leading to a change in the effective bulk porosity of the specimen. The flow field about the specimen was complex, involving overlapping boundary layers and the mutual aerodynamic interference probably increased with the reduced projected frontal area. The relative change in the deformation of Norway Spruce may be smaller at higher Reynolds numbers, and the effect of the bulk porosity on the convective heat transfer may also decrease. The scaling exponent
This article provides an initial evaluation of this novel technique for evaluating convection in vegetation. It is possible that future improvements to the methodology might yield some reduction in the scatter and provide a clearer trend. However, the large error bars (and associated scatter) are primarily a function of the uncertainty in evaluating the plant geometry, as shown in Supplemental Material B. Real vegetation is structurally complex and it is difficult to measure and summarize the geometry with a single number, such as a characteristic length scale. Nevertheless, current fire models rely on this type of simplification, and the scatter represents the level of uncertainty involved. The best-fit curve is a first approximation of the effective convective heat transfer in Norway Spruce.
Summary and conclusion
A method to determine convective heat transfer in a vegetative specimen with a complex geometry was developed based on measuring the evaporation rate of water. A well-characterized wind tunnel was used to control the free-stream speed. The method was experimentally verified by determining the Nusselt number–Reynolds number power–law relationship for wood cylinders in a crossflow. The Nusselt number for the wood cylinder array agrees with the general empirical relationship for a cylinder in perpendicular flow. Convective heat transfer in the target vegetation was found to dominate conduction and storage terms. If there is a significant temperature difference between the vegetation and the surroundings, an additional term for radiation may be needed. However, the modeling analysis in Supplemental Material A indicates that the contribution is small, allowing it to be neglected here as a first approximation. The empirical Nusselt number correlation for Norway Spruce is:
This study was undertaken to provide a way to estimate convective heat transfer in vegetation. Further experiments are planned to investigate heat transfer differences among various conifers and the influence of various factors on the Nusselt number–Reynolds number power–law relationship, such as the bulk porosity and how it changes with the free-stream speed.
Supplemental Material
sj-docx-1-jfs-10.1177_07349041231202987 – Supplemental material for Forced convective heat transfer in vegetation by measuring liquid water evaporation
Supplemental material, sj-docx-1-jfs-10.1177_07349041231202987 for Forced convective heat transfer in vegetation by measuring liquid water evaporation by Kunhyuk Sung, Eric Mueller and Anthony Hamins in Journal of Fire Sciences
Footnotes
Acknowledgements
The authors thank Matthew Bundy, Marco Fernandez, and Randy McDermott of the National Institute of Standards and Technology (NIST) for providing constructive suggestions and helpful technical support regarding the experiments.
Declaration of conflicting interests
The author(s) declared no potential conflicts of interest with respect to the research, authorship, and/or publication of this article.
Funding
The author(s) received no financial support for the research, authorship, and/or publication of this article.
Supplemental material
Supplemental material for this article is available online.
Author biographies
References
Supplementary Material
Please find the following supplemental material available below.
For Open Access articles published under a Creative Commons License, all supplemental material carries the same license as the article it is associated with.
For non-Open Access articles published, all supplemental material carries a non-exclusive license, and permission requests for re-use of supplemental material or any part of supplemental material shall be sent directly to the copyright owner as specified in the copyright notice associated with the article.